Attached files
| file | filename |
|---|---|
| EXCEL - IDEA: XBRL DOCUMENT - CALIFORNIA FIRST NATIONAL BANCORP | Financial_Report.xls |
| EX-32 - EXHIBIT 32 - CALIFORNIA FIRST NATIONAL BANCORP | exh_32.htm |
| EX-31.2 - EXHIBIT 31.2 - CALIFORNIA FIRST NATIONAL BANCORP | exh_312.htm |
| EX-31.1 - EXHIBIT 31.1 - CALIFORNIA FIRST NATIONAL BANCORP | exh_311.htm |
UNITED STATES
SECURITIES AND EXCHANGE COMMISSION
Washington, D.C. 20549
FORM 10-K
(Mark One)
[X] ANNUAL REPORT PURSUANT TO SECTION 13 OR 15 (d) OF THE SECURITIES EXCHANGE ACT OF 1934
For the fiscal year ended June 30, 2014
[ ] TRANSITION REPORT PURSUANT TO SECTION 13 OR 15 (d) OF THE SECURITIES EXCHANGE ACT OF 1934
For the transition period from to
Commission File number 0-15641
CALIFORNIA FIRST NATIONAL BANCORP
(Exact name of registrant as specified in its charter)
|
California
(State or other jurisdiction of Incorporation or organization)
|
33-0964185
(I.R.S. Employer Identification No.)
|
28 Executive Park, Irvine, CA 92614
(Address of principal executive offices)
|
Registrant's telephone number, including area code:
|
(949) 255-0500
|
Securities registered pursuant to Section 12(b) of the Act:
|
Title of Each Class
Common Stock, $.01 par value
|
Name of Each Exchange on Which Registered
The NASDAQ Stock Market LLC
|
Securities registered pursuant to Section 12(g) of the Act: None
Indicate by check mark if the registrant is a well-known seasoned issuer, as defined in Rule 405 of the Securities Act
Yes o No þ
Indicate by check mark if the registrant is not required to file reports pursuant to Section 13 or Section 15(d) of the Act
Yes o No þ
Indicate by check mark whether the Registrant: (1) has filed all reports required to be filed by Section 13 or 15(d) of the Securities and Exchange Act of 1934 during the preceding 12 months (or for such shorter period that the Registrant was required to file such reports), and (2) has been subject to such filing requirements for the past 90 days. Yes þ No o
Indicate by check mark whether the registrant has submitted electronically and posted on its corporate Web site, if any, every Interactive Data File required to be submitted and posted pursuant to Rule 405 of Regulation S-T (§232.405 of this chapter) during the preceding 12 months (or for such shorter period that the registrant was required to submit and post such files). Yes þ No o
Indicate by check mark if disclosure of delinquent filers pursuant to Item 405 of Regulation S-K is not contained herein, and will not be contained, to the best of Registrant's knowledge, in definitive proxy or information statements incorporated by reference in Part III of this Form 10-K or any amendment to this Form 10-K. o
Indicate by check mark whether the registrant is a large accelerated filer, an accelerated filer, a non-accelerated filer, or a smaller reporting company. See the definitions of “accelerated filer, large accelerated filer and smaller reporting company” in Rule 12b-2 of the Exchange Act. (Check one):
| Large accelerated filer o | Accelerated filer o | Non-accelerated filer o | Smaller reporting company þ |
Indicate by check mark whether the registrant is a shell company (as defined in Rule 12b-2 of the Act). Yes o No þ
The aggregate market value of the Common Stock held by non-affiliates of the Registrant as of December 31, 2013 was $35,357,556. Number of shares outstanding as of September 12, 2014: Common Stock 10,459,924.
DOCUMENTS INCORPORATED BY REFERENCE
Part III incorporates information by reference from Registrant's definitive Proxy Statement to be filed with the Commission within 120 days after the close of the Registrant's fiscal year ended June 30, 2014.
California First National Bancorp and Subsidiaries
TABLE OF CONTENTS
|
PART I
|
Page
|
|
|
PART II
|
||
|
PART III
|
||
|
PART IV
|
||
|
|
1
California First National Bancorp and Subsidiaries
PART I
ITEM 1. BUSINESS
California First National Bancorp, a California corporation (the “Company”), is a bank holding company headquartered in Orange County, California with a bank subsidiary, California First National Bank (“CalFirst Bank” or the “Bank”) and leasing subsidiary, California First Leasing Corp (“CalFirst Leasing”). The primary business of the Company is leasing and financing capital assets, while CalFirst Bank also participates in the syndicated commercial loan market, provides business loans to fund the purchase of assets leased by third parties, and offers commercial loans directly to businesses. CalFirst Bank gathers deposits from a centralized location primarily through posting rates on the Internet. All banking and other operations are conducted from one central location. At June 30, 2014, the Company had total assets of $579.6 million, leases and loans of $455.8 million, total deposits of $355.8 million, and a very conservative capital profile with stockholders’ equity of $183.7 million supporting regulatory capital ratios at June 30, 2014 of 31.8% Tier 1 capital, 32.8% total capital and 32.8% Tier 1 leverage capital, well above required regulatory thresholds.
Forward-Looking Statements
This Form 10-K contains forward-looking statements. Forward-looking statements include, among other things, information concerning our possible future consolidated results of operations, business and growth strategies, financing plans, our competitive position and the effects of competition. Forward-looking statements include all statements that are not historical facts and can be identified by forward-looking words such as “anticipate”, “believe”, “could”, “estimate”, “expect”, “intend”, “plan”, “may”, “should”, “will”, “would”, “project” and similar expressions. These forward-looking statements are based on information currently available to us and are subject to inherent risks and uncertainties, and certain factors could cause actual results to differ materially from those anticipated. Some of the risks and uncertainties that may cause our actual results or performance to differ materially from such forward-looking statements are included in “Item 1A. Risk Factors” of this report. All forward-looking statements are qualified in their entirety by this cautionary statement and the Company undertakes no obligation to revise or update any forward-looking statements to reflect events or circumstances arising after the date on which they were made.
Leasing Activities
At June 30, 2014, leases accounted for 72% of the Company’s net investment in leases and loans. The Company leases and finances most capital assets used by businesses and organizations, with a focus on high technology systems and other mission critical assets. The leases are structured individually and can accommodate a variety of our customers’ objectives. In addition to computer systems and networks, property leased includes automated manufacturing and distribution management systems, production systems, printing presses and warehouse distribution systems. Telecommunications systems include digital private branch equipment and switching equipment as well as voice over Internet protocol (“VoIP”) systems, wireless networks and satellite tracking systems. Retail point-of-sale and inventory tracking systems often integrate computers, scanners and software. Other electronic equipment leased includes robotic surgical systems, ultrasound and medical imaging systems, computer-based patient monitoring systems, testing equipment, and copying equipment. In addition, the Company leases a wide variety of non-high technology property, including office equipment, mining equipment, machine tools, school buses, trucks, exercise equipment and office and dormitory furniture. Of the leases booked in fiscal 2014, approximately 41% involved computer equipment and software, 14% furniture and fixtures, 12% transportation equipment, 11% manufacturing and distribution equipment, 8% medical equipment, and 5% yellow equipment.
2
California First National Bancorp and Subsidiaries
CalFirst Bank and CalFirst Leasing provide leasing and financing to customers throughout the United States and across a breadth of industries and disciplines, including commercial, industrial and financial companies, as well as educational, government and non-profit entities. The average size of the lease transactions booked during fiscal 2014 was approximately $935,000, compared with $844,000 during fiscal 2013 and $560,000 during fiscal 2012. One customer accounted for 13% of the property cost subject to leases booked during fiscal 2014, while in fiscal 2013 two customers accounted for 11% and 8% and in fiscal 2012 two other customers accounted for 7% and 5% of leases booked in that year. Leases primarily are originated directly through a centralized marketing program and direct delivery channels, or through other banks or origination sources. During fiscal 2014, 89% of property cost subject to leases booked was originated directly by the Company, compared to 79% originated directly in fiscal 2013 and 2012. The marketing program includes a confidential database of current and potential users of business property, a training program to introduce new marketing employees to leasing, and in-house computer and telecommunication systems. The marketing programs have been augmented through the expanded use of web sites and the Internet to identify and communicate with potential customers. Prospect management software is utilized to enhance the productivity of the sales effort. Specific information about potential customers is entered into a confidential database accessible to sales professionals and their managers that allows them to efficiently focus on the most likely purchaser or lessee of capital assets. The prospect management system and an integrated in-house telecommunications system permit sales management to monitor account executive activity, daily prospect status and pricing information. The ability to monitor account activity and offer immediate assistance in negotiating or pricing a transaction makes it possible to be responsive to customers and prospects.
Leases generally are for initial terms ranging from two to five years. Substantially all leases are non-cancelable "net" leases which contain "hell-or-high-water" provisions under which the lessee must make all lease payments regardless of any defects in the property, and which require the lessee to maintain and service the property, insure the property against casualty loss and pay all property, sales and other taxes. CalFirst Bank or CalFirst Leasing retain ownership of the property on leases they originate, and in the event of default by the lessee, they may declare the lessee in default, accelerate all lease payments due under the lease and pursue other available remedies, including repossession of the property. Upon the expiration of the lease term, the lessee typically has an option, which is dependent upon each lease's defined end of term options, to either purchase the property at a negotiated price, or in the case of a "conditional sales contract," at a predetermined minimum price, or to renew the lease. If the original lessee does not exercise the purchase option, once the leased property is returned, CalFirst Bank or CalFirst Leasing will seek to sell the leased property.
Through its lease purchase operations, CalFirst Bank purchases lease receivables on a non-recourse basis from other intermediaries. All banks or lessors from whom the Bank purchases lease receivables are subject to an individual credit review and investigation by the Bank and must be approved by the Bank’s board of directors prior to establishing a discounting relationship. The Bank generally does not assume any obligations as lessor for these transactions, and the original lessor retains ownership of any underlying asset, with the Bank taking a priority first lien position. Periodically, the Bank will purchase a whole lease and assume the role as lessor and take a residual interest in the property subject to such lease. The Bank verifies the completeness of all lease documentation prior to purchase, to confirm that all documentation is correct and secure, that liens have been perfected, and legal documentation has been filed as appropriate. Leases purchased from unaffiliated third parties during fiscal 2014 aggregated to $19.6 million, or 11% of total leases booked. In fiscal 2013, purchased leases of $50.2 million represented 21% of total bookings while fiscal 2012 purchased leases of $36.1 million also represented 21% of total bookings.
The Company conducts the leasing business in a manner designed to minimize risk, however, we are subject to risks through the investment in lease receivables held in our own portfolios, lease transactions-in-process, and residual investments. We do not purchase leased property until we have received a binding non-cancelable lease from the customer. A portion of lease originations are discounted to banks or finance companies on a non-recourse basis at fixed interest rates that reflect the customers' financial condition. The lender to which a lease has been assigned has no recourse against the Company, unless we are in default under the terms of the agreement by which the lease was assigned. The institution to which a lease has been assigned may take title to the leased property, but only in the event the lessee fails to make lease payments or otherwise defaults under the terms of the lease. If this occurs, the Company may not realize our residual investment, if any, in the leased property.
3
California First National Bancorp and Subsidiaries
Lease Portfolio
During the fiscal years ended June 30, 2014, 92.7% of the total dollar amount of new leases completed by the Company were booked by CalFirst Bank, up from 86.0% in fiscal 2013 and 71.5% in 2012. Of the new leases booked by CalFirst Leasing in fiscal 2014, 3% were assigned to CalFirst Bank, while 23% of new leases booked by CalFirst Leasing in fiscal 2013 were assigned to CalFirst Bank and 48% in fiscal 2012. Pursuant to bank regulations, CalFirst Bank can purchase no more than 50% of the extensions of credit originated by CalFirst Leasing during the preceding 12 calendar months.
During the fiscal years ended June 30, 2014, 2013 and 2012, 97%, 98% and 95%, respectively, of the total dollar amount of new leases completed by the Company were retained in the Company’s portfolios, with the balance of such leases discounted to unaffiliated financial institutions. The Company applies a portfolio management system intended to develop portfolios with different risk/reward profiles. Each lease transaction held must meet or exceed certain credit or profitability requirements established, on a case-by-case basis, by the credit committee for the portfolio. The Bank’s strategy is to develop a conservative, diversified portfolio of leases with high credit quality lessees. The Bank’s credit committee has established underwriting standards and criteria for the lease portfolio and performs an independent credit analysis and due diligence on each lease transaction originated or purchased. The committee applies the same underwriting standards to all leases, regardless of how they are sourced. Through the use of non-recourse financing, the Company avoids risks that do not meet our risk/reward requirements. Certain portfolios hold leases where the credit profile of the lessee or the value of the underlying leased property is not acceptable to other financial institutions.
The table below presents the discounted minimum lease payments receivable (“Net Lease Receivable") related to leases retained in the Company’s portfolios at June 30, 2014, 2013 and 2012, respectively. Of the Bank’s Net Lease Receivable, approximately 74%, 60% and 48%, respectively, represented leases originated directly by the Bank, with 21%, 26% and 28%, of the Bank’s Net Lease Receivables at June 30, 2014, 2013 and 2012, respectively, related to leases purchased from unaffiliated parties.
|
(dollars in thousands)
|
Years ended June 30,
|
|||||||||||||||||||||||
|
2014
|
2013
|
2012
|
||||||||||||||||||||||
|
Net Lease
Receivable |
Percent of
Total |
Net Lease
Receivable |
Percent of
Total |
Net Lease
Receivable |
Percent of
Total |
|||||||||||||||||||
|
California First National Bank
|
$ | 288,331 | 91 | % | $ | 299,863 | 91 | % | $ | 205,229 | 86 | % | ||||||||||||
|
California First Leasing
|
$ | 27,343 | 9 | % | $ | 30,933 | 9 | % | $ | 33,598 | 14 | % | ||||||||||||
The Company often makes payments to purchase leased property prior to the commencement of the lease. The disbursements for such lease transactions-in-process are generally made to facilitate the property implementation schedule of the lessees. The lessee generally is contractually obligated to make rental payments during the period that the transaction is in process, and obligated to reimburse us for all disbursements under certain circumstances. Income is not recognized while a transaction is in process and prior to the commencement of the lease. At June 30, 2014, 2013, and 2012, the Company’s total investment in property acquired for transactions-in-process amounted to $40.6 million, $11.9 million and $18.5 million, respectively. Of such amounts, approximately 77%, 97% and 66%, respectively, for each respective year related to CalFirst Bank, with the balance held by CalFirst Leasing.
Commercial Loans
Commercial loans of $129.2 million accounted for 28% of the Company’s net investment in leases and loans at June 30, 2014, an increase from $74.0 million, or 18% of the Company’s investment, at June 30, 2013 and $82.9 million, or 25% of the Company’s investment, at June 30, 2012. During fiscal 2014 the Company boarded $73.3 million new commercial loans with payoffs and principal reductions of $18.1 million. During fiscal 2013, the Company boarded $50.0 million in new commercial loans but experienced payoffs and principal reductions of approximately $59.0 million.
4
California First National Bancorp and Subsidiaries
The commercial loan portfolio consists primarily of participations in syndicated transactions led by other financial institutions, with approximately 14% of the loan portfolio at June 30, 2014 the result of a direct origination effort. Direct loan origination is directed primarily toward the Company’s existing and targeted customer database. These commercial loans are a complementary product leveraging existing resources and extending customer longevity. Commercial loan products originated directly include lines of credit, term loans and commercial mortgages, and generally will be secured by a first priority filing on the customer’s assets, including accounts receivable and inventory, capital equipment or commercial real estate, but unsecured loans or lines of credit will be considered, depending on the nature of the credit. There are three direct commercial loans aggregating to $17.9 million as of June 30, 2014, all at fixed rates, ranging in size from $2.3 million to $10.0 million, and with remaining terms of 45 to 59 months.
Syndicated bank loans have structures ranging from working capital loans secured by accounts receivable and inventories, term loans secured by all assets to leveraged loans supported by operating cash flow and enterprise valuation. Loans are priced at variable rates, and generally are made to larger corporations with debt ratings of BB or Ba, or higher, as rated by Standard & Poor’s or Moody’s Investors Service, respectively; however, $9.6 million, or approximately 8.5% of the syndicated loan portfolio, relates to companies that are rated lower or are unrated. Credits that the Company characterizes as highly leveraged accounted for approximately 22% of the syndicated loan portfolio at June 30, 2014, up from 20% at June 30, 2013 and 2012. All syndicated loan transactions are participations through major money-center banking institutions and are diversified across industries, with the loan commitments ranging in size from $1.0 million to $10.0 million. At June 30, 2014, the average principal outstanding was $5.2 million, and the remaining terms ranged from two to seven years.
The Bank’s underwriting of commercial loans has been maintained in accordance with its existing credit standards, although its policies have been augmented to address credit issues related to the larger average investment in individual loans and regulatory issues governing the leveraged loan and participation market. In March 2013, federal banking regulators issued new guidance with respect to leveraged lending that has been incorporated into the Bank’s policies. The risks associated with loans in which the Bank participates as part of a syndicate of financial institutions are similar to those of directly originated commercial loans; however, additional risks may arise from the Bank’s limited ability to control actions of the syndicate. Existing staff administer loan operations including documentation, lien perfection, funding, payments and collections. The Bank’s current computer systems are capable of fully processing loans and have the requisite connectivity to the Company’s accounting, customer service and collections processes.
Commercial loan transactions funded during fiscal 2014 of $73.3 million included $10.0 million originated directly with the remaining $63.3 million acquired through participations. This compared to $50.0 million of commercial loan transactions funded during fiscal 2013, of which $20.8 million were originated directly and $29.2 million purchased under syndication. Yields earned on commercial loans tend to be lower than yields earned on lease transactions, but the average life or duration of the investment is expected to be longer and such yields will vary more with changes in market interest rates.
Credit Risk Management
The Company’s strategy for credit risk management includes stringent credit authority centered at the most senior levels of management. The strategy emphasizes diversification on both a geographic and customer level, and spreading risk across a breadth of leases and loans while managing the risk to any one area. The consolidated lease and loan portfolio at June 30, 2014 includes over 850 lease schedules and 38 commercial loans. No customer accounted for more than 5% of the net investment in leases and loans at June 30, 2014 and June 30, 2012, but one customer represented slightly more than 5% of the consolidated portfolio at June 30, 2013. The ten largest customers accounted for 24% of the lease and loan portfolio at June 30, 2014, compared to 28% of the portfolio at June 30, 2013 and 21% at June 30, 2012.
As a national bank, CalFirst Bank is subject to lending limit rules that restrict the maximum credit that the Bank may extend to any one entity at any one time to 15% of unimpaired capital and surplus. At June 30, 2014, the Bank’s “legal lending” limit was $16.2 million. The Company and CalFirst Leasing are not subject to any regulatory limits. At June 30, 2014, the largest single exposure to one credit was $19.2 million, shared by CalFirst Bank and CalFirst Leasing.
5
California First National Bancorp and Subsidiaries
The credit policy requires each lease or loan, regardless of whether it is directly originated or acquired through syndication, to have viable repayment sources. The credit process primarily focuses on a customer’s ability to repay the lease or loan through their cash flow, and generally, collateral securing a transaction represents a secondary source of repayment. The credit process includes a policy of classifying all leases and loans in accordance with a risk rating classification system, monitoring changes in the risk ratings of lessees and borrowers, identification of problem leases and loans and special procedures for the collection of problem leases and loans. The lease and loan classification system is consistent with regulatory models under which leases and loans may be rated as “pass”, “special mention”, “substandard”, “doubtful” or “loss”.
An Asset Management (“AM”) group handles the day-to-day management and oversight of the lease portfolios. The AM group monitors the performance of all leases held in the portfolios, transactions-in-process as well as lease transactions assigned to lenders, if the Company retains a residual investment in the leased property subject to the lease. The AM group conducts an ongoing review of all leases 10 or more days delinquent, contacts the lessee directly and generally sends the lessee a notice of non-payment within 15 days after the due date. In the event that payment is not then received, senior management becomes involved. Delinquent leases are coded in the AM tracking system in order to provide management visibility, periodic reporting, and appropriate reserves. Legal recourse is considered and promptly undertaken if alternative resolutions are not obtained. At 90 days past due, leases and loans will be placed on non-accrual status such that interest income no longer accretes into income, unless the Company believes the amounts due are otherwise recoverable.
Allowance for Credit Losses
The allowance for credit losses is an estimate of probable and assessable losses in the Company’s lease and loan portfolios applying the principles of Financial Accounting Standards Board (“FASB”) Accounting Standards Codification (“ASC”) Topic 450, “Contingencies,” and ASC Topic 310-35, “Loan Impairment.” The allowance recorded is based on a quarterly review of all leases and loans outstanding and transactions-in-process. The determination of the appropriate amount of any provision is based on management’s judgment at that time and takes into consideration all known relevant internal and external factors that may affect the lease and loan portfolios. The primary responsibility for setting reserves resides with executive management who report quarterly to the Company’s Audit Committee and Board of Directors regarding overall asset quality, problem leases and loans and the adequacy of valuation allowances. The Bank's classification of its assets and the amount of its valuation allowances are subject to review by regulators who can order the establishment of additional loss allowances.
The Company individually analyzes the net book value of each non-performing or problem lease and loan to determine whether the carrying value is less than or equal to the expected recovery anticipated to be derived from lease or loan payments, additional collateral or residual realization. The amount estimated as unrecoverable is recognized as a reserve specifically identified for the lease or impaired loan. An analysis of the remaining portfolios is conducted, taking into account recent loss experience, known and inherent risks in the portfolio, levels of delinquencies, adverse situations that may affect the customer’s ability to repay, trends in volume and other factors, including regulatory guidance and current and anticipated economic conditions in the market. This portfolio analysis includes a stratification of the lease and loan portfolio by risk classification and segments, and estimation of potential losses based on risk classification or segment. The composition of the portfolio based on risk ratings is monitored, and changes in the overall risk profile of the portfolio also is factored into the evaluation of inherent risks in the portfolios. Regardless of the extent of the Company's analysis of customer performance or portfolio evaluation, certain inherent but undetected losses are probable within the lease and loan portfolios. This is due to several factors including inherent delays in obtaining information regarding a customer’s financial condition or change in business conditions; the judgmental nature of individual credit evaluations and classification, and the interpretation of economic trends; volatility of economic or customer-specific conditions affecting the identification and estimation of losses and the sensitivity of assumptions utilized to establish allowances for losses, among other factors. Therefore, an estimated inherent loss not based directly on the specific problem assets is recorded as an unallocated allowance. The level of such unallocated allowance is determined based on a review of prior years’ loss experience, and may vary depending on general market conditions. The aggregate allowance in any one period is apportioned between allowance for doubtful accounts and allowance for valuation of residual value.
6
California First National Bancorp and Subsidiaries
Banking Operations
The Bank is focused on gathering deposits from depositors nationwide for the primary purpose of funding its investment in leases and loans. The Bank’s strategy is to be a low cost producer through marketing its products and services directly to end-users. The Bank believes that its operating costs generally will be lower than those of traditional "bricks and mortar" banks because it does not have the expense of a traditional branch network to generate deposits and conduct operations.
Deposit Products
At June 30, 2014, the Bank had $355.8 million in deposits, of which $65.6 million were demand and savings accounts and $290.2 million, or 82%, were time deposits. The Bank’s deposits have been gathered primarily through the Internet. The Bank offers interest-bearing checking accounts, money market accounts, savings accounts and three (3) month to three (3) year certificates of deposit (“CDs”) to taxable and IRA depositors. CDs are offered with varying maturities in order to achieve a fair approximation or match of the average life of the Bank’s lease and loan portfolio. With leases generally providing for fixed rental rates, a matching fixed rate CD book is intended to allow the Bank to minimize interest rate fluctuation risk. Most of the Bank’s commercial loans are floating rate.
To open a new account, a customer can complete an on-line enrollment form on the Bank’s web site, or can call the Bank’s toll-free customer service number and open an account telephonically. Signature cards and deposits are then mailed to the Bank. Customers can make deposits by wire transfer, via direct deposit programs, or by mail. No teller line is maintained. The Bank’s customers have 24-hour access to account information. Customers can view their banking records and current balances, and transfer funds between accounts through the use of personal computers. They can also pay bills on-line. Customers can receive a free ATM card upon opening a deposit or savings account. In order to obtain cash, the Bank’s customers use other banks’ automated teller machines that are affiliated with the Plusä system. The Bank generally will reimburse customers for some portion of any ATM fees charged by other financial institutions. The Bank believes that any inconvenience resulting from the Bank not maintaining automated teller machines or a local branch office will be offset by the Bank’s higher investment yields and lower banking fees.
As part of the Bank’s entry into broader services for commercial customers, CalFirst Bank can provide on-line cash management services for commercial customers. Leveraging on its existing Internet banking platform, through the Bank’s remote deposit capture system customers provided with a desktop scanner can scan items for deposit and electronically send images of the items securely to the Bank’s electronic banking system. These systems are attractive to commercial customers who are able to perform more banking functions on-site, avoid courier and other costs and enhance cash flow through faster access to payments received.
Operations
The Bank’s operations have been developed by outsourcing certain principal functions to leading bank industry service providers and by sharing established systems utilized by CalFirst Leasing or the Company. Outsourced systems include the Bank’s core processing and electronic banking system, electronic bill payment systems and depositary services, including item processing. The Bank believes it benefits from the service provider's expertise and investments in developing technology. A critical element to the Bank’s success is the ability to provide secure transmission of confidential information over the Internet. The Bank’s service providers utilize sophisticated technology to provide maximum security. All banking transactions are encrypted and all transactions are routed from the Internet server through a "firewall" that limits access to the Bank’s and service provider’s systems. Systems are in place to detect attempts by third parties to access other users' accounts and feature a high degree of physical security, secure modem access, service continuity and transaction monitoring. The Bank has implemented the two-factor authentication security to its Internet banking procedures and platform.
CalFirst Leasing provides certain services to the Bank pursuant to formal agreements, including servicing the Bank’s lease portfolio on the Bank’s behalf.
7
California First National Bancorp and Subsidiaries
Investments
In addition to leases and loans, the Company had total cash and cash equivalents and investment securities of $69.4 million at June 30, 2014 compared to $123.6 million at June 30, 2013 and $123.7 million at June 30, 2012. The investment portfolio consists of interest-earning deposits with banks and short-term money market securities, as well as corporate bonds, U.S. Treasury Notes, Federal Reserve Bank and Federal Home Loan Bank stock and other investments. The Company is authorized to invest in high-quality United States agency obligations, mortgage backed securities, investment grade corporate bonds and municipal securities and selected preferred and equity securities. The investment portfolio may increase or decrease depending upon the comparative returns on investments in relation to leases and loans.
Customers
Leasing and loan customers include major corporations and middle-market companies, subsidiaries and divisions of Fortune 1000 companies, private and state-related educational institutions, municipalities and other not-for-profit organizations and institutions located throughout the United States. The Company does not believe the loss of any one customer would have a material adverse effect on its operations taken as a whole.
The Bank’s deposit customers are primarily individuals from across the nation who place a substantial portion of their savings in safe, government-insured deposits and businesses that spread their liquid investments among a breadth of banks in order to ensure that they are government insured. Such depositors are seeking to maximize their interest income and, therefore, are more inclined to move their investments to a bank that offers the highest yield regardless of the geographic location of the depository.
Competition
The Company competes for the lease and loan financing of capital assets with other banks, commercial finance companies, and other financial institutions, independent leasing companies, credit companies affiliated with equipment manufacturers, and equipment brokers and dealers. Many of the Company's competitors have substantially greater resources, capital, and more extensive and diversified operations than the Company. The Company believes that the principal competitive factors are rate, responsiveness to customer needs, flexibility in structuring lease financing and loans, financial technical proficiency and the offering of a broad range of financing options. The level of competition varies depending upon market and economic conditions, the interest rate environment, and availability of capital.
The Bank competes with other banks and financial institutions to attract deposits. The Bank faces competition from established local and regional banks and savings and loan institutions. Many of them have larger customer bases, greater name recognition and brand awareness, greater financial and other resources, broader product offerings and longer operating histories. The market for Internet banking has seen increased competition over the past several years as large national banks have deployed and aggressively promoted their own on-line banking platforms. Additionally, new competitors and competitive factors are likely to emerge with the continued development of Internet banking.
Supervision and Regulation
The Company is a bank holding company within the meaning of the Bank Holding Company Act of 1956, as amended, and is registered with, regulated and examined by the Board of Governors of the Federal Reserve System (the “FRB”). In addition to the regulation of the Company by the FRB, the Bank is subject to extensive regulation and periodic examination, principally by the Office of the Comptroller of the Currency (“OCC”). The Federal Deposit Insurance Corporation (“FDIC”) insures the Bank’s deposits up to certain prescribed limits and the Bank is a member bank within the San Francisco Federal Reserve district. The Company is also subject to jurisdiction of the Securities and Exchange Commission ("SEC") and to the disclosure and regulatory requirements of the Securities Act of 1933 and the Securities Exchange Act of 1934, and through the listing of the common stock on the NASDAQ Global Select Market is subject to the rules of NASDAQ.
8
California First National Bancorp and Subsidiaries
The Bank Holding Company Act, the Federal Reserve Act, and the Federal Deposit Insurance Act subject the Company and the Bank to a number of laws and regulations. In addition, substantial changes to the regulation of banks and bank holding companies have occurred as a result of the enactment in 2010 of the Dodd-Frank Wall Street Reform and Consumer Protection Act (the “Dodd-Frank Act”). The primary concern of banking regulation is “Safety and Soundness” with an emphasis on asset quality and capital adequacy. These laws and regulations also encompass a broad range of other regulatory concerns including insider transactions, the adequacy of the allowance for credit losses, inter-company transactions, regulatory reporting, adequacy of systems of internal controls and limitations on permissible activities. The federal banking agencies possess broad powers to take corrective action as deemed appropriate for an insured depository institution and its holding company. The FRB examines the Company, which exam includes CalFirst Leasing. The OCC, which has primary supervisory authority over the Bank, regularly examines banks in such areas as asset quality, reserves, investments, risk management practices, interest rate exposure, vendor management and other aspects of operations. These examinations are designed for the protection of the Bank’s depositors rather than the Company’s shareholders. The Bank must furnish annual and quarterly reports to the OCC, which has the authority under the Financial Institutions Supervisory Act to prevent a national bank from engaging in an unsafe or unsound practice in conducting its business. The OCC may impose restrictions or new requirements on the Bank, including, but not limited to, growth limitations, dividend restrictions, individual increased regulatory capital requirements, lease and loan loss reserve requirements, increased supervisory assessments, activity limitations or other restrictions that could have an adverse effect on the Bank, the Company or holders of our common stock. Many banking laws and regulations have undergone significant change in recent years and, given the recent financial crisis in the United States, regulators have increased their oversight of financial institutions and taken a more active role in imposing restrictions on bank operations, the classification of assets and determination of the allowance for credit losses. Future changes to these laws and regulations, and other new financial services laws and regulations are likely, and cannot be predicted with certainty.
Under FRB policy, the Company is expected to serve as a source of financial and managerial strength to the Bank and, under appropriate circumstances, to commit resources to support the Bank. Certain loans by the Company to the Bank would be subordinate in right of payment to deposits in, and certain other indebtedness of, the Bank.
Among the regulations that affect the Company and the Bank are provisions of Section 23A of the Federal Reserve Act that places limits on the amount of loans or extensions of credit the Bank may make to affiliates and the amount of assets purchased from affiliates, except for transactions exempted by the FRB. The aggregate of all of the above transactions is limited in amount, as to any one affiliate, to 10% of a bank’s capital and surplus and, as to all affiliates combined, to 20% of a bank's capital and surplus. Regulation W (“Reg. W”) provides a framework under Section 23A by which the Bank does not have to comply with the quantitative limits of Section 23A when making a loan or extension of credit to an affiliate, but also contains certain provisions designed to prohibit the Bank from buying low-quality assets from an affiliate. The Company and the Bank are also subject to the provisions of Section 23B of the Federal Reserve Act which, among other things, prohibits an institution from engaging in transactions with affiliates unless the transactions are on terms substantially the same, or at least as favorable to the institution as those prevailing at the time for comparable transactions with non-affiliated companies. All transactions between the Company or CalFirst Leasing and the Bank are in accordance with these provisions.
In connection with the approval of the Company’s purchase of the stock of the Bank, the FRB and the OCC required the Company and the Bank to make certain commitments with respect to the operation of the Bank. The commitments as modified include: (i) a binding written agreement between the Bank and the Company setting forth the Company’s obligations to provide capital maintenance and liquidity support to the Bank, if and when necessary; (ii) the Bank must obtain prior approval from the OCC before implementing any significant deviation or change from its original operating plan; and (iii) the Company must comply with Reg. W.
9
California First National Bancorp and Subsidiaries
In September 2006, the OCC approved a change in the Bank’s original operating plan that provided for the Bank to originate commercial loans. In October 2010, the OCC advised the Bank that the scope and volume of its commercial loan business exceeded the forecast provided in July 2006 and therefore was a deviation from the Bank's business plan approved in September 2006. While the Bank did not agree that it deviated significantly from forecasts and documents submitted to the OCC, the Bank submitted an updated plan and request for no objection to its continued development of the commercial loan portfolio. In June 2012, the OCC provided a written determination of no objection to the Bank's revised business plan with certain conditions that require the Bank to maintain a Tier 1 capital ratio of not less than 14% through June 30, 2015 and limit the growth in the commercial loan portfolio within certain guidelines. The Bank is in compliance with these conditions as of June 30, 2014, and is in the process of working to remove the restrictions.
Bank holding companies are subject to risk-based capital guidelines adopted by the FRB. The Company currently is required to maintain (i) Tier 1 capital equal to at least six percent of its risk-weighted assets and (ii) total capital (the sum of Tier 1 and Tier 2 capital) equal to ten percent of risk-weighted assets. The FRB also requires the Company to maintain a minimum Tier 1 "leverage ratio" (measuring Tier 1 capital as a percentage of adjusted total assets) of at least five percent. At June 30, 2014 and 2013, the Company exceeded all these requirements.
The Bank is also subject to risk-based and leverage capital requirements mandated by the OCC. In July 2013, Federal bank regulatory agencies jointly issued final rules that revise the general risk-based capital requirements to incorporate certain revisions by the Basel Committee on Banking Supervision to the Basel capital framework (“Basel III”). Under the final rule, minimum requirements increase both the quantity and quality of capital held by banking organizations. Consistent with Basel III, the rule includes a new minimum ratio of common equity tier 1 capital to risk-weighted assets of 4.5 percent and a common equity tier 1 capital conservation buffer of 2.5 percent of risk-weighted assets. The rule also raises the minimum ratio of tier 1 capital to risk-weighted assets from 4 percent to 6 percent and includes a minimum leverage ratio of 4 percent for all banking organizations. The final rule minimizes the burden on smaller, less complex financial institutions such as the Company and the Bank, with a phase-in period that will not begin until January 2015 while the phase-in period for larger institutions began in January 2014. The Company does not expect the new rules to impact its operations as at June 30, 2014, the Bank had capital in excess of all current minimum risk-based and leverage capital requirements as well as the new guidelines.
Under the Community Reinvestment Act (“CRA”), the Bank has a continuing and affirmative obligation, consistent with safe and sound operation, to help meet the credit needs of its entire communities, including low- and moderate-income neighborhoods. CalFirst Bank is designated as a wholesale institution for CRA purposes. To evaluate the CRA performance of banks with this designation, regulatory agencies use the community development test. This includes an assessment of the level and nature of the Bank’s community development lending, investments and services. The CRA requires the OCC, in connection with its examination of the Bank, to assess and assign one of four ratings to the Bank’s record of meeting the credit needs of its community. The CRA also requires that the Bank publicly disclose its CRA rating. In July 2013, CalFirst Bank was subjected to a CRA examination and received a “satisfactory” rating on the CRA performance evaluation.
The Bank is a member of the Deposit Insurance Fund (“DIF”) maintained by the FDIC. Through the DIF, the FDIC insures the deposits of the Bank up to prescribed limits for each depositor. As a result of the Dodd-Frank Act, the maximum deposit insurance amount has been increased permanently from $100,000 to $250,000. The FDIC utilizes a risk-based assessment system that imposes insurance premiums based upon a risk matrix that takes into account a bank’s capital category (“well capitalized,” “adequately capitalized,” and “undercapitalized.”) and supervisory ratings. Generally, the assessment base is the bank’s average consolidated total assets minus average tangible equity. In February 2011, the FDIC adopted a final rule implementing the Dodd-Frank Act provisions which provides for use of a risk scorecard to determine deposit premiums. The effect of the rule did not materially alter the FDIC premiums paid by the Bank.
10
California First National Bancorp and Subsidiaries
For FDIC assessment purposes, the bank’s assessment base is its average consolidated total assets minus its average tangible equity. The assessment rate is determined by the FDIC using a risk-based calculation. The FDIC assessment is calculated by multiplying the assessment rate by the assessment base. A bank's assessment base and assessment rate are calculated and billed each quarter. The FDIC may increase or decrease the assessment rate in the future, and any such increase could have an adverse impact on the earnings of insured institutions, including the Bank.
The Bank also is required to make payments for the servicing of obligations of the Financing Corporation (“FICO”) issued in connection with the resolution of savings and loan associations, so long as such obligations remain outstanding. The FICO annual assessment rate as of June 30, 2014 is 0.62 cents per $100 of deposits compared to 0.64 cents per $100 of deposits as of June 30, 2013.
The FDIC can terminate insurance of the Bank’s deposits upon a finding that the Bank has engaged in unsafe and unsound practices, is in an unsafe or unsound condition to continue operations, or has violated any applicable law, regulation, rule, order, or condition imposed by the OCC. The termination of deposit insurance could have a material adverse effect on the Company’s earnings.
The principal source of cash flow to the Company, including cash flow to pay dividends on its common shares, is dividends from its subsidiaries and fees for services rendered to its subsidiaries. Various statutory and regulatory provisions limit the amount of dividends or fees that may be paid to the Company by the Bank. In general, the Bank may not declare or pay a dividend to the Company in excess of 100% of its net retained earnings for the current year combined with its net retained earnings for the preceding two calendar years without prior approval of the OCC. The Company has not received any dividends from the Bank to date, and believes CalFirst Leasing and CalFirst Bank have sufficient resources to meet the Company’s requirements.
There are numerous laws, regulations and policies affecting financial services businesses currently in effect and they are continually under review by Congress and state legislatures and federal and state regulatory agencies. The Gramm-Leach-Bliley Act established requirements for financial institutions to provide privacy protections to consumers and notices to customers about its privacy policies and practices. The Bank Secrecy Act and USA Patriot Act impose obligations to maintain appropriate policies, procedures and controls to detect, prevent and report suspicious activities, money laundering and terrorist financing as well as maintain compliance programs to verify the identity of customers. The Dodd-Frank Act provides for sweeping financial regulatory reform and may have the effect of increasing the cost of doing business, limiting or expanding permissible activities and affect the competitive balance between banks and other financial intermediaries. Under the Dodd-Frank Act, the Consumer Financial Protection Bureau (the “CFPB”) has assumed all authority to prescribe rules or issue orders or guidelines pursuant to any federal consumer financial laws. While many of the provisions of the Dodd-Frank Act do not impact the existing business of the Bank, the extension of FDIC insurance to all non-interest bearing deposit accounts and the repeal of prohibitions on the payment of interest on demand deposits, thereby permitting depository institutions to pay interest on business transaction and other accounts, will likely increase deposit rates to be paid by the Bank in order to retain or grow deposits. Changes in the laws, regulations or policies that impact the Company cannot necessarily be predicted, and they may have a material effect on the business and earnings of the Company.
The commercial banking business is also influenced by the monetary and fiscal policies of the federal government and the policies of the FRB. The FRB implements national monetary policies through its management of the discount rate, the money supply, and reserve requirements on bank deposits. Indirectly, such policies and actions may impact the ability of non-bank financial institutions to compete with the Bank. Monetary policies of the FRB have had, and will continue to have, a significant effect on the operating results of financial institutions. The nature and impact of any future changes in monetary or other policies of the FRB cannot be predicted.
Employees
At June 30, 2014, the Company and its subsidiaries had 113 employees, none of whom are represented by a labor union. The Company believes that its relations with its employees are satisfactory.
11
California First National Bancorp and Subsidiaries
Available Information
Our Internet address is www.calfirstbancorp.com. There we make available, by link to the SEC, our annual report on Form 10-K, quarterly reports on Form 10-Q, current reports on Form 8-K and any amendments to those reports, as soon as reasonably practical after we electronically file such material with, or furnish it to, the SEC. Our SEC reports can be accessed through the Investor Information section of our Internet site. Our Corporate Governance Guidelines and our Code of Ethics for Senior Financial Management are available for viewing and printing under the Corporate Governance section of our Internet site. The information found on our Internet site is not part of this or any other report we file with or furnish to the SEC and is not incorporated herein by reference.
ITEM 1A. RISK FACTORS
There are a number of factors, including those specified below, that may adversely affect the Company’s business, financial results or stock price. Additional risks that the Company currently does not know about or currently views as immaterial may also affect the Company’s business or adversely impact its financial results or stock price.
Industry Risk Factors
The Company’s business and financial results are subject to general business and economic conditions. The economic downturn and slow recovery reduced demand for financing capital assets. Continued or renewed weakness in the economy could impact the financial performance and condition of customers and negatively affect the repayment of their obligations. In addition, changes in securities markets and monetary fluctuations adversely affect the availability and terms of funding necessary to meet the Company’s liquidity needs.
Changes in the domestic interest rate environment could reduce the Company’s net finance and interest income. The Company’s net finance and interest income, which is the difference between income earned on leases, loans and investments and interest expense paid on deposits, is affected by market rates of interest, which in turn are affected by prevailing economic conditions, by the fiscal and monetary policies of the Federal government and by the policies of various regulatory agencies. The Federal Open Market Committee (“FOMC) of the FRB has promulgated a policy of keeping short term interest rates near zero but interest rates have begun to increase following FRB announcements of intended tapering of purchases of government bonds and mortgage-backed securities, which likely will cause interest rates to increase further. Increases in interest rates will increase the income earned on the Company’s available cash balances, but will also increase the Bank’s cost of funds over time. If the interest rates on deposits and other borrowings increase at a faster rate than the interest rates received on leases, loans, securities and other interest-earning investments, net interest income and therefore earnings, could be adversely affected.
Disruptions and volatility in the domestic interest rate environment and credit markets, including changes in interest spreads and the yield curve, could negatively impact business and the value of certain assets. Higher interest rates could negatively affect demand for new leases and loans and reduce the ability of borrowers to repay their current loan obligations. Eight-six percent of the Company’s loan portfolio consists of loans at variable rates and subject to higher interest costs as interest rates increase. The increase in interest rates could lead to increased delinquencies if highly-leveraged customers are unable to pay the higher interest costs and otherwise meet their obligations. These circumstances could not only result in increased loan defaults, and charge-offs, but require increases to the allowance for credit losses which may materially and adversely affect our results of operations, business, and financial condition.
Changes in the laws, regulations and policies governing financial services companies could alter the Company’s business environment and adversely affect operations. The Board of Governors of the Federal Reserve System regulates the supply of money and credit in the United States. Its fiscal and monetary policies determine in a large part the Company’s cost of funds and the return that can be earned on leases, loans and investments, which affect the Company’s net finance, loan and interest income.
12
California First National Bancorp and Subsidiaries
The Company and the Bank are subject to a wide range of complex laws and regulations established by government entities. Most regulation is intended to protect depositors, federal deposit insurance funds and the banking system as a whole. Bank regulators can impose restrictions on the ability of the Company to undertake certain business and growth initiatives. Following the recent financial crisis, regulators have increased their oversight of banks and taken a more active role in imposing restrictions on bank operations, the classification of assets and determination of the allowance for credit losses. Changes in laws or governmental regulations, or changes in the interpretation of existing laws or regulations by a regulatory authority, could affect the Company in substantial and unpredictable ways. The Company cannot predict whether any additional legislation will be enacted, and if enacted, the effect that it or any regulations would have on the Company’s financial condition or results of operations.
Cyber security and privacy breaches may hurt our business, damage our reputation, increase our costs, and cause losses. Our systems and networks store personal information about our customers and employees. We have security systems and information technology infrastructure in place designed to protect against unauthorized access to such information. However, there is still a risk that the security systems and infrastructure that we maintain may not be successful in protecting against all security breaches, employee error, malfeasance, and cyber-attacks. The techniques used to obtain unauthorized access, disable or degrade service or sabotage systems change frequently and often are not recognized until launched and we may be unable to anticipate these techniques or to implement adequate preventative measures. Third parties, including vendors that provide services for our operations, could also be a source of security risk to us in the event of a failure of their own security systems and infrastructure or outside parties may attempt to fraudulently induce employees or customers to disclose sensitive information in order to gain access to our data or our customers' data. Any significant violations of data privacy could result in a loss of confidence in the security of our products and services, the loss of business, litigation, regulatory investigations, and penalties that could damage our reputation and adversely affect the growth of our business.
The financial services industry is highly competitive, and competitive pressures could intensify and adversely affect the Company’s financial results. The Company operates in a highly competitive industry that could become even more competitive as a result of legislative, regulatory and technological changes. The Company competes with other commercial banks, savings and loan associations, mutual savings banks, finance companies, credit unions and investment companies, many of which have greater resources than the Company.
Acts or threats of terrorism and political or military actions taken by the United States or other governments could adversely affect general economic or industry conditions.
Company Risk Factors
The Company’s allowance for credit losses may not be adequate to cover actual losses. The Company’s subsidiaries retain over 90% of lease transactions and all loans in their own portfolios, which expose the Company to credit risk. The Company maintains an allowance for credit losses to provide for probable and estimatable losses in the portfolio. The Company’s allowance for credit losses is based on its historical experience as well as industry data, an evaluation of the risks associated with its portfolio, including the size and composition of the lease and loan portfolio, current economic conditions and concentrations within the portfolio. The allowance for credit losses may not be adequate to cover losses resulting from unanticipated adverse changes in the economy or the financial markets. If the credit quality of the customer base materially decreases, or if the reserve for credit losses is not adequate, future provisions for credit losses could materially and adversely affect financial results.
The Company may suffer losses in its lease and loan portfolio despite its underwriting practices. The Company seeks to mitigate the risks inherent in its lease and loan portfolio by adhering to specific credit practices. Although the Company believes that its criteria are appropriate for the various kinds of leases and loans it makes, the Company may incur losses on leases and loans that meet these criteria.
13
California First National Bancorp and Subsidiaries
Larger transactions and customer concentration may increase the risk of loss in the event of the deterioration of one of these customers or industries. At June 30, 2014, leases aggregating to $19.2 million to one customer accounted for 4.3% of the Company’s net investment in leases and loans, with the ten largest customers representing 26% of the portfolio. Hospitals, nursing homes and other ambulatory medical facilities represented 14% of the total investment in leases and loans while 11% was with public and private colleges, universities, elementary and secondary schools located throughout the United States and 6% was related to gold and silver mining.
The Bank’s commercial loan initiative may increase the Company’s risk of losses. The commercial loan portfolio contains a number of commercial loans with relatively larger balances than its historical lease portfolio. About 19% of the commercial loan portfolio is comprised of highly leveraged loans, with 8% of the portfolio rated substandard. The deterioration of one or a few of these loans could cause a significant increase in non-performing loans. An increase in non-performing loans could result in an increase in the provision for credit losses and an increase in charge-offs, all of which could have a material adverse effect on the Company’s results of operations.
The Bank’s expanded lease purchase operations may increase the Company’s risk of losses. CalFirst Bank has implemented a program to grow its lease portfolio through the purchase of lease receivables on a non-recourse basis from other banks and finance companies. The Company seeks to mitigate the risks inherent in this third-party business by adhering to specific underwriting practices, but many of these relationships are new and untested, and the Bank could be exposed to risks not inherent with the lease transactions originated directly or acquired from its affiliates, including unfamiliar documentation and reliance on sales and funding professionals not subject to the Bank’s policies and practices.
The Company’s diversification into broader investment alternatives may increase the Company’s risk of losses. The Company’s investment portfolio may include U.S. Treasury and Agency Securities, corporate and municipal bonds and closed-end mutual funds, in addition to interest-earning deposits, short-term money market securities and federal funds previously held. These securities subject the Company to increased risk of volatility in the valuation of the investment, as well as greater interest and market risks. The deterioration of one or a few of these investments on a permanent basis could result in an determination that the investment has been permanently impaired and require a write-down of such investment, all of which could have a material adverse effect on the Company’s results of operations.
The Company may be adversely affected by significant changes in the bank deposit market and interest rates. CalFirst Bank has grown to represent 90% of the Company’s assets, and bank deposits now exceed $356 million. As a result, the Company’s sensitivity to changes in interest rates and demand for bank deposits has increased from historical levels. Time deposits due within one year of June 30, 2014 totaled $230 million. If these maturing deposits do not roll over, CalFirst Bank may be required to seek other sources of funds, including other time deposits and borrowings. Depending on market conditions, rates paid on deposits and borrowings may be higher than currently paid or no longer available. Although the Bank employs a funding strategy designed to correlate the repricing characteristics of assets with liabilities, the impact of interest rate movements and customer demand is not always consistent during different market cycles, and changes in the costs for deposits and yields on assets may not coincide.
The change in residual value of leased assets may have an adverse impact on the Company’s financial results. A portion of the Company’s leases is subject to the risk that the residual value of the property under lease will be less than the Company’s recorded value. Adverse changes in the residual value of leased assets can have a negative impact on the Company’s financial results. The risk of changes in the realized value of the leased assets compared to recorded residual values depends on many factors outside of the Company’s control.
14
California First National Bancorp and Subsidiaries
The financial services business involves significant operational risks. Operational risk is the risk of loss resulting from the Company’s operations, including, but not limited to, the risk of fraud by employees or persons outside of the Company, the execution of unauthorized transactions by employees, errors relating to transaction processing and technology, breaches of the internal control system and compliance requirements, and failure of business continuation and disaster recovery plans. This risk of loss also includes the potential legal actions that could arise as a result of an operational deficiency or as a result of noncompliance with applicable regulatory standards, adverse business decisions or their implementation, and customer attrition due to potential negative publicity. In the event of a breakdown in the internal control system, improper operation of systems or improper employee actions, the Company could suffer financial loss, face regulatory action and suffer damage to its reputation.
Bank regulators can impose restrictions on the Company’s ability to execute its strategic plan. The OCC has approved the Bank's plan for the continued development of the commercial loan portfolio but the OCC has limited the growth of the commercial loan portfolio within certain guidelines and imposed a requirement that the bank maintain a Tier 1 capital ratio of 14% that is in excess of the general regulatory requirements.
Quarterly operating results may fluctuate significantly. Operating results may differ from quarter to quarter due to a variety of factors, including the volume and profitability of leased property being remarketed, the size and credit quality of the lease and loan portfolio, the interest rate environment, the volume of new lease and loan originations, including variations in the property mix and funding of such originations and economic conditions in general. The results of any quarter may not be indicative of results in the future.
Negative publicity could damage the Company’s reputation and adversely impact its business and financial results. Reputation risk, or the risk to the Company’s business from negative publicity, is inherent in the Company’s business. Negative publicity can result from the Company’s actual or alleged conduct in any number of activities, including leasing practices, corporate governance, and actions taken by government regulators in response to those activities. Negative publicity can adversely affect the Company’s ability to keep and attract customers and can expose the Company to litigation and regulatory action.
The Company’s reported financial results are subject to certain assumptions and estimates and management’s selection of accounting method. The Company’s management must exercise judgment in selecting and applying many accounting policies and methods so they comply with generally accepted accounting principles and reflect management’s judgment of the most appropriate manner to report the Company’s financial condition and results. In some cases, management may select an accounting policy which might be reasonable under the circumstances yet might result in the Company’s reporting different results than would have been reported under a different alternative.
Certain accounting policies are critical to presenting the Company’s financial condition and results. They require management to make difficult, subjective or complex judgments about matters that are uncertain. Materially different amounts could be reported under different conditions or using different assumptions or estimates. These critical accounting policies include the estimate of residual values, the allowance for credit losses, and income taxes. For more information, refer to “Critical Accounting Policies and Estimates”.
Changes in accounting standards could materially impact the Company’s financial statements. The Financial Accounting Standards Board (FASB) may change the financial accounting and reporting standards that govern the preparation of the Company’s financial statements. These changes can be hard to predict and can materially impact how the Company records and reports its financial condition and results of operations. Recently, FASB has proposed new accounting standards related to accounting for leases and allowance for credit losses that could materially change the Company’s financial statements if ultimately put into effect. In some cases, the Company could be required to apply a new or revised standard retroactively, resulting in the Company’s restating prior period financial statements.
Loss of certain key officers would adversely affect the Company’s business. The Company‘s business and operating results are substantially dependent on certain key employees, including the Chief Executive Officer, Chief Operating Officer, the President and Chief Credit Officer of the Bank and certain key sales managers. The loss of the services of these individuals, particularly the Chief Executive Officer, would have a negative impact on the business because of their expertise and years of industry experience.
15
California First National Bancorp and Subsidiaries
The Company’s business could suffer if the Company fails to attract and retain qualified people. The Company’s success depends, in large part, on its ability to attract and retain key people. Competition for personnel in most activities the Company engages in can be intense. The Company may not be able to hire the best people or to keep them.
The Company relies on other companies to provide components of the Company’s business infrastructure. Third party vendors provide certain components of the Company’s business infrastructure, such as the Bank’s core processing and electronic banking systems, item processing, and Internet connections. While the Company has selected these third party vendors carefully, it does not control their actions. Any problems caused by these third parties not providing the Company their services for any reason or their performing their services poorly, could adversely affect the Company’s ability to deliver products and services to the Company’s customers and otherwise to conduct its business. Replacing these third party vendors could also entail significant delay and expense.
A natural disaster could harm the Company’s business. Natural disasters could harm the Company’s operations directly through interference with communications, including the interruption or loss of the Company’s websites, which would prevent the Company from gathering deposits, originating leases and loans and processing and controlling its flow of business, as well as through the destruction of facilities and the Company’s operational, financial and management information systems.
The Company faces systems failure risks as well as security risks, including “hacking” and “identity theft.” The computer systems and network infrastructure the Company and others use could be vulnerable to unforeseen problems. These problems may arise in both our internally developed systems and the systems of our third-party service providers. Our operations are dependent upon our ability to protect computer equipment against damage from fire, power loss or telecommunication failure. Any damage or failure that causes an interruption in our operations could adversely affect our business and financial results. In addition, our computer systems and network infrastructure present security risks, and could be susceptible to hacking or identity theft.
The Company relies on dividends from its subsidiaries for its liquidity needs. The Company is a separate and distinct legal entity from CalFirst Leasing and the Bank. The principal source of funds to pay dividends on the Company’s stock is from distributions from the subsidiaries. Various regulations limit the amount of dividends that the Bank may pay to the Company.
The Company’s stock price can be volatile. The Company’s stock price can fluctuate widely in response to a variety of factors, including: actual or anticipated variations in the Company’s quarterly operating results and dividend policy; operating and stock price performance of other companies that investors deem comparable to the Company; news reports relating to trends, concerns and other issues in the financial services industry, and changes in government regulations. General market fluctuations, industry factors and general economic and political conditions and events, including terrorist attacks, economic slowdowns or recessions, interest rate changes, credit loss trends or currency fluctuations, could also cause the Company’s stock price to decrease regardless of the Company’s operating results. In addition, the volume of trading in the Company’s stock is very limited and can result in fluctuations in prices between trades.
The Company is a “controlled company” as defined by NASDAQ, with over 64% of the stock held by the Chief Executive Officer, over 77% held by two senior executives and fewer than 100 shareholders of record. As a result, senior management has the ability to exercise significant influence over the Company’s policies and business, and determine the outcome of corporate actions requiring stockholder approval. These actions may include, for example, the election of directors, the adoption of amendments to corporate documents, the approval of mergers, sales of assets and the continuation of the Company as a registered company with obligations to file periodic reports and other filings with the SEC.
16
California First National Bancorp and Subsidiaries
ITEM 1B. UNRESOLVED STAFF COMMENTS
None.
ITEM 2. PROPERTIES
At June 30, 2014 the Company and its subsidiaries occupied approximately 36,000 square feet of office space in Irvine, California leased from an unaffiliated party. The lease provides for monthly rental payments that average $56,308 from July 2014 through August 2018.
ITEM 3. LEGAL PROCEEDINGS
The Company is sometimes named as a defendant in litigation relating to its business operations. Management does not expect the outcome of any existing suit to have a material adverse effect on the Company's financial condition or results of operations.
ITEM 4. MINE SAFETY DISCLOSURES
Not applicable
PART II
ITEM 5. MARKET FOR COMPANY'S COMMON EQUITY AND RELATED STOCKHOLDER MATTERS
AND ISSUER PURCHASES OF EQUITY SECURITIES
The common stock of California First National Bancorp trades on the NASDAQ Global Market System under the symbol CFNB. The following high and low closing sale prices for the periods shown reflect inter-dealer prices without retail markup, markdown or commissions and may not necessarily reflect actual transactions.
|
For the years ended
|
|||||||||||||||||
|
June 30, 2014
|
June 30, 2013
|
||||||||||||||||
|
High
|
Low
|
High
|
Low
|
||||||||||||||
|
First Quarter
|
$ | 17.48 | $ | 15.26 | $ | 18.44 | $ | 15.37 | |||||||||
|
Second Quarter
|
18.52 | 14.73 | 19.25 | 14.57 | |||||||||||||
|
Third Quarter
|
15.62 | 14.64 | 17.29 | 14.84 | |||||||||||||
|
Fourth Quarter
|
$ | 15.48 | $ | 13.91 | $ | 17.34 | $ | 14.83 | |||||||||
The Company had approximately 20 stockholders of record and in excess of 450 beneficial owners as of September 12, 2014.
Beginning in October 2009, the Board of Directors’ dividend policy provided for one annual dividend payment each year. The Company paid an annual dividend in the amount of $1.10 on December 17, 2011 and $2.20 and December 14, 2012 and $0.40 on December 13, 2013. The Board of Directors will continue to review the dividend policy on an ongoing basis, taking into consideration a variety of factors including the business, economic and tax environment. No decision to pay dividends in fiscal 2015 and beyond has been made.
In April 2001, the Board of Directors authorized management, at its discretion, to repurchase up to 1,000,000 shares of common stock. This authorization has no termination date, but the Board of Directors reviews the authorization to repurchase common stock from time to time. The Company did not repurchase any shares of common stock under this authorization during the three years ended June 30, 2014, 2013 and 2012. As of September 10, 2014, 368,354 shares remain available under this authorization.
17
California First National Bancorp and Subsidiaries
Common Stock Performance Graph
The following graph shows a comparison of the five-year cumulative return among the Company, the NASDAQ Composite Index and the Russell 2000. The graph assumes an investment of $100 on June 30, 2009 in our common stock and in each of the indices listed on the graph and reflects the change in the market price of our common stock relative to the changes in the noted indices at June 30, 2010, 2011, 2012, 2013 and 2014. The performance shown below is based on historical data and is not indicative of, nor intended to forecast, future price performance of our common stock. As required by Securities and Exchange Commission rules, total return in each case assumes the reinvestment of dividends paid.
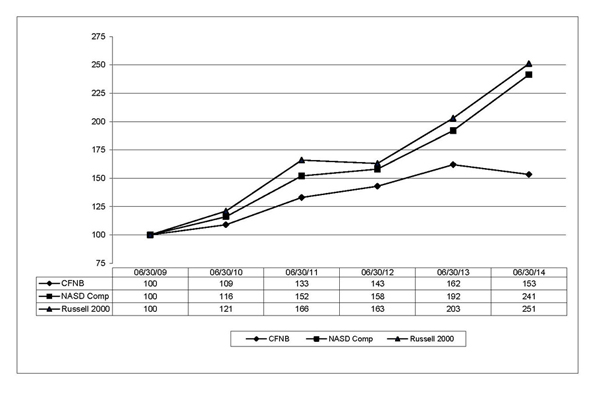
Equity Compensation Plan Information
The following table provides information about shares of the Company’s Common Stock that may be issued upon the exercise of options under our existing equity compensation plans as of June 30, 2014.
|
Plan category
|
Number of shares of common
stock to be issued upon exercise of outstanding options
|
Weighted average
exercise price of
outstanding options
|
Number of shares of common stock available
for future issuance under equity compensation plans (excluding shares in first column) (1) |
|||||||
|
Equity compensation plans
approved by shareholders
|
10,000 | $ 16.00 | 2,010,647 | |||||||
|
Equity compensation plans
not approved by shareholders
|
None
|
N/A | N/A | |||||||
|
Total
|
10,000 | $ 16.00 | 2,010,647 | (1) | ||||||
|
(1)
|
The maximum number of shares that may be issued under the equity compensation plan increases each year by an amount equal to 1% of the total number of issued and outstanding shares of Common Stock as of June 30 of the fiscal year immediately preceding such fiscal year.
|
18
California First National Bancorp and Subsidiaries
ITEM 6. SELECTED FINANCIAL DATA
The following table sets forth selected financial data and operating information of the Company and its subsidiaries. The selected financial data should be read in conjunction with the Financial Statements and notes thereto and Management's Discussion and Analysis of Results of Operations and Financial Condition contained herein.
|
INCOME STATEMENT DATA
|
YEARS ENDED JUNE 30,
|
|||||||||||||||||||
|
(in thousands, except per share amounts)
|
2014
|
2013
|
2012
|
2011
|
2010
|
|||||||||||||||
|
Direct finance and loan income
|
$ | 18,370 | $ | 18,995 | $ | 20,505 | $ | 22,445 | $ | 22,064 | ||||||||||
|
Interest and investment income
|
1,371 | 2,408 | 3,133 | 3,347 | 4,722 | |||||||||||||||
|
Total finance and interest income
|
19,741 | 21,403 | 23,638 | 25,792 | 26,786 | |||||||||||||||
|
Interest expense on deposits and borrowings
|
3,037 | 2,664 | 2,914 | 3,613 | 4,864 | |||||||||||||||
|
Net finance and interest income
|
16,704 | 18,739 | 20,724 | 22,179 | 21,922 | |||||||||||||||
|
Provision for credit losses
|
200 | 275 | - | 1,025 | 350 | |||||||||||||||
|
Net finance and interest income after provision for credit losses
|
16,504 | 18,464 | 20,724 | 21,154 | 21,572 | |||||||||||||||
|
Operating and sales-type lease income
|
2,152 | 1,711 | 2,755 | 2,127 | 1,998 | |||||||||||||||
|
Gain on sale of leases and leased property
|
2,980 | 2,278 | 2,478 | 2,758 | 1,797 | |||||||||||||||
|
Other income
|
432 | 526 | 569 | 642 | 857 | |||||||||||||||
|
Realized gain on sale of investment securities
|
- | 316 | 56 | 2,342 | 3,436 | |||||||||||||||
|
Total non-interest income
|
5,564 | 4,831 | 5,858 | 7,869 | 8,088 | |||||||||||||||
|
Non-interest expenses
|
10,995 | 11,610 | 12,307 | 12,088 | 11,640 | |||||||||||||||
|
Earnings before income taxes
|
11,073 | 11,685 | 14,275 | 16,935 | 18,020 | |||||||||||||||
|
Income taxes
|
4,022 | 4,331 | 5,372 | 6,028 | 6,893 | |||||||||||||||
|
Net earnings
|
$ | 7,051 | $ | 7,354 | $ | 8,903 | $ | 10,907 | $ | 11,127 | ||||||||||
|
Diluted earnings per share
|
$ | 0.67 | $ | 0.70 | $ | 0.85 | $ | 1.05 | $ | 1.08 | ||||||||||
|
Diluted common shares outstanding
|
10,456 | 10,453 | 10,429 | 10,401 | 10,304 | |||||||||||||||
|
Cash dividends per share
|
$ | 0.40 | $ | 2.20 | $ | 1.10 | $ | 1.00 | $ | 0.60 | ||||||||||
|
Net interest margin
|
3.22 | % | 3.77 | % | 4.40 | % | 5.00 | % | 5.10 | % | ||||||||||
|
Net interest spread
|
2.92 | % | 3.41 | % | 4.00 | % | 4.40 | % | 4.10 | % | ||||||||||
|
Return on average assets
|
1.30 | % | 1.40 | % | 1.80 | % | 2.30 | % | 2.40 | % | ||||||||||
|
Return on average equity
|
3.90 | % | 4.00 | % | 4.50 | % | 5.50 | % | 5.70 | % | ||||||||||
|
BALANCE SHEET DATA
|
AS OF JUNE 30,
|
|||||||||||||||||||
|
(in thousands, except per share amounts)
|
2014 | 2013 | 2012 | 2011 | 2010 | |||||||||||||||
|
Cash and cash equivalents
|
$ | 40,122 | $ | 75,469 | $ | 56,921 | $ | 97,302 | $ | 73,988 | ||||||||||
|
Investment securities
|
29,316 | 48,162 | 66,751 | 66,321 | 71,974 | |||||||||||||||
|
Net investment in leases and loans
|
455,805 | 416,569 | 336,463 | 317,174 | 257,794 | |||||||||||||||
|
Total assets
|
579,550 | 558,903 | 486,171 | 524,415 | 453,602 | |||||||||||||||
|
Demand, savings and time deposits
|
355,810 | 346,028 | 253,297 | 274,775 | 205,922 | |||||||||||||||
|
Short and long term borrowings
|
6,858 | - | - | 10,000 | 10,000 | |||||||||||||||
|
Non-recourse debt
|
8,640 | 768 | 3,275 | 8,448 | 14,337 | |||||||||||||||
|
Stockholders’ equity
|
$ | 183,745 | $ | 180,879 | $ | 196,439 | $ | 199,622 | $ | 198,548 | ||||||||||
|
Equity to total assets ratio
|
31.70 | % | 32.36 | % | 40.41 | % | 38.07 | % | 43.80 | % | ||||||||||
|
Book value per common share
|
$ | 17.57 | $ | 17.31 | $ | 18.83 | $ | 19.16 | $ | 19.39 | ||||||||||
19
California First National Bancorp and Subsidiaries
|
ITEM 7.
|
MANAGEMENT'S DISCUSSION AND ANALYSIS OF FINANCIAL CONDITION AND RESULTS OF OPERATIONS
|
General
The Company’s results include the operations of CalFirst Bank and CalFirst Leasing. The Company’s finance, loan and interest income includes interest income earned on the Company’s investment in lease receivables and residuals, commercial loans and investment securities. Non-interest income primarily includes gains realized on the sale of leased property, income from sales-type and operating leases, gains realized on the sale of leases, gains or losses recorded on investment securities and other income. Income from sales-type leases relates to the re-lease of off-lease property (“lease extensions”) while operating lease income generally involves lease extensions that do not meet the accounting requirements for sales-type leases.
The Company's operating results are subject to quarterly fluctuations resulting from a variety of factors, including the size and credit quality of the lease and loan portfolios, the interest rate environment, the volume and profitability of leased property being re-marketed through re-lease or sale, the market for investment securities, the volume of new lease or loan originations, including variations in the mix and funding of such originations, and economic conditions in general. The Company’s principal market risk exposure currently is related to interest rates and the differences in the repricing characteristics of interest-earning assets and interest-bearing liabilities. The FRB began decreasing interest rates in 2007 and has maintained historically low market interest rates from 2009 to 2014. The Company’s current balance sheet structure is short-term in nature, with over 56% of assets and 83% of liabilities that mature or reprice within one year. The Company’s interest margin is susceptible to timing lags related to varying movements in market interest rates. Many of the Company’s leases, loans and liquid investments are tied to U.S. treasury rates and Libor that often do not move in step with bank deposit rates. As a result, this can result in a greater change in net interest income than indicated by the repricing asset and liability comparison.
The Company conducts its business in a manner designed to mitigate risks. However, the assumption of risk is a key source of earnings in the leasing and banking industries and the Company is subject to risks through its investment in leases and loans held in its own portfolio, securities, lease transactions-in-process, and residual investments. The Company takes steps to manage risks through the implementation of strict credit and risk management processes and on-going risk management review procedures.
Critical Accounting Policies and Estimates
The preparation of the Company’s financial statements requires management to make certain critical accounting estimates that impact the stated amount of assets and liabilities at a financial statement date and the reported amount of income and expenses during a reporting period. These accounting estimates are based on management’s judgment and are considered to be critical because of their significance to the financial statements and the possibility that future events may differ from current judgments, or that the use of different assumptions could result in materially different estimates. The following is a description of the most critical accounting policies management applies, all of which require the use of accounting estimates and management’s judgment, based on the relevant information available at the end of each period.
Allowance for Credit Losses – The allowance for credit losses provides coverage for probable and estimatable losses in the Company’s lease and commercial loan portfolios. The allowance recorded is based on a quarterly review of all leases and loans outstanding, loan commitments and transactions-in-process. The determination of the appropriate amount of any provision is highly dependent on management’s judgment at that time and takes into consideration all known relevant internal and external factors that may affect the lease and loan portfolio, including levels of non-performing leases and loans, customers financial condition, leased property values and collateral appraisals as well as general economic conditions and credit quality indicators. The Company’s allowance includes an estimate of reserves needed to cover specifically identified lease and loan losses and certain unidentified but inherent risks in the portfolio.
Fair Value of Investments – Investment securities are characterized as held-to-maturity (Investments) or as available-for-sale (Securities Available-for-Sale) based on management’s ability and intent regarding such investment at acquisition. On an ongoing basis, management must estimate the fair value of its investment securities based on information and assumptions it deems reliable and reasonable, which may be quoted market prices or if quoted market prices are not available, fair values extrapolated from the quoted prices of similar instruments. Based on this information, an assessment must be made as to whether any decline in the fair value of an investment security should be considered an other-than-temporary impairment and recorded in non-interest income as a loss on investments. The determination of such impairment is subject to a variety of factors, including management’s judgment and experience.
20
California First National Bancorp and Subsidiaries
Residual Values – For capital leases that qualify as direct financing leases, the aggregate lease payments receivable and estimated residual value, if any, are recorded on the balance sheet, net of unearned income and allowances, as net investment in leases. Of the volume of leases booked during the fiscal years ended June 30, 2014, 2013 and 2012, approximately 25.0%, 11.3% and 22.8%, respectively, were structured such that the Company owns the leased asset at the end of the term and recorded a residual value. The residual value is an estimate for accounting purposes of the fair value of the leased property at lease termination and is determined at the inception of the lease based on the property leased and the terms and conditions of the underlying lease contract. The realizability of any estimated residual value depends on future collateral values, contractual options available to the lessee, the credit of the lessee, market conditions and other subjective and qualitative factors. The estimated residual values established at lease inception are periodically reviewed to determine if values are realizable and any identified losses are recognized at such time.
Initial Direct Costs Deferred – A portion of the Company’s non-interest expenses that management estimates is directly related to originating lease and loan transactions is deferred through a reduction to non-interest expenses recognized in a period. The amount deferred reflects management’s estimate of the expenses applicable to the origination process, taking into account a variety of factors including sales productivity, credit and documentation efficiency and estimates of completion percentages.
Deferred Income Taxes and Valuation Allowance – Deferred tax assets and liabilities result from temporary differences between the time income or expense items are recognized for financial statement purposes and for tax reporting. Such amounts are calculated using the enacted tax rates and laws that are expected to be in effect when the differences are expected to reverse. The determination of current and deferred income taxes is based on complex analyses of many factors including interpretation of Federal and state income tax laws, the difference between tax and financial reporting basis of assets and liabilities (temporary differences), estimates of amounts due or owed such as the timing of reversals of temporary differences and current financial accounting standards. A valuation allowance is established if, based upon the relevant facts and circumstances, management believes that some or all of certain tax assets will not be realized. The Company has open tax years that may in the future be subject to examination by Federal and state taxing authorities. Management periodically evaluates the adequacy of related valuation allowances, taking into account open tax return positions, tax assessments received and tax law changes. The process of evaluating allowance accounts involves the use of estimates and a high degree of management judgment. Actual results could differ significantly from the estimates and interpretations used in determining the current and deferred income tax liabilities and reserves.
The Company's estimates are reviewed continuously to ensure reasonableness. However, the amounts the Company may ultimately realize could differ from such estimated amounts.
Overview of Results, Trends and Outlook
Net earnings for the year ended June 30, 2014 of $7.05 million declined $303,000, or 4%, from the $7.35 million reported in fiscal 2013. The decline in net income in fiscal 2014 was due to lower net interest income, as yields on earning assets were impacted by the low interest rate and competitive pricing environment, offset by increased non-interest income from the sale of leases and lease extensions along with a 5% reduction in non-interest expenses.
For the year ended June 30, 2014, total leases and loans booked of $254.7 million were 13% below fiscal 2013 peak bookings of $293.2 million. New lease bookings of $181.4 million, of which 89% were originated directly, were down 25% from the $243.2 million booked in the prior fiscal year, of which 79% were originated directly. Commercial loans boarded of $73.3 million were up from the $50.0 million boarded in fiscal 2013. The Company’s net investment in leases and loans of $455.8 million at June 30, 2014 was up 9% from $416.6 million at June 30, 2013. The Bank’s investment in leases and loans of $423.1 million increased 12.3% and now accounts for 93% of the Company’s consolidated investment at June 30, 2014.
21
California First National Bancorp and Subsidiaries
New lease and loan transactions approved (“lease and loan originations”) of $299.6 million during fiscal 2014 were 3% ahead of the levels of the prior year. Due to the timing of completing lease transactions, which can take from three months to over a year from origination to booking, lease originations within a period often differ from lease bookings. Fiscal 2014 loan originations of $75.3 million were up $18.8 million from $56.5 million in fiscal 2013. Lease originations during fiscal 2014 of $224.4 million were down 4% from $233.1 million in fiscal 2013, with 95% originated directly compared to 72% the prior year. As a result, the estimated backlog of approved lease and loan commitments of $136.7 million at June 30, 2014 is up 25% from $109.7 million at June 30, 2013, 91% of which relates to leases.
Consolidated Statement of Earnings Analysis
Summary – For the fiscal year ended June 30, 2014, net earnings of $7.05 million decreased $303,000 compared to $7.35 million for fiscal 2013. Diluted earnings per share was $0.67 in fiscal 2014 and $0.70 fiscal 2013. Net interest income after provision for credit losses declined $2.0 million offset by an increase of $733,000 in non-interest income and a reduction of $615,000 in non-interest expenses.
Net Finance, Loan and Interest Income – Net finance, loan and interest income is the difference between interest earned on the investment in leases, loans, securities and other interest earning assets and interest paid on deposits or other borrowings. Net finance, loan and interest income is affected by changes in the volume and mix of interest earning assets and liabilities, the movement of interest rates, and funding and pricing strategies.
Net finance, loan and interest income was $16.7 million for the fiscal year ended June 30, 2014 compared to $18.7 million for fiscal 2013. Total finance, loan and interest income decreased 7.8% to $19.7 million, compared to $21.4 million in fiscal 2013. This decline was primarily due to a $1.0 million, or 43%, decrease in investment income and $901,000, or 20%, decline in commercial loan income. Investment income of $1.4 million reflected a 17% decline in average investment balances to $95.5 million and 66 basis point drop in average yields earned to 1.44%. The drop in commercial loan income was primarily due to a 96 basis point drop in average yields earned to 3.84% as average balances for the year of $91.3 million compared to $91.9 million for the year ended June 30, 2013. Direct finance income increased 2% for the year to $14.9 million, benefitting from a 14% increase in average investment in leases to $331.5 million, which was offset some by a 54 basis point decline in average yields to 4.48%. Combined, the average yield on leases and loans in the Company’s portfolio for fiscal 2014 decreased by 62 basis points to 4.34%. For the year ended June 30, 2014, interest expense on deposits and borrowings increased by 14% to $3.0 million, reflecting a 15% increase in average balances to $340.4 million and only 1 basis point decline in average rate paid to 0.89%.
The average yield on all interest-earning assets in fiscal 2014 decreased to 3.8% from 4.3% the prior year, while the average rate paid on all interest-earning liabilities decreased only 1 basis point to 0.89% from 0.90% in fiscal 2013. As a result, the net interest margin for the year decreased from 3.8% in fiscal 2013 to 3.2% in fiscal 2014. The sustained period of low interest rates has allowed the continued run off of higher yielding leases and securities that have been replaced with leases and variable rate loans based on continued low rates, and the Bank is limited in its ability to lower deposit rates in tandem.
Net finance, loan and interest income was $18.7 million for the fiscal year ended June 30, 2013 compared to $20.7 million for fiscal 2012. This decline was primarily due to a $1.6 million, or 9.8%, decrease in direct finance income and $724,000, or 23%, decline in investment income. The drop in direct finance income included a 22% increase in the average investment in leases to $290.5 million, but the average yield declined by 180 basis points to 5.02%. Commercial loan income increased by $70,000 as average balances for the year were up 7% to $91.9 million while the average yield declined by 25 basis points to 4.80%. Combined, the average yield on leases and loans held in the Company’s own portfolio decreased by 138 basis points in fiscal 2013 to 4.97%. The decline in investment income was largely due to a 20% decline in average investment balances to $114.8 million as average yields earned only dropped by 10 basis points to 2.10%. For the year ended June 30, 2013, interest expense on deposits decreased by $250,000 to $2.7 million, reflecting an 11% increase in average balances to $297.0 million offset by a 20 basis point decline in average rates paid.
22
California First National Bancorp and Subsidiaries
The following table presents the components of the increases (decreases) in net finance, loan and interest income by volume and rate:
|
2014 compared to 2013
|
2013 compared to 2012
|
||||||||||||||||||||||||
|
Volume
|
Rate
|
Total
|
Volume
|
Rate
|
Total
|
||||||||||||||||||||
|
(in thousands)
|
|||||||||||||||||||||||||
|
Finance, loan and interest income
|
|||||||||||||||||||||||||
|
Net investment in leases
|
$ | 2,059 | $ | (1,782 | ) | $ | 277 | $ | 3,636 | $ | (5,215 | ) | $ | (1,579 | ) | ||||||||||
|
Commercial loans
|
(27 | ) | (875 | ) | (902 | ) | 304 | (235 | ) | 69 | |||||||||||||||
|
Investment securities
|
(875 | ) | (149 | ) | (1,024 | ) | (385 | ) | (301 | ) | (686 | ) | |||||||||||||
|
Interest-earning deposits with banks
|
5 | (18 | ) | (13 | ) | (37 | ) | (2 | ) | (39 | ) | ||||||||||||||
|
Total finance, loan and interest income
|
1,162 | (2,824 | ) | (1,662 | ) | 3,518 | (5,753 | ) | (2,235 | ) | |||||||||||||||
|
Interest expense
|
|||||||||||||||||||||||||
|
Demand and savings deposits
|
(65 | ) | 1 | (64 | ) | (8 | ) | (69 | ) | (77 | ) | ||||||||||||||
|
Time deposits
|
594 | (158 | ) | 436 | 482 | (544 | ) | (62 | ) | ||||||||||||||||
|
Short and long term borrowings
|
- | 1 | 1 | (111 | ) | 0 | (111 | ) | |||||||||||||||||
|
Total interest expense
|
529 | (156 | ) | 373 | 363 | (613 | ) | (250 | ) | ||||||||||||||||
|
Net finance, loan and interest income
|
$ | 633 | $ | (2,668 | ) | $ | (2,035 | ) | $ | 3,155 | $ | (5,140 | ) | $ | (1,985 | ) | |||||||||
The following table presents the Company’s average balance sheets, finance and loan income and interest earned or interest paid, the related yields and rates on major categories of the Company’s interest-earning assets and interest-bearing liabilities:
|
(dollars in thousands)
|
Year ended June 30, 2014
|
Year ended June 30, 2013
|
Year ended June 30, 2012
|
|||||||||||||||||||||||||||||||||
|
Assets
|
Average
Balance |
Interest
|
Yield/
Rate |
Average
Balance |
Interest
|
Yield/
Rate |
Average
Balance |
Interest
|
Yield/
Rate |
|||||||||||||||||||||||||||
|
Interest-earning assets
|
||||||||||||||||||||||||||||||||||||
|
Interest-earning deposits with banks
|
$ | 59,486 | $ | 94 | 0.16 | % | $ | 56,785 | $ | 107 | 0.19 | % | $ | 76,086 | $ | 146 | 0.19 | % | ||||||||||||||||||
|
Investment securities
|
35,986 | 1,277 | 3.55 | % | 58,055 | 2,301 | 3.96 | % | 66,640 | 2,987 | 4.48 | % | ||||||||||||||||||||||||
|
Commercial loans
|
91,314 | 3,507 | 3.84 | % | 91,868 | 4,408 | 4.80 | % | 85,849 | 4,338 | 5.05 | % | ||||||||||||||||||||||||
|
Net investment in leases
|
331,474 | 14,863 | 4.48 | % | 290,475 | 14,587 | 5.02 | % | 237,143 | 16,167 | 6.82 | % | ||||||||||||||||||||||||
|
Total interest-earning assets
|
518,260 | 19,741 | 3.81 | % | 497,183 | 21,403 | 4.30 | % | 465,718 | 23,638 | 5.08 | % | ||||||||||||||||||||||||
|
Other assets
|
37,849 | 23,387 | 36,893 | |||||||||||||||||||||||||||||||||
| $ | 556,109 | $ | 520,570 | $ | 502,611 | |||||||||||||||||||||||||||||||
|
Liabilities and Shareholders' Equity
|
||||||||||||||||||||||||||||||||||||
|
Interest-bearing liabilities
|
||||||||||||||||||||||||||||||||||||
|
Demand and savings deposits
|
$ | 68,150 | 335 | 0.49 | % | $ | 81,321 | 399 | 0.49 | % | $ | 82,758 | 475 | 0.57 | % | |||||||||||||||||||||
|
Time deposits
|
271,693 | 2,701 | 0.99 | % | 215,261 | 2,265 | 1.05 | % | 178,313 | 2,328 | 1.31 | % | ||||||||||||||||||||||||
|
Other borrowings
|
549 | 1 | 0.25 | % | - | - | 0.0 | % | 4,973 | 111 | 2.23 | % | ||||||||||||||||||||||||
|
Total interest bearing liabilities
|
340,392 | 3,037 | 0.89 | % | 296,582 | 2,664 | 0.90 | % | 266,044 | 2,914 | 1.10 | % | ||||||||||||||||||||||||
|
Non-interest bearing demand deposits
|
1,785 | 1,993 | 2,199 | |||||||||||||||||||||||||||||||||
|
Other liabilities
|
32,027 | 35,793 | 37,099 | |||||||||||||||||||||||||||||||||
|
Shareholders' equity
|
181,905 | 186,202 | 197,269 | |||||||||||||||||||||||||||||||||
| $ | 556,109 | $ | 520,570 | $ | 502,611 | |||||||||||||||||||||||||||||||
|
Net interest income
|
$ | 16,704 | $ | 18,739 | $ | 20,724 | ||||||||||||||||||||||||||||||
|
Net interest spread (2)
|
2.92 | % | 3.41 | % | 3.98 | % | ||||||||||||||||||||||||||||||
|
Net interest margin (3)
|
3.22 | % | 3.77 | % | 4.45 | % | ||||||||||||||||||||||||||||||
|
Average interest earning assets over average interest bearing liabilities
|
152.3 | % | 167.6 | % | 175.1 | % | ||||||||||||||||||||||||||||||
|
(1)
|
Average balance is based on month-end balances, includes non-accrual leases, and is presented net of unearned income.
|
|
(2)
|
Net interest spread is equal to the difference between the average yield on interest earning assets and the average rate paid on interest-bearing liabilities.
|
|
(3)
|
Net interest margin represents net finance and interest income as a percent of average interest earning assets.
|
23
California First National Bancorp and Subsidiaries
Provision for Credit Losses – The Company recorded a provision for credit losses in fiscal 2014 of $200,000, compared a provision of $275,000 recorded in fiscal 2013 and no provision in fiscal 2012. The provision in fiscal 2014 was made in the fourth quarter and reflected the growth in the overall portfolios and the emergence of potential problem credits. The provision in fiscal 2013 reflected the deterioration in the credit of one large lease position in the beginning of the fiscal year. The Company did not make a provision for credit losses in fiscal 2012 as the growth in total risk assets was only 2% and the overall credit quality remained stable.
Total Non-interest Income – Total non-interest income of $5.6 million for the year ended June 30, 2014 increased $734,000, or 15.2%, from $4.8 million in 2013. The increase included a $1.4 million increase in income from the sale of leases and $441,000 increase in income from the re-lease of property on leases reaching the end of term. The sale of leases during the year largely related to reducing exposure with certain customers in order to provide capacity to handle new commitments.
Total non-interest income of $4.8 million for the year ended June 30, 2013 decreased $1.0 million, or 17.5%, from $5.9 million in 2012. The decline included a $1.0 million decrease in income from the re-lease of property on leases reaching the end of term and $153,000 decline in gains from the sale of leased property, offset in part by an increase of $260,000 in gains realized on the early call of investment securities.
Non-interest Expenses –The Company’s non-interest expenses decreased $615,000, or 5.3%, to $11.0 million recognized for the year ended June 30, 2014. This compared to non-interest expenses in fiscal 2013 of $11.6 million, which had decreased by $697,000, or 5.7%, from $12.3 million in fiscal 2012. The decrease in non-interest expenses during fiscal 2014 compared to fiscal 2013 was due to lower compensation costs recognized and lower occupancy costs.
Non-interest expenses for the year ended June 30, 2013 decreased $697,000, or 5.7%, to $11.6 million compared to non-interest expenses in fiscal 2012 of $12.3 million. The decrease in non-interest expenses during fiscal 2013 was primarily due to lower compensation costs recognized and related support costs.
Income Taxes – Income taxes were accrued at a tax rate of 36.3% for the fiscal year ended June 30, 2014, 37.1% for fiscal year ended June 30, 2013 and 37.6% for fiscal year ended June 30, 2012, representing the Company’s estimated effective tax rate for each respective year. The effective tax rate decreased in fiscal 2014 compared to 2013 due to the benefit of derecognition of uncertain tax positions. During fiscal 2014, the Internal Revenue Service closed an audit of the Company’s tax returns through the year ended June 20, 2012 without any adjustment. The income tax rate decreased in fiscal 2013 compared to 2012 due to benefit related to an average lower state tax rate. Tax-exempt leases represented approximately 3.4% of new lease bookings in fiscal 2014, 2.1% in fiscal 2013, and 8.6% during fiscal 2012.
Financial Condition Analysis
Lease Portfolio
During the fiscal year ended June 30, 2014, 97% of the property value of new leases booked by the Company were held in its own portfolio, compared to 98% during fiscal 2013 and 95% during fiscal 2012. For the fiscal year ended June 30, 2014, the Company’s net investment in lease receivables decreased by $14.8 million and the investment in estimated residual values decreased by $1.0 million. The decrease in the investment in lease receivables is due to the sale or assignment of $33.5 million of lease receivable offset by new lease transactions booked and retained by the Company, while the decrease in investment in residual values is due to a lower volume of new leases on which the Company records a residual compared to the volume of residual values recognized at end of term.
24
California First National Bancorp and Subsidiaries
The Company often makes payments to purchase leased property prior to the commencement of the lease. The disbursements for these lease transactions-in-process are made to facilitate the lessees’ property implementation schedule. The lessee generally is contractually obligated by the lease to make rental payments directly to the Company during the period that the transaction is in process, and obligated to reimburse the Company for all disbursements under certain circumstances. Income is not recognized while a transaction is in process and prior to the commencement of the lease. At June 30, 2014, the Company’s investment in property acquired for transactions-in-process was $40.6 million, up from $11.9 million at June 30, 2013, and up from the $18.5 million at June 30, 2012. The increase in transactions in process at June 30, 2014 is largely due to one direct lease origination which involves an extended implementation period for a system.
The Company leases capital assets to businesses and other commercial or non-profit organizations. All leases are secured by the underlying property being leased. The Company’s strategy is to develop lease portfolios with risk/reward profiles that meet its objectives and avoid risks that do not meet these requirements through the use of non-recourse financing. The strategy emphasizes diversification on both a geographic and customer level, and spreading the Company’s risk across a breadth of leases, however, over the past three years the average size of lease transaction has increased from about $500,000 to over $900,000. During the year ended June 30, 2014, one commercial credit accounted for 13.3% of the property cost of leases booked during the fiscal year, with the five largest commercial accounts aggregating to 30.0% of leases booked. In fiscal 2013, two commercial credits each accounted for 11.0% and 7.1% of the property cost of leases booked during the fiscal year, with the five largest commercial accounts aggregating to 31.8% of leases booked. In fiscal 2012, two commercial credits each accounted for 7.1% and 5.2% of the property cost of leases booked during the fiscal year, with the five largest commercial accounts aggregating to 25% of leases booked. At June 30, 2014, one customer accounted for 6.1% of the Company’s net investment in leases, compared to two customers accounting for 6.1% and 5.1% of the Company’s net investment in leases at June 30, 2013 and no customer accounting for more than 5% of the lease portfolio at June 30, 2012.
Commercial Loan Portfolio
The Company’s commercial loan portfolio was $129.2 million at June 30, 2014, a 74.6% increase from $74.0 million at June 30, 2013. The commercial loan portfolio is comprised primarily of participations in commercial loan syndications where the loans are secured by the borrower and any subsidiary guarantors’ assets. Commercial loan participations represent 86.3% of the commercial loan portfolio with the remainder of the portfolio comprised of two commercial real estate loans and one unsecured loan originated directly. The loan portfolio at June 30, 2014 is distributed among 26 credits with an average balance of $5.2 million and the largest outstanding at $10.0 million. Syndicated loans that the Company characterizes as highly leveraged account for approximately 19% of the commercial loan portfolio. The following table summarizes the Company’s commercial loan portfolio as of June 30, 2014, 2013 and 2012:
|
June 30,
|
|||||||||||||
|
Loan Type
|
2014
|
2013
|
2012
|
||||||||||
|
(in thousands)
|
|||||||||||||
|
Commercial term loans
|
$ | 121,236 | $ | 65,094 | $ | 69,221 | |||||||
|
Commercial real estate loans
|
7,920 | 9,411 | 13,504 | ||||||||||
|
Revolving lines of credit
|
2,471 | 1,841 | 3,019 | ||||||||||
|
Total commercial loans
|
131,627 | 76,346 | 85,744 | ||||||||||
|
Less unearned income and discounts
|
(469 | ) | (394 | ) | (762 | ) | |||||||
|
Less allowance for loan losses
|
(1,972 | ) | (1,972 | ) | (2,072 | ) | |||||||
|
Net commercial loans
|
$ | 129,186 | $ | 73,980 | $ | 82,910 | |||||||
25
California First National Bancorp and Subsidiaries
The estimated repayment of principal on the commercial loan portfolio as of June 30, 2014 is as follows:
|
Principal Balance Due in
|
||||||||||||||||
|
Loan Type
|
Principal
Balance |
One Year
Or less |
One to
Five Years |
Due After
Five Years |
||||||||||||
|
(in thousands)
|
||||||||||||||||
|
Commercial term loans
|
$ | 121,236 | $ | 4,606 | $ | 84,996 | $ | 31,634 | ||||||||
|
Commercial real estate loans
|
7,920 | 919 | 7,001 | - | ||||||||||||
|
Revolving lines of credit
|
2,471 | - | 2,471 | - | ||||||||||||
|
Principal balance outstanding
|
$ | 131,627 | $ | 5,525 | $ | 94,468 | $ | 31,634 | ||||||||
|
Loans with predetermined interest rates
|
$ | 17,920 | ||||||||||||||
|
Loans with floating or adjustable interest rates
|
$ | 113,707 | ||||||||||||||
The investment in leases and loans is diversified geographically, with the Company’s portfolio spread across all fifty states. At June 30, 2014, Texas (10.6%), California (8.9%), Pennsylvania (7.2%), New York (5.7%), Virginia (5.1%) and Washington (5.0%) were the only states that represented more than 5% of the Company’s net investment in leases and loans. The Company has no exposure to foreign lessees. The lease and loan portfolios include companies in a wide spectrum of industries; however, at June 30, 2014 approximately 8.2% of the Company’s net investment in leases and loans were with hospitals and medical centers, with another 6.3% with other ambulatory health care facilities, compared to 9% and 5.9%, respectively, at June 30, 2013. Public and private colleges, universities, elementary and secondary schools located throughout the United States represented 11.1% of the portfolio compared to 13.1% at June 30, 2013. Gold and silver mining represented 6.0% of the portfolio at June 30, 2014 compared to 8.0% in fiscal 2013. The hospital portfolio involves 26 different credits with over 500 different facilities, over 50 lease schedules and 5 loans, with three hospital credits each representing more than 1% of the portfolio. The educational portfolio includes over 294 leases with 136 different lessees, with two universities each representing over 1.0% of the net investment. Gold and silver mining includes 3 customers, with two customers representing over 1% of the portfolio.
Securities Available-for-Sale
The Company maintains a portfolio of securities to generate interest and investment income from the investment of excess funds depending on lease and loan demand and to provide liquidity. Total securities available-for-sale were $26.8 million as of June 30, 2014, compared to $45.5 million at June 30, 2013. The carrying cost and fair value of the Company’s securities portfolio at June 30, 2014 and 2013 is as follows:
|
As of June 30, 2014
|
As of June 30, 2013
|
|||||||||||||||
|
Amortized
Cost |
Fair
Value |
Amortized
Cost |
Fair
Value |
|||||||||||||
|
Available-for-sale
|
||||||||||||||||
|
Corporate debt securities
|
$ | 16,030 | $ | 16,310 | $ | 42,435 | $ | 43,147 | ||||||||
|
Securities of state and political subdivisions
|
409 | 427 | 412 | 436 | ||||||||||||
|
U.S. Treasury notes
|
7,930 | 7,973 | - | - | ||||||||||||
|
Mutual fund investments
|
1,306 | 1,261 | 1,306 | 1,250 | ||||||||||||
|
Equity investments
|
422 | 793 | 422 | 689 | ||||||||||||
|
Total securities available-for-sale
|
$ | 26,097 | $ | 26,764 | $ | 44,575 | $ | 45,522 | ||||||||
During the fiscal year ended June 30, 2014, the Company’s portfolio of securities available-for-sale decreased $18.8 million to $26.8 million. The decrease during the year related to the maturities and pay downs of $26.7 million offset by purchases of $7.9 million. Management evaluates investment securities for other-than-temporary impairment on a quarterly basis. Consideration is given to the length of time and the extent to which the fair value has been less than cost, the financial condition and near-term prospects of the issuer, and the intent and ability of the Company to retain its investment in the issuer for a period of time sufficient to allow for any anticipated recovery in fair value.
At June 30, 2014 the available-for-sale securities portfolio included a $667,000 net unrealized pre-tax gain compared with a net unrealized pre-tax gain of $947,000 at June 30, 2013. The weighted-average maturity at June 30, 2014 was 2.0 years and the corresponding weighted-average yield was 3.0 percent.
26
California First National Bancorp and Subsidiaries
Asset Quality
The Company monitors the performance of all leases and loans held in its own portfolio, transactions-in-process and loan commitments as well as lease transactions assigned to lenders, if the Company retains a residual investment in the leased property subject to those leases. An ongoing review of all leases and loans ten or more days delinquent is conducted. Customers who are delinquent with the Company or an assignee are coded in the Company’s accounting and tracking systems in order to provide management visibility, periodic reporting, and appropriate reserves. The accrual of interest income on leases and loans will be discontinued when the customer becomes ninety days or more past due on its lease or loan payments with the Company, unless the Company believes the investment is otherwise recoverable. Leases and loans may be placed on non-accrual earlier if the Company has significant doubt about the ability of the customer to meet its lease or loan obligations, as evidenced by consistent delinquency, deterioration in the customer’s financial condition or other relevant factors.
The following table summarizes the Company’s non-performing leases and loans.
|
June 30,
|
||||||||||||||||||||
|
Non-performing Leases and Loans
|
2014
|
2013
|
2012
|
2011
|
2010
|
|||||||||||||||
|
(dollars in thousands)
|
||||||||||||||||||||
|
Non-accrual leases and loans
|
$ | 47 | $ | 1,614 | $ | 529 | $ | 1,137 | $ | 789 | ||||||||||
|
Restructured leases
|
- | - | - | 1,441 | 8,150 | |||||||||||||||
|
Leases past due 90 days (other than above)
|
- | - | - | 45 | 411 | |||||||||||||||
|
Total non-performing leases and loans
|
$ | 47 | $ | 1,614 | $ | 529 | $ | 2,623 | $ | 9,350 | ||||||||||
|
Non-performing assets as % of net investment in leases and loans before allowances
|
0.01 | % | 0.4 | % | 0.2 | % | 0.9 | % | 3.6 | % | ||||||||||
Non-performing assets decreased during fiscal 2014 due to payments received on non-accrual leases with no new leases added. Direct finance income that would have been recorded had non-accrual leases at each respective fiscal year end been current in accordance with their original terms would have been $0, $50,168 and $12,248 during fiscal 2014, 2013 and 2012, respectively. The amount of direct finance income actually recorded on non-performing leases was $0, $195,200 and $70,364 during fiscal 2014, 2013 and 2012, respectively.
In addition to the transactions identified as non-performing above, there was $1.0 million of investment in leases and $10.5 million of loans at June 30, 2014 which are rated substandard and therefore at higher risk for not being able to meet their existing obligations. This compared to $727,000 of leases and $6.5 million of loans considered substandard at June 30, 2013. Although these substandard or doubtful leases and loans have been identified as potential problems, they may never become non-performing. These potential problem leases and loans are considered in the determination of the allowance for credit losses. The amount has fluctuated throughout the year ended June 30, 2014 as transactions have been reclassified and potential problems have been identified, with increases offset by payments received, re-classification as non-accrual or actual charge-offs.
Allowance for Credit Losses
The allowance for credit losses and the residual valuation allowance provide coverage for probable and estimatable losses in the Company’s lease and loan portfolios. The allowance recorded is based on a quarterly review of all leases and loans outstanding, loan commitments and transactions-in-process to determine that it is adequate to cover these inherent losses. The evaluation of each element and the overall allowance is based on a continuing assessment of problem credits, recent loss experience and other factors, including regulatory guidance and economic conditions. The Company utilizes similar processes to estimate its liability for unfunded loan commitments, which is included in other liabilities in the Consolidated Balance Sheets. Both the allowance for credit losses and the liability for unfunded loan commitments are included in the Company’s analysis of credit losses. Lease receivables, loans or residuals are charged off when they are deemed completely uncollectible. The determination of the appropriate amount of any provision is based on management’s judgment at that time and takes into consideration all known relevant internal and external factors that may affect the lease and loan portfolio.
27
California First National Bancorp and Subsidiaries
|
Years Ended June 30,
|
||||||||||||||||||||
|
2014
|
2013
|
2012
|
2011
|
2010
|
||||||||||||||||
|
(dollars in thousands)
|
||||||||||||||||||||
|
Property acquired for transactions-in-process before allowance
|
$ | 40,578 | $ | 11,938 | $ | 18,559 | $ | 29,210 | $ | 27,088 | ||||||||||
|
Net investment in leases before allowance
|
329,935 | 345,753 | 256,686 | 226,426 | 195,067 | |||||||||||||||
|
Commercial loans, before allowance
|
131,158 | 75,952 | 84,982 | 95,797 | 66,931 | |||||||||||||||
|
Net investment in “risk assets”
|
$ | 501,671 | $ | 433,643 | $ | 360,227 | $ | 351,433 | $ | 289,086 | ||||||||||
|
Allowance for credit losses at beginning of year
|
5,147 | 5,216 | 5,060 | 4,447 | 4,810 | |||||||||||||||
|
Charge-off of lease receivables and transactions-in-process
|
(62 | ) | (350 | ) | (51 | ) | (557 | ) | (795 | ) | ||||||||||
|
Recovery of amounts previously written off
|
14 | 6 | 207 | 145 | 82 | |||||||||||||||
|
Provision for credit losses
|
200 | 275 | 0 | 1,025 | 350 | |||||||||||||||
|
Allowance for credit losses at end of year (“Allowance”)
|
$ | 5,299 | $ | 5,147 | $ | 5,216 | $ | 5,060 | $ | 4,447 | ||||||||||
|
Components of allowance for credit losses:
|
||||||||||||||||||||
|
Allowance for lease losses
|
$ | 3,316 | $ | 3,164 | $ | 3,133 | $ | 2,977 | $ | 2,682 | ||||||||||
|
Allowance for loan losses
|
1,972 | 1,972 | 2,072 | 2,072 | 1,522 | |||||||||||||||
|
Allowance for transactions in process
|
11 | 11 | 11 | 11 | 243 | |||||||||||||||
| $ | 5,299 | $ | 5,147 | $ | 5,216 | $ | 5,060 | $ | 4,447 | |||||||||||
|
Allowance as percent of net investment in leases and loans before allowances
|
1.1 | % | 1.2 | % | 1.5 | % | 1.6 | % | 1.7 | % | ||||||||||
|
Allowance as percent of net investment in “risk assets”
|
1.1 | % | 1.2 | % | 1.4 | % | 1.4 | % | 1.5 | % | ||||||||||
The allowance for credit losses increased to $5.3 million (1.1% of net investment in leases and loans) at June 30, 2014 from $5.1 million (1.2% of net investment in leases and loans) at June 30, 2013. The allowance at June 30, 2014 consisted of $250,000 allocated to specific accounts that were identified as problems and $5.0 million that was available to cover losses inherent in the portfolio. This compared to $473,000 allocated to specific accounts at June 30, 2013 and $4.67 million that was available to cover losses inherent in the portfolio at such date. The decrease in the allowance allocated to specific accounts related to charge-offs of $62,000 as well as the resolution of problem leases offset in part by new specific problems identified. Based on the above factors, the Company considers the allowance for credit losses of $5.3 million at June 30, 2014 adequate to cover losses specifically identified as well as inherent in the lease and loan portfolios. However, no assurance can be given that the Company will not, in any particular period, sustain lease and loan losses that are sizeable in relation to the amount reserved, or that subsequent evaluations of the lease portfolio, in light of factors then prevailing, including economic conditions and the on-going credit review process, will not require significant increases in the allowance for credit losses. Among other factors, a renewed economic slowdown may have an adverse impact on the adequacy of the allowance for credit losses by increasing credit risk and the risk of potential loss even further. As the Company has retained a significantly greater percentage of leases and loans in its own portfolio, this creates increased exposure to delinquencies, repossessions, foreclosures and losses than the Company has historically experienced.
Liquidity and Capital Resources
The Company funds its operating activities through internally generated funds, bank deposits and non-recourse debt. At June 30, 2014 and 2013, the Company’s cash and cash equivalents were $40.1 million and $75.5 million, respectively. Stockholders’ equity at June 30, 2014 was $183.7 million, or 31.7% of total assets, compared to $180.9 million, or 32.4% of total assets, at June 30, 2013. At June 30, 2014, the Company and the Bank exceed their regulatory capital requirements and are considered “well-capitalized” under guidelines established by the FRB and the OCC.
28
California First National Bancorp and Subsidiaries
Deposits at CalFirst Bank totaled $355.8 million at June 30, 2014, up 2.8% from $346.0 million at June 30, 2013 and up 40.5% from $253.3 million at June 30, 2012. The Bank is competitive with major institutions in terms of its structure of interest rates, and generally offers interest rates on deposit accounts that are higher than the national average. Average rates paid by the Bank on deposits have declined in varying degrees in response to the general decrease in market rates and the maturing of term deposits raised at higher rates. The following table presents average balances and average rates paid on deposits for years ended June 30, 2014, 2013 and 2012:
|
Years ended June 30,
|
||||||||||||||||||||||||||||||||||||
|
2014
|
2013
|
2012
|
||||||||||||||||||||||||||||||||||
|
(dollars in thousands)
|
||||||||||||||||||||||||||||||||||||
|
Ending
Balance |
Average
Balance |
Average
Rate |
Ending
Balance |
Average
Balance |
Average
Rate |
Ending
Balance |
Average
Balance |
Average
Rate |
||||||||||||||||||||||||||||
|
Non-interest bearing demand deposits
|
$ | 1,060 | $ | 1,785 | n/a | $ | 1,402 | $ | 1,993 | n/a | $ | 1,564 | $ | 2,199 | n/a | |||||||||||||||||||||
|
Interest-bearing demand deposits
|
1,167 | 1,607 | 0.20 | % | 2,205 | 2,399 | 0.20 | % | 2,672 | 2,430 | 0.27 | % | ||||||||||||||||||||||||
|
Savings deposits
|
63,356 | 66,543 | 0.50 | % | 68,339 | 78,922 | 0.50 | % | 74,921 | 80,328 | 0.58 | % | ||||||||||||||||||||||||
|
Time deposits less than $100,000
|
52,647 | 51,426 | 1.00 | % | 53,150 | 48,317 | 1.06 | % | 45,316 | 50,092 | 1.37 | % | ||||||||||||||||||||||||
|
Time deposits, $100,000 or more
|
$ | 237,580 | $ | 220,267 | 0.99 | % | $ | 220,932 | $ | 166,944 | 1.03 | % | $ | 128,824 | $ | 128,221 | 1.28 | % | ||||||||||||||||||
The following table shows the maturities of certificates of deposits at the dates indicated:
|
June 30, 2014
|
|||||||||
|
$250,000
Or less |
More than
$250,000 |
||||||||
|
(in thousands)
|
|||||||||
|
Under 3 months
|
$ | 34,723 | $ | 8,855 | |||||
|
3 – 6 months
|
43,091 | 8,853 | |||||||
|
7 – 12 months
|
117,975 | 16,955 | |||||||
|
13 – 24 months
|
40,440 | 12,084 | |||||||
|
25 – 36 months
|
6,730 | 521 | |||||||
| $ | 242,959 | $ | 47,268 | ||||||
The Bank has borrowing agreements with the Federal Home Loan Bank of San Francisco (“FHLB”) and as such, can take advantage of FHLB programs for overnight and term advances at published daily rates. The Bank has a short-term borrowing outstanding of $6.9 million at June 30, 2014 at an average rate of 0.25% and had no outstanding balance at June 30, 2013. Under terms of the blanket collateral agreement, advances from the FHLB are collateralized by qualifying securities and real estate loans, with $3.1 million available under the agreement as of June 30, 2014. The Bank also has the authority to borrow from the Federal Reserve Bank (“FRB”) discount window amounts secured by certain lease receivables with unused borrowing availability at June 30, 2014 of approximately $107.4 million.
The Company periodically funds certain leases by selling or assigning certain lease term payments to banks or other financial institutions. If the lease receivables are characterized as a sale of the financial asset, the lease is removed from the balance sheet and a resulting gain or loss recognized. If the Company retains an interest in the lease, the assignment is considered a secured borrowing with the associated financing characterized as non-recourse debt. The assigned lease payments are discounted at fixed rates such that the lease payments are sufficient to fully amortize the aggregate outstanding debt. During fiscal 2014, the Company sold or assigned net lease receivables aggregating to $33.5 million, of which $24.6 million were characterized as sales and $8.9 million were retained as assets by the Bank. This compared to leases sold or assigned of $6.5 million and $5.9 million for fiscal 2013 and 2012, respectively. At June 30, 2014, the Company had outstanding non-recourse debt aggregating $8.6 million relating to property under leases assigned to unaffiliated parties. In the past, the Company has been able to obtain adequate non-recourse funding commitments, and the Company believes it will be able to do so in the future.
29
California First National Bancorp and Subsidiaries
Contractual Obligations and Commitments
The following table summarizes various contractual obligations at June 30, 2014. Commitments to purchase property for unfunded leases are binding but generally have fixed expiration dates and other termination clauses. Commercial loan commitments are agreements to purchase participation or lend to a customer provided there is no violation of any condition in the contract. These commitments generally have fixed expiration dates or other termination clauses. Since the Company expects some of the commitments to expire without being funded, the total commitment amounts do not necessarily represent the Company’s future liquidity requirements.
|
Due by Period
|
||||||||||||||||
|
Contractual Obligations
|
Total
|
Less Than
1 Year |
1-5 Years
|
After
5 Years |
||||||||||||
|
(in thousands)
|
||||||||||||||||
|
Lease property purchases (1)
|
$ | 83,269 | $ | 83,269 | $ | - | $ | - | ||||||||
|
Commercial loan and lease purchase commitments
|
14,835 | 14,835 | - | - | ||||||||||||
|
FHLB Borrowings
|
6,858 | 6,858 | - | - | ||||||||||||
|
Operating lease rental payments
|
2,815 | 629 | 2,186 | - | ||||||||||||
|
Total contractual commitments
|
$ | 107,777 | $ | 105,591 | $ | 2,186 | $ | - | ||||||||
|
(1)
|
Disbursements to purchase property on approved lease or loan commitments are estimated to be completed within one year, but it is likely that some portion could be deferred or never funded.
|
The need for cash for operating activities will increase as the Company expands. The Company believes that existing cash balances, cash flow from operations, cash flows from its financing and investing activities, and assignments (on a non-recourse basis) of lease payments will be sufficient to meet its foreseeable financing needs.
Inflation has not had a significant impact upon the operations of the Company.
Recent Accounting Pronouncements
See Note 1, “Summary of Significant Accounting Policies,” of the Company’s consolidated financial statements for disclosure of recent accounting pronouncements.
ITEM 7A. QUANTITATIVE AND QUALITATIVE DISCLOSURES ABOUT MARKET RISK
Market risk is the risk of loss in a financial instrument arising from changes in market indices such as interest rates and equity prices. The Company’s principal market risk exposure is interest rate risk, which is the exposure due to differences in the repricing characteristics of interest-earning assets and interest-bearing liabilities. Market risk also arises from the impact that fluctuations in interest rates may have on security prices that may result in changes in the values of financial instruments, such as available-for-sale securities that are accounted for at fair value. As the banking operations of the Company have grown and securities and deposits represent a greater portion of the Company’s assets and liabilities, the Company is subject to increased market risk. The Bank has an Asset/Liability Management Committee and policies established to manage its interest rate and market risk.
At June 30, 2014, the Company had $47.2 million of cash or invested in securities of very short duration, with another $5.2 million of securities that mature within twelve months. The Company’s gross investment in lease payments receivable and loan principal of $484.8 million consists of leases with fixed rates and loans with fixed and variable rates, however, $259.3 million of such investment is due or will reprice within one year of June 30, 2014. This compares to the Bank’s interest bearing deposit and borrowing liabilities of $361.6 million, of which 83.5%, or $301.8 million, mature within one year. CalFirst Leasing has no interest-bearing debt, and non-recourse debt does not represent an interest rate risk to the Company because it is fully amortized through direct payments from lessees to the purchaser of the lease receivable. Based on the foregoing, at June 30, 2014 the Company had assets of $311.7 million subject to changes in interest rates over the next twelve months, compared to repricing liabilities of $301.8 million.
30
California First National Bancorp and Subsidiaries
The consolidated gap analysis below sets forth the maturity and repricing characteristics of interest-earning assets and interest-bearing liabilities for selected time bands. The mismatch between repricings or maturities within a time band is commonly referred to as the “gap” for that period. A positive gap (asset sensitive) where interest rate sensitive assets exceed interest rate sensitive liabilities generally will result in the net interest margin increasing in a rising rate environment and decreasing in a falling rate environment. A negative gap (liability sensitive) will generally have the opposite result on the net interest margin. However, the traditional gap analysis does not assess the relative sensitivity of assets and liabilities to changes in interest rates and other factors that could have an impact on interest rate sensitivity or net interest income. Sudden and substantial increase or decrease in interest rates may adversely impact our income to the extent that the interest rates associated with the assets and liabilities do not change at the same speed, to the same extent, or on the same basis.
Consolidated Interest Rate Sensitivity
|
(in thousands)
|
3 Months
or Less |
Over 3 to
12 Months |
Over 1
Through |
Over
5 years |
Non-rate
Sensitive |
Total
|
||||||||||||||||||
|
Rate Sensitive Assets (RSA):
|
||||||||||||||||||||||||
|
Cash due from banks
|
$ | 40,122 | $ | - | $ | - | $ | - | $ | - | $ | 40,122 | ||||||||||||
|
Investment securities
|
7,084 | 5,168 | 14,512 | 2,552 | - | 29,316 | ||||||||||||||||||
|
Net investment in leases
|
41,906 | 102,492 | 195,398 | 13,411 | (26,588 | ) | 326,619 | |||||||||||||||||
|
Commercial loans
|
114,007 | 900 | 16,720 | - | (2,441 | ) | 129,186 | |||||||||||||||||
|
Non-interest earning assets
|
- | - | - | - | 54,307 | 54,307 | ||||||||||||||||||
|
Totals
|
203,119 | 108,560 | 226,630 | 15,963 | 25,278 | $ | 579,550 | |||||||||||||||||
|
Cumulative total for RSA
|
$ | 203,119 | $ | 311,679 | $ | 538,309 | $ | 554,272 | ||||||||||||||||
|
Rate Sensitive Liabilities (RSL):
|
||||||||||||||||||||||||
|
Demand and savings deposits
|
$ | 64,523 | $ | - | $ | - | $ | - | $ | 1,060 | $ | 65,583 | ||||||||||||
|
Time deposits
|
43,578 | 186,874 | 59,775 | - | - | 290,227 | ||||||||||||||||||
|
Borrowings
|
- | 6,858 | - | - | - | 6,858 | ||||||||||||||||||
|
Non-interest bearing liabilities
|
- | - | - | - | 33,137 | 33,137 | ||||||||||||||||||
|
Stockholders' equity
|
- | - | - | - | 183,745 | 183,745 | ||||||||||||||||||
|
Totals
|
$ | 108,101 | $ | 193,732 | $ | 59,775 | $ | - | $ | 217,942 | $ | 579,550 | ||||||||||||
|
Cumulative total for RSL
|
$ | 108,101 | $ | 301,833 | $ | 361,608 | $ | 361,608 | ||||||||||||||||
|
Interest rate sensitivity gap
|
$ | 95,018 | $ | (85,172 | ) | $ | 166,855 | $ | 15,963 | |||||||||||||||
|
Cumulative GAP
|
$ | 95,018 | $ | 9,846 | $ | 176,701 | $ | 192,664 | ||||||||||||||||
|
RSA divided by RSL (cumulative)
|
187.90 | % | 103.26 | % | 148.87 | % | 153.28 | % | ||||||||||||||||
|
Cumulative GAP / total assets
|
16.40 | % | 1.70 | % | 30.50 | % | 33.25 | % | ||||||||||||||||
In addition to the consolidated gap analysis, the Bank measures its asset/liability position through duration measures and sensitivity analysis, and calculates the potential effect on earnings using maturity gap analysis. The interest rate sensitivity modeling includes the creation of prospective twelve month "baseline" and "rate shocked" net interest income simulations. After a "baseline" net interest income is determined, using assumptions that the Bank deems reasonable, market interest rates are raised or lowered by 100 to 300 basis points instantaneously, parallel across the entire yield curve, and a "rate shocked" simulation is run. Interest rate sensitivity is then measured as the difference between calculated "baseline" and "rate shocked" net interest income.
31
California First National Bancorp and Subsidiaries
ITEM 8. FINANCIAL STATEMENTS AND SUPPLEMENTARY DATA
The following financial statements and supplementary financial information are included herein at the pages indicated below:
|
Page
|
|
REPORT OF INDEPENDENT REGISTERED PUBLIC ACCOUNTING FIRM
To the Board of Directors and Stockholders of California First National Bancorp
We have audited the accompanying consolidated balance sheets of California First National Bancorp and Subsidiaries as of June 30, 2014 and 2013 and the related consolidated statements of earnings, comprehensive income, stockholders' equity, and cash flows for each of the three years in the period ended June 30, 2014. These consolidated financial statements are the responsibility of the Company's management. Our responsibility is to express an opinion on these consolidated financial statements based on our audits.
We conducted our audits in accordance with the standards of the Public Company Accounting Oversight Board (United States). Those standards require that we plan and perform the audit to obtain reasonable assurance about whether the consolidated financial statements are free of material misstatement. The Company is not required to have, nor were we engaged to perform, an audit of its internal control over financial reporting. Our audit included consideration of internal control over financial reporting as a basis for designing audit procedures that are appropriate in the circumstances, but not for the purpose of expressing an opinion on the effectiveness of the Company’s internal control over financial reporting. Accordingly, we express no such opinion. An audit includes examining, on a test basis, evidence supporting the amounts and disclosures in the consolidated financial statements. An audit also includes assessing the accounting principles used and significant estimates made by management, as well as evaluating the overall financial statement presentation. We believe that our audits provide a reasonable basis for our opinion.
In our opinion, the consolidated financial statements referred to above present fairly, in all material respects, the financial position of California First National Bancorp and Subsidiaries as of June 30, 2014 and 2013, and the results of its operations and its cash flows for each of the three years in the period ended June 30, 2014, in conformity with accounting principles generally accepted in the United States of America.

Laguna Hills, California
September 23, 2014
32
California First National Bancorp and Subsidiaries
CONSOLIDATED BALANCE SHEETS
(in thousands, except share amounts)
|
June 30,
|
|||||||||
|
ASSETS
|
2014
|
2013
|
|||||||
|
Cash and due from banks
|
$ | 40,122 | $ | 75,469 | |||||
|
Investments
|
2,552 | 2,640 | |||||||
|
Securities available-for-sale
|
26,764 | 45,522 | |||||||
|
Receivables
|
680 | 1,395 | |||||||
|
Property acquired for transactions-in-process
|
40,567 | 11,927 | |||||||
|
Leases and loans:
|
|||||||||
|
Net investment in leases
|
329,935 | 345,753 | |||||||
|
Commercial loans
|
131,158 | 75,952 | |||||||
|
Allowance for credit losses
|
(5,288 | ) | (5,136 | ) | |||||
|
Net investment in leases and loans
|
455,805 | 416,569 | |||||||
|
Property on operating leases, less accumulated depreciation of $143 (2014) and $65 (2013)
|
1,991 | 455 | |||||||
|
Income tax receivable
|
1,658 | 3,301 | |||||||
|
Other assets
|
771 | 857 | |||||||
|
Discounted lease rentals assigned to lenders
|
8,640 | 768 | |||||||
| $ | 579,550 | $ | 558,903 | ||||||
|
LIABILITIES AND STOCKHOLDERS’ EQUITY
|
|||||||||
|
Liabilities:
|
|||||||||
|
Accounts payable
|
$ | 4,655 | $ | 8,849 | |||||
|
Accrued liabilities
|
2,553 | 2,156 | |||||||
|
Demand and savings deposits
|
65,583 | 71,946 | |||||||
|
Time certificates of deposit
|
290,227 | 274,082 | |||||||
|
Short-term borrowings
|
6,858 | - | |||||||
|
Lease deposits
|
2,005 | 1,648 | |||||||
|
Non-recourse debt
|
8,640 | 768 | |||||||
|
Deferred income taxes, net
|
15,284 | 18,575 | |||||||
| 395,805 | 378,024 | ||||||||
|
Commitments and contingencies
|
|||||||||
|
Stockholders' equity:
|
|||||||||
|
Preferred stock; 2,500,000 shares authorized; none issued
|
- | - | |||||||
|
Common stock; $.01 par value; 20,000,000 shares authorized; 10,459,924 (2014) and 10,447,227 (2013) issued and outstanding
|
105 | 104 | |||||||
|
Additional paid in capital
|
3,372 | 3,213 | |||||||
|
Retained earnings
|
179,844 | 176,972 | |||||||
|
Accumulated other comprehensive income, net of tax
|
424 | 590 | |||||||
| 183,745 | 180,879 | ||||||||
| $ | 579,550 | $ | 558,903 | ||||||
The accompanying notes are an integral part of these consolidated financial statements.
33
California First National Bancorp and Subsidiaries
CONSOLIDATED STATEMENTS OF EARNINGS
(in thousands, except share and per share amounts)
|
Years ended June 30,
|
||||||||||||
|
2014
|
2013
|
2012
|
||||||||||
|
Direct finance and loan income
|
$ | 18,370 | $ | 18,995 | $ | 20,505 | ||||||
|
Investment interest income
|
1,371 | 2,408 | 3,133 | |||||||||
|
Total finance, loan and interest income
|
19,741 | 21,403 | 23,638 | |||||||||
|
Interest expense
|
||||||||||||
|
Deposits
|
3,036 | 2,664 | 2,803 | |||||||||
|
Borrowings
|
1 | - | 111 | |||||||||
|
Net finance, loan and interest income
|
16,704 | 18,739 | 20,724 | |||||||||
|
Provision for credit losses
|
200 | 275 | - | |||||||||
|
Net finance, loan and interest income after provision for credit losses
|
16,504 | 18,464 | 20,724 | |||||||||
|
Non-interest income
|
||||||||||||
|
Operating and sales-type lease income
|
2,152 | 1,711 | 2,755 | |||||||||
|
Gain on sale of leases, loans and leased property
|
2,980 | 2,278 | 2,478 | |||||||||
|
Realized gain on sale of investment securities
|
- | 316 | 56 | |||||||||
|
Other fee income
|
432 | 526 | 569 | |||||||||
|
Total non-interest income
|
5,564 | 4,831 | 5,858 | |||||||||
|
Non-interest expenses
|
||||||||||||
|
Compensation and employee benefits
|
7,796 | 8,505 | 9,037 | |||||||||
|
Occupancy
|
682 | 922 | 936 | |||||||||
|
Professional services
|
590 | 585 | 578 | |||||||||
|
Other general and administrative
|
1,927 | 1,598 | 1,756 | |||||||||
|
Total non-interest expenses
|
10,995 | 11,610 | 12,307 | |||||||||
|
Earnings before income taxes
|
11,073 | 11,685 | 14,275 | |||||||||
|
Income taxes
|
4,022 | 4,331 | 5,372 | |||||||||
|
Net earnings
|
$ | 7,051 | $ | 7,354 | $ | 8,903 | ||||||
|
Basic earnings per common share
|
$ | 0.67 | $ | 0.70 | $ | 0.85 | ||||||
|
Diluted earnings per common share
|
$ | 0.67 | $ | 0.70 | $ | 0.85 | ||||||
|
Dividends declared per common share outstanding
|
$ | 0.40 | $ | 2.20 | $ | 1.10 | ||||||
|
Average common shares outstanding – basic
|
10,453,107 | 10,446,347 | 10,419,961 | |||||||||
|
Average common shares outstanding – diluted
|
10,456,359 | 10,453,361 | 10,429,359 | |||||||||
The accompanying notes are an integral part of these consolidated financial statements.
34
California First National Bancorp and Subsidiaries
CONSOLIDATED STATEMENTS OF COMPREHENSIVE INCOME
(in thousands)
|
Years ended June 30,
|
||||||||||||
|
2014
|
2013
|
2012
|
||||||||||
|
Net earnings
|
$ | 7,051 | $ | 7,354 | $ | 8,903 | ||||||
|
Other comprehensive income/(loss):
|
||||||||||||
|
Unrealized gain/(loss) on securities available-for-sale
|
(266 | ) | 157 | (1,265 | ) | |||||||
|
Reclassification adjustment of realized gain included in net income on securities available-for-sale
|
- | (316 | ) | (56 | ) | |||||||
| (266 | ) | (159 | ) | (1,321 | ) | |||||||
|
Tax effect
|
100 | 61 | 502 | |||||||||
|
Total other comprehensive income/(loss)
|
(166 | ) | (98 | ) | (819 | ) | ||||||
|
Total comprehensive income
|
$ | 6,885 | $ | 7,256 | $ | 8,084 | ||||||
The accompanying notes are an integral part of these consolidated financial statements.
35
California First National Bancorp and Subsidiaries
CONSOLIDATED STATEMENTS OF STOCKHOLDERS' EQUITY
(in thousands, except for share amounts)
|
Common Stock
|
Additional
Paid in |
Retained
|
Accumulated
Comprehensive |
||||||||||||||||||||
|
Shares
|
Amount
|
Capital
|
Earnings
|
Income
|
Total
|
||||||||||||||||||
|
Balance, June 30, 2011
|
10,417,597 | $ | 104 | $ | 2,849 | $ | 195,162 | $ | 1,507 | $ | 199,622 | ||||||||||||
|
Net earnings
|
- | - | - | 8,903 | - | 8,903 | |||||||||||||||||
|
Other comprehensive loss
|
- | - | - | - | (819 | (819 | ) | ||||||||||||||||
|
Shares issued - Stock options exercised
|
16,087 | - | 195 | - | - | 195 | |||||||||||||||||
|
Dividends declared
|
- | - | - | (11,462 | ) | - | (11,462 | ) | |||||||||||||||
|
Balance, June 30, 2012
|
10,433,684 | 104 | 3,044 | 192,603 | 688 | 196,439 | |||||||||||||||||
|
Net earnings
|
- | - | - | 7,354 | - | 7,354 | |||||||||||||||||
|
Other comprehensive loss
|
- | - | - | - | (98 | (98 | ) | ||||||||||||||||
|
Shares issued - Stock options exercised
|
13,543 | - | 164 | - | - | 164 | |||||||||||||||||
|
Stock based compensation expense
|
- | - | 5 | - | - | 5 | |||||||||||||||||
|
Dividends declared
|
- | - | - | (22,985 | ) | - | (22,985 | ) | |||||||||||||||
|
Balance, June 30, 2013
|
10,447,227 | 104 | 3,213 | $ | 176,972 | 590 | 180,879 | ||||||||||||||||
|
Net earnings
|
- | - | - | 7,051 | - | 7,051 | |||||||||||||||||
|
Other comprehensive loss
|
- | - | - | - | (166 | (166 | ) | ||||||||||||||||
|
Shares issued - Stock options exercised
|
12,697 | 1 | 155 | - | - | 156 | |||||||||||||||||
|
Stock based compensation expense
|
- | - | 4 | - | - | 4 | |||||||||||||||||
|
Dividends declared
|
- | - | - | (4,179 | ) | - | (4,179 | ) | |||||||||||||||
|
Balance, June 30, 2014
|
10,459,924 | $ | 105 | $ | 3,372 | $ | 179,844 | $ | 424 | $ | 183,745 | ||||||||||||
The accompanying notes are an integral part of these consolidated financial statements.
36
California First National Bancorp and Subsidiaries
CONSOLIDATED STATEMENTS OF CASH FLOWS
(in thousands)
|
Years ended June 30,
|
||||||||||||
|
2014
|
2013
|
2012
|
||||||||||
|
CASH FLOWS FROM OPERATING ACTIVITIES:
|
||||||||||||
|
Net Earnings
|
$ | 7,051 | $ | 7,354 | $ | 8,903 | ||||||
|
Adjustments to reconcile net earnings to cash flows provided by (used for) operating activities:
|
||||||||||||
|
Provision for credit losses
|
200 | 275 | - | |||||||||
|
Depreciation and net amortization (accretion)
|
76 | (679 | ) | (757 | ) | |||||||
|
Stock-based compensation expense
|
4 | 5 | - | |||||||||
|
Gain on sale of leased property and sales-type lease income
|
(396 | ) | (739 | ) | (1,414 | ) | ||||||
|
Net gain recognized on investment securities
|
- | (316 | ) | (56 | ) | |||||||
|
Deferred income taxes, including income taxes payable
|
(3,178 | ) | (5,477 | ) | 65 | |||||||
|
Decrease (increase) in income taxes receivable
|
1,643 | (2,421 | ) | 498 | ||||||||
|
Net decrease in accounts payable and accrued liabilities
|
397 | (643 | ) | (243 | ) | |||||||
|
Other, net
|
669 | (55 | ) | (107 | ) | |||||||
|
Net cash provided by (used for) operating activities
|
6,466 | (2,696 | ) | 6,889 | ||||||||
|
CASH FLOWS FROM INVESTING ACTIVITIES:
|
||||||||||||
|
Investment in leases, loans and transactions in process
|
(302,722 | ) | (298,982 | ) | (182,526 | ) | ||||||
|
Payments received on lease receivables and loans
|
188,965 | 220,756 | 166,451 | |||||||||
|
Proceeds from sales of leased property and sales-type leases
|
5,796 | 6,545 | 6,151 | |||||||||
|
Proceeds from sales or assignment of leases
|
35,573 | 4,835 | 7,834 | |||||||||
|
Purchase of investment securities
|
(8,229 | ) | - | (21,960 | ) | |||||||
|
Pay down on investment securities
|
26,188 | 7,515 | 16,472 | |||||||||
|
Proceeds from sale of investment securities
|
- | 10,425 | 3,067 | |||||||||
|
Net (increase) decrease in other assets
|
(1 | ) | 240 | (14 | ) | |||||||
|
Net cash used for investing activities
|
(54,430 | ) | (48,666 | ) | (4,525 | ) | ||||||
|
CASH FLOWS FROM FINANCING ACTIVITIES:
|
||||||||||||
|
Net increase (decrease) in time certificates of deposit
|
16,145 | 99,942 | (12,002 | ) | ||||||||
|
Net decrease in demand and savings deposits
|
(6,363 | ) | (7,211 | ) | (9,476 | ) | ||||||
|
Net increase (decrease) in short-term borrowings
|
6,858 | 0 | (10,000 | ) | ||||||||
|
Dividends to stockholders
|
(4,179 | ) | (22,985 | ) | (11,462 | ) | ||||||
|
Proceeds from exercise of stock options
|
156 | 164 | 195 | |||||||||
|
Net cash provided by (used for) financing activities
|
12,617 | 69,910 | (42,745 | ) | ||||||||
|
NET CHANGE IN CASH AND CASH EQUIVALENTS
|
(35,347 | ) | 18,548 | (40,381 | ) | |||||||
|
CASH AND CASH EQUIVALENTS AT BEGINNING OF PERIOD
|
75,469 | 56,921 | 97,302 | |||||||||
|
CASH AND CASH EQUIVALENTS AT END OF PERIOD
|
$ | 40,122 | $ | 75,469 | $ | 56,921 | ||||||
|
SUPPLEMENTAL SCHEDULE OF NONCASH INVESTING AND FINANCING ACTIVITIES
|
||||||||||||
|
Increase (decrease) in lease rentals assigned to lenders and related non-recourse debt
|
$ | 7,872 | $ | (2,507 | ) | $ | (5,173 | ) | ||||
|
Estimated residual values recorded on leases
|
$ | (3,556 | ) | $ | (2,050 | ) | $ | (2,590 | ) | |||
|
SUPPLEMENTAL DISCLOSURES OF CASH FLOW INFORMATION
|
||||||||||||
|
Net cash paid (refunds received) during the year for:
|
||||||||||||
|
Interest
|
$ | 3,045 | $ | 2,640 | $ | 3,063 | ||||||
|
Income Taxes
|
$ | 5,557 | $ | 12,229 | $ | 4,859 | ||||||
The accompanying notes are an integral part of these consolidated financial statements.
37
California First National Bancorp and Subsidiaries
NOTES TO CONSOLIDATED FINANCIAL STATEMENTS
Note 1 - Summary of Significant Accounting Policies:
Nature of Operations
California First National Bancorp, a California corporation (the “Company”) is a bank holding company with two subsidiaries, California First National Bank (“CalFirst Bank” or the “Bank”) and California First Leasing Corp. (“CalFirst Leasing”). The primary business of the Company is leasing and financing capital assets, while CalFirst Bank also participates in the syndicated commercial loan market, provides business loans to fund the purchase of assets leased by third parties, and offers commercial loans directly to businesses. CalFirst Bank gathers deposits from a centralized location primarily through posting rates on the Internet. All banking and other operations are conducted from one central location.
Basis of Presentation
The consolidated financial statements include the accounts of California First National Bancorp and its wholly owned subsidiaries, CalFirst Bank and CalFirst Leasing. All intercompany balances and transactions have been eliminated in consolidation.
The preparation of financial statements in conformity with accounting principles generally accepted in the United States requires management to make estimates and assumptions that affect the reported amounts of assets and liabilities and disclosure of contingent assets and liabilities at the date of the financial statements and the reported amounts of revenues and expenses during the reporting period. Critical accounting estimates particularly susceptible to change include the allowance for credit losses, residual values and taxes. Actual results could differ from those estimates.
Cash and Cash Equivalents
For purposes of these statements, cash and cash equivalents include cash in banks, cash in demand deposit accounts, and money market accounts, all of which have initial maturities of less than ninety days. Included in cash and cash equivalents at June 30, 2014 and 2013 was $32,467,189 and $31,748,114, respectively, that was held by the Bank.
Securities
Securities are designated at the time of acquisition as available for sale or held to maturity. Securities that the Company will hold for indefinite periods of time and that might be sold in the future as part of efforts to manage interest rate risk, or in response to changes in interest rates, changes in prepayment rates, changes in market conditions or changes in economic factors are classified as available for sale and carried at fair values. Net aggregate unrealized gains or losses are reported, net of taxes, as a component of comprehensive income. Securities that the Company has the intent and ability to hold until maturity are classified as Investments “held-to-maturity” and are stated at cost adjusted for amortization of premium or accretion of discount. The Company does not have any securities classified as trading.
The Company conducts a regular assessment of its securities portfolio to determine whether any are other-than-temporarily impaired. In estimating other-than-temporary impairment losses, management considers, among other factors, the length of time and extent to which the fair value has been less than cost, the financial condition and near term prospects of the issuer, and the intent and ability of the Company to retain its investment for a period of time sufficient to allow for any anticipated recovery. The term “other-than-temporary” is not intended to indicate that the decline is permanent, but indicates that the prospects for a near-term recovery of value is not necessarily favorable, or that there is a lack of evidence to support a realizable value equal to or greater than the carrying value of the investment. Once a decline in value for a debt security is determined to be other-than-temporary, the other-than-temporary impairment is separated into (a) the amount of the total other-than-temporary impairment related to a decrease in cash flows expected to be collected from the debt security (the credit loss) and (b) the amount of the total other-than-temporary impairment related to all other factors. The amount of the total other-than-temporary impairment related to the credit loss is recognized in other income. The amount of the total other-than-temporary impairment related to all other factors is recognized in other comprehensive income. For equity securities, the full amount of the other-than-temporary impairment is recorded in non-interest income as an impairment loss on investment securities.
38
California First National Bancorp and Subsidiaries
Leases
Capital Leases
New lease transactions are generally structured as direct financing leases. The re-lease of property that has come off lease may be accounted for as a sales-type lease or as an operating lease, depending on the terms of the re-lease. Leased property that comes off lease and is re-marketed through a sale to the lessee or a third party is accounted for as sale of leased property.
For leases that qualify as direct financing leases, the aggregate lease payments receivable and estimated residual value, if any, are recorded net of unearned income as net investment in leases. The unearned income is recognized as direct finance income on an internal rate of return method calculated to achieve a level yield on the Company’s investment over the lease term. There are no costs or expenses related to direct financing leases since lease income is recorded on a net basis.
For leases that qualify as sales-type leases, the Company recognizes profit or loss at lease inception to the extent the fair value of the property leased differs from the Company's carrying value. The difference between the discounted value of the aggregate lease payments receivable and the property cost, less the discounted value of the residual, if any, and any initial direct costs is recorded as sales-type lease income. For balance sheet purposes, the aggregate lease payments receivable, and estimated residual value, if any, are recorded net of unearned income as net investment in leases. Unearned income is recognized as direct finance income over the lease term on an internal rate of return method.
The residual value is an estimate for accounting purposes of the fair value of the lease property at lease termination. The estimates are reviewed periodically to ensure reasonableness, however, the amounts the Company may ultimately realize could differ from the estimated amounts.
In some instances, the Company assigns on a nonrecourse basis the lease payments receivable related to direct financing leases to unaffiliated financial institutions at fixed interest rates. The accounting for the sale of lease receivables is governed by Financial Accounting Standards Board (“FASB”) Accounting Standards Codification (“ASC”) 860 Transfer and Servicing, which establishes a framework for determining which assignments should be treated as a sale of the financial asset by the Company or a secured borrowing through retention of the lease as an asset and reporting of non-recourse debt. For lease receivables accounted for as a sale, the Company derecognizes the lease receivable and the unearned income related to the lease is recognized as a gain from the sale of lease receivable in the period in which the lease receivable has been sold. For lease receivables accounted for as a secured borrowing, the minimum lease payments receivable is re-categorized on the balance sheet as discounted lease rentals assigned to lenders. The related obligations resulting from the discounting of the leases are recorded as non-recourse debt. The unearned income related to the lease is reduced by the interest expense from the non-recourse debt. In the event of default by a lessee, the lender has a first lien against the underlying leased property with no further recourse against the Company. If this occurs, the Company may not realize its residual investment in the leased property.
A portion of the Company's non-interest expenses directly related to originating direct financing lease transactions is deferred through a reduction to non-interest expenses recognized in the period, with the deferred costs amortized over the lease term as a reduction to direct finance income utilizing the effective interest method.
Operating Leases
Lease contracts which do not meet the criteria of capital leases are accounted for as operating leases. Property on operating leases is recorded at the lower of cost or fair value and depreciated on a straight-line basis over the lease term to the estimated residual value at the termination of the lease. Most operating leases involve the re-lease of off-lease property and the associated cost is the Company’s estimated residual. Rental income is recorded on a straight-line basis over the lease term.
39
California First National Bancorp and Subsidiaries
Loans
Loans are reported at their principal amount outstanding, net of unearned discounts and unamortized nonrefundable fees and direct costs associated with their origination or acquisition. Interest earned on loans without discounts is credited to income based on loan principal amounts outstanding at appropriate interest rates. Material origination and other nonrefundable fees net of direct costs and discounts on loans are credited to income over the terms of the loans using a method that approximates an effective yield.
Allowance for Credit Losses
The allowance for credit losses is an estimate based on management’s judgment applying the principles of ASC Topic 450, “Contingencies,” and ASC Topic 310-35, “Loan Impairment.” The determination of the adequacy of the allowance is based on an assessment of the inherent loss potential in the lease and loan portfolios given the conditions at the time and are continuously reviewed for adequacy considering levels of past due payments and non-performing assets, customers’ financial condition, leased property values as well as general economic conditions and credit quality indicators. The need for reserves is subject to future events, which by their nature are uncertain. Therefore, changes in economic conditions or other events affecting specific customers or industries may necessitate additions or deductions to the allowance for credit losses or the residual valuation allowance. The allowance is maintained at a level believed to be adequate to absorb probable losses inherent in the portfolios.
The allowance for credit losses includes specific and general reserves. Specific reserves relate to leases and loans that are individually classified as problems or impaired. Leases are individually evaluated for impairment under ASC Topic 450, while loans are evaluated under ASC 310-35, which does not apply to leases. A lease or loan is impaired when, based on current information and events, it is probable that the Company will be unable to collect amounts due according to the contractual terms. Factors considered in determining impairment include payment status, collateral value and the probability of collecting all amounts when due. The net book value of each non-performing or problem lease is evaluated to determine whether the carrying value is less than or equal to the expected recovery anticipated to be derived from lease payments, additional collateral or residual realization. Measurement of impairment of a loan is based on expected future cash flows of the impaired loan, which are to be discounted at the loan’s effective interest rate, or measured by reference to an observable market value, if one exists, or the fair value of the collateral for a collateral-dependent loan. The Company selects the measurement method on a loan-by-loan basis. The amount estimated as unrecoverable is recognized as a reserve individually identified for the lease or impaired loan.
General reserves are an estimate of probable or inherent losses related to the remaining portfolio. An ongoing review of all leases and loans is conducted, taking into account recent loss experience, known and inherent risks in the portfolio, levels of delinquencies, adverse situations that may affect customers’ ability to repay, trends in volume and other factors, including regulatory guidance and current and anticipated economic conditions. This portfolio analysis includes a stratification of the portfolio by the risk classifications and segments and estimation of potential losses based on risk classification or segment. The composition of the portfolio based on risk ratings is monitored, and changes in the overall risk profile of the portfolio are also factored into the evaluation of inherent risks in the portfolio. Based on the foregoing, an estimated inherent loss not based directly on specific problem assets is recorded as a collective allowance. The Company utilizes similar processes to estimate its liability for unfunded loan commitments, which is included in other liabilities and not in the allowance for credit losses. Lease receivables and loans are charged off when they are deemed completely uncollectible. Subsequent recoveries, if any, are credited to the allowance.
Property Acquired for Transactions-in-process
Property acquired for transactions-in-process represents partial deliveries of property which the lessee has accepted on in-process lease transactions. Such amounts are stated at cost, net of any lessee payments related to the property. Income is not recognized while a transaction is in process and prior to the commencement of the lease. At lease commencement, any pre-commencement payments are included in minimum lease payments receivable and the unearned income is recognized as direct finance income over the lease term.
40
California First National Bancorp and Subsidiaries
Comprehensive Income
Accumulated other comprehensive income consists of unrealized gains and losses on available-for-sale securities.
Earnings Per Share
Basic net income per share is computed by dividing income available to common stockholders by the weighted average number of common shares outstanding. Diluted net income per share includes the effect of the potential shares outstanding, including dilutive stock options, using the treasury stock method.
The following table reconciles the components of the basic net income per share calculation to diluted net income per share:
|
Years ended June 30,
|
||||||||||||
|
2014
|
2013
|
2012
|
||||||||||
|
(in thousands, except share and per share amounts)
|
||||||||||||
|
Net earnings
|
$ | 7,051 | $ | 7,354 | $ | 8,903 | ||||||
|
Weighted average number of common shares outstanding assuming no exercise of outstanding options
|
10,453,107 | 10,446,347 | 10,419,961 | |||||||||
|
Dilutive stock options using the treasury stock method
|
3,252 | 7,014 | 9,398 | |||||||||
|
Dilutive common shares outstanding
|
10,456,359 | 10,453,361 | 10,429,359 | |||||||||
|
Basic earnings per common share
|
$ | 0.67 | $ | 0.70 | $ | 0.85 | ||||||
|
Diluted earnings per common share
|
$ | 0.67 | $ | 0.70 | $ | 0.85 | ||||||
The Company had 10,000 antidilutive stock options in its calculation of diluted earnings per share for the year ended June 30, 2014 and did not have any antidilutive stock options in its calculation of diluted earnings per share for the years ended June 30, 2013 and 2012.
Recent Accounting Pronouncements
In May 2014, the FASB issued Accounting Standards Update (“ASU”) No. 2014-09, “Revenue from Contracts with Customers (Topic 606).” The ASU is a converged standard between the FASB and the International Accounting Standards Board that provides a single comprehensive revenue recognition model for all contracts with customers across transactions and industries. The new accounting guidance clarifies the principles for recognizing revenue from contracts with customers. The new accounting guidance, which does not apply to financial instruments, is effective for interim and annual reporting periods beginning after December 15, 2016. The Company does not expect the new guidance to have a material impact on its consolidated financial position or results of operations.
Reclassifications
Certain reclassifications have been made to the fiscal 2013 and 2012 financial statements to conform to the presentation of the fiscal 2014 financial statements.
Note 2 – Investments
Investments are carried at cost and consist of the following:
|
June 30, 2014
|
June 30, 2013
|
|||||||||||||||
|
Carrying Cost
|
Fair Value
|
Carrying Cost
|
Fair Value
|
|||||||||||||
|
(in thousands)
|
||||||||||||||||
|
Federal Reserve Bank Stock
|
$ | 1,955 | $ | 1,955 | $ | 1,655 | $ | 1,655 | ||||||||
|
Federal Home Loan Bank Stock
|
475 | 475 | 771 | 771 | ||||||||||||
|
Mortgage-backed investments
|
122 | 137 | 214 | 233 | ||||||||||||
| $ | 2,552 | $ | 2,567 | $ | 2,640 | $ | 2,659 | |||||||||
41
California First National Bancorp and Subsidiaries
The investment in Federal Home Loan Bank of San Francisco (“FHLB”) stock is a required investment related to CalFirst Bank’s borrowing relationship with the FHLB. The FHLB obtains its funding primarily through issuance of consolidated obligations of the Federal Home Loan Bank system. The U.S. Government does not guarantee these obligations, and each of the twelve FHLB’s are generally jointly and severally liable for repayment of each other’s debt. Therefore, the Company’s investment could be adversely impacted by the financial operations of the FHLB and actions by the Federal Housing Finance Agency. These investments have no stated maturity.
The mortgage-backed investments consist of one U.S. agency issued security. The Company has determined that it has the ability to hold this investment until maturity and, given the Company’s intent to do so, anticipates that it will realize the full carrying value of its investment and carries the security at amortized cost.
Note 3 - Securities Available for Sale:
The amortized cost, fair value, and carrying value of available-for-sale-securities were as follows:
|
at June 30, 2014
|
||||||||||||||||
|
(in thousands)
|
Amortized
|
Gross Unrealized
|
Fair
|
|||||||||||||
|
Cost
|
Gains
|
Losses
|
Value
|
|||||||||||||
|
Corporate debt securities
|
$ | 16,030 | $ | 280 | $ | - | $ | 16,310 | ||||||||
|
Securities of state and political subdivisions
|
409 | 18 | - | 427 | ||||||||||||
|
U.S. Treasury notes
|
7,930 | 43 | - | 7,973 | ||||||||||||
|
Mutual fund investments
|
1,306 | - | (45 | ) | 1,261 | |||||||||||
|
Equity investments
|
422 | 371 | - | 793 | ||||||||||||
|
Total securities available-for-sale
|
$ | 26,097 | $ | 712 | $ | (45 | ) | $ | 26,764 | |||||||
|
at June 30, 2013
|
||||||||||||||||
|
(in thousands)
|
Amortized
|
Gross Unrealized
|
Fair
|
|||||||||||||
|
Cost
|
Gains
|
Losses
|
Value
|
|||||||||||||
|
Corporate debt securities
|
$ | 42,435 | $ | 712 | $ | - | $ | 43,147 | ||||||||
|
Securities of state and political subdivisions
|
412 | 24 | - | 436 | ||||||||||||
|
Mutual fund investments
|
1,306 | - | (56 | ) | 1,250 | |||||||||||
|
Equity investments
|
422 | 267 | - | 689 | ||||||||||||
|
Total securities available-for-sale
|
$ | 44,575 | $ | 1,003 | $ | (56 | ) | $ | 45,522 | |||||||
The $45,000 unrealized loss at June 30, 2014 is attributable primarily to lower values related to the fluctuation in interest rates during fiscal year 2014, and not credit quality, and because the Company has the intent to hold these securities and more likely than not will not need to sell them, the Company does not consider these investments to be other-than-temporarily impaired at June 30, 2014.
The amortized cost and estimated fair value of available-for-sale securities at June 30, 2014, by contractual maturity, are shown below. Expected maturities may differ from contractual maturities because borrowers may have the right to call or prepay obligations with or without call or prepayment penalties.
|
Amortized Cost
|
Fair Value
|
||||||||
|
(in thousands)
|
|||||||||
|
Due in three months or less
|
$ | 5,002 | $ | 5,030 | |||||
|
Due after three months to one year
|
5,062 | 5,168 | |||||||
|
Due after one year to five years
|
14,306 | 14,512 | |||||||
|
Due after five years
|
- | - | |||||||
|
No stated maturity
|
1,727 | 2,054 | |||||||
|
Total securities available-for-sale
|
$ | 26,097 | $ | 26,764 | |||||
42
California First National Bancorp and Subsidiaries
The following table presents the Company’s gross realized gains and gross realized losses on available-for-sale securities. These gains and losses were recognized using the specific identification method and were included in non-interest income.
|
(in thousands)
|
Available-for-sale
|
||||||||||||
|
For the years ended June 30,
|
|||||||||||||
|
2014
|
2013
|
2012
|
|||||||||||
|
Gross realized gains
|
$ | - | $ | 316 | $ | 56 | |||||||
|
Gross realized losses
|
- | - | - | ||||||||||
|
Other than temporary impairment
|
- | - | - | ||||||||||
|
Total
|
$ | - | $ | 316 | $ | 56 | |||||||
The following table presents the fair value and associated gross unrealized loss only on an available-for-sale security with a gross unrealized loss at June 30, 2014 and 2013.
|
Less than 12 Months
|
12 Months or More
|
Total
|
|||||||||||||||||||||||
|
Unrealized
Loss |
Estimated
Fair Value |
Unrealized
Loss |
Estimated
Fair Value |
Unrealized
Loss |
Estimated
Fair Value |
||||||||||||||||||||
|
(in thousands)
|
|||||||||||||||||||||||||
|
At June 30, 2014
|
|||||||||||||||||||||||||
|
Mutual fund investment
|
$ | - | $ | - | $ | (45 | ) | $ | 1,261 | $ | (45 | ) | $ | 1,261 | |||||||||||
|
Total
|
$ | - | $ | - | $ | (45 | ) | $ | 1,261 | $ | (45 | ) | $ | 1,261 | |||||||||||
|
At June 30, 2013
|
|||||||||||||||||||||||||
|
Mutual fund investment
|
$ | (56 | ) | $ | 1,250 | $ | - | $ | - | $ | (56 | ) | $ | 1,250 | |||||||||||
|
Total
|
$ | (56 | ) | $ | 1,250 | $ | - | $ | - | $ | (56 | ) | $ | 1,250 | |||||||||||
At June 30, 2014, securities with carrying values of $8.0 million were pledged to secure $6.9 million borrowed from the FHLB. At June 30, 2013, there were no securities pledged or borrowings from the FHLB.
Note 4 - Receivables:
The Company's receivables consist of the following:
|
June 30,
|
|||||||||
|
2014
|
2013
|
||||||||
|
(in thousands)
|
|||||||||
|
Other lessee receivables
|
$ | 166 | $ | 557 | |||||
|
Accrued interest
|
514 | 838 | |||||||
| $ | 680 | $ | 1,395 | ||||||
Note 5 – Net Investment in Leases:
The Company's net investment in leases consists of the following:
|
June 30,
|
|||||||||
|
2014
|
2013
|
||||||||
|
(in thousands)
|
|||||||||
|
Minimum lease payments receivable
|
$ | 340,211 | $ | 357,942 | |||||
|
Estimated residual value
|
12,996 | 14,087 | |||||||
|
Less unearned income
|
(23,272 | ) | (26,276 | ) | |||||
|
Net investment in leases before allowances
|
329,935 | 345,753 | |||||||
|
Less allowance for lease losses
|
(3,236 | ) | (2,916 | ) | |||||
|
Less valuation allowance for estimated residual value
|
(80 | ) | (248 | ) | |||||
|
Net investment in leases
|
$ | 326,619 | $ | 342,589 | |||||
43
California First National Bancorp and Subsidiaries
The minimum lease payments receivable and estimated residual value are discounted using the internal rate of return method related to each specific lease. Unearned income and discounts includes the offset of initial direct costs of $2.5 million and $2.6 million at June 30, 2014 and 2013, respectively.
At June 30, 2014, a summary of the installments due on minimum lease payments receivable, and the expected maturity of the Company's estimated residual value are as follows:
|
Years ending June 30,
|
Lease
Receivable |
Estimated
Residual Value |
Total
|
||||||||||
|
(in thousands)
|
|||||||||||||
|
2015
|
$ | 142,802 | $ | 1,596 | $ | 144,398 | |||||||
|
2016
|
95,386 | 3,188 | 98,574 | ||||||||||
|
2017
|
51,268 | 5,135 | 56,403 | ||||||||||
|
2018
|
24,597 | 1,896 | 26,493 | ||||||||||
|
2019
|
12,801 | 1,127 | 13,928 | ||||||||||
|
Thereafter
|
13,357 | 54 | 13,411 | ||||||||||
| 340,211 | 12,996 | 353,207 | |||||||||||
|
Less unearned income
|
(21,301 | ) | (1,971 | ) | (23,272 | ) | |||||||
|
Less allowances
|
(3,236 | ) | (80 | ) | (3,316 | ) | |||||||
| $ | 315,674 | $ | 10,945 | $ | 326,619 | ||||||||
Non-recourse debt, which relates to the discounting of lease receivables, bears interest at rates ranging from 2.60% to 5.80%. Maturities of such obligations at June 30, 2014 are as follows:
|
Years ending June 30,
|
Non-recourse
Debt |
||||
|
(in thousands)
|
|||||
|
2015
|
$ | 3,167 | |||
|
2016
|
3,184 | ||||
|
2017
|
1,687 | ||||
|
2018
|
276 | ||||
|
Total non-recourse debt
|
8,314 | ||||
|
Deferred interest expense
|
326 | ||||
|
Discounted lease rentals assigned to lenders
|
$ | 8,640 | |||
Deferred interest expense of $326,000 at June 30, 2014 will be amortized against direct finance income related to the Company's discounted lease rentals assigned to lenders of $8.6 million using the effective yield method over the applicable lease term.
Note 6 – Commercial Loans:
The Company’s investment in commercial loans consists of the following:
|
June 30,
|
|||||||||
|
2014
|
2013
|
||||||||
|
(in thousands)
|
|||||||||
|
Commercial term loans
|
$ | 121,236 | $ | 65,094 | |||||
|
Commercial real estate loans
|
7,920 | 9,411 | |||||||
|
Revolving lines of credit
|
2,471 | 1,841 | |||||||
|
Total commercial loans
|
131,627 | 76,346 | |||||||
|
Less unearned income and discounts
|
(469 | ) | (394 | ) | |||||
|
Less allowance for loan losses
|
(1,972 | ) | (1,972 | ) | |||||
|
Net commercial loans
|
$ | 129,186 | $ | 73,980 | |||||
44
California First National Bancorp and Subsidiaries
In addition to the amount outstanding on revolving lines of credit set forth above, the Company had additional unused commitments on revolving lines of credit in the amount of $13.3 million at June 30, 2014 and $12.0 million at June 30, 2013. The Company has recorded a liability for unfunded loan commitments of $25,000 at June 30, 2014 and June 30, 2013 related to such commitments.
Note 7 – Allowance for Credit Losses:
The allowance for credit losses includes amounts to cover losses related to the net investment in leases and commercial loans, and transactions-in-process (“risk assets”). A summary of the allocation of the allowance for credit losses and selected statistics is as follows:
|
June 30,
|
|||||||||
|
2014
|
2013
|
||||||||
|
(dollars in thousands)
|
|||||||||
|
Allowance for credit losses at beginning of year
|
5,147 | 5,216 | |||||||
|
Charge-off of leases
|
(62 | ) | (350 | ) | |||||
|
Charge-off of transactions-in-process
|
- | - | |||||||
|
Recovery of amounts previously written off
|
14 | 6 | |||||||
|
Provision for credit losses
|
200 | 275 | |||||||
|
Allowance for credit losses at end of year
|
$ | 5,299 | $ | 5,147 | |||||
|
Components of allowance for credit losses:
|
|||||||||
|
Allowance for lease losses
|
3,236 | 2,916 | |||||||
|
Residual valuation allowance
|
80 | 248 | |||||||
|
Allowance for loan losses
|
1,972 | 1,972 | |||||||
|
Allowance for transactions in process
|
11 | 11 | |||||||
| $ | 5,299 | $ | 5,147 | ||||||
|
Allowance for credit losses as percent of net investment in leases and loans before allowances
|
$ | 1.15 | % | $ | 1.22 | % | |||
|
Allowance for credit losses as percent of net investment in “risk assets”
|
1.07 | % | 1.18 | % | |||||
In addition to the allowance for credit losses, the Company has recorded a liability for unfunded loan commitments of $25,000 at June 30, 2014 and 2013.
Note 8 – Credit Quality of Financing Receivables:
The following tables provide information on the credit profile of the components of the portfolio and allowance for credit losses related to “financing receivables” as defined under Topic 310, Receivables. This disclosure on “financing receivables” covers the Company’s direct finance and sales-type leases and all commercial loans, but does not include operating leases and transactions in process. The portfolio is disaggregated into segments and classifications appropriate for assessing and monitoring the portfolios’ risk and performance. This disclosure does not encompass all risk assets or the entire allowance for credit losses.
Portfolio segments identified by the Company include leases and loans. These segments have been disaggregated into four classes: 1) commercial leases, 2) education, government and non-profit leases, 3) commercial and industrial loans and 4) commercial real estate loans. Relevant risk characteristics for establishing these portfolio classes generally include the nature of the borrower, structure of the transaction and collateral type. The Company’s credit process includes a policy of classifying all leases and loans in accordance with a risk rating classification system consistent with regulatory models under which leases and loans may be rated as “pass”, “special mention”, “substandard”, or “doubtful”. These risk categories reflect an assessment of the ability of the borrowers to service their obligation based on current financial position, historical payment experience, and collateral adequacy, among other factors. The Company uses the following definitions for risk ratings:
45
California First National Bancorp and Subsidiaries
Pass – Includes credits of the highest quality as well as credits with positive primary repayment source but one or more characteristics that are of higher than average risk.
Special Mention – Have a potential weakness that if left uncorrected may result in deterioration of the repayment prospects for the lease or loan or of the Company’s credit position at some future date.
Substandard – Are inadequately protected by the paying capacity of the obligor or of the collateral, if any. Substandard credits have a well-defined weakness that jeopardize the liquidation of the debt or indicate the distinct possibility that the Company will sustain some loss if the deficiencies are not corrected.
Doubtful – Based on current information and events, collection of all amounts due according to the contractual terms of the lease or loan agreement is considered highly questionable and improbable.
The risk classification of financing receivables by portfolio class is as follows:
|
(in thousands)
|
Commercial
|
Education
Government |
Commercial
& Industrial |
Commercial
Real Estate |
Total
Financing |
|||||||||||||||
|
Leases
|
Leases
|
Loans
|
Loans
|
Receivable
|
||||||||||||||||
|
As of June 30, 2014:
|
||||||||||||||||||||
|
Pass
|
$ | 245,360 | $ | 76,569 | $ | 108,453 | $ | 2,344 | $ | 432,726 | ||||||||||
|
Special Mention
|
6,440 | 566 | 9,881 | - | 16,887 | |||||||||||||||
|
Substandard
|
4 | 972 | 4,917 | 5,563 | 11,456 | |||||||||||||||
|
Doubtful
|
20 | 4 | - | - | 24 | |||||||||||||||
| $ | 251,824 | $ | 78,111 | $ | 123,251 | $ | 7,907 | $ | 461,093 | |||||||||||
|
Non-accrual
|
$ | 43 | $ | 4 | $ | - | $ | - | $ | 47 | ||||||||||
|
As of June 30, 2013:
|
||||||||||||||||||||
|
Pass
|
$ | 256,360 | $ | 81,730 | $ | 64,366 | $ | 3,616 | $ | 406,072 | ||||||||||
|
Special Mention
|
5,264 | 200 | 2,182 | - | 7,646 | |||||||||||||||
|
Substandard
|
1,499 | 615 | - | 5,788 | 7,902 | |||||||||||||||
|
Doubtful
|
73 | 12 | - | - | 85 | |||||||||||||||
| $ | 263,196 | $ | 82,557 | $ | 66,548 | $ | 9,404 | $ | 421,705 | |||||||||||
|
Non-accrual
|
$ | 1,591 | $ | 23 | $ | - | $ | - | $ | 1,614 | ||||||||||
The accrual of interest income on leases and loans will be discontinued when the customer becomes ninety days or more past due on its lease or loan payments with the Company, unless the Company believes the investment is otherwise recoverable. Leases and loans may be placed on non-accrual earlier if the Company has significant doubt about the ability of the customer to meet its lease or loan obligations, as evidenced by consistent delinquency, deterioration in the customer’s financial condition or other relevant factors. Payments received while on non-accrual are applied to reduce the Company’s recorded value.
The following table presents the aging of the financing receivables by portfolio class:
|
(in thousands)
|
31-89
Days |
Greater
Than |
Total
Past Due |
Current
|
Total
Financing |
Over 90
Days & |
||||||||||||||||||
|
As of June 30, 2014:
|
||||||||||||||||||||||||
|
Commercial Leases
|
$ | - | $ | 43 | $ | 43 | $ | 251,781 | $ | 251,824 | $ | - | ||||||||||||
|
Education, Government, Non-profit Leases
|
- | 4 | 4 | 78,107 | 78,111 | - | ||||||||||||||||||
|
Commercial and Industrial Loans
|
- | - | - | 123,251 | 123,251 | - | ||||||||||||||||||
|
Commercial Real Estate Loans
|
- | - | - | 7,907 | 7,907 | - | ||||||||||||||||||
| $ | - | $ | 47 | $ | 47 | $ | 461,046 | $ | 461,093 | $ | - | |||||||||||||
|
As of June 30, 2013:
|
||||||||||||||||||||||||
|
Commercial Leases
|
$ | 113 | $ | 1,591 | $ | 1,704 | $ | 261,492 | $ | 263,196 | $ | - | ||||||||||||
|
Education, Government, Non-profit Leases
|
- | 23 | 23 | 82,534 | 82,557 | - | ||||||||||||||||||
|
Commercial and Industrial Loans
|
- | - | - | 66,548 | 66,548 | - | ||||||||||||||||||
|
Commercial Real Estate Loans
|
- | - | - | 9,404 | 9,404 | - | ||||||||||||||||||
| $ | 113 | $ | 1,614 | $ | 1,727 | $ | 420,165 | $ | 421,705 | $ | - | |||||||||||||
46
California First National Bancorp and Subsidiaries
The following table presents the allowance balances and activity in the allowance related to financing receivables, along with the recorded investment and allowance determined based on impairment method as of June 30, 2014 and 2013:
|
(in thousands)
|
Commercial
Leases |
Education
Government |
Commercial
& Industrial |
Commercial
Real Estate |
Total
Financing |
|||||||||||||||
|
As of June 30, 2014:
|
||||||||||||||||||||
|
Allowance for lease and loan losses
|
||||||||||||||||||||
|
Balance beginning of period
|
$ | 2,546 | $ | 618 | $ | 1,561 | $ | 411 | $ | 5,136 | ||||||||||
|
Charge-offs
|
(61 | ) | (1 | ) | - | - | (62 | ) | ||||||||||||
|
Recoveries
|
14 | - | - | - | 14 | |||||||||||||||
|
Provision
|
- | 200 | 200 | (200 | ) | 200 | ||||||||||||||
|
Balance end of period
|
$ | 2,499 | $ | 817 | $ | 1,761 | $ | 211 | $ | 5,288 | ||||||||||
|
Individually evaluated for impairment
|
$ | 27 | $ | 191 | $ | - | $ | - | $ | 218 | ||||||||||
|
Collectively evaluated for impairment
|
2,472 | 626 | 1,761 | 211 | 5,070 | |||||||||||||||
|
Total ending allowance balance
|
$ | 2,499 | $ | 817 | $ | 1,761 | $ | 211 | $ | 5,288 | ||||||||||
|
Finance receivables
|
||||||||||||||||||||
|
Individually evaluated for impairment
|
$ | 73 | $ | 976 | $ | - | $ | - | $ | 1,049 | ||||||||||
|
Collectively evaluated for impairment
|
251,751 | 77,135 | 123,251 | 7,907 | 460,044 | |||||||||||||||
|
Total ending finance receivable balance
|
$ | 251,824 | $ | 78,111 | $ | 123,251 | $ | 7,907 | $ | 461,093 | ||||||||||
|
As of June 30, 2013:
|
||||||||||||||||||||
|
Allowance for lease and loan losses
|
||||||||||||||||||||
|
Balance beginning of period
|
$ | 2,236 | $ | 897 | $ | 1,561 | $ | 511 | $ | 5,205 | ||||||||||
|
Charge-offs
|
(71 | ) | (279 | ) | - | - | (350 | ) | ||||||||||||
|
Recoveries
|
6 | - | - | - | 6 | |||||||||||||||
|
Provision
|
375 | - | - | (100 | ) | 275 | ||||||||||||||
|
Balance end of period
|
$ | 2,546 | $ | 618 | $ | 1,561 | $ | 411 | $ | 5,136 | ||||||||||
|
Individually evaluated for impairment
|
$ | 330 | $ | 111 | $ | - | $ | - | $ | 441 | ||||||||||
|
Collectively evaluated for impairment
|
2,216 | 507 | 1,561 | 411 | 4,695 | |||||||||||||||
|
Total ending allowance balance
|
$ | 2,546 | $ | 618 | $ | 1,561 | $ | 411 | $ | 5,136 | ||||||||||
|
Finance receivables
|
||||||||||||||||||||
|
Individually evaluated for impairment
|
$ | 1,926 | $ | 627 | $ | - | $ | - | $ | 2,553 | ||||||||||
|
Collectively evaluated for impairment
|
261,270 | 81,930 | 66,548 | 9,404 | 419,152 | |||||||||||||||
|
Total ending finance receivable balance
|
$ | 263,196 | $ | 82,557 | $ | 66,548 | $ | 9,404 | $ | 421,705 | ||||||||||
Note 9 – Borrowings:
CalFirst Bank is a member of the Federal Home Loan Bank of San Francisco and can take advantage of FHLB programs for overnight and term advances at published daily rates. Under terms of a blanket collateral agreement, advances from the FHLB are collateralized by qualifying real estate loans and investment securities. The Bank also has authority to borrow from the Federal Reserve Bank (“FRB”) discount window amounts secured by certain lease receivables. At June 30, 2014, there was a $6.9 million short-term borrowing from the FHLB at an average rate of 0.25% with available borrowing capacity of $3.1 million related to qualifying real estate loans of $2.4 million and securities pledged with a carrying value of $8.0 million, and no borrowings from the FRB with borrowing availability of approximately $107.4 million secured by $139.8 million of lease receivables.
47
California First National Bancorp and Subsidiaries
Borrowing capacity from the FHLB or FRB may fluctuate based upon the acceptability and risk rating of securities, loan and lease collateral and both the FRB and FHLB could adjust advance rates applied to such collateral at their discretion.
Note 10 – Deposits:
The composition of deposits is as follows:
|
June 30, 2014
|
June 30, 2013
|
||||||||||||||||
|
(dollars in thousands)
|
|||||||||||||||||
|
Non-interest bearing deposits
|
|||||||||||||||||
|
Demand deposits
|
$ | 1,060 | 0.3 | % | $ | 1,402 | 0.4 | % | |||||||||
|
Interest-bearing deposits
|
|||||||||||||||||
|
Demand deposits
|
1,168 | 0.3 | % | 2,205 | 0.6 | % | |||||||||||
|
Savings deposits
|
63,355 | 17.8 | % | 68,339 | 19.8 | % | |||||||||||
|
Time certificates of deposits
|
290,227 | 81.6 | % | 274,082 | 79.2 | % | |||||||||||
|
Total Deposits
|
$ | 355,810 | 100.0 | % | $ | 346,028 | 100.0 | % | |||||||||
Included in savings deposits at June 30, 2014 is a deposit in the amount of $10.6 million from an affiliate, as defined in Rule 12b-2 of the Securities Exchange Act of 1934, of the Company. The terms of such account are the same terms offered on similar accounts to non-affiliated depositors.
Time certificates of deposits with balances of more than $250,000 were $47.3 million and $45.9 million at June 30, 2014 and 2013, respectively.
At June 30, 2014, the scheduled maturities of time certificates of deposit are as follows:
|
Years Ending:
|
(in thousands)
|
||||
|
2015
|
$
|
230,452
|
|||
|
2016
|
52,524
|
||||
|
2017
|
7,251
|
||||
|
Thereafter
|
-
|
||||
|
Total time certificates of deposit
|
$
|
290,227
|
|||
Note 11 – Fair Value Measurement:
ASC Topic 820: “Fair Value Measurements and Disclosures” defines fair value as the price that would be received for an asset or paid to transfer a liability in an orderly transaction between market participants in the principal or most advantageous market for the asset or liability. ASC Topic 820 establishes a three-tiered value hierarchy that prioritizes inputs based on the extent to which inputs used are observable in the market and requires the Company to maximize the use of observable inputs and minimize the use of unobservable inputs. If a value is based on inputs that fall in different levels of the hierarchy, the instrument will be categorized based upon the lowest level of input that is significant to the fair value calculation. The three levels of inputs are defined as follows:
|
|
·
|
Level 1 - Valuation is based upon unadjusted quoted prices for identical instruments traded in active markets;
|
|
|
·
|
Level 2 - Valuation is based upon quoted prices for similar instruments in active markets, quoted prices for identical or similar instruments in markets that are not active and model-based valuation techniques for which all significant assumptions are observable in the market;
|
|
|
·
|
Level 3 - Valuation is generated from model-based techniques that use inputs not observable in the market and based on the entity’s own judgment. Level 3 valuation techniques could include the use of option pricing models, discounted cash flow models and similar techniques, and rely on assumptions that market participants would use in pricing the asset or liability.
|
48
California First National Bancorp and Subsidiaries
ASC 820 applies whenever other accounting pronouncements require presentation of fair value measurements, but does not change existing guidance as to whether or not an instrument is carried at fair value. As such, ASC 820 does not apply to the Company’s investment in leases. The Company’s financial assets measured at fair value on a recurring basis include primarily securities available-for-sale and at June 30, 2014, there were no liabilities subject to ASC 820.
Securities available-for-sale include corporate bonds, municipal bonds, U.S. Treasury Notes, mutual fund and equity investments and generally are reported at fair value utilizing Level 1 and Level 2 inputs. The fair value of corporate and municipal bonds are obtained from independent quotation bureaus that use computerized valuation formulas to calculate current values based on observable transactions, but not a quoted bid, or are valued using prices obtained from the custodian, who uses third party data service providers (Level 2 input). U.S. Treasury Notes, mutual funds and equity investments are valued by reference to the market closing or last trade price (Level 1 inputs). In the unlikely event that no trade occurred on the applicable date, an indicative bid or the last trade most proximate to the applicable date would be used (Level 2 input).
The following table summarizes the Company’s assets, which are measured at fair value on a recurring basis as of June 30, 2014 and 2013:
|
Description of Assets / Liabilities
|
Total
Fair Value |
Quoted Price in
Active Markets for |
Significant Other
Observable Inputs |
Significant
Unobservable |
||||||||||||
|
(in thousands)
|
||||||||||||||||
|
As of June 30, 2014
|
||||||||||||||||
|
Corporate debt securities
|
$ | 16,310 | $ | - | $ | 16,310 | $ | - | ||||||||
|
Securities of state and political subdivisions
|
427 | - | 427 | - | ||||||||||||
|
U.S. Treasury notes
|
7,973 | 7,973 | - | - | ||||||||||||
|
Mutual fund investment
|
1,261 | 1,261 | - | - | ||||||||||||
|
Equity investment
|
793 | 793 | - | - | ||||||||||||
| $ | 26,764 | $ | 10,027 | $ | 16,737 | $ | - | |||||||||
|
As of June 30, 2013
|
||||||||||||||||
|
Corporate debt securities
|
$ | 43,147 | $ | - | $ | 43,147 | $ | - | ||||||||
|
Securities of state and political subdivisions
|
436 | - | 436 | - | ||||||||||||
|
Mutual fund investment
|
1,250 | 1,250 | - | - | ||||||||||||
|
Equity investment
|
689 | 689 | - | - | ||||||||||||
| $ | 45,522 | $ | 1,939 | $ | 43,583 | $ | - | |||||||||
Certain financial instruments, such as impaired loans, are measured at fair value on a nonrecurring basis; that is, the instruments are not measured at fair value on an ongoing basis but are subject to fair value adjustments only in certain circumstances, usually if there was evidence of impairment. The Company had no such assets or liabilities at June 30, 2014 and 2013.
Note 12 – Fair Value of Financial Instruments:
In accordance with ASC 825-50, the following table summarizes the estimated fair value of financial instruments as of June 30, 2014, and June 30, 2013, and includes financial instruments that are not accounted for or carried at fair value. In accordance with disclosure guidance, certain financial instruments, including all lease related assets and liabilities and all non-financial instruments are excluded from fair value of financial instrument disclosure requirements. Accordingly, the aggregate of the fair values presented does not represent the total underlying value of the Company. These fair value estimates are based on relevant market information and data, however, given there is no active market or observable market transactions for certain financial instruments, the Company has made estimates of fair values which are subjective in nature, involve uncertainties and matters of significant judgment and therefore cannot be determined with precision. Changes in assumptions could significantly affect the estimated values.
49
California First National Bancorp and Subsidiaries
For cash and cash equivalents and demand deposits, because of their short-term nature, the carrying amounts approximate the fair value and are classified as Level 1 in the fair value hierarchy. Values for investments and available-for-sale securities are determined as set forth in Note 11. The fair values of loan participations that trade regularly in the secondary market are based upon current bid prices in such market at the measurement date and are classified as Level II in the fair value hierarchy. For other loans, the estimated fair value is calculated based on discounted cashflow analyses, using interest rates currently being offered for loans with similar terms to borrowers of similar credit quality and are classified as Level III in the fair value hierarchy. These calculations have been adjusted for credit risk based on the Company’s historical credit loss experience. The fair value of certificates of deposit and short-term borrowings are estimated based on discounted cash flows using current offered market rates or interest rates for borrowings of similar maturity and are classified as Level III in the fair value hierarchy.
The estimated fair values of financial instruments were as follows:
|
June 30, 2014
|
June 30, 2013
|
||||||||||||||||
|
Carrying
Amount |
Estimated
Fair Value |
Carrying
Amount |
Estimated
Fair Value |
||||||||||||||
|
(in thousands)
|
|||||||||||||||||
|
Financial Assets:
|
|||||||||||||||||
|
Cash and cash equivalents
|
$ | 40,122 | $ | 40,122 | $ | 75,469 | $ | 75,469 | |||||||||
|
Investments
|
2,552 | 2,567 | 2,640 | 2,659 | |||||||||||||
|
Securities available-for-sale
|
26,764 | 26,764 | 45,522 | 45,522 | |||||||||||||
|
Commercial loan participations
|
111,472 | 111,691 | 64,987 | 65,226 | |||||||||||||
|
Other loans
|
17,714 | 17,929 | 8,993 | 8,935 | |||||||||||||
|
Financial Liabilities:
|
|||||||||||||||||
|
Demand and savings deposits
|
65,583 | 65,583 | 71,946 | 71,946 | |||||||||||||
|
Time certificate of deposits
|
290,227 | 290,044 | 274,082 | 274,449 | |||||||||||||
|
Short-term borrowings
|
$ | 6,858 | $ | 6,858 | $ | - | $ | - | |||||||||
Note 13 – Income Taxes:
The Company accounts for its income taxes under ASC 740, “Income Taxes.” Among other provisions, this standard requires deferred tax balances to be determined using the enacted income tax rate for the years in which taxes will be paid or refunds received. The Company is subject to U.S. Federal income tax jurisdiction, as well as multiple state and local jurisdictions as a result of doing business in most states. During fiscal 2014, the Internal Revenue Service closed an audit of the Company’s federal income tax returns through June 30, 2012 without adjustment. The Company’s Federal tax returns remain subject to examination from 2013 forward, while state income tax returns are generally open from 2010 forward, and vary by individual state statute of limitation. The Company believes that its accrual for income taxes is adequate for adjustments, if any, which may result from these examinations.
The provision for income taxes is summarized as follows:
|
Years ended June 30,
|
|||||||||||||
|
2014
|
2013
|
2012
|
|||||||||||
|
(in thousands)
|
|||||||||||||
|
Current tax (benefit) expense:
|
|
|
|||||||||||
|
Federal
|
$ | 6,299 | $ | 8,890 | $ | 4,145 | |||||||
|
State
|
912 | 721 | 1,399 | ||||||||||
| 7,211 | 9,611 | 5,544 | |||||||||||
|
Deferred tax (benefit) expense:
|
|||||||||||||
|
Federal
|
(2,792 | ) | (5,083 | ) | 528 | ||||||||
|
State
|
(397 | ) | (197 | ) | (700 | ) | |||||||
|
|
(3,189 | ) | (5,280 | ) | (172 | ) | |||||||
| $ | 4,022 | $ | 4,331 | $ | 5,372 | ||||||||
At June 30, 2014 and 2013, the Company had an income taxes receivable balance of $1,658,000 and $3,301,000 respectively.
50
California First National Bancorp and Subsidiaries
Deferred taxes result principally from the method of recording lease income on capital leases and depreciation methods for tax reporting, which differ from financial statement reporting. Deferred income tax liabilities (assets) are comprised of the following:
|
June 30,
|
|||||||||
|
2014
|
2013
|
||||||||
|
(in thousands)
|
|||||||||
|
Deferred income tax liabilities:
|
|||||||||
|
Tax operating leases
|
$ | 16,729 | $ | 19,808 | |||||
|
Deferred selling expenses
|
1,011 | 1,053 | |||||||
|
Other investments
|
134 | 210 | |||||||
|
Total liabilities
|
17,874 | 21,071 | |||||||
|
Deferred income tax assets:
|
|||||||||
|
Allowances and reserves
|
(2,255 | ) | (2,120 | ) | |||||
|
Depreciation, Other
|
(13 | ) | (37 | ) | |||||
|
State income taxes
|
(319 | ) | (314 | ) | |||||
|
Stock-based compensation
|
(3 | ) | (25 | ) | |||||
|
Total assets
|
(2,590 | ) | (2,496 | ) | |||||
|
Net deferred income tax liabilities
|
$ | 15,284 | $ | 18,575 | |||||
The differences between the Federal statutory income tax rate and the Company's effective tax rate are as follows:
|
Years ended June 30,
|
|||||||||||||
|
2014
|
2013
|
2012
|
|||||||||||
|
Federal statutory rate
|
35.00 | % | 35.00 | % | 35.00 | % | |||||||
|
State tax, net of Federal benefit
|
4.65 | 4.41 | 4.77 | ||||||||||
|
Other, mainly tax exempt leases
|
(2.25 | ) | (2.31 | ) | (2.17 | ) | |||||||
|
Derecognition of uncertain tax positions
|
(1.10 | ) | - | - | |||||||||
|
Effective rate
|
36.30 | % | 37.10 | % | 37.60 | % | |||||||
As of June 30, 2014, there was $188,000 of unrecognized tax benefits, all of which, if recognized, would affect the effective tax rate. The Company’s policy is to include interest and penalties related to unrecognized tax benefits in income tax expense. As of June 30, 2014, accrued penalties and interest on unrecognized tax benefits are estimated to be $33,000.
The following table sets forth the change in unrecognized tax benefits:
|
Years ended June 30,
|
|||||||||
|
2014
|
2013
|
||||||||
|
(in thousands)
|
|||||||||
|
Balance, beginning of period
|
$ | 310 | $ | 239 | |||||
|
Increase for tax positions in current year
|
57 | 76 | |||||||
|
Increase (decrease) for tax positions taken in prior years
|
(146 | ) | 6 | ||||||
|
Lapse of statute of limitations
|
(8 | ) | (22 | ) | |||||
|
Increase (decrease) for interest and penalties
|
(25 | ) | 11 | ||||||
|
Balance, end of period
|
$ | 188 | $ | 310 | |||||
At June 30, 2014, the change in the liability for uncertain tax positions and unrecognized tax benefits is primarily related to the derecognition of uncertain tax positions upon the completion of the Internal Revenue Service audit for the fiscal years ending June 30, 2012 and 2011. The amount of unrecognized tax benefits may increase or decrease in the future for various reasons; including additions related to current year tax provisions, the expiration of the statute of limitations on open tax years, the status of examinations and changes in management judgment.
51
California First National Bancorp and Subsidiaries
Note 14 – Capital Structure and Stock-based Compensation:
At June 30, 2014, the Company has 20,000,000 authorized shares of common stock and is authorized to issue 2,500,000 shares of preferred stock, from time to time, in one or more series and to fix the voting powers, designations, preferences and the relative participating, optional or other rights, if any, of any wholly unissued series of preferred stock.
In November 1995, the Company’s stockholders approved the 1995 Equity Participation Plan (the “1995 Plan”). The 1995 Plan provides for the granting of options, restricted stock and stock appreciation rights (“SARs”) to key employees, directors and consultants of the Company. Under the 1995 Plan, the maximum number of shares of common stock that can be issued upon the exercise of options or SARs, or upon the vesting of restricted stock awards, was initially 1,000,000, but the maximum number of available shares of common stock could increase by an amount equal to 1% of the total number of issued and outstanding shares of common stock as of June 30 of the fiscal year immediately preceding such fiscal year. Each grant or issuance under the 1995 Plan is set forth in a separate agreement and indicates, as determined by the stock option committee, the type, terms, vesting period and conditions of the award.
In fiscal year 2013, the Company issued a grant for 10,000 shares. There were no option grants in fiscal years 2014 and 2012. The fair value of each grant is estimated on the grant date using the Black-Scholes option-pricing model with the following weighted-average assumptions used for grants in 2013.
|
Risk free interest rate
|
1.60 | % | |||
|
Option life (in years)
|
10 | ||||
|
Dividend yield
|
7.04 | % | |||
|
Volatility
|
32.68 | % | |||
|
Fair value
|
$ 2.21 |
The Company recognized stock-based compensation expense for the years ended June 30, 2014 and 2013 and 2012 of $4,000, $5,000 and none, respectively. As of June 30, 2014, the Company had $14,000 of unrecognized stock-based compensation expense.
The following table summarizes activity related to stock options for the periods indicated:
|
June 30,
|
|||||||||||||||
|
2014
|
2013
|
2012
|
|||||||||||||
|
Shares
|
Weighted
Average |
Shares
|
Weighted
Average |
Shares
|
Weighted
Average |
||||||||||
|
Options outstanding at beginning of period
|
22,697
|
$
|
13.91
|
26,240
|
$
|
12.19
|
42,327
|
$
|
12.17
|
||||||
|
Exercised
|
(12,697)
|
12.26
|
(13,543)
|
12.13
|
(16,087)
|
12.13
|
|||||||||
|
Granted
|
-
|
-
|
10,000
|
16.00
|
-
|
-
|
|||||||||
|
Options outstanding at end of period
|
10,000
|
$
|
16.00
|
22,697
|
$
|
13.91
|
26,240
|
$
|
12.19
|
||||||
|
Options exercisable at end of period
|
2,000
|
12,697
|
26,240
|
||||||||||||
|
Shares available for issuance
|
2,010,647
|
1,906,175
|
1,811,838
|
||||||||||||
|
As of June 30, 2014
|
||||||||||||||
|
Options Outstanding
|
Options Exercisable
|
|||||||||||||
|
Range of
Exercise prices |
Number
Outstanding |
Weighted Average
Remaining Contractual |
Weighted Average
Exercise Price |
Number
Exercisable |
Weighted Average
Exercise Price |
|||||||||
| $16.00 |
-
|
$16.00 |
10,000
|
8.08
|
$
|
16.00
|
2,000
|
$
|
16.00
|
|||||
At June 30, 2014, the aggregate intrinsic value of options outstanding and options exercisable were $0. The total intrinsic value of options exercised during the year ended June 30, 2014, 2013 and 2012 was $35,496, $50,809 and $44,249, respectively.
52
California First National Bancorp and Subsidiaries
Note 15 – Regulatory Capital Requirements:
The Company and CalFirst Bank are subject to regulatory capital adequacy guidelines administered by federal banking agencies. Failure to meet minimum capital requirements can result in the initiation of certain actions by the federal agencies that, if undertaken, could have a material effect on the Company’s financial statements. The Company currently is required to maintain (i) Tier 1 risk-based capital equal to at least six percent (6%) of its risk-weighted assets; (ii) total risk-based capital (the sum of Tier 1 and Tier 2 capital) equal to ten percent (10%) of risk-weighted assets; and (iii) a minimum Tier 1 "leverage ratio" (measuring Tier 1 risk-based capital as a percentage of adjusted total assets) of at least five percent (5%). CalFirst Bank is subject to risk-based and leverage capital requirements mandated by the Office of the Comptroller of the Currency. The Bank is required to maintain (i) a minimum ratio of Tier 1 risk-based capital to risk-adjusted assets of four percent (4%) and (ii) a minimum ratio of qualifying total capital to risk-adjusted assets of eight percent (8%). In connection with a plan to expand its commercial lease portfolio, the Bank is required to maintain a Tier 1 capital ratio of not less than 14% through June 30, 2015.
The following table presents capital and capital ratio information for the Company and its banking subsidiary as of June 30, 2014 and 2013. At June 30, 2014, the Company and CalFirst Bank exceeded all capital requirements by significant amounts.
|
June 30,
|
|||||||||||||||||
|
2014
|
2013
|
||||||||||||||||
|
(dollars in thousands)
|
|||||||||||||||||
|
California First National Bancorp
|
Amount
|
Ratio
|
Amount
|
Ratio
|
|||||||||||||
|
Tier 1 risk-based capital
|
$ | 183,321 | 31.84 | % | $ | 180,289 | 32.90 | % | |||||||||
|
Total risk-based capital
|
$ | 188,645 | 32.76 | % | $ | 185,436 | 33.80 | % | |||||||||
|
Tier 1 leverage capital
|
$ | 183,321 | 32.80 | % | $ | 180,289 | 32.10 | % | |||||||||
|
California First National Bank
|
|||||||||||||||||
|
Tier 1 risk-based capital
|
$ | 102,780 | 19.61 | % | $ | 97,699 | 20.40 | % | |||||||||
|
Total risk-based capital
|
$ | 107,639 | 20.54 | % | $ | 102,358 | 21.40 | % | |||||||||
|
Tier 1 leverage capital
|
$ | 102,780 | 21.09 | % | $ | 97,699 | 20.40 | % | |||||||||
Note 16 – Commitments and Contingencies:
The Company has commitments to extend credit provided there is no violation of any condition in the terms of the approval or agreement. At June 30, 2014 and 2013, the Company had approved lease and loan commitments of $98.1 million and $97.4 million, respectively. These lease and loan commitments are approved transactions, but it is likely that some portion of these commitments will not fund or be completed. The Company does not issue standby letters of credit.
Leases
The Company leases its corporate offices under an operating lease that expires in fiscal 2019. Rent expense was $680,000 (2014), $922,000 (2013) and $935,000 (2012).
|
Years ending
June 30, |
Future minimum
lease payments |
||||
|
2015
|
$ | 629 | |||
|
2016
|
656 | ||||
|
2017
|
689 | ||||
|
2018
|
720 | ||||
|
Thereafter
|
121 | ||||
| $ | 2,815 | ||||
53
California First National Bancorp and Subsidiaries
Litigation
From time to time, the Company is party to legal actions and administrative proceedings and subject to various claims arising out of the Company’s normal business activities. Management does not expect the outcome of any of these matters, individually and in the aggregate, to have a material adverse effect on the financial condition and results of operations of the Company.
401(k) Plan
Employees of the Company may participate in a voluntary defined contribution plan (the "401K Plan") qualified under Section 401(k) of the Internal Revenue Code of 1986. Under the 401K Plan, employees who have met certain age and service requirements may contribute up to a certain percentage of their compensation. The Company has made contributions of $121,889 (2014), $117,967 (2013) and $106,939 (2012).
Note 17 – Segment Reporting:
The Company’s leasing subsidiary, CalFirst Leasing, and banking subsidiary, CalFirst Bank, are considered to be two different business segments. The accounting policies of each segment are the same as those described in “Summary of Significant Accounting Policies” (see Note 1). Below is a summary of each segment’s financial results for 2014, 2013 and 2012:
|
CalFirst
Bank |
CalFirst
Leasing |
Bancorp and
Eliminating |
Consolidated
|
|||||||||||||
|
(in thousands)
|
||||||||||||||||
|
Year end June 30, 2014:
|
||||||||||||||||
|
Total finance, loan and interest income
|
$ | 17,062 | $ | 2,678 | $ | 1 | $ | 19,741 | ||||||||
|
Net finance, loan and interest income after provision for credit losses
|
13,783 | 2,720 | 1 | 16,504 | ||||||||||||
|
Non-interest income
|
2,520 | 3,044 | - | 5,564 | ||||||||||||
|
Net earnings
|
5,081 | 2,817 | (847 | ) | 7,051 | |||||||||||
|
Total assets
|
$ | 518,940 | $ | 92,787 | $ | (32,177 | ) | $ | 579,550 | |||||||
|
Year end June 30, 2013:
|
||||||||||||||||
|
Total finance, loan and interest income
|
$ | 16,905 | $ | 4,493 | $ | 5 | $ | 21,403 | ||||||||
|
Net finance, loan and interest income after provision for credit losses
|
13,590 | 4,869 | 5 | 18,464 | ||||||||||||
|
Non-interest income
|
2,020 | 2,811 | 0 | 4,831 | ||||||||||||
|
Net earnings
|
4,960 | 2,817 | (423 | ) | 7,354 | |||||||||||
|
Total assets
|
$ | 464,864 | $ | 89,342 | $ | 4,697 | $ | 558,903 | ||||||||
|
Year end June 30, 2012:
|
||||||||||||||||
|
Total finance, loan and interest income
|
$ | 16,108 | $ | 7,451 | $ | 79 | $ | 23,638 | ||||||||
|
Net finance, loan and interest income after provision for credit losses
|
12,673 | 7,972 | 79 | 20,724 | ||||||||||||
|
Non-interest income
|
448 | 5,410 | 0 | 5,858 | ||||||||||||
|
Net earnings
|
4,533 | 4,891 | (521 | ) | 8,903 | |||||||||||
|
Total assets
|
$ | 375,207 | $ | 129,878 | $ | (18,914 | ) | $ | 486,171 | |||||||
54
California First National Bancorp and Subsidiaries
Note 18 – California First National Bancorp (Parent Only) Financial Information:
The condensed financial statements of California First National Bancorp as of June 30, 2014 and 2013 and for the years ended June 30, 2014, 2013 and 2012 are presented as follows:
|
Condensed Balance Sheets
|
June 30,
|
|||||||
|
(in thousands, except share amounts)
|
2014
|
2013
|
||||||
|
ASSETS
|
||||||||
|
Cash and cash equivalents
|
$ | 2,796 | $ | 4,584 | ||||
|
Intercompany receivable
|
32 | 106 | ||||||
|
Investment in banking subsidiary
|
103,000 | 98,155 | ||||||
|
Investment in nonbanking subsidiaries
|
77,337 | 74,450 | ||||||
|
Intercompany note receivable
|
- | 3,682 | ||||||
|
Other assets
|
1,170 | 1,203 | ||||||
|
Premises and other fixed assets
|
261 | 193 | ||||||
| $ | 184,596 | $ | 182,373 | |||||
|
LIABILITIES AND STOCKHOLDERS' EQUITY
|
||||||||
|
Liabilities
|
||||||||
|
Accrued liabilities
|
$ | 495 | $ | 421 | ||||
|
Intercompany payable
|
126 | 137 | ||||||
|
Income taxes payable- deferred
|
230 | 936 | ||||||
| 851 | 1,494 | |||||||
|
Stockholders' equity
|
||||||||
|
Preferred stock; 2,500,000 shares authorized; none issued
|
- | - | ||||||
|
Common stock, $.01 par value; 20,000,000 shares authorized; 10,459,924 (2014) and 10,447,227 (2013) issued and outstanding
|
105 | 104 | ||||||
|
Additional paid in capital
|
3,372 | 3,213 | ||||||
|
Retained earnings
|
179,844 | 176,972 | ||||||
|
Other comprehensive income, net of tax
|
424 | 590 | ||||||
| 183,745 | 180,879 | |||||||
| $ | 184,596 | $ | $182,373 | |||||
|
Condensed Statements of Earnings
|
Years Ended June 30,
|
|||||||||||
|
(in thousands)
|
2014 | 2013 | 2012 | |||||||||
|
Income:
|
||||||||||||
|
Dividends from non-bank subsidiary
|
$ | - | $ | - | $ | - | ||||||
|
Management fee income bank subsidiary
|
569 | 336 | 123 | |||||||||
|
Management fee income non-bank subsidiaries
|
151 | 628 | 676 | |||||||||
|
Interest income non-bank subsidiaries
|
22 | 331 | 648 | |||||||||
|
Other interest income
|
1 | 5 | 78 | |||||||||
| 743 | 1,300 | 1,525 | ||||||||||
|
Non-interest Expenses:
|
||||||||||||
|
Salaries & benefits
|
1,186 | 1,332 | 1,202 | |||||||||
|
Occupancy
|
140 | 142 | 152 | |||||||||
|
Professional services
|
274 | 282 | 243 | |||||||||
|
Other general & administrative
|
488 | 171 | 187 | |||||||||
| 2,088 | 1,927 | 1,784 | ||||||||||
|
Income (loss) before taxes and equity in undistributed earnings of subsidiaries
|
(1,345 | ) | (627 | ) | (259 | ) | ||||||
|
Income tax expense
|
(498 | ) | (204 | ) | 262 | |||||||
|
Equity in undistributed earnings of subsidiaries
|
7,898 | 7,777 | 9,424 | |||||||||
|
Net Income
|
$ | 7,051 | $ | 7,354 | $ | 8,903 | ||||||
55
California First National Bancorp and Subsidiaries
|
Condensed Statements of Cash Flows
|
Years Ended June 30,
|
|||||||||||
|
(in thousands)
|
2014 | 2013 | 2012 | |||||||||
|
CASH FLOWS FROM OPERATING ACTIVITIES:
|
||||||||||||
|
Net income
|
$ | 7,051 | $ | 7,354 | $ | 8,903 | ||||||
|
Adjustments to reconcile net earnings to cash flows:
|
||||||||||||
|
Amortization of premiums or discounts on securities, net
|
- | - | 1 | |||||||||
|
Deferred income taxes
|
(706 | ) | 558 | (290 | ) | |||||||
|
Equity in undistributed earnings of subsidiaries
|
(7,898 | ) | (7,777 | ) | (9,424 | ) | ||||||
|
Net change in other liabilities
|
74 | (797 | ) | 134 | ||||||||
|
Net change in other assets
|
37 | (347 | ) | 318 | ||||||||
|
Other, net
|
(68 | ) | (25 | ) | (157 | ) | ||||||
|
Net cash used for operating activities
|
(1,510 | ) | (1,034 | ) | (515 | ) | ||||||
|
CASH FLOWS FROM INVESTING ACTIVITIES:
|
||||||||||||
|
Proceeds from sale of investment securities
|
- | - | 2,270 | |||||||||
|
Payments for investments in and (advances to) subsidiaries
|
3,745 | 22,192 | 9,345 | |||||||||
|
Net cash provided by investing activities
|
3,745 | 22,192 | 11,615 | |||||||||
|
CASH FLOWS FROM FINANCING ACTIVITIES:
|
||||||||||||
|
Proceeds from issuance of common stock
|
156 | 164 | 195 | |||||||||
|
Dividends paid
|
(4,179 | ) | (22,985 | ) | (11,462 | ) | ||||||
|
Net cash used for financing activities
|
(4,023 | ) | (22,821 | ) | (11,267 | ) | ||||||
|
NET CHANGE IN CASH AND CASH EQUIVALENTS
|
(1,788 | ) | (1,663 | ) | (167 | ) | ||||||
|
CASH AND CASH EQUIVALENTS AT BEGINNING OF PERIOD
|
4,584 | 6,247 | 6,414 | |||||||||
|
CASH AND CASH EQUIVALENTS AT END OF PERIOD
|
$ | 2,796 | $ | 4,584 | $ | 6,247 | ||||||
Note 19 – Selected Quarterly Financial Data (Unaudited):
Summarized quarterly financial data for the fiscal years ended June 30, 2014 and 2013 is as follows:
|
Three months ended
|
||||||||||||||||
|
September 30,
|
December 31,
|
March 31,
|
June 30,
|
|||||||||||||
|
(in thousands, except per share amounts)
|
||||||||||||||||
|
2014
|
||||||||||||||||
|
Total finance and loan income
|
$ | 5,012 | $ | 4,877 | $ | 4,849 | $ | 5,003 | ||||||||
|
Net finance, loan and interest income after provision of credit losses
|
4,220 | 4,113 | 4,121 | 4,050 | ||||||||||||
|
Non-interest income
|
1,412 | 2,190 | 626 | 1,336 | ||||||||||||
|
Net earnings
|
$ | 1,831 | $ | 2,184 | $ | 1,190 | $ | 1,846 | ||||||||
|
Basic earnings per common share
|
$ | 0.18 | $ | 0.21 | $ | 0.11 | $ | 0.18 | ||||||||
|
Diluted earnings per common share
|
$ | 0.18 | $ | 0.21 | $ | 0.11 | $ | 0.18 | ||||||||
|
Dividends declared per common share
|
$ | - | $ | 0.40 | $ | - | $ | - | ||||||||
|
2013
|
||||||||||||||||
|
Total finance and loan income
|
$ | 5,394 | $ | 5,250 | $ | 5,442 | $ | 5,318 | ||||||||
|
Net finance, loan and interest income after provision of credit losses
|
4,548 | 4,647 | 4,735 | 4,535 | ||||||||||||
|
Non-interest income
|
978 | 1,248 | 1,754 | 851 | ||||||||||||
|
Net earnings
|
$ | 1,538 | $ | 1,810 | $ | 2,101 | $ | 1,906 | ||||||||
|
Basic earnings per common share
|
$ | 0.15 | $ | 0.17 | $ | 0.20 | $ | 0.18 | ||||||||
|
Diluted earnings per common share
|
$ | 0.15 | $ | 0.17 | $ | 0.20 | $ | 0.18 | ||||||||
|
Dividends declared per common share
|
$ | - | $ | 2.20 | $ | - | $ | - | ||||||||
56
California First National Bancorp and Subsidiaries
|
ITEM 9.
|
None.
ITEM 9A. CONTROLS AND PROCEDURES
Conclusion Regarding the Effectiveness of Disclosure Controls and Procedures
The Company maintains disclosure controls and procedures designed to ensure that information required to be disclosed in the reports that it files or submits under the Securities Exchange Act of 1934 is recorded, processed, summarized and reported, within the time periods specified in the Securities and Exchange Commission’s rules and forms. As of the end of the period covered by this report, the Company's management, including its principal executive officer and its principal financial officer, evaluated the effectiveness of the Company's disclosure controls and procedures, as such term is defined in Rule 13a-15(e) promulgated under the Securities Exchange Act of 1934, as amended and have concluded that the Company's disclosure controls and procedures are adequate and effective for the purposes set forth in the definition in Exchange Act rules.
Management’s Report on Internal Control Over Financial Reporting
The management of California First National Bancorp is responsible for establishing and maintaining adequate internal control over financial reporting. Internal control over financial reporting is a process designed by, or under the supervision of, the Company’s principal executive and principal financial officers and effected by the Company’s board of directors, management and other personnel to provide reasonable assurance regarding the reliability of financial reporting and the preparation of financial statements for external purposes in accordance with generally accepted accounting principles and includes those policies and procedures that:
|
|
·
|
Pertain to the maintenance of records that in reasonable detail accurately and fairly reflect the transactions and dispositions of the assets of the Company;
|
|
|
·
|
Provide reasonable assurance that transactions are recorded as necessary to permit preparation of financial statements in accordance with generally accepted accounting principles, and that receipts and expenditures of the Company are being made only in accordance with authorizations of management and directors of the Company; and
|
|
|
·
|
Provide reasonable assurance regarding prevention or timely detection of unauthorized acquisition, use or disposition of the Company’s assets that could have a material effect on the financial statements.
|
Because of inherent limitations, internal control over financial reporting may not prevent or detect misstatements. Projections of any evaluation of effectiveness to future periods are subject to the risks that controls may become inadequate because of changes in conditions, or that the degree of compliance with the policies or procedures may deteriorate.
Management assessed the effectiveness of the Company’s internal control over financial reporting as of June 30, 2014. The assessment included the documentation and understanding of the Company’s internal control over financial reporting. Management evaluated the design effectiveness and tested the operating effectiveness of internal controls over financial reporting to form its conclusion.
Based on this evaluation, management concluded that, as of June 30, 2014, the Company’s internal control over financial reporting is effective to provide reasonable assurance that the Company’s financial statements are fairly presented in conformity with generally accepted accounting principles.
Vavrinek, Trine, Day and Co., LLP, independent registered public accounting firm, is not required to nor has it reported on the effectiveness of the Company’s internal control over financial reporting as of June 30, 2014.
Changes in Internal Control Over Financial Reporting
There were no significant changes made during the most recent fiscal year to the Company's internal controls or other factors that could significantly affect the Company's internal control over financial reporting.
ITEM 9B. OTHER INFORMATION
None.
57
California First National Bancorp and Subsidiaries
PART III
ITEM 10. DIRECTORS, EXECUTIVE OFFICERS AND CORPORATE GOVERNANCE
The information required by this item is incorporated herein by reference to the Company's definitive proxy statement to be filed not later than October 28, 2014 with the Securities and Exchange Commission pursuant to Regulation 14A under the Securities Exchange Act of 1934, as amended.
We have a Code of Business Conduct and Ethics within the meaning of Item 406 of Regulation S-K adopted by the SEC under the Exchange Act that applies to our principal executive officer, principal financial and accounting officer. Our Code of Business Conduct and Ethics is available on the Company’s website (www.calfirstbancorp.com), and we intend to satisfy the disclosure requirement under Item 5.05 of Form 8-K regarding any amendment to, or waiver from, a provision of our code of ethics by posting such information on our website. The information contained on the Company’s website is not part of this or any other report we file with or furnish to the SEC and is not incorporated by reference herein.
ITEM 11. EXECUTIVE COMPENSATION
The information required by this item is incorporated herein by reference to the Company's definitive proxy statement to be filed not later than October 28, 2014 with the Securities and Exchange Commission pursuant to Regulation 14A under the Securities Exchange Act of 1934, as amended.
|
ITEM 12.
|
The information required by this item is incorporated herein by reference to the Company's definitive proxy statement to be filed not later than October 28, 2014 with the Securities and Exchange Commission pursuant to Regulation 14A under the Securities Exchange Act of 1934, as amended.
ITEM 13. CERTAIN RELATIONSHIPS AND RELATED TRANSACTIONS
The information required by this item is incorporated herein by reference to the Company's definitive proxy statement to be filed not later than October 28, 2014 with the Securities and Exchange Commission pursuant to Regulation 14A under the Securities Exchange Act of 1934, as amended.
ITEM 14. PRINCIPAL ACCOUNTANT FEES AND SERVICES
The information required by this item is incorporated herein by reference to the Company's definitive proxy statement to be filed not later than October 28, 2014 with the Securities and Exchange Commission pursuant to Regulation 14A under the Securities Exchange Act of 1934, as amended.
PART IV
ITEM 15. EXHIBITS AND FINANCIAL STATEMENT SCHEDULES
(a) Financial Statements and Schedules
|
|
All financial statements are set forth under Item 8 of this annual report on Form 10-K. Financial statement schedules have been omitted since they are either not required, not applicable, or the information is otherwise included.
|
(b) Exhibits:
58
California First National Bancorp and Subsidiaries
|
Exhibit #
|
Description of Exhibit
|
Page No.
|
||
|
2.1
|
Agreement of Merger dated as of May 22, 2001 among Amplicon, Inc., California First National Bancorp and CFNB Merger Sub (incorporated by reference to Exhibit 2.1 to Registrant's Statement on Form 8-K dated May 25, 2001)
|
|||
|
3.1
|
Articles of Incorporation of California First National Bancorp (incorporated by reference to Exhibit 3.1 to Registrant's Statement on Form 8-K dated May 25, 2001)
|
|||
|
3.2
|
Bylaws of California First National Bancorp (incorporated by reference to Exhibit 3.2 to Registrant's Statement on Form 8-K dated May 25, 2001)
|
|||
|
10.1
|
1995 Equity Participation Plan, as amended to date (incorporated by reference to Exhibit 10.1 to Registrant’s Statement on Form S-8 File No. 333-15683)
|
|||
|
10.2
|
Capital Assurances and Liquidity Maintenance Agreement between California First National Bancorp and California First National Bank, effective as of May 23, 2001 (incorporated by reference to Exhibit 10.1 to Registrant's Statement on Form 8-K dated May 25, 2001)
|
|||
|
10.3
|
Agreement by and between California First National Bank and the Office of the Comptroller of the Currency dated as of May 23, 2001 (incorporated by reference to Exhibit 10.2 to Registrant's Statement on Form 8-K dated May 25, 2001)
|
|||
|
10.4
|
Business Loan Agreement between California First Leasing Corporation and Bank of America dated as of March 25, 2010 (incorporated by reference to Exhibit 10.6 to Registrant's Statement on Form 8-K dated April 20, 2010)
|
|||
|
10.5
|
Second Amendment to the Business Loan Agreement between California First Leasing Corporation and Bank of America dated as of April 26, 2011 (incorporated by reference to Exhibit 10.11 to Registrant's March 31, 2011 10-Q)
|
|||
|
10.6
|
Third Amendment to the Business Loan Agreement between California First Leasing Corporation and Bank of America dated as of April 20, 2012 (incorporated by reference to Exhibit 10.12 to Registrant's March 31, 2012 10-Q)
|
|||
|
31.1
|
Rule 13a-14(a)/15d-14(a) Certifications of Principal Executive Officer
|
61
|
||
|
31.2
|
Rule 13a-14(a)/15d-14(a) Certifications of Principal Financial Officer
|
62
|
||
|
32.0
|
Section 1350 Certifications by Principal Executive Officer and Principal Financial Officer
|
63
|
59
California First National Bancorp and Subsidiaries
Pursuant to the requirements of Section 13 or 15 (d) of the Securities Exchange Act of 1934, the Registrant has duly caused this report to be signed on its behalf by the undersigned, thereunto duly authorized.
CALIFORNIA FIRST NATIONAL BANCORP
| By |
/s/ S. Leslie Jewett
|
|
Date: | September 23, 2014 | |
|
S. Leslie Jewett
Executive Vice President
(Principal Financial and Accounting Officer)
|
|||||
POWER OF ATTORNEY
Each person whose signature appears below hereby authorizes each of Patrick E. Paddon, S. Leslie Jewett and Glen T. Tsuma as attorney-in-fact to sign on his behalf, individually in each capacity stated below, and to file all amendments and/or supplements to this Annual Report on Form 10-K.
Pursuant to the requirements of the Securities Exchange Act of 1934, this report has been signed below by the following persons on behalf of the Registrant in the capacities and on the dates indicated.
| Signature | Title | Date | ||
|
|
||||
| /s/ Patrick E. Paddon |
President, Chief Executive
|
September 23, 2014
|
||
|
Patrick E. Paddon
|
Officer and Director
|
|||
| /s/ Glen T. Tsuma |
Vice President, Chief Operating
|
September 23, 2014
|
||
|
Glen T. Tsuma
|
Officer and Director
|
|||
| /s/ S. Leslie Jewett |
Executive Vice President
|
September 23, 2014
|
||
|
S. Leslie Jewett
|
(Principal Financial and Accounting Officer)
|
|||
| /s/ Michael H. Lowry |
Director
|
September 23, 2014
|
||
|
Michael H. Lowry
|
||||
| /s/ Harris Ravine |
Director
|
September 23, 2014
|
||
|
Harris Ravine
|
||||
| /s/ Danilo Cacciamatta |
Director
|
September 23, 2014
|
||
|
Danilo Cacciamatta
|
60