Attached files
| file | filename |
|---|---|
| 8-K - CHINA FUND INC | fp0011695_8k.htm |

Data as of 8/31/14
Manager's Commentary
Market Review
The Chinese equity markets consolidated after disappointing macroeconomic data and their strong run in July. The latest HSBC/Markit Purchasing Managers' Index ("PMI") for China fell from 51.7 to 50.2 for August, significantly lower than the consensus forecast of 51.5. Nevertheless, the strong inflows into Chinese and Hong Kong equities continued from July. News on state-owned enterprises ("SOE") reform, the Shanghai-Hong Kong mutual market access scheme and targeted stimulus measures supported the equity markets. Although companies generally reported lackluster earnings for the first half of the year, share prices reacted positively on low expectations and better than expected earnings for the second half of the year.
In Taiwan, after consolidating in the first half of the month, the TWSE Index traded higher with the support of better than expected industrial production figures for July which rose 6.08% year-on-year. The key drivers have been a recovery in key export markets along with the improving domestic economy.
Fund Review
In August, the China Fund, Inc. (the "Fund") underperformed the MSCI Global Dragon Index (the "benchmark index"). Stock selection in the Financials sector and an underweight to Telecom Services were the largest detractors, while stock selection in Consumer Discretionary and an underweight to Financials were the largest contributors.
Two of the main detractors for the month of August were China Minsheng Bank and China Mobile. With respect to China Minsheng Bank, a Chinese bank with a focus on making loans to small and medium sized enterprises, the market was concerned over the deterioration in asset quality and the macro uncertainty. However, we remain positive on its lending business and improving retail banking franchise in the longer term. Since China Mobile, one of the largest mobile telecommunications companies in the world, performed relatively strong in the reporting period and is substantially represented in the benchmark, the Fund's lack of position in this specific title hurt relative performance. China Mobile's share price rally was driven by industry reforms and strong subscriber growth rather than earnings.
Conversely, the main contributors for August were Comba Telecom Systems and Hermes Microvision. Comba, a Chinese company providing wireless infrastructure and solutions to mobile operators and enterprises, reported a turnaround in earnings and the strong demand for its antenna business continues as Chinese telecoms speed up their 4G network build out. Hermes Microvision, a Taiwan manufacturer of semiconductor inspection tools, guided positively for full year 2014 earnings and sales growth is on track for a 30%+ year-on-year increase. The company has planned for higher capital expenditure in 2015, which is expected to further drive future growth.
Key Transaction
The key transaction for the month was to narrow the underweight to the Chinese banking sector. We expect that positive sentiment ahead of the launch of the Shanghai-Hong Kong mutual market access scheme will drive Chinese and Hong Kong equities, in particular large cap H-shares.
Outlook
After a period of sustained increases in stock prices, the China/Hong Kong equity markets are likely to consolidate in the short term. Macroeconomic data indicating continued soft economic activity will undermine market sentiment in the short term. On the other hand, further news on reforms will be supportive of Hong Kong/China equities. On balance, we expect the Hong Kong and Chinese equity markets to be range bound. Against this backdrop, our approach would be to take advantage of recent share price strength and reduce exposure to selective outperformers, particularly cyclicals, and rotate into stocks with relatively more attractive risk-reward.
In Taiwan, earnings season started in July and the 2Q14 financial results, in general, were better-than- expected. However, concerns over the outlook for the semiconductor sector have led to profit-taking among investors. Investors reduced their risk appetites and switched to holdings with lower valuations.
|
In Brief
|
|
|
Fund Data
|
|
|
Description
|
Seeks to achieve longterm capital appreciation through investments in China companies.
|
|
Listing Date (NYSE)
|
July 10, 1992
|
|
Total Fund Assets (millions)
|
$388.5
|
|
Median Market Cap (in billions)
|
$6.1
|
|
Distribution Frequency
|
Annual
|
|
Management Firm
|
Allianz Global Investors Firm U.S. LLC
|
|
Portfolio Managment
|
Christina Chung, CFA Lead Portfolio Manager
|
|
Performance (US$ Returns)
(as of 8/31/14)
|
||
|
Fund
|
Benchmark1
|
|
|
One Month
|
0.28% |
0.99%
|
|
Three Months
|
7.65% |
9.70%
|
|
One Year
|
20.17% |
20.41%
|
|
Three Years % pa
|
7.29% |
9.22%
|
|
Net Asset Value / Market Price
|
|
|
Net Asset Value (NAV) Market Price at Inception
|
$13.15 / $14.26
|
|
NAV / Market Price (as of 8/31/14)
|
$24.78 / $22.17
|
|
High / Low Ranges (52-Week)
|
|
|
High / Low NAV
|
$26.60 / $21.65
|
|
High / Low Market Price
|
$23.51 / $19.41
|
|
Premium/Discount to NAV
|
-10.53%
|
|
Fund Data (Common Shares)
|
|
|
Shares Outstanding
|
15,682,028
|
|
Average Daily Volume
|
43,181
|
|
Expense Ratio
|
1.30%
|
|
Fund Managers
|
|
 |
|
|
Christina Chung, CFA
Lead Portfolio Manager
|

The China Fund, Inc.
Investment Objective
The investment objective of the Fund is to achieve long-term capital appreciation. The Fund seeks to achieve its objective through investment in the equity securities of companies and other entities with significant assets, investments, production activities, trading or other business interests in China or which derive a significant part of their revenue from China.
The Fund has an operating policy that the Fund will invest at least 80% of its assets in China companies. For this purpose, 'China companies' are (i) companies for which the principal securities trading market is in China; (ii) companies for which the principal securities trading market is outside of China or in companies organized outside of China, that in both cases derive at least 50% of their revenues from goods or services sold or produced, or have a least 50% of their assets in China; or (iii) companies organized in China. Under the policy, China means the People's Republic of China, including Hong Kong, and Taiwan. The Fund will provide its stockholders with at least 60 days' prior notice of any change to this policy.
|
Average Annual Returns
|
||||||||
|
1 Month
|
3 Month
|
YTD
|
1 Year
|
3 Year
|
5 Year
|
10 Year Inception
|
||
|
NAV
|
0.28%
|
7.65%
|
7.55%
|
20.17%
|
7.29%
|
11.61%
|
15.54%
|
11.11%
|
|
Market Price
|
0.41%
|
9.00%
|
6.54%
|
23.53%
|
6.56%
|
10.90%
|
12.64%
|
10.15%
|
|
MSCI Golden Dragon Index
|
0.99%
|
9.70%
|
10.74%
|
20.41%
|
9.22%
|
9.45%
|
10.68%
|
—
|
|
Calendar Year Returns
|
||||||||
|
2006
|
2007
|
2008
|
2009
|
2010
|
2011
|
2012
|
2013
|
|
|
NAV
|
57.10%
|
86.20%
|
-46.95%
|
72.83%
|
27.26%
|
-24.37%
|
12.12%
|
18.31%
|
|
Market Price
|
65.68%
|
50.24%
|
-40.65%
|
72.19%
|
23.60%
|
-27.51%
|
20.52%
|
12.70%
|
|
MSCI Golden Dragon Index
|
39.50%
|
37.97%
|
-49.37%
|
67.12%
|
13.60%
|
-18.35%
|
22.65%
|
7.25%
|
Past performance is not a guide to future returns.
Returns are annualized, except for periods or less than one year.
Source: State Street Bank and Trust Company. Source for index data: MSCI as at August 31, 2014. Investment returns are historical and do not guarantee future results. Investment returns reflect changes in net asset value and market price per share during each period and assumes that dividends and capital gains distributions, if any, were reinvested. The net asset value (NAV) percentages are not an indication of the performance of a shareholder's investment in the Fund, which is based on market price. NAV performance includes the deduction of management fees and other expenses. Market price performance does not include the deduction of brokerage commissions and other expenses of trading shares and would be lower had such commissions and expenses been deducted. It is not possible to invest directly in an index.
Premium Discount

|
Sector Allocation
|
Fund
|
Benchmark1
|
|
Information Technology
|
29.67%
|
23.36%
|
|
Financials
|
23.52%
|
36.32%
|
|
Consumer Discretionary
|
12.44%
|
7.31%
|
|
Industrials
|
10.41%
|
6.00%
|
|
Energy
|
6.62%
|
7.00%
|
|
Consumer Staples
|
4.03%
|
3.10%
|
|
Materials
|
1.08%
|
4.23%
|
|
Health Care
|
0.99%
|
0.88%
|
|
Telecom Services
|
0.00%
|
7.14%
|
|
Utilities
|
0.00%
|
4.59%
|
|
Other assets & liabilities
|
11.23%
|
0.00%
|
|
Country Allocation
|
||
|
China
|
63.60%
|
|
|
Hong Kong Red Chips
|
9.80%
|
|
|
Hong Kong 'H' shares
|
22.40%
|
|
|
Equity linked securities ('A' shares)
|
7.70%
|
|
|
China 'A' & 'B' shares
|
0.00%
|
|
|
Other Hong Kong securities
|
23.70%
|
|
|
Singapore
|
0.00%
|
|
|
Taiwan
|
24.90%
|
|
|
Direct
|
0.00%
|
|
|
Other assets & liabilities
|
11.50%
|
|
|
Top 10 Holdings
|
|
|
CHINA MINSHENG BK (China)
|
5.25%
|
|
BEIJING ENTERPRISES HLDG (China)
|
3.74%
|
|
PETROCHINA CO LTD (China)
|
3.50%
|
|
HONG KONG EXCHANGES AND CLEARING LTD (H.K.)
|
3.42%
|
|
TAIWAN SEMIC CO LTD (Taiwan)
|
3.33%
|
|
DELTA ELECTRONICS INC (Taiwan)
|
3.12%
|
|
SUN HUNG KAI PROPERTIES LTD (H.K.)
|
3.08%
|
|
HERMES MICROVISION INC (Taiwan)
|
2.98%
|
|
LI & FUNG LTD (H.K.)
|
2.97%
|
|
TENCENT HOLDINGS LTD (China)
|
2.63%
|
|
Portfolio Characteristics
|
||
|
Fund
|
Benchmark^
|
|
|
P/E Ratio
|
11.93
|
11.67
|
|
P/B Ratio
|
1.75
|
1.63
|
|
Issues in Portfolio
|
44
|
281
|
|
Foreign Holdings (%)
|
88.77
|
100.00
|
|
Cash (%)
|
11.23
|
0.00
|
|
Yield (%)
|
2.66
|
2.87
|
1. MSCI Golden Dragon Index
The China Fund, Inc.
|
Distribution History (10 Year)
|
|||||||||||||||||||
|
Declaration
Date
|
Ex-dividend
Date
|
Record
Date
|
Payable
Date
|
Distribution/
Share
|
Income
|
Long-term
Capital Gain
|
Short-term
Capital Gain
|
||||||||||||
|
12/13/04
|
12/20/04
|
12/22/04
|
1/7/05
|
$ | 3.57010 | $ | 0.19630 | $ | 3.26640 | $ | 0.10740 | ||||||||
|
12/9/05
|
12/19/05
|
12/21/05
|
12/29/05
|
$ | 2.51190 | $ | 0.21720 | $ | 2.29470 | — | |||||||||
|
12/8/06
|
12/19/06
|
12/21/06
|
12/29/06
|
$ | 4.01170 | $ | 0.29960 | $ | 2.73090 | $ | 0.98120 | ||||||||
|
12/7/07
|
12/19/07
|
12/21/07
|
1/25/08
|
$ | 12.12000 | $ | 0.28000 | $ | 9.00000 | $ | 2.84000 | ||||||||
|
12/8/08
|
12/22/08
|
12/24/08
|
1/23/09
|
$ | 5.81740 | $ | 0.48130 | $ | 5.33610 | — | |||||||||
|
12/9/09
|
12/22/09
|
12/24/09
|
12/29/09
|
$ | 0.25570 | $ | 0.25570 | — | — | ||||||||||
|
12/8/10
|
12/21/10
|
12/24/10
|
12/29/10
|
$ | 2.27420 | $ | 0.37460 | $ | 1.89960 | — | |||||||||
|
12/8/11
|
12/21/11
|
12/23/11
|
12/29/11
|
$ | 2.99640 | $ | 0.17420 | $ | 2.82220 | — | |||||||||
|
12/10/12
|
12/20/12
|
12/24/12
|
12/28/12
|
$ | 3.25170 | $ | 0.34730 | $ | 2.90440 | — | |||||||||
|
12/13/13
|
12/19/13
|
12/23/13
|
12/27/13
|
$ | 3.31400 | $ | 0.43870 | $ | 2.87530 | — | |||||||||
Distribution/Share includes Income, Long-term Capital gains and Short-term Capital gains.
The China Fund NAV Performance of $10,000 since inception (with dividends reinvested at NAV price)
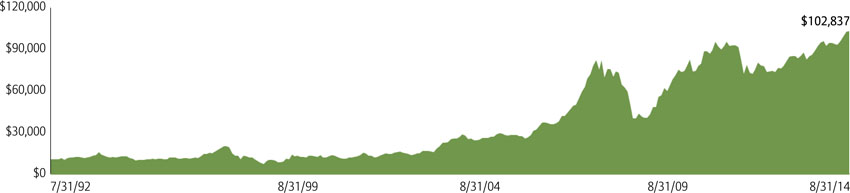
Past performance is not a guide to future returns.
Index Description
MSCI Golden Dragon Index
The MSCI Golden Dragon Index captures the equity market performance of large and mid cap China securities (H shares, B shares, Red-Chips and P-Chips) and non-domestic China securities listed in Hong Kong and Taiwan.
It is not possible to invest directly in an index.
The China Fund, Inc.
|
Portfolio in Full
|
|||||
|
Sector
|
Company (exchange ticker)
|
Price
|
Holding
|
Value US$
|
% of
net assets
|
|
Information Technology
|
29.68
|
||||
|
TAIWAN SEMICONDUCTOR MA
|
2330
|
124.00
|
3115000
|
12922500.46
|
3.33
|
|
DELTA ELECTRONIC
|
2308
|
210.00
|
1723000
|
12105183.92
|
3.12
|
|
HERMES MICROVISION INC
|
3658
|
1285.00
|
269000
|
11564376.64
|
2.98
|
|
TENCENT HLDGS LIMITED
|
700
|
126.50
|
625500
|
10209576.59
|
2.63
|
|
TONG HSING ELECTRONIC
|
6271
|
144.00
|
2067000
|
9957946.50
|
2.57
|
|
DIGITAL CHINA HLDGS
|
861
|
7.50
|
8865000
|
8578866.22
|
2.21
|
|
SEMICONDUCTOR MANUFACTU
|
981
|
0.73
|
86779000
|
8173863.73
|
2.11
|
|
LARGAN PRECISION CO
|
3008
|
2475.00
|
96000
|
7949013.90
|
2.05
|
|
ASM PACIFIC TECHNOLOGY
|
522
|
80.45
|
717000
|
7442778.53
|
1.92
|
|
ADVANTECH CO LTD
|
2395
|
280.50
|
632000
|
5930847.59
|
1.53
|
|
COMBA TELECOM SYSTEMS
|
2342
|
3.37
|
11150000
|
4848357.77
|
1.25
|
|
MEDIATEK INC
|
2454
|
499.50
|
283000
|
4729211.62
|
1.22
|
|
PRIMAX ELECTRONICS LTD(
|
4915
|
43.90
|
3174000
|
4661634.97
|
1.20
|
|
EPISTAR CORP
|
2448
|
65.00
|
1812000
|
3940382.40
|
1.02
|
|
HERMES MICROVISION INC
|
97457816
|
43.00
|
46900
|
2016465.50
|
0.52
|
|
Financials
|
23.52
|
||||
|
CHINA MINSHENG BANKING
|
1988
|
7.28
|
21671100
|
20356458.65
|
5.25
|
|
HONG KONG EXCHANGES &
|
388
|
178.10
|
576300
|
13243489.48
|
3.42
|
|
SUN HUNG KAI PROPERTIES
|
16
|
117.60
|
788000
|
11957033.09
|
3.08
|
|
INDUSTRIAL & COMMERCIAL
|
1398
|
5.14
|
14319000
|
9496546.52
|
2.45
|
|
PING AN INSURANCE(GROUP
|
2318
|
63.10
|
1153500
|
9391540.81
|
2.42
|
|
CHINA MERCHANTS BANK
|
3968
|
14.78
|
4312000
|
8223242.13
|
2.12
|
|
CHAILEASE HOLDING COMPA
|
5871
|
80.80
|
2711200
|
7328915.88
|
1.89
|
|
CATHAY FINANCIAL HLDG
|
2882
|
51.00
|
2292000
|
3910673.96
|
1.01
|
|
CLSA FINANCIAL PRODUCTS LTD (exch. for PING AN INSURANCE)
|
N/A
|
6.89
|
541933
|
3736140.30
|
0.96
|
|
SHUI ON LAND LIMITED
|
272
|
2.03
|
13467000
|
3527416.89
|
0.91
|
|
Consumer Discretionary
|
12.43
|
||||
|
LI & FUNG
|
494
|
9.62
|
9282000
|
11521433.78
|
2.97
|
|
MERIDA INDUSTRY
|
9914
|
220.00
|
1323000
|
9737542.03
|
2.51
|
|
QINGLING MOTORS CO
|
1122
|
2.48
|
28960000
|
9267020.64
|
2.39
|
|
CITIGROUP GLOBAL MARKETS WTS (exch. for GREE ELECTRICAL APP INC)
|
651
|
4.61
|
1435396
|
6621481.75
|
1.71
|
|
DONGFENG MOTOR GROUP CO
|
489
|
14.38
|
2108000
|
3911284.30
|
1.01
|
|
CLSA FINANCIAL PRODUCTS LTD (exch. for CHINA INTL TRAVEL SERVI)
|
N/A
|
6.08
|
626632
|
3809797.23
|
0.98
|
|
ZHONGSHENG GROUP HOLDIN
|
881
|
8.59
|
2996500
|
3321217.65
|
0.86
|
|
Industrials
|
10.43
|
||||
|
BEIJING ENTERPRISE HLDG
|
392
|
66.80
|
1683500
|
14510403.02
|
3.74
|
|
HUTCHISON WHAMPOA
|
13
|
101.20
|
736000
|
9610549.47
|
2.48
|
|
CSR CORP LIMITED
|
1766
|
7.00
|
9765000
|
8819829.29
|
2.28
|
|
CHINA EVERBRIGHT INTERN
|
257
|
10.62
|
5450000
|
7468113.52
|
1.93
|
|
Energy
|
6.62
|
||||
|
PETROCHINA CO
|
857
|
11.00
|
9564000
|
13574446.95
|
3.50
|
|
CNOOC LIMITED
|
883
|
15.56
|
4105000
|
8241621.13
|
2.13
|
|
CHINA SUNTIEN GREEN ENE
|
956
|
2.33
|
12785000
|
3843673.99
|
0.99
|
|
Consumer Staples
|
4.02
|
||||
|
CLSA FINANCIAL PRODUCTS LTD WT (exch. for KWEICHOW MOUTAI)
|
N/A
|
25.67
|
262090
|
6727090.24
|
1.74
|
|
NATURAL BEAUTY BIO-TECH
|
157
|
0.54
|
50320000
|
3506099.88
|
0.90
|
|
CITIGROUP GLOBAL MARKETS HOLD (exch.for SHANGHAI JAHWA UNITED)
|
N/A
|
5.50
|
513350
|
2821884.95
|
0.73
|
|
CLSA FINANCIAL PRODUCTS WTS (exch.for SHANGHAI JAHWA UNITED)
|
N/A
|
5.50
|
460100
|
2529169.70
|
0.65
|
|
Materials
|
1.08
|
||||
|
TIANGONG INTERNATIONAL
|
826
|
1.76
|
18480000
|
4196667.16
|
1.08
|
|
Health Care
|
0.99
|
||||
|
CITI ACCESS (exchangeable for JIANGSU HENGRUI MEDICAL)
|
N/A
|
5.49
|
696350
|
3823657.85
|
0.99
|
Important Information:
Source: State Street Bank and Trust Company, IDS GmbH-Analysis and Reporting Services, a subsidiary of Allianz SE.
Holdings are subject to change daily. The Fund seeks to achieve its objective through investment in the equity securities of companies and other entities with significant assets, investments, production activities, trading or other business interests in China or which derive a significant part of their revenue from China. Investing in non-U.S. securities entails additional risks, including political and economic risk and the risk of currency fluctuations, as well as lower liquidity. These risks, which can result in greater price volatility, will generally be enhanced in less diversified funds that concentrate investments in a particular geographic region.
The information contained herein has been obtained from sources believed to be reliable but Allianz Global Investors U.S. LLC and its affiliates do not warrant the information to be accurate, complete or reliable. The opinions expressed herein are subject to change at any time and without notice. Past performance is not indicative of future results. This material is not intended as an offer or solicitation for the purchase or sale of any financial instrument. Investors should consider the investment objectives, risks, charges and expenses of any mutual fund carefully before investing. This and other information is contained in the fund's annual and semiannual reports, proxy statement and other fund information, which may be obtained by contacting your financial advisor or visiting the fund's website at www.chinafundinc.com. This information is unaudited and is intended for informational purposes only. It is presented only to provide information on the Fund's holdings, performance and strategies. The Fund is a closed-end exchange traded management investment company. This material is presented only to provide information and is not intended for trading purposes. Closed-end funds, unlike open-end funds, are not continuously offered. After the initial public offering by a closed-end fund, its shares can be purchased and sold on the open market through a stock exchange, where shares may trade at a premium or a discount. The market price of holdings is subject to change daily.
P/E is a ratio of security price to earnings per share. Typically, an undervalued security is characterized by a low P/E ratio, while an overvalued security is characterized by a high P/E ratio. P/B is a ratio of the current stock price to the book value. This is used to identify undervalued stocks. Dividend yield is the annual percentage of return earned by an investor on a common or preferred stock. The average dividend yield is the dividend rate divided by current share price.
©2014 Allianz Global Investors Distributors LLC.
|
Investment Products: Not FDIC Insured | May Lose Value | Not Bank Guaranteed
|
AGI-2014-09-15-10525 | FS-CHN-0814
|