Attached files
| file | filename |
|---|---|
| EX-31.1 - CERTIFICATION OF THE CEO PURSUANT TO SECTION 302 - Guidewire Software, Inc. | gwre-7312014x10kex311.htm |
| EX-23.1 - CONSENT OF KPMG LLP - Guidewire Software, Inc. | gwre-7312014x10kex231.htm |
| EX-18.1 - KPMG, LLP PREFERABILITY LETTER - Guidewire Software, Inc. | gwre-7312014x10k_exx181.htm |
| EX-10.6 - FORM OF EXECUTIVE AGREEMENT - Guidewire Software, Inc. | gwre_7-31x2014x10kxexx106.htm |
| EXCEL - IDEA: XBRL DOCUMENT - Guidewire Software, Inc. | Financial_Report.xls |
| EX-31.2 - CERTIFICATION OF THE CFO PURSUANT TO SECTION 302 - Guidewire Software, Inc. | gwre-7312014x10kex312.htm |
| EX-32.1 - CERTIFICATION OF THE CEO AND CFO PURSUANT TO SECTION 906 - Guidewire Software, Inc. | gwre-7312014x10kex321.htm |
UNITED STATES
SECURITIES AND EXCHANGE COMMISSION
Washington, D.C. 20549
________________________________________
FORM 10-K
________________________________________
(Mark one)
x ANNUAL REPORT PURSUANT TO SECTION 13 OR 15(d) OF THE SECURITIES EXCHANGE ACT OF 1934
For the fiscal year ended July 31, 2014
OR
¨ TRANSITION REPORT PURSUANT TO SECTION 13 OR 15(d) OF THE SECURITIES EXCHANGE ACT OF 1934
For the transition period from to .
Commission file number: 001-35394
________________________________________
Guidewire Software, Inc.
(Exact name of registrant as specified in its charter)
________________________________________
Delaware | 36-4468504 | |
(State or other jurisdiction of Incorporation or organization) | (I.R.S. Employer Identification No.) | |
1001 E. Hillsdale Blvd., Suite 800 Foster City, California, 94404
(Address of principal executive offices, including zip code)
(650) 357-9100
(Registrant’s telephone number, including area code)
________________________________________
Securities registered pursuant to Section 12(b) of the Act:
(Title of class) | (Name of exchange on which registered) | |
Common Stock, $0.0001 par value | New York Stock Exchange | |
Securities registered pursuant to Section 12(g) of the Act:
None
________________________________________
Indicate by check mark if the registrant is a well-known seasoned issuer, as defined in Rule 405 of the Securities Act. Yes x No ¨
Indicate by check mark whether the registrant is not required to file reports pursuant to Section 13 or Section 15(d) of the Act. Yes ¨ No x
Indicate by check mark whether the registrant (1) has filed all reports required to be filed by Section 13 or 15(d) of the Securities Exchange Act of 1934 during the preceding 12 months (or for such shorter period that the registrant was required to file such reports), and (2) has been subject to such filing requirements for the past 90 days. Yes x No ¨
Indicate by check mark whether the registrant has submitted electronically and posted on its corporate Website, if any, every Interactive Data File required to be submitted and posted pursuant to Rule 405 of Regulation S-T (§232.405 of this chapter) during the preceding 12 months (or for such shorter period that the registrant was required to submit and post such files). Yes x No ¨
Indicate by check mark if disclosure of delinquent filers pursuant to Item 405 of Regulation S-K (§232.405 of this chapter) is not contained herein, and will not be contained, to the best of the registrant’s knowledge, in definitive proxy or information statements incorporated by reference in Part III of this Form 10-K or in any amendment to this Form 10-K. x
Indicate by check mark whether the registrant is a large accelerated filer, an accelerated filer, a non-accelerated filer or a smaller reporting company. See definition of “large accelerated filer,” “accelerated filer” and “smaller reporting company” in Rule 12b-2 of the Exchange Act.
Large accelerated filer | x | Accelerated filer | ¨ | |
Non-accelerated filer | ¨ (Do not check if a smaller reporting company) | Smaller reporting company | ¨ | |
Indicate by check mark whether the registrant is a shell company (as defined in Rule 12b-2 of the Exchange Act). Yes ¨ No x
The aggregate market value of common stock held by non-affiliates of the registrant, computed by reference to the closing price at which the common stock was sold on January 31, 2014, the last business day of the registrant’s most recently completed second fiscal quarter, as reported on the New York Stock Exchange, was approximately $2.3 billion. Shares of common stock held by each executive officer, director and holder of 5% or more of the outstanding common stock have been excluded in that such persons may be deemed to be affiliates. This determination of affiliate status does not reflect a determination that such persons are affiliates of the registrant for any other purpose.
On August 31, 2014, the registrant had 69,118,468 shares of common stock outstanding.
DOCUMENTS INCORPORATED BY REFERENCE
Portions of the registrant’s definitive Proxy Statement relating to its 2014 Annual Meeting of Stockholders are incorporated by reference into Part III of this Annual Report on Form 10-K where indicated. Such Proxy Statement will be filed with the U.S. Securities and Exchange Commission within 120 days after the end of the fiscal year to which this report relates.
Guidewire Software, Inc.
Table of Contents
Item 1. | ||
Item 1A. | ||
Item 1B. | ||
Item 2. | ||
Item 3. | ||
Item 4. | ||
Item 5. | ||
Item 6. | ||
Item 7. | ||
Item 7A. | ||
Item 8. | ||
Item 9. | ||
Item 9A. | ||
Item 9B. | ||
Item 10. | ||
Item 11. | ||
Item 12. | ||
Item 13. | ||
Item 14. | ||
Item 15. | ||
i
FORWARD-LOOKING STATEMENTS
The Business section, Management’s Discussion and Analysis of Financial Condition and Results of Operations, and other parts of this Annual Report on Form 10-K and certain information incorporated herein by reference contain forward-looking statements within the meaning of the Securities Act of 1933 and the Securities Exchange Act of 1934, which are subject to risks and uncertainties. The forward-looking statements include statements concerning, among other things, our business strategy (including anticipated trends and developments in, and management plans for, our business and the markets in which we operate), financial results, operating results, revenues, gross margins, operating expenses, products, projected costs and capital expenditures, research and development programs, sales and marketing initiatives and competition. In some cases, you can identify these statements by forward-looking words, such as “will,” “may,” “might,” “should,” “could,” “estimate,” “expect,” “suggest,” “believe,” “anticipate,” “intend,” “plan” and “continue,” the negative or plural of these words and other comparable terminology. Actual events or results may differ materially from those expressed or implied by these statements due to various factors, including but not limited to the matters discussed below, in the section titled “Item 1A. Risk Factors,” and elsewhere in this Annual Report on Form 10-K. Examples of forward-looking statements include statements regarding:
• | growth prospects of the Property & Casualty (“P&C”) insurance industry and our company; |
• | trends in our future sales, including seasonality; |
• | opportunities for growth by technology leadership; |
• | competitive advantages of our platform of software application solutions; |
• | our market strategy in relation to our competitors; |
• | competitive attributes of our software application solutions; |
• | opportunities to further expand our position outside of the United States; |
• | our research and development investment and efforts; |
• | our gross margins and factors that affect gross margins; |
• | our provision for tax liabilities and other critical accounting estimates; |
• | our exposure to market risks, and; |
• | our ability to satisfy future liquidity requirements. |
Forward-looking statements are not guarantees of future performance and involve risks and uncertainties. The forward-looking statements contained in this Annual Report on Form 10-K are based on information available to us as of the filing date of this Annual Report on Form 10-K and our current expectations about future events, which are inherently subject to change and involve risks and uncertainties. You should not place undue reliance on these forward-looking statements.
We do not undertake any obligation to update any forward-looking statements in this report or in any of our other communications, except as required by law. All such forward-looking statements should be read as of the time the statements were made and with the recognition that these forward-looking statements may not be complete or accurate at a later date.
_________________________________________________________
Unless the context requires otherwise, we are referring to Guidewire Software, Inc. when we use the terms “Guidewire,” the “Company,” “we,” “our” or “us.”
ii
Item 1. | Business |
Overview
Guidewire Software, Inc. is a provider of software products for Property & Casualty (“P&C”) insurers. Our software serves as a platform for transformation for P&C insurance carriers, enabling them to replace their legacy systems and transform their business. Guidewire InsuranceSuite™ provides the flexible, core systems essential for the mission-critical operations of P&C carriers: underwriting, policy administration, billing and claims management. Our software provides the flexibility insurers need to deliver insurance the way they want to by rapidly delivering better products and service to their policyholders and agents, while improving underwriting discipline and lowering operational costs.
We have developed an integrated suite of highly configurable applications that support our customers’ most fundamental business processes. Our software product architecture enables extensive configurability of business rules, workflows and user interfaces without modifications to the underlying code base. This approach allows our customers to easily make changes in response to specific, evolving business needs. More recently, we have created, and are investing in, adjacent products to our core products, which provide added value to our customers.
Our solutions are delivered through a web-based interface and can be deployed either on-premise or in cloud environments. Our customers typically choose to deploy our products on-premise due to security requirements and numerous integration points with other systems. To support the global operations of our customers, our software has been localized for use in a variety of international regulatory, language and currency environments.
Our Guidewire InsuranceSuite enables mission-critical P&C insurance operations and is comprised of:
• | Guidewire PolicyCenter—A flexible underwriting and policy administration application that serves as a comprehensive system-of-record for policies and supports the entire policy administration lifecycle; |
• | Guidewire ClaimCenter—An end-to-end claims management application for claim intake, assessment, settlement and processing of related financial transactions; and |
• | Guidewire BillingCenter—A comprehensive billing and receivables application that enables flexible billing, payment and commission options. |
Our more recent product initiatives include:
• | InsuranceSuite Add-on Modules—Additional modules which add additional flexibility and functionality to our core products. |
• | Data Management and Business Intelligence—Products to assist insurers to better map and convert data into new core systems and to create a central data hub that can keep downstream processes intact and deliver an enterprise-wide view and insights to fine-tune the business. |
• | Guidewire Live —A cloud-based network connecting peer insurers, core system data and external data. Customers access Guidewire Live through applications which enable more informed, context-driven decisions and actions. |
• | Mobile and Portals - Products that create real-time, self-service portals for people outside the corporate intranet. |
Strong customer relationships are a key component of our business, which supports the long-term nature of our contracts and importance of customer references for new sales. Our customers range from some of the largest global insurance carriers or their subsidiaries such as Tokio Marine & Nichido Fire Insurance Co., Ltd. and Zurich Financial Services Group Ltd., to national carriers such as Nationwide Mutual Insurance Company, to regional carriers such as AAA affiliates. As of July 31, 2014, we had 183 customers.
We began our principal business operations in 2001 and sold the initial versions of ClaimCenter in 2003, PolicyCenter in 2004 and BillingCenter in 2006. We conducted our initial public offering of our common stock on January 25, 2012 and follow-on public offerings of our common stock on April 19, 2012 and October 22, 2013. We primarily generate software license revenues through annual license fees that recur during the multi-year term of a customer’s contract. The average initial length of our contracts is approximately five years, and these contracts are renewable on an annual or multi-year basis. We typically invoice our customers annually in advance or, in certain cases, quarterly for both recurring term license and maintenance fees, and we invoice our perpetual license customers either in full at contract signing or on an installment basis and we invoice related maintenance fees annually, in advance. We primarily derive our services revenues from implementation and training services performed for our customers. A significant majority of services are billed on a time and materials basis and recognized as revenues upon delivery of the services.
1
Background
The P&C insurance industry is large, fragmented, highly regulated and complex. The P&C insurance industry is highly competitive and carriers compete primarily on the following factors: product differentiation, pricing options, customer service, marketing and advertising, affiliate programs and channel strategies. The key functional areas in P&C insurance are underwriting and policy administration, claims management and billing. Underwriting and policy administration are the cornerstone functions of all P&C insurance carriers’ operations.
These processes involve collecting information from potential policyholders, determining appropriate coverages and terms, pricing the policy, issuing the policy and updating and maintaining the policy over its lifetime. Claims management includes loss report intake, investigation and evaluation of incidents, claims negotiation, payment processing and litigation management. Billing includes account creation, policyholder invoicing, payment collection, commission calculation and disbursement.
Effective policy management requires IT systems that integrate with other internal systems and have the ability to control workflow, enable extensive configurability and provide visibility to every user. The varying regulatory requirements of each region requires customization of data and business rules, rendering the design of comprehensive IT solutions on a regional, national and global basis a major challenge for IT providers serving this industry. Additionally, stringent archiving and audit requirements, along with frequent changes in regulatory policy, have imposed a significant burden on IT systems and staff, which struggle to adequately support such requirements in IT environments dominated by legacy core systems. P&C insurance carriers spend considerable amounts of time and capital on software to maintain and attempt to improve legacy systems, manage workflows in highly distributed environments and respond to changing and interrelated customer and employee needs.
Products
We provide an integrated suite of software applications built on a unified platform that address the core processes for P&C insurance carriers: underwriting and policy administration, claims management and billing. Additionally, we provide adjacent products, which integrate with our core software applications and address ancillary customer needs. Our customers buy our software applications separately or in combination as a suite.
Guidewire InsuranceSuite
Guidewire InsuranceSuite includes each of our individual applications: PolicyCenter, ClaimCenter and BillingCenter. We have built our suite of applications on a unified technology platform, providing enhanced workflow and functionality between applications.
Guidewire PolicyCenter
Guidewire PolicyCenter is our flexible underwriting and policy administration application that serves as a comprehensive system-of-record supporting the entire policy lifecycle, including product definition, underwriting, quoting, binding, issuances, endorsements, audits, cancellations and renewals.
Guidewire ClaimCenter
Guidewire ClaimCenter is our claims management application for claim intake, assessment, settlement and processing of claim-related financial transactions. ClaimCenter enables claims lifecycle management improvements including dynamic, intuitive loss report intake, advanced adjudication processes and integrated operational reporting. ClaimCenter provides P&C insurance carriers with modern productivity tools built within a sophisticated business rules-based claims application.
Guidewire BillingCenter
Guidewire BillingCenter is our billing and receivables management application. It automates the billing lifecycle, enables the design of a wide variety of billing and payment plans, manages agent commissions and integrates with external payment systems.
InsuranceSuite Add-on Modules
We also offer the following add-on modules for InsuranceSuite:
Guidewire Rating Management. Guidewire Rating Management enables P&C insurance carriers to manage the pricing of their insurance products.
Guidewire Reinsurance Management. Guidewire Reinsurance Management enables P&C insurance carriers to use rules-based logic to execute their reinsurance strategy through their underwriting and claims processes.
2
Guidewire Client Data Management. Guidewire Client Data Management helps P&C insurance carriers capitalize on customer information more coherently, overcoming traditional siloed practices that impair efficiency and customer service.
Guidewire Standards-Based Templates. Guidewire Standards-Based Templates help facilitate both initial implementation and ongoing maintenance of ISO-based insurance products.
Data Management and Business Intelligence (“BI”)
Guidewire DataHub. Guidewire DataHub is an operational data store that unifies, standardizes and stores data from the patchwork of an insurer’s systems as well as external sources, which also enables carriers to accelerate legacy system replacement.
Guidewire InfoCenter. Guidewire InfoCenter is a business intelligence warehouse for P&C insurers which provides information in easy-to-use formats for business intelligence, analysis and enhanced decision making. With InfoCenter, customers gain operational insight as well as fine-tune their business by building views and understanding across the enterprise.
Guidewire Live
Guidewire Live is a cloud-based network connecting peer insurers, core system data and external data through applications. Customers access Guidewire Live through applications which enable more informed, context-driven decisions and actions.
Guidewire Mobile & Portals
Our Mobile & Portals products provide the ability to create real-time, self-service portals for people outside the corporate intranet of our customers. These portals extend business rules and product models already defined in their Guidewire core systems improving speed to market and lowering the cost of portal maintenance.
Technology
We developed our suite of applications on our unified technology platform, which combines standards-based elements and proprietary components. We based our platform on the most common software industry standard, Java EE, and SaaS-based platform to provide flexibility and deployability into P&C insurance carrier enterprise environments worldwide. P&C insurance carrier IT departments can manage and administer our applications through their development, test and production environments by leveraging the broad set of supporting infrastructure and proprietary tools we have built around the Java EE framework.
Services
We provide implementation and integration services to help our customers realize benefits from our software products. Guidewire implementation teams assist customers in building implementation plans, integrating our software with their existing systems and defining business rules and specific requirements unique to each customer and installation. We also partner with several leading system integration consulting firms, certified on our software, to achieve scalable, cost-effective implementations for our customers.
Customers
We market and sell our products to a wide variety of global P&C insurance carriers ranging from some of the largest global insurers to national carriers to regional carriers. We believe strong customer relationships are a key driver of our success given the long-term nature of our contracts and importance of customer references for new sales. We focus on developing and maintaining our customer relationships through customer service and account management. As of July 31, 2014, we had 183 customers in 21 countries using one or more of our products.
Strategic Relationships
We have extensive relationships with system integration, consulting and industry partners. Our network of partners has expanded as the interest in and adoption of our products has grown. We encourage our partners to co-market, pursue joint sales initiatives and drive broader adoption of our technology, helping us grow our business more efficiently and enabling us to focus our engineering resources on continued innovation and further enhancement of our solutions.
3
Sales and Marketing
Consistent with our industry focus and the mission-critical needs our products address, our sales and marketing efforts are tailored to communicate effectively to senior executives within the P&C industry. Our sales, marketing and executive teams work together to cultivate long-term relationships with our current and prospective customers in each of the geographies in which we are active.
As of July 31, 2014, we employed 219 employees in a sales and marketing capacity, including 36 direct sales representatives organized by geographic region across the U.S., Canada, U.K., France, Germany, the Nordics, Eastern Europe, Australia, Japan and China. This team serves as both our exclusive sales channel and our account management function. We augment our sales professionals with a presales team possessing insurance domain and technical expertise, who engage customers in sessions to understand their specific business needs and then represent our products through demonstrations tailored to address those needs.
Our marketing team supports sales with competitive analysis and sales tools, while investing to strengthen our brand name and reputation. We participate at industry conferences, are published frequently in the industry press and have active relationships with all of the major industry analysts. We also host Connections, our annual user conference where customers both participate in and deliver presentations on a wide range of Guidewire and insurance technology topics. We invite potential customers and partners to our user conference, as we believe customer references are a key component of driving new sales. Our strong relationships with leading system integrators enhance our direct sales through co-marketing efforts and providing additional market validation of our products’ distinctiveness and quality.
Research and Development
Our research and development efforts reflect the extensive IT needs of P&C insurance carriers. These systems are required to perform millions of complex transactions that must balance on a daily basis. This accuracy must be maintained not only during normal business operations, but also during extraordinary events such as catastrophes, which may result in extremely high transaction volume in a short period of time. Our research and development efforts focus on enhancing our products to meet the increasingly complex requirements of P&C insurance carriers and broadening our suite of applications with new product initiatives to form an end-to-end software platform for P&C insurance carriers.
As of July 31, 2014, our research and development department had 328 employees. We incurred $76.2 million, $63.0 million and $49.1 million in research and development expenses for fiscal years 2014, 2013 and 2012, respectively.
Competition
The market to provide core system software to the P&C insurance industry is highly competitive and fragmented. This market is subject to changing technology, shifting customer needs and introductions of new products and services. Our competitors vary in size and in the breadth and scope of the products and services offered. Our current principal competitors include:
Internally developed software | Many large insurance companies have sufficient IT resources to maintain and augment their own proprietary internal systems, or consider developing new custom systems; | |
IT services firms | Firms such as Accenture, CSC, MajescoMastek and Tata Consultancy Services Limited offer software and systems or develop custom, proprietary solutions for the P&C insurance industry; | |
P&C insurance software vendors | Vendors such as Accenture, Majesco Mastek, FINEOS, Innovation Group, ISCS, OneShield, Inc., StoneRiver, Inc., Sapiens International Corporation, Exigen, and TIA Technology A/S provide software solutions that are specifically designed to meet the needs of P&C insurance carriers; and | |
Horizontal software vendors | Vendors such as Pegasystems Inc. and SAP AG offer software that can be customized to address the needs of P&C insurance carriers. | |
The principal competitive factors in our industry include total cost of ownership, product functionality, flexibility and performance, customer references and in-depth knowledge of the P&C insurance industry. We believe that we compete favorably with our competitors on the basis of each of these factors. However, many of our current or potential competitors have greater financial and other resources, greater name recognition and longer operating histories than we do.
4
Intellectual Property
Our success and ability to compete depend in part upon our ability to protect our proprietary technology, to establish and adequately protect our intellectual property rights, and to protect against third claims and litigation related to intellectual property. To accomplish these objectives, we rely on a combination of patent, trademark, copyright and trade secret laws in the United States and other jurisdictions, as well as license agreements and other contractual protections. We own or have pending, a significant number of patents and patent applications, which generally apply to our software. Our owned patents have expiration dates starting in 2026. We also rely on several registered and unregistered trademarks, and applications for registrations, to protect our brand, both in the United States and internationally. Given the costs, effort, risks and downside of obtaining patent and trademark protection, including the requirement to ultimately disclose the invention to the public for patent protection, we may choose not to seek protection for certain innovations and marks; however, such protection could later prove to be important to our business.
The software industry is characterized by the existence of a large number of patents and frequent claims and related litigation regarding patent and other intellectual property rights. In particular, leading companies in the software industry have extensive patent portfolios. From time-to-time, third parties, including certain of these leading companies, may assert patent, copyright, trademark or other intellectual property claims against us or our customers. In this regard, we were previously sued by Accenture, a competitor, in the U.S. District Court for the District of Delaware. Our patent litigation with Accenture has been settled and concluded, and is further described in “Legal Proceedings” in Item 3 of Part I of this Annual Report on Form 10-K.
Employees
As of July 31, 2014, we had 1,183 employees, including 219 in sales and marketing, 516 in services and support, 328 in research and development and 120 in a general and administrative capacity. As of July 31, 2014, we had 788 employees in the United States and 395 employees internationally. None of our employees is represented by a labor union with respect to his or her employment with us. We have not experienced any work stoppages and we consider our relations with our employees to be good.
Information about Segment and Geographic Revenue
Information about segment and geographic revenue is set forth in Note 10 of the Notes to Consolidated Financial Statements under Item 8 of this Annual Report on Form 10-K.
Seasonality
We sign a significantly higher percentage of software license orders in the second and fourth quarters of each fiscal year. We generally see increased orders in our second fiscal quarter, which is the quarter ended January 31, due to customer buying patterns. We also see increased orders in our fourth fiscal quarter due to efforts by our sales team to achieve annual incentives. As a result, a significantly higher percentage of our annual license revenues have historically been recognized during those quarters. Since a substantial majority of our license revenues recur annually under our multi-year contracts, we expect to continue to experience this seasonality effect in subsequent years. Our maintenance and services revenues are not as impacted by this seasonal trend.
Executive Officers of the Registrant
Our current executive officers, and their ages and positions as of September 15, 2014, are set forth below:
Name | Age | Position(s) | |||
Marcus S. Ryu | 41 | President, Chief Executive Officer, Co-Founder and Director | |||
Karen Blasing | 58 | Chief Financial Officer | |||
Priscilla Hung | 47 | Chief Administrative Officer | |||
J. Winston King | 42 | General Counsel and Secretary | |||
Michael Polelle | 50 | Chief Customer Officer | |||
Scott Roza | 48 | Senior Vice President, Worldwide Sales | |||
Marcus S. Ryu co-founded Guidewire and has served as our President and Chief Executive Officer since 2010 and as a member of our board of directors since 2001. He served as our Vice President of Products from 2008 to 2010 and our Vice President of Strategy from 2001 to 2008. Prior to founding Guidewire, from 2000 to 2001, Mr. Ryu was Vice President of Strategy at Ariba, Inc., a software-as-a-service provider of collaborative business commerce solutions for buying and selling
5
goods and services. Mr. Ryu also worked as an Associate and Engagement Manager at McKinsey & Company from 1998 until 2000. Mr. Ryu holds an A.B. from Princeton University and a B.Phil. from New College, Oxford University.
Karen Blasing has served as our Chief Financial Officer since 2009. Prior to joining Guidewire, from 2006 to 2009, Ms. Blasing was Chief Financial Officer at Force10 Networks, Inc., a network solutions provider acquired by Dell Inc. From 2002 to 2005, Ms. Blasing was Chief Financial Officer at Nuance Communications, Inc., a speech and imaging software developer. Ms. Blasing holds a B.A. in Economics and a B.A. in Business Administration, Finance from the University of Montana and an M.B.A. from the University of Washington.
Priscilla Hung has served as our Chief Administrative Officer since September 2014, and Senior Vice President of Operations & Corporate Development since September 2012, Vice President of Operations since 2010, and Vice President of Corporate Development & Alliances from 2005 to 2010. Prior to joining Guidewire in 2005, from 2000 to 2005 Ms. Hung held several management positions at Ariba Inc., including the Director of Operations and Director of Global Channels and Alliances, and prior to that held several channel, business development, and product marketing positions at Sun Microsystems, Uniface/Compuware, Pyramid/Siemens Nixdorf, and Oracle Corporation. Ms. Hung holds an M.Eng Industrial Engineering and Operations Research degree from Cornell University.
J. Winston King has served as our General Counsel and Secretary since January 2013. Before joining Guidewire, Mr. King worked at Infogroup, Inc., a multinational data, marketing services and research firm, from 2007 to 2012, where he most recently was EVP, General Counsel and Secretary. Prior to that, Mr. King practiced with the WilmerHale law firm, in their Washington, DC office. Mr. King holds a A.B. in economics from Duke University and a J.D. from Vanderbilt University School of Law.
Michael Polelle has served as our Chief Customer Officer since April 2014, responsible for Guidewire’s professional services including Consulting, Education and Support. Prior to joining Guidewire, Mr. Polelle was Senior Vice President for Americas Services for JDA, a leading supplier of enterprise supply chain systems, where he led the organization through several transformations including the merger with Red Prairie, from May 2010 to April 2014. Prior to that, Mr. Polelle served as Vice President of North American Services for both Manugistics, a supplier of resource planning and supply chain software, from March 2000 to May 2005, and QAD, an Enterprise Resource Planning software provider, from May 2005 to May 2010. He holds B.S. in Applied Math, Engineering, and Physics from the University of Wisconsin and an M.B.A. in Operations Management from the University of Minnesota.
Scott Roza has served as our Senior Vice President, Worldwide Sales since November 2013, responsible for Guidewire’s worldwide sales and pre-sales consulting teams. Prior to joining Guidewire, Mr. Roza served as Chief Executive Officer of Skytap, Inc., a provider of Environments as a Service, from February 2008 to July 2013. Prior to Skytap, he was Vice President of Worldwide OEM and Channel Sales for Hewlett Packard/Opsware’s Business Service Automation business unit from April 2007 to February 2008, as well as Vice President of Marketing and Business Development for iConclude, an automation services company, from January 2006 to April 2007. Prior to iConclude, Mr. Roza served as Vice President, Sales and Marketing, for Advanced Digital Information Corporation, a public data storage company, from September 2001 to January 2006. He has also worked as a consultant for McKinsey and Co., and served five years in the United States Navy as a Submarine Officer. Mr. Roza holds a B.S. degree in Marine Engineering from the United States Naval Academy, an M.S. degree in Mechanical Engineering from University of Maryland, an M.S. degree in Mechanical Engineering from Massachusetts Institute of Technology, and an M.B.A. from Massachusetts Institute of Technology’s Sloan School.
WHERE YOU CAN FIND MORE INFORMATION
The following filings are available through our investor relations website after we file them with the Securities and Exchange Commission (“SEC”): Annual Report on Form 10-K, Quarterly Reports on Form 10-Q, Current Reports on Form 8-K and our Proxy Statement for our annual meeting of stockholders. These filings are also available for download free of charge on our investor relations website. Our website is located at www.guidewire.com, and our investor relations website is located at http://ir.guidewire.com/. We also provide a link to the section of the SEC’s website at www.sec.gov that has all of our public filings, including periodic reports, proxy statements and other information. Further, a copy of this Annual Report on Form 10-K is located at the SEC’s Public Reference Room at 100 F Street, NE, Washington, D.C. 20549. Information on the operation of the Public Reference Room can be obtained by calling the SEC at 1-800-SEC-0330.
We webcast our earnings calls and certain events we participate in or host with members of the investment community on our investor relations website. Additionally, we provide notifications of news or announcements regarding our financial performance, including SEC filings, investor events, press and earnings releases, and blogs as part of our investor relations website. Investors and others can receive notifications of new information posted on our investor relations website in real time by signing up for email alerts and RSS feeds. Further corporate governance information, including our governance guidelines
6
and code of business conduct and ethics, is also available on our investor relations website under the heading “Corporate Governance.” The contents of our websites are not intended to be incorporated by reference into this Annual Report on Form 10-K or in any other report or document we file with the SEC, and any references to our websites are intended to be inactive textual references only.
7
Item 1A. | Risk Factors |
A description of the risks and uncertainties associated with our business is set forth below. You should carefully consider such risks and uncertainties, together with the other information contained in this report, and in our other public filings. If any of such risks and uncertainties actually occurs, our business, financial condition or operating results could differ materially from the plans, projections and other forward-looking statements included in the section titled “Management’s Discussion and Analysis of Financial Condition and Results of Operations” and elsewhere in this report and in our other public filings. In addition, if any of the following risks and uncertainties, or if any other risks and uncertainties, actually occurs, our business, financial condition or operating results could be harmed substantially, which could cause the market price of our stock to decline, perhaps significantly.
We may experience significant quarterly and annual fluctuations in our results of operations due to a number of factors.
Our quarterly and annual results of operations may fluctuate significantly due to a variety of factors, many of which are outside of our control. This variability may lead to volatility in our stock price as research analysts and investors respond to quarterly fluctuations. In addition, comparing our results of operations on a period-to-period basis, particularly on a sequential quarterly basis, may not be meaningful. You should not rely on our past results as an indication of our future performance.
Factors that may affect our results of operations include:
• | the timing of new orders and revenue recognition for new and prior year orders; |
• | seasonal buying patterns of our customers; |
• | our ability to increase sales to and renew agreements with our existing customers, particularly larger customers, at comparable prices; |
• | our ability to renew existing contracts for multiple year terms versus annual automatic renewals; |
• | our ability to attract new customers, particularly larger customers, in both domestic and international markets; |
• | structure of our licensing contracts, including fluctuations in perpetual licenses from period to period; |
• | our ability to enter into contracts on favorable terms, including terms related to price, payment timing and product delivery; |
• | volatility in the sales of our products and timing of the execution of new and renewal agreements within such periods; |
• | commissions expense related to large transactions; |
• | bonus expense based on the bonus attainment rate; |
• | the lengthy and variable nature of our product implementation cycles; |
• | reductions in our customers’ budgets for information technology purchases and delays in their purchasing cycles; |
• | our ability to control costs, including our operating expenses; |
• | any significant change in our facilities-related costs; |
• | the timing and cost of hiring personnel and of large expenses such as those for trade shows and third-party professional services; |
• | stock-based compensation expenses and related payroll taxes, which vary along with changes to our stock price; |
• | general domestic and international economic conditions, in the insurance industry in particular; |
• | fluctuations in foreign currency exchange rates; |
• | future accounting pronouncements or changes in our accounting policies; and |
• | the impact of a recession or any other adverse global economic conditions on our business, including uncertainties that may cause a delay in entering into or a failure to enter into significant customer agreements. |
In addition, our revenue may fluctuate if our customers make an early payment of their annual fees.
The foregoing factors are difficult to forecast, and these, as well as other factors, could materially adversely affect our quarterly and annual results of operations. Any failure to adjust spending quickly enough to compensate for a revenues shortfall could magnify the adverse impact of such revenues shortfall on our results of operations. Failure to achieve our quarterly forecasts or to meet or exceed the expectations of research analysts or investors will cause our stock price to decline.
8
Seasonal sales patterns and other variations related to our revenue recognition may cause significant fluctuations in our results of operations and cash flows and may prevent us from achieving our quarterly or annual forecasts, which may cause our stock price to decline.
We sign a significantly higher percentage of software license orders in the second and fourth quarters of each fiscal year. We generally see increased orders in our second fiscal quarter, which is the quarter ended January 31, due to customer buying patterns. We also see increased orders in our fourth fiscal quarter due to efforts by our sales team to achieve annual incentives. As a result, a significantly higher percentage of our annual license revenues have historically been recognized during those quarters. Since a substantial majority of our license revenues recur annually under our multi-year contracts, we expect to continue to experience this seasonality effect in subsequent years.
Notwithstanding the fact that we generally see increased licensing orders in our second and fourth fiscal quarters, we expect to see additional quarterly revenue fluctuations that may, in some cases, mask the impact of these expected seasonal variations. Our quarterly growth in license revenues also may not match up to new orders we receive in a given quarter. This mismatch is primarily due to the following reasons:
• | for the initial year of a multi-year term license, we generally recognize revenues when payment is due and payment may not be due until a subsequent fiscal quarter; |
• | we may enter into license agreements with specified terms for product upgrades or functionality, which may require us to delay revenue recognition for the initial period; and |
• | we may enter into license agreements with other contractual terms that may affect the timing of revenue recognition. |
Our revenues may fluctuate versus comparable prior periods or prior quarters within the same fiscal year based on when new orders are executed in the quarter and the payment terms of each order. Additionally, our revenues may fluctuate if our customers make an early payment of their annual fees. Our ability to renew existing contracts for multiple year terms versus annual automatic renewals may also impact revenue recognition.
We generally charge annual software license fees for our multi-year term licenses and price our licenses based on the amount of direct written premiums (“DWP”) that will be managed by our solutions. However, in certain circumstances, our customers desire the ability to purchase our products on a perpetual license basis, resulting in an acceleration of revenue recognition. Milestone payments in a perpetual license order also cause seasonal variations. Our perpetual license revenues are not consistent from period to period. In addition, a few of our multi-year term licenses provide the customer with the option to purchase a perpetual license at the end of the initial contract term, which we refer to as a perpetual buyout right. The mix of our contract terms for our licenses and the exercise of perpetual buyout rights at the end of the initial contract term by our customers may lead to variability in our results of operations. Increases in perpetual license sales and exercises of perpetual buyout rights by our customers may affect our ability to show consistent growth in license revenues in subsequent periods. Reductions in perpetual licenses in future periods could cause adverse period-to-period comparisons of our financial results.
In addition, because we price our products based on the amount of DWP that will be managed by our solutions, license revenues from each customer may fluctuate up or down based upon insurance policies sold by the customer in the preceding year. If we enter into a new territory, our revenue recognition pattern may change, depending on the contractual terms and local laws and regulations. Seasonal and other variations related to our revenue recognition may cause significant fluctuations in our results of operations and cash flows, may make it challenging for an investor to predict our performance on a quarterly basis and may prevent us from achieving our quarterly or annual forecasts or meeting or exceeding the expectations of research analysts or investors, which may cause our stock price to decline.
We have relied and expect to continue to rely on orders from a relatively small number of customers in the P&C insurance industry for a substantial portion of our revenues, and the loss of any of these customers would significantly harm our business, results of operations and financial condition.
Our revenues are dependent on orders from customers in the P&C insurance industry, which may be adversely affected by economic, environmental and world political conditions. A relatively small number of customers have historically accounted for a majority of our revenues. In fiscal years 2014, 2013 and 2012, our ten largest customers accounted for 35%, 33% and 35% of our revenues, respectively. While we expect this reliance to decrease over time, we expect that we will continue to depend upon a relatively small number of customers for a significant portion of our revenues for the foreseeable future. As a result, if we fail to successfully sell our products and services to one or more anticipated customers in any particular period or fail to identify additional potential customers or an anticipated customer purchases fewer of our products or services, defers or cancels orders, or terminates its relationship with us, our business, results of operations and financial condition would be harmed. Some of our orders are realized at the end of the quarter or are subject to delayed payment terms. As a result of this concentration and
9
timing, if we are unable to complete one or more substantial sales or achieve any required performance or acceptance criteria in any given quarter, our quarterly results of operations may fluctuate significantly.
Our services revenues produce lower gross margins than our license or maintenance revenues, and an increase in services revenues as a percentage of total revenues could adversely affect our overall gross margins and profitability.
Our services revenues were 45%, 46% and 45% of total revenues for each of fiscal years 2014, 2013 and 2012, respectively. Our services revenues produce lower gross margins than our license revenues. The gross margin of our services revenues was 13%, 16% and 20% for fiscal years 2014, 2013 and 2012, respectively, while the gross margin for license revenues was 97%, 99% and 99% for the respective periods. An increase in the percentage of total revenues represented by services revenues could reduce our overall gross margins.
The volume and profitability of our services offerings depend in large part upon:
• | price charged to our customers; |
• | the utilization rate of our services personnel; |
• | the complexity of our customers’ information technology environments; |
• | our ability to accurately forecast the time and resources required for each implementation project; |
• | the resources directed by our customers to their implementation projects; |
• | our ability to hire, train and retain qualified services personnel; |
• | unexpected difficulty in projects which may require additional efforts on our part without commensurate compensation; |
• | our ability to manage fixed fee arrangements; |
• | the extent to which system integrators provide services directly to customers; and |
• | our ability to adequately predict customer demand and scale our professional services staff accordingly. |
Any erosion in our services margins or any significant increase in services revenues as a percentage of total revenues would adversely affect our results of operations.
Assertions by third parties of infringement or other violation by us of their intellectual property rights could result in significant costs and substantially harm our business and results of operations.
The software industry is characterized by the existence of a large number of patents and frequent claims and related litigation regarding patents and other intellectual property rights. In particular, leading companies in the software industry own large numbers of patents, copyrights, trademarks and trade secrets, which they may use to assert claims against us. From time to time, third parties, including certain of these leading companies, may assert patent, copyright, trademark or other intellectual property claims against us, our customers and partners, and those from whom we license technology and intellectual property.
Although we believe that our products and services do not infringe upon the intellectual property rights of third parties, we cannot assure that third parties will not assert infringement or misappropriation claims against us with respect to current or future products or services, or that any such assertions will not require us to enter into royalty arrangements or result in costly litigation, or result in us being unable to use certain intellectual property. We cannot assure that we are not infringing or otherwise violating any third party intellectual property rights. Infringement assertions from third parties may involve patent holding companies or other patent owners who have no relevant product revenues, and therefore our own issued and pending patents may provide little or no deterrence to these patent owners in bringing intellectual property rights claims against us.
Any intellectual property infringement or misappropriation claim or assertion against us, our customers or partners, and those from whom we license technology and intellectual property could have a material adverse effect on our business, financial condition, reputation and competitive position regardless of the validity or outcome. If we are forced to defend against any infringement or misappropriation claims, whether they are with or without merit, are settled out of court, or are determined in our favor, we may be required to expend significant time and financial resources on the defense of such claims. Furthermore, an adverse outcome of a dispute may require us to pay damages, potentially including treble damages and attorneys’ fees, if we are found to have willfully infringed a party’s intellectual property; cease making, licensing or using our products or services that are alleged to infringe or misappropriate the intellectual property of others; expend additional development resources to redesign our products or services; enter into potentially unfavorable royalty or license agreements in order to obtain the right to use necessary technologies or works; and to indemnify our partners, customers, and other third parties. Royalty or licensing agreements, if required or desirable, may be unavailable on terms acceptable to us, or at all, and may require significant royalty payments and other expenditures. Any of these events could seriously harm our business, results of operations and financial
10
condition. In addition, any lawsuits regarding intellectual property rights, regardless of their success, could be expensive to resolve and divert the time and attention of our management and technical personnel.
We may expand through acquisitions of or partnerships with other companies, which may divert our management’s attention and result in unexpected operating and technology integration difficulties, increased costs and dilution to our stockholders.
Our business strategy may include additional acquisitions of complementary software, technologies or businesses or alliances with other companies offering the same. Acquisitions and alliances may result in unforeseen operating difficulties and expenditures. In particular, we may encounter difficulties in assimilating or integrating the businesses, technologies, services, products, personnel or operations of the acquired companies, if the key personnel of the acquired company choose not to work for us, or we may have difficulty retaining the existing customers or signing new customers of any acquired business. Acquisitions and alliances may also disrupt our ongoing business, divert our resources and require significant management attention that would otherwise be available for ongoing development of our current business. We also may be required to use a substantial amount of our cash or issue debt or equity securities to complete an acquisition or realize the potential of an alliance, which could deplete our cash reserves and/or dilute our existing stockholders. Following an acquisition or the establishment of an alliance offering new products, we may be required to defer the recognition of revenues that we receive from the sale of products that we acquired or that result from the alliance, or from the sale of a bundle of products that includes such new products, if we have not established vendor-specific objective evidence (“VSOE”) for the undelivered elements in the arrangement. A delay in the recognition of revenues from sales of acquired or alliance products, or bundles that include the same, may cause fluctuations in our quarterly financial results and may adversely affect our operating margins.
Additionally, competition within the software industry for acquisitions of businesses, technologies and assets has been, and may in the future continue to be, intense. As such, even if we are able to identify an acquisition that we would like to consummate, the target may be acquired by another strategic buyer or financial buyer such as a private equity firm, or we may otherwise not be able to complete the acquisition on commercially reasonable terms, if at all. Moreover, the anticipated benefits of any acquisition, including our revenues or return on investment assumptions, may not be realized or we may be exposed to unknown liabilities as a result of such acquisition.
We face intense competition in our market, which could negatively impact our business, results of operations and financial condition and cause our market share to decline.
The market for our core insurance system software is intensely competitive. Our implementation cycle is lengthy, variable and requires the investment of significant time and expense by our customers. We compete with legacy systems, many of which have been in operation for decades. Maintaining these legacy systems may be so time consuming and costly for our customers that they do not have adequate resources to devote to the purchase and implementation of our products. We also compete against technology consulting firms that offer software and systems or develop custom, proprietary products for the P&C insurance industry. These consulting firms generally have greater name recognition, larger sales and marketing budgets and greater resources than we do and may have pre-existing relationships with our potential customers, including relationships with, and access to, key decision makers within these organizations. We also encounter competition from small independent firms that compete on the basis of price, custom developments or unique product features or functions and from vendors of software products that may be customized to address the needs of P&C insurance carriers.
We expect the intensity of competition to remain high in the future as new companies enter our markets and existing competitors develop stronger capabilities. Such intense competition could result in increased pricing pressure, reduced profit margins, increased sales and marketing expenses, and failure to increase, or the loss of, market share, any of which could harm our business, results of operations and financial condition. Our competitors may be able to devote greater resources to the development, promotion and sale of their products than we can to ours, which could allow them to respond more quickly than we can to new technologies and changes in customer needs and achieve wider market acceptance. We may not be able to compete effectively and competitive pressures may prevent us from acquiring and maintaining the customer base necessary for us to increase our revenues and profitability.
Our current and potential competitors may also establish cooperative relationships among themselves or with third parties that may further enhance their resources. Current or potential competitors may be acquired by third parties with greater available resources. As a result of such acquisitions, our current or potential competitors might be able to adapt more quickly to new technologies and customer needs, devote greater resources to the promotion or sale of their products and services, initiate or withstand substantial price competition, take advantage of other opportunities more readily or develop and expand their product and service offerings more quickly than we do. Additionally, they may hold larger portfolios of patents and other intellectual property rights as a result of such acquisitions. If we are unable to compete effectively for a share of our market, our business, results of operations and financial condition could be materially and adversely affected.
11
Certain of our software products may be deployed through cloud-based implementations, and if such implementations are compromised by data security breaches or other disruptions, our reputation could be harmed, and we could lose customers or be subject to significant liabilities.
Although our software products typically are deployed on our customers’ premises, some of our products are deployed in cloud-based environments we maintain and some of our products may be deployed in our customers’ cloud-based environments, in which our products and associated services are made available using an Internet-based infrastructure. In cloud deployments, our infrastructure and the infrastructure of third-party service providers used by both ourselves and our customers may be vulnerable to hacking incidents, other security breaches, computer viruses, telecommunications failures, power loss, other system failures and similar disruptions. These same vulnerabilities may exist in our customers’ internal computing environments as well.
Any of these occurrences, whether intentional or accidental, could lead to interruptions, delays or cessation of operation of our servers or the servers of third-party service providers’ used by our customers, and to the unauthorized use or access of our software and proprietary information and sensitive or confidential data stored or transmitted by our products. The inability of service providers used by our customers, or our own inability, to provide continuous access to hosted services, and to secure hosted services and associated customer information from unauthorized use, access or disclosure, could cause us reputational harm, loss of customers and could expose us to significant liability, all of which could harm our business, financial condition and results of operations.
If our products experience data security breaches, and there is unauthorized access to our customers’ data, we may lose current or future customers and our reputation and business may be harmed.
Our products are used by our customers to manage and store proprietary information and sensitive or confidential data relating to their businesses. Although we maintain security features in our products and our customers maintain their own security measures for their operating environments, our security measures may not detect or prevent hacker interceptions, break-ins, security breaches, the introduction of viruses or malicious code, and other disruptions that may jeopardize the security of information stored in and transmitted by our products. A party that is able to circumvent our or our customers’ security measures could misappropriate our or our customers’ proprietary or confidential information, cause interruption in operations, damage or misuse of computer systems, and misuse any information misappropriated.
If any compromise of the security of our products were to occur, we may lose customers and our reputation, business, financial condition and results of operations could be harmed. In addition, if there is any perception that we cannot protect our customers’ proprietary and confidential information, we may lose the ability to retain existing customers and attract new customers and our revenues could decline.
Privacy concerns could result in regulatory changes and impose additional costs and liabilities on us, limit our use of information, and adversely affect our business.
Certain of our product solutions collect, process, store, and use of transaction-level data aggregated across insurers using Guidewire’s common data model. Personal privacy has become a significant issue in the United States, Europe, and many other countries where we operate. Many federal, state, and foreign legislatures and government agencies have imposed or are considering imposing restrictions and requirements about the collection, use, and disclosure of personal information. Changes to laws or regulations affecting privacy could impose additional costs and liability on us and could limit our use of such information to add value for customers. If we were required to change our business activities or revise or eliminate services, or to implement burdensome compliance measures, our business and results of operations could be harmed. Privacy concerns, whether valid or not, may also inhibit market adoption of our solutions in some situations, harming our growth. In addition, we may be subject to fines, penalties, and potential litigation if we fail to comply with applicable privacy regulations.
The costs of compliance with and other burdens imposed by privacy-related laws, regulations and standards may limit the use and adoption of our product solutions and reduce overall demand, or lead to significant fines, penalties or liabilities for any noncompliance.
Furthermore, concerns regarding data privacy may cause our customers’ customers to resist providing the data necessary to allow our customers to use our product solutions effectively. Even the perception that the privacy of personal information is not satisfactorily protected or does not meet regulatory requirements could inhibit sales of our products or services, and could limit adoption of our solutions.
Weakened global economic conditions may adversely affect the P&C insurance industry, including the rate of information technology spending, which could cause our customers to defer or forego purchases of our products or services.
12
Our business depends on the overall demand for information technology from, and on the economic health of, our current and prospective customers. In addition, the purchase of our products is discretionary and involves a significant commitment of capital and other resources. Our customers may suffer from reduced operating budgets, which could cause them to defer or forego purchases of our products or services. Challenging global economic conditions, or a reduction in information technology spending even in improving economic conditions, could adversely impact our business, results of operations and financial condition in a number of ways, including longer sales cycles, lower prices for our products and services, material default rates among our customers, reduced sales of our products and services and lower or no growth.
Our sales cycle is lengthy and variable, depends upon many factors outside our control, and could cause us to expend significant time and resources prior to earning associated revenues.
The typical sales cycle for our products and services is lengthy and unpredictable, requires pre-purchase evaluation by a significant number of employees in our customers’ organizations, and often involves a significant operational decision by our customers. Our sales efforts involve educating our customers about the use and benefits of our products, including the technical capabilities of our products and the potential cost savings achievable by organizations deploying our products. Customers typically undertake a significant evaluation process, which frequently involves not only our products, but also those of our competitors and can result in a lengthy sales cycle. Moreover, a purchase decision by a potential customer typically requires the approval of several senior decision makers, including the board of directors of our customers. Our sales cycle for new customers is typically one to two years and can extend even longer in some cases. We spend substantial time, effort and money in our sales efforts without any assurance that our efforts will produce any sales. In addition, we sometimes commit to include specific functions in our base product offering at the request of a customer or group of customers and are unable to recognize license revenues until the specific functions have been added to our products. Providing this additional functionality may be time consuming and may involve factors that are outside of our control. The lengthy and variable sales cycle may also have a negative impact on the timing of our revenues, causing our revenues and results of operations to vary significantly from period to period.
If we are unable to continue the successful development of our direct sales force and the expansion of our relationships with our strategic partners, sales of our products and services will suffer and our growth could be slower than we project.
We believe that our future growth will depend on the continued development of our direct sales force and their ability to obtain new customers, particularly large P&C insurance carriers, and to manage our existing customer base. Our ability to achieve significant growth in revenues in the future will depend, in large part, on our success in recruiting, training and retaining a sufficient number of direct sales personnel. New hires require significant training and may, in some cases, take more than a year before becoming productive, if at all. If we are unable to hire and develop sufficient numbers of productive direct sales personnel, sales of our products and services will suffer and our growth will be impeded.
We believe our future growth also will depend on the expansion of successful relationships with system integrators. Our system integrators as channel partners help us reach additional customers. Our growth in revenues, particularly in international markets, will be influenced by the development and maintenance of this indirect sales channel. Although we have established relationships with some of the leading system integrators, our products and services compete directly against the products and services of other leading system integrators, as well as various software producers who partner with system integrators. We are unable to control the resources that our system integrator partners commit to implementing our products or the quality of such implementation. If they do not commit sufficient resources to these activities, our business and results of operations could fail to grow in line with our projections.
Our large customers have substantial negotiating leverage, which may require that we agree to terms and conditions that result in increased cost of sales, decreased revenues and lower average selling prices and gross margins, all of which could harm our operating results.
Some of our customers include the largest P&C insurance carriers with significant bargaining power in negotiations with us, and have the ability to buy similar products from other vendors or develop such systems internally. These customers have and may continue to seek advantageous pricing and other commercial terms and may require us to develop additional features in the products we sell to them. We have and may continue to be required to reduce the average selling price, or increase the average cost, of our products in response to these pressures. If we are unable to offset any reductions in our average selling prices or increases in our average costs with increased sales volumes and reduced costs, our results of operations could be harmed.
13
Our limited operating history and the evolving nature of the industry in which we operate may make it difficult to evaluate our business.
We were incorporated in 2001, and since that time have been developing products to meet the evolving demands of customers in the markets in which we operate. We sold the initial versions of ClaimCenter in 2003, PolicyCenter in 2004 and BillingCenter in 2006. This limited operating history makes financial forecasting and evaluation of our business difficult. Furthermore, because we depend in part on the market’s acceptance of our products, it is difficult to evaluate trends that may affect our business. We expect to make significant investments and our expenses will increase in future periods as we implement initiatives designed to grow our business, including, among other things, improvement of our current products, development and marketing of new services and products, stock-based compensation expense, international expansion, investment in our infrastructure, and increased general and administrative functions. If our revenues do not sufficiently increase to offset these expected increases in operating expenses, we will incur significant losses and will not be profitable. Our growth in revenues in recent periods should not be considered indicative of our future performance. Any failure to continue profitability may harm our business, results of operations and financial condition.
Because we derive substantially all of our revenues and cash flows from our ClaimCenter, PolicyCenter, BillingCenter and InsuranceSuite products and related services, failure of any of these products or services to satisfy customer demands or to achieve increased market acceptance would harm our business, results of operations, financial condition and growth prospects.
We derive substantially all of our revenues and cash flows from our ClaimCenter, PolicyCenter, BillingCenter and InsuranceSuite products and related services. We expect to continue to derive a substantial portion of our revenues from these products and related services. As such, increased market acceptance of these products is critical to our continued growth and success. Demand for our products is affected by a number of factors beyond our control, including the timing of development and release of new products by us and our competitors, technological change, and growth or contraction in the worldwide market for technological solutions for the P&C insurance industry. If we are unable to continue to meet customer demands or to achieve more widespread market acceptance of our products, our business, results of operations, financial condition and growth prospects will be materially and adversely affected.
Our business depends on customers renewing and expanding their license and maintenance contracts for our products. A decline in our customer renewals and expansions could harm our future results of operations.
Our customers have no obligation to renew their term licenses after their license period expires, and these licenses may not be renewed on the same or more favorable terms. Moreover, under certain circumstances, our customers have the right to cancel their license agreements before they expire. We have limited historical data with respect to rates of customer license renewals, upgrades and expansions so we may not accurately predict future trends in customer renewals. In addition, our term and perpetual license customers have no obligation to renew their maintenance arrangements after the expiration of the initial contractual period. Our customers’ renewal rates may fluctuate or decline because of several factors, including their satisfaction or dissatisfaction with our products and services, the prices of our products and services, the prices of products and services offered by our competitors or reductions in our customers’ spending levels due to the macroeconomic environment or other factors. In addition, in some cases, our customers have a right to exercise a perpetual buyout of their term licenses at the end of the initial contract term. If our customers do not renew their term licenses for our solutions or renew on less favorable terms, our revenues may decline or grow more slowly than expected and our profitability may be harmed.
Our implementation cycle is lengthy and variable, depends upon factors outside our control, and could cause us to expend significant time and resources prior to earning associated revenues.
The implementation and testing of our products by our customers typically lasts 6 to 24 months or longer and unexpected implementation delays and difficulties can occur. Implementing our products typically involves integration with our customers’ systems, as well as adding their data to our platform. This can be complex, time-consuming and expensive for our customers and can result in delays in the implementation and deployment of our products. Depending upon the nature and complexity of our customers’ systems and the time and resources that our customers are willing to devote to implementation of our products, the implementation and testing of our products may take significantly longer than 24 months. The lengthy and variable implementation cycle may also have a negative impact on the timing of our revenues, causing our revenues and results of operations to vary significantly from period to period.
Our product development cycles are lengthy, and we may incur significant expenses before we generate revenues, if any, from new products.
Because our products are complex and require rigorous testing, development cycles can be lengthy, taking us multiple years to develop and introduce new products or provide updates to our existing products. Additionally, market conditions may
14
dictate that we change the technology platform underlying our existing products or that new products be developed on different technology platforms, potentially adding material expense and time to our development cycles. Moreover, development projects can be technically challenging and expensive. The nature of these development cycles may cause us to experience delays between the time we incur expenses associated with research and development and the time we generate revenues, if any, from such expenses. If we expend a significant amount of resources on research and development and our efforts do not lead to the successful introduction or improvement of products that are competitive in the marketplace, this could materially and adversely affect our business and results of operations. Additionally, anticipated customer demand for a product we are developing could decrease or not materialize after the development cycle has commenced. Such lower customer demand may cause us to fall short of our sales targets, and we may nonetheless be unable to avoid substantial costs associated with the product’s development. If we are unable to complete product development cycles successfully and in a timely fashion and generate revenues from such future products, the growth of our business may be harmed.
Failure to meet customer expectations on the implementation of our products could result in negative publicity and reduced sales, both of which would significantly harm our business, results of operations, financial condition and growth prospects.
We provide our customers with upfront estimates regarding the duration, budget and costs associated with the implementation of our products. Failing to meet these upfront estimates and the expectations of our customers for the implementation of our products could result in a loss of customers and negative publicity regarding us and our products and services, which could adversely affect our ability to attract new customers and sell additional products and services to existing customers. Such failure could result from our product capabilities or service engagements by us, our system integrator partners or our customers’ IT employees, the latter two of which are beyond our direct control. The consequences could include, and have included: monetary credits for current or future service engagements, reduced fees for additional product sales, and a customer’s refusal to pay their contractually-obligated license, maintenance or service fees. In addition, time-consuming implementations may also increase the amount of services personnel we must allocate to each customer, thereby increasing our costs and adversely affecting our business, results of operations and financial condition.
Failure to protect our intellectual property could substantially harm our business and results of operations.
Our success depends in part on our ability to enforce and defend our intellectual property rights. We rely upon a combination of trademark, trade secret, copyright, patent and unfair competition laws, as well as license agreements and other contractual provisions, to do so.
We have filed, and may in the future file, patent applications related to certain of our innovations. We do not know whether those patent applications will result in the issuance of a patent or whether the examination process will require us to narrow our claims. In addition, we may not receive competitive advantages from the rights granted under our patents and other intellectual property. Our existing patents and any patents granted to us or that we otherwise acquire in the future, may be contested, circumvented or invalidated, and we may not be able to prevent third parties from infringing these patents. Therefore, the exact effect of the protection of these patents cannot be predicted with certainty. In addition, given the costs, effort, risks and downside of obtaining patent protection, including the requirement to ultimately disclose the invention to the public, we may choose not to seek patent protection for certain innovations; however, such patent protection could later prove to be important to our business.
We also rely on several registered and unregistered trademarks to protect our brand. Nevertheless, competitors may adopt service names similar to ours, or purchase our trademarks and confusingly similar terms as keywords in Internet search engine advertising programs, thereby impeding our ability to build brand identity and possibly leading to confusion in the marketplace. In addition, there could be potential trade name or trademark infringement claims brought by owners of other registered trademarks or trademarks that incorporate variations of our trademarks. Any claims or customer confusion related to our trademarks could damage our reputation and brand and substantially harm our business and results of operations.
In addition, we attempt to protect our intellectual property, technology, and confidential information by generally requiring our employees and consultants to enter into confidentiality and assignment of inventions agreements and third parties to enter into nondisclosure agreements, all of which offer only limited protection. These agreements may not effectively prevent unauthorized use or disclosure of our confidential information, intellectual property or technology and may not provide an adequate remedy in the event of unauthorized use or disclosure of our confidential information, intellectual property or technology. Despite our efforts to protect our confidential information, intellectual property, and technology, unauthorized third parties may gain access to our confidential proprietary information, develop and market products or services similar to ours, or use trademarks similar to ours, any of which could materially harm our business and results of operations. In addition, others may independently discover our trade secrets and confidential information, and in such cases, we could not assert any trade secret rights against such parties. Existing U.S. federal, state and international intellectual property laws offer only limited protection. The laws of some foreign countries do not protect our intellectual property rights to as great an extent as the laws of
15
the United States, and many foreign countries do not enforce these laws as diligently as governmental agencies and private parties in the United States. Moreover, policing our intellectual property rights is difficult, costly and may not always be effective.
From time to time, legal action by us may be necessary to enforce our patents and other intellectual property rights, to protect our trade secrets, to determine the validity and scope of the intellectual property rights of others or to defend against claims of infringement or invalidity. Such litigation could result in substantial costs and diversion of resources and could negatively affect our business, reputation, results of operations and financial condition. If we are unable to protect our technology and to adequately maintain and protect our intellectual property rights, we may find ourselves at a competitive disadvantage to others who need not incur the additional expense, time and effort required to create the innovative products that have enabled us to be successful to date.
We and our customers rely on technology and intellectual property of third parties, the loss of which could limit the functionality of our products and disrupt our business.
We use technology and intellectual property licensed from unaffiliated third parties in certain of our products, and we may license additional third-party technology and intellectual property in the future. Any errors or defects in this third-party technology and intellectual property could result in errors that could harm our brand and business. In addition, licensed technology and intellectual property may not continue to be available on commercially reasonable terms, or at all. The loss of the right to license and distribute this third party technology could limit the functionality of our products and might require us to redesign our products.
Further, although we believe that there are currently adequate replacements for the third-party technology and intellectual property we presently use and distribute, the loss of our right to use any of this technology and intellectual property could result in delays in producing or delivering affected products until equivalent technology or intellectual property is identified, licensed or otherwise procured, and integrated. Our business would be disrupted if any technology and intellectual property we license from others or functional equivalents of this software were either no longer available to us or no longer offered to us on commercially reasonable terms. In either case, we would be required either to attempt to redesign our products to function with technology and intellectual property available from other parties or to develop these components ourselves, which would result in increased costs and could result in delays in product sales and the release of new product offerings. Alternatively, we might be forced to limit the features available in affected products. Any of these results could harm our business and impact our results of operations.
Catastrophes may adversely impact the P&C insurance industry, preventing us from expanding or maintaining our existing customer base and increasing our revenues.
Our customers are P&C insurance carriers which have experienced, and will likely experience in the future, catastrophe losses that adversely impact their businesses. Catastrophes can be caused by various events, including, amongst others, hurricanes, tsunamis, floods, windstorms, earthquakes, hail, tornados, explosions, severe weather and fires. Global warming trends are contributing to an increase in erratic weather patterns globally and intensifying the impact of certain types of catastrophes. Moreover, acts of terrorism or war could cause disruptions in our or our customers’ businesses or the economy as a whole. The risks associated with natural disasters and catastrophes are inherently unpredictable, and it is difficult to predict the timing of such events or estimate the amount of loss they will generate. In the event a future catastrophe adversely impacts our current or potential customers, we may be prevented from maintaining and expanding our customer base and from increasing our revenues because such events may cause customers to postpone purchases of new products and professional service engagements or discontinue projects.
There may be consolidation in the P&C insurance industry, which could reduce the use of our products and services and adversely affect our revenues.
Mergers or consolidations among our customers could reduce the number of our customers and potential customers. This could adversely affect our revenues even if these events do not reduce the aggregate number of customers or the activities of the consolidated entities. If our customers merge with or are acquired by other entities that are not our customers, or that use fewer of our products and services, they may discontinue or reduce their use of our products and services. Any of these developments could materially and adversely affect our results of operations and cash flows.
Some of our services and technologies may use “open source” software, which may restrict how we use or distribute our services or require that we release the source code of certain products subject to those licenses.
Some of our services and technologies may incorporate software licensed under so-called “open source” licenses, including, but not limited to, the GNU General Public License and the GNU Lesser General Public License. In addition to risks
16
related to license requirements, usage of open source software can lead to greater risks than use of third-party commercial software, as open source licensors generally do not provide warranties or controls on origin of the software. Additionally, open source licenses typically require that source code subject to the license be made available to the public and that any modifications or derivative works to open source software continue to be licensed under open source licenses. These open source licenses typically mandate that proprietary software, when combined in specific ways with open source software, become subject to the open source license. If we combine our proprietary software in such ways with open source software, we could be required to release the source code of our proprietary software.
We take steps to ensure that our proprietary software is not combined with, and does not incorporate, open source software in ways that would require our proprietary software to be subject to an open source license. However, few courts have interpreted open source licenses, and the manner in which these licenses may be interpreted and enforced is therefore subject to some uncertainty. Additionally, we rely on multiple software programmers to design our proprietary technologies, and although we take steps to prevent our programmers from including open source software in the technologies and software code that they design, write and modify, we do not exercise complete control over the development efforts of our programmers and we cannot be certain that our programmers have not incorporated open source software into our proprietary products and technologies or that they will not do so in the future. In the event that portions of our proprietary technology are determined to be subject to an open source license, we could be required to publicly release the affected portions of our source code, re-engineer all or a portion of our technologies, or otherwise be limited in the licensing of our technologies, each of which could reduce or eliminate the value of our services and technologies and materially and adversely affect our business, results of operations and prospects.
Real or perceived errors or failures in our products, or unsatisfactory performance of our products or services could adversely affect our reputation and the market acceptance of our products, and cause us to lose customers or subject us to liability for breach of warranty claims.
Because we offer complex products, undetected errors or failures may exist or occur, especially when products are first introduced or when new versions are released. Our products are often installed and used in large-scale computing environments with different operating systems, system management software and equipment and networking configurations, which may cause errors or failures in our products or may expose undetected errors, failures or bugs in our products. Despite testing by us, we may not identify all errors, failures or bugs in new products or releases until after commencement of commercial sales or installation. In the past, we have discovered software errors, failures and bugs in some of our product offerings after their introduction.
Product errors will affect the performance of our products and could delay the development or release of new products or new versions of products, adversely affect our reputation and our customers’ willingness to buy products from us, and adversely affect market acceptance or perception of our products. In addition, because our software is used to manage functions that are critical to our customers, the licensing and support of our products may involve the risk of product liability claims. We also may face liability for breaches of our product warranties, product failures or damages caused by faulty installation of our products. Provisions in our contracts relating to warranty disclaimers and liability limitations may be unenforceable or otherwise ineffective.
Any errors or delays in releasing new products or new versions of products or allegations of unsatisfactory performance of our products or services could cause us to lose revenues or market share, increase our service costs, cause us to incur substantial costs in redesigning the products, cause us to lose significant customers, harm our reputation, subject us to liability for breach of warranty claims or damages and divert our resources from other tasks, any one of which could materially and adversely affect our business, results of operations and financial condition.
We may be obligated to disclose our proprietary source code to our customers, which may limit our ability to protect our intellectual property and could reduce the renewals of our support and maintenance services.
Our software license agreements typically contain provisions permitting the customer to become a party to, or a beneficiary of, a source code escrow agreement under which we place the proprietary source code for our products in escrow with a third party. Under these escrow agreements, the source code to the applicable product may be released to the customer, typically for its use to maintain, modify and enhance the product, upon the occurrence of specified events, such as our filing for bankruptcy, discontinuance of our maintenance services and breaching our representations, warranties or covenants of our agreements with our customers. Additionally, in some cases, customers have the right to request access to our source code upon demand. Some of our customers have obtained the source code for our products by exercising this right, and others may do so in the future.
17
Disclosing the content of our source code may limit the intellectual property protection we can obtain or maintain for that source code or the products containing that source code and may facilitate intellectual property infringement claims against us. It also could permit a customer to which a product’s source code is disclosed to support and maintain that software product without being required to purchase our support or maintenance services. Each of these could harm our business, results of operations and financial condition.
Incorrect or improper use of our products or our failure to properly train customers on how to implement or utilize our products could result in customer dissatisfaction and negatively affect our business, results of operations, financial condition and growth prospects.
Our products are complex and are deployed in a wide variety of network environments. The proper use of our products requires training of the customer. If our products are not used correctly or as intended, inadequate performance may result. Additionally, our customers or third-party partners may incorrectly implement or use our products. Our products may also be intentionally misused or abused by customers or their employees or third parties who are able to access or use our products. Similarly, our products are sometimes installed or maintained by customers or third parties with smaller or less qualified IT departments, potentially resulting in sub-optimal installation and, consequently, performance that is less than the level anticipated by the customer. Because our customers rely on our products, services and maintenance support to manage a wide range of operations, the incorrect or improper use of our products, our failure to properly train customers on how to efficiently and effectively use our products, or our failure to properly provide implementation or maintenance services to our customers may result in negative publicity or legal claims against us. Also, as we continue to expand our customer base, any failure by us to properly provide these services will likely result in lost opportunities for follow-on sales of our products and services.
In addition, if there is substantial turnover of customer personnel responsible for implementation and use of our products, or if customer personnel are not well trained in the use of our products, customers may defer the deployment of our products, may deploy them in a more limited manner than originally anticipated or may not deploy them at all. Further, if there is substantial turnover of the customer personnel responsible for implementation and use of our products, our ability to make additional sales may be substantially limited.
Our ability to sell our products is highly dependent on the quality of our professional services and technical support services and the support of our system integration providers, and the failure of us or our system integration providers to offer high-quality professional services or technical support services could damage our reputation and adversely affect our ability to sell our products and services to new customers and renew our licenses to existing customers.
If we or our system integration providers do not effectively assist our customers in deploying our products, succeed in helping our customers quickly resolve post-deployment issues, and provide effective ongoing support, our ability to sell additional products and services to existing customers would be adversely affected and our reputation with potential customers could be damaged. Once our products are deployed and integrated with our customers’ existing information technology investments and data, our customers may depend on our technical support services and/or the support of system integrators or internal resources to resolve any issues relating to our products. High-quality support is critical for the continued successful marketing and sale of our products. In addition, as we continue to expand our operations internationally, our support organization will face additional challenges, including those associated with delivering support, training and documentation in languages other than English. Many enterprise customers require higher levels of support than smaller customers. If we fail to meet the requirements of our larger customers, it may be more difficult to increase our penetration with larger customers, a key group for the growth of our revenues and profitability. As we rely more on system integrators to provide deployment and on-going support, our ability to ensure a high level of quality in addressing customer issues is diminished. Our failure to maintain high-quality implementation and support services, or to ensure that system integrators provide the same, could have a material adverse effect on our business, results of operations, financial condition and growth prospects.
If we are unable to develop, introduce and market new and enhanced versions of our products, we may be put at a competitive disadvantage.
Our success depends on our continued ability to develop, introduce and market new and enhanced versions of our products to meet evolving customer requirements. However, we cannot assure that this process can be maintained. If we fail to develop new products or enhancements to our existing products, our business could be adversely affected, especially if our competitors are able to introduce products with enhanced functionality. We plan to continue our investment in product development in future periods. It is critical to our success for us to anticipate changes in technology, industry standards and customer requirements and to successfully introduce new, enhanced and competitive products to meet our customers’ and prospective customers’ needs on a timely basis. However, we cannot assure that revenues will be sufficient to support the future product development that is required for us to be competitive. Although we may be able to release new products in addition to enhancements to existing products, we cannot assure that our new or upgraded products will be accepted by the market, will
18
not be delayed or canceled, will not contain errors or “bugs” that could affect the performance of the products or cause damage to users’ data, or will not be rendered obsolete by the introduction of new products or technological developments by others. If we fail to develop products that are competitive in technology and price and fail to meet customer needs, our market share will decline and our business and results of operations could be harmed.
We may be subject to significant liability claims if our core system software fails, and the limitation of liability provided in our license agreements may not protect us, which may adversely impact our financial condition.
The license and support of our core system software creates the risk of significant liability claims against us. Our license agreements with our customers contain provisions designed to limit our exposure to potential liability claims. It is possible, however, that the limitation of liability provisions contained in such license agreements may not be enforced as a result of international, federal, state and local laws or ordinances or unfavorable judicial decisions. Breach of warranty or damage liability, or injunctive relief resulting from such claims, could have a material and adverse impact on our results of operations and financial condition.
If we are unable to retain our personnel and hire and integrate additional skilled personnel, we may be unable to achieve our goals and our business will suffer.
Our future success depends upon our ability to continue to attract, train, integrate and retain highly skilled employees, particularly our management team, sales and marketing personnel, professional services personnel and software engineers. Each of our executive officers and other key employees could terminate his or her relationship with us at any time. The loss of any member of our senior management team might significantly delay or prevent the achievement of our business or development objectives and could materially harm our business. In addition, a number of our senior management personnel are substantially vested in their stock option grants or other equity compensation. While we periodically grant additional equity awards to management personnel and other key employees to provide additional incentives to remain employed by us, employees may be more likely to leave us if a significant portion of their equity compensation is fully vested, especially if the shares underlying the equity awards have significantly appreciated in value. Our inability to attract and retain qualified personnel, or delays in hiring required personnel, may seriously harm our business, results of operations and financial condition.
We face competition for qualified individuals, which are in high demand, from numerous software and other technology companies. In addition, competition for qualified personnel is particularly intense in the San Francisco Bay Area, where our headquarters are located. Often, significant amounts of time and resources are required to train technical, sales and other personnel. Further, qualified individuals are in high demand. We may incur significant costs to attract and retain them, and we may lose new employees to our competitors or other technology companies before we realize the benefit of our investment in recruiting and training them. We have a limited number of sales people and the loss of some of these in a short period of time could have a negative impact on our sales efforts. We may be unable to attract and retain suitably qualified individuals who are capable of meeting our growing technical, operational and managerial requirements, on a timely basis or at all, and we may be required to pay increased compensation in order to do so. Because of the technical nature of our products and services and the dynamic market in which we compete, any failure to attract, integrate and retain qualified direct sales, professional services and product development personnel, as well as our contract workers, could have a material adverse effect on our ability to generate sales or successfully develop new products, customer and consulting services and enhancements of existing products. Also, to the extent we hire personnel from competitors, we may be subject to allegations that they have been improperly solicited or divulged proprietary or other confidential information.
Our ability to effectively use equity compensation to help attract and retain qualified personnel may be limited by our stockholders, and equity compensation arrangements may negatively impact our results of operations.
We intend to continue to issue restricted stock units and stock options as key components of our overall compensation and employee attraction and retention efforts. We may face pressure from stockholders, who must approve extraordinary increases in our equity compensation pool, to limit the use of equity-based compensation so as to minimize its dilutive effect on stockholders. In addition, we are required under U. S. GAAP to recognize compensation expense in our results of operations for employee share-based equity compensation under our equity grants, which may negatively impact our results of operations and may increase the pressure to limit equity-based compensation. These factors may make it more difficult or unlikely for us to continue granting attractive equity-based compensation packages to our employees, which could adversely impact our ability to attract and retain key employees. If we lose any senior executive or other key employee, our business and results of operations could be materially and adversely affected.
Failure to manage our rapid growth effectively could harm our business.
19
We have recently experienced rapid growth, and expect to continue to experience growth, in our number of employees and in our international operations that has placed, and will continue to place, a significant strain on our operational and financial resources and our personnel. To manage our anticipated future growth effectively, we must continue to maintain and may need to enhance our information technology infrastructure, financial and accounting systems and controls and manage expanded operations and employees in geographically distributed locations. We also must attract, train and retain a significant number of additional qualified sales and marketing personnel, professional services personnel, software engineers, technical personnel and management personnel. Our failure to manage our growth effectively could have a material adverse effect on our business, results of operations and financial condition. Our growth could require significant capital expenditures and may divert financial resources from other projects, such as the development of new services or product enhancements. If these expectations are incorrect, and we increase the size of our professional services organization without experiencing an increase in sales of our products and services, we will experience reductions in our gross and operating margins and net income. If we are unable to effectively manage our growth, our expenses may increase more than expected, our revenues could decline or grow more slowly than expected and we may be unable to implement our business strategy. We also intend to continue to expand into additional international markets which, if not technologically or commercially successful, could harm our financial condition and prospects.
Our international sales and operations subject us to additional risks that can adversely affect our business, results of operations and financial condition.
We sell our products and services to customers located outside the United States and Canada, and we are continuing to expand our international operations as part of our growth strategy. In fiscal years 2014, 2013 and 2012, 31%, 28% and 30% of our revenues, respectively, were derived from outside of the United States and Canada. Our current international operations and our plans to expand our international operations subject us to a variety of risks, including:
• | increased management, travel, infrastructure and legal compliance costs associated with having multiple international operations; |
• | unique terms and conditions in contract negotiations imposed by customers in foreign countries; |
• | longer payment cycles and difficulties in enforcing contracts and collecting accounts receivable; |
• | the need to localize our products and licensing programs for international customers; |
• | lack of familiarity with and unexpected changes in foreign regulatory requirements; |
• | increased exposure to fluctuations in currency exchange rates; |
• | the burdens of complying with a wide variety of foreign laws and legal standards; |
• | compliance with the U.S. Foreign Corrupt Practices Act of 1977, as amended (“FCPA”), the U.K. Bribery Act and other anti-corruption regulations, particularly in emerging market countries; |
• | import and export license requirements, tariffs, taxes and other trade barriers; |
• | increased financial accounting and reporting burdens and complexities; |
• | weaker protection of intellectual property rights in some countries; |
• | multiple and possibly overlapping tax regimes; and |
• | political, social and economic instability abroad, terrorist attacks and security concerns in general. |
As we continue to expand our business globally, our success will depend, in large part, on our ability to anticipate and effectively manage these and other risks associated with our international operations. Any of these risks could harm our international operations and reduce our international sales, adversely affecting our business, results of operations, financial condition and growth prospects.
If our estimates or judgments relating to our critical accounting policies are based on assumptions that change or prove to be incorrect, our results of operations could fall below expectations of securities analysts and investors, resulting in a decline in our stock price.
The preparation of financial statements in conformity with U.S. GAAP requires management to make estimates and assumptions that affect the amounts reported in the consolidated financial statements. We base our estimates on historical experience and on various other assumptions that we believe to be reasonable under the circumstances, as provided in “Management’s Discussion and Analysis of Financial Condition and Results of Operations” of Item 7 of Part II of this Annual Report on Form 10-K and Note 1 of Notes to Consolidated Financial Statements, the results of which form the basis for making judgments about the carrying values of assets, liabilities, equity, revenues and expenses that are not readily apparent from other sources. Because our customer contracts are highly negotiated, they often include unique terms and conditions that require judgment with respect to revenue recognition. Our results of operations may be adversely affected if our assumptions change or
20
if actual circumstances differ from those in our assumptions, which could cause our results of operations to fall below the expectations of securities analysts and investors, resulting in a decline in our stock price.
The nature of our business requires the application of complex revenue and expense recognition rules and the current legislative and regulatory environment affecting U.S. Generally Accepted Accounting Principles ("GAAP") is uncertain and significant changes in current principles could affect our financial statements going forward and changes in financial accounting standards or practices may cause adverse, unexpected financial reporting fluctuations and harm our operating results.
The accounting rules and regulations that we must comply with are complex. Recent actions and public comments from the Financial Accounting Standards Board (the "FASB") and the Securities and Exchange Commission have focused on the integrity of financial reporting. In addition, many companies' accounting policies are being subject to heightened scrutiny by regulators and the public. Further, the accounting rules and regulations are continually changing in ways that could materially impact our financial statements. For example, in May 2014, the FASB issued a new accounting guidance on revenue recognition, Accounting Standards Update (ASU) No. 2014-09, Revenue from Contracts with Customers (Topic 606), that becomes effective for us beginning August 1, 2017. The standard permits the use of either the retrospective or cumulative effect transition method.
We have not yet selected a transition method and continue to evaluate the impact that this guidance will have on our financial condition and results of operations. Regardless of the transition method, the application of this new guidance may result in exclusion of certain future licensing revenues in the statement of income after the adoption date, which, despite no change in associated cash flows, could have a material adverse effect on our net income.
While we believe that our financial statements have been prepared in accordance with accounting principles generally accepted in the United States of America, we cannot predict the impact of future changes to accounting principles or our accounting policies on our financial statements going forward. In addition, were we to change our critical accounting estimates, including the timing of recognition of license revenue and other revenue sources, our results of operations could be significantly impacted.
We incur increased costs as a result of operating as a public company, and our management is required to devote substantial time to compliance initiatives.
As a public company, we incur legal, accounting and other expenses that we did not incur as a private company. In addition, the Dodd-Frank Wall Street Reform and Consumer Protection Act, the Sarbanes-Oxley Act of 2002 (“Sarbanes-Oxley Act”), as well as rules subsequently implemented by the Securities and Exchange Commission (“SEC”) and the New York Stock Exchange, impose additional requirements on public companies, including specific corporate governance practices. We are required to comply with Section 404 of the Sarbanes-Oxley Act and we have incurred costs to implement additional internal controls as well as to obtain an independent auditors report on our internal control over financial reporting. Additionally, the listing requirements of the New York Stock Exchange require that we satisfy numerous corporate governance requirements. Our management and other personnel will continue to devote a substantial amount of time to these compliance initiatives. Moreover, these rules and regulations increase our legal, accounting and financial compliance costs and make some activities more time-consuming and costly. These rules and regulations could also make it more difficult for us to attract and retain qualified persons to serve on our board of directors, our board committees or as executive officers.
We may not be able to obtain capital when desired on favorable terms, if at all, or without dilution to our stockholders.
We may need additional financing to execute on our current or future business strategies, including to:
• | hire additional personnel; |
• | develop new or enhance existing products and services; |
• | enhance our operating infrastructure; |
• | acquire businesses or technologies; or |
• | otherwise respond to competitive pressures. |
If we raise additional funds through the issuance of equity or convertible debt securities, the percentage ownership of our stockholders could be significantly diluted, and these newly-issued securities may have rights, preferences or privileges senior to those of existing stockholders. If we incur additional funds through debt financing, a substantial portion of our operating cash flow may be dedicated to the payment of principal and interest on such indebtedness, thus limiting funds available for our business activities. We cannot assure you that additional financing will be available on terms favorable to us, or at all. If adequate funds are not available or are not available on acceptable terms, when we desire them, our ability to fund our
21
operations, take advantage of unanticipated opportunities, develop or enhance our products and services, or otherwise respond to competitive pressures would be significantly limited. Any of these factors could harm our results of operations.
If we fail to maintain effective internal control over financial reporting in the future, the accuracy and timing of our financial reporting may be adversely affected.
Preparing our consolidated financial statements involves a number of complex manual and automated processes, which are dependent upon individual data input or review and require significant management judgment. One or more of these elements may result in errors that may not be detected and could result in a material misstatement of our consolidated financial statements. The Sarbanes-Oxley Act requires, among other things, that as a publicly-traded company we disclose whether our internal control over financial reporting and disclosure controls and procedures are effective.
If a material misstatement occurs in the future, we may fail to meet our future reporting obligations, we may need to restate our financial results and the price of our common stock may decline. Any failure of our internal controls could also adversely affect the results of the periodic management evaluations and annual independent registered public accounting firm attestation reports regarding the effectiveness of our internal control over financial reporting that are required under Section 404 of the Sarbanes-Oxley Act, which became applicable to us beginning with the filing of our Annual Report on Form 10-K for the fiscal year ended July 31, 2013. Effective internal controls are necessary for us to produce reliable financial reports and are important to helping prevent financial fraud. Furthermore, any potential transition in enterprise resource planning or other major operational system could impact the timely generation of our financial statements. If we cannot provide reliable financial reports or prevent fraud, our business and results of operations could be harmed, investors could lose confidence in our reported financial information, and the trading price of our stock could drop significantly.
If tax laws change or we experience adverse outcomes resulting from examination of our income tax returns, it could adversely affect our results of operations.
We are subject to federal, state and local income taxes in the United States and in foreign jurisdictions. Our future effective tax rates and the value of our deferred tax assets could be adversely affected by changes in tax laws. In addition, we are subject to the examination of our income tax returns by the Internal Revenue Service and other tax authorities. We regularly assess the likelihood of adverse outcomes resulting from such examinations to determine the adequacy of our provision for income taxes. Significant judgment is required in determining our worldwide provision for income taxes. Although we believe we have made appropriate provisions for taxes in the jurisdictions in which we operate, changes in the tax laws or challenges from tax authorities under existing tax laws could adversely affect our business, financial condition and results of operations.
Our business is subject to the risks of earthquakes, fire, floods and other natural catastrophic events, and to interruption by man made problems such as computer viruses or terrorism.
Our corporate headquarters and the majority of our operations are located in the San Francisco Bay Area, a region known for seismic activity. A significant natural disaster, such as an earthquake, tsunami, fire or a flood, could have a material adverse impact on our business, results of operations and financial condition. In addition, our servers are vulnerable to computer viruses, break-ins and similar disruptions from unauthorized tampering with our computer systems. Acts of terrorism could cause disruptions in our or our customers’ business or the economy as a whole. To the extent that such disruptions result in delays or cancellations of customer orders, or the deployment of our products, our business, results of operations and financial condition would be adversely affected.
Our stock price may be volatile, which could result in securities class action litigation against us.
The market price of our common stock could be subject to wide fluctuations in response to, among other things, the risk factors described in this report, and other factors beyond our control, such as fluctuations in the valuation of companies perceived by investors to be comparable to us.
Furthermore, the stock markets have experienced price and volume fluctuations that have affected and continue to affect the market prices of equity securities of many companies. These fluctuations often have been unrelated or disproportionate to the operating performance of those companies. These broad market and industry fluctuations, as well as general economic, political and market conditions, such as recessions, interest rate changes or international currency fluctuations, have and may continue to negatively affect the market price of our common stock.
In the past, many companies that have experienced volatility in the market price of their stock have been subject to securities class action litigation. We may become the target of this type of litigation in the future. Securities litigation against us could result in substantial costs and divert our management’s attention from other business concerns, which could seriously harm our business.
22
If research analysts do not publish research about our business or if they issue unfavorable commentary or downgrade our common stock, our stock price and trading volume could decline.
The trading market for our common stock depends in part on the research and reports that research analysts publish about us and our business. If we do not maintain adequate research coverage, or if one or more analysts who covers us downgrades our stock or publishes inaccurate or unfavorable research about our business, the price of our common stock could decline. If one or more of the research analysts ceases coverage of our company or fails to publish reports on us regularly, demand for our common stock could decrease, which could cause our stock price and/or trading volume to decline.
We currently do not intend to pay dividends on our common stock and, consequently, your only opportunity to achieve a return on your investment is if the price of our common stock appreciates.
We currently do not plan to declare dividends on shares of our common stock in the foreseeable future. Consequently, the only opportunity to achieve a return on investment in our company will be if the market price of our common stock appreciates and shares are sold at a profit.
Certain provisions of our certificate of incorporation and bylaws and of Delaware law could prevent a takeover that stockholders consider favorable and could also reduce the market price of our stock.
Our amended and restated certificate of incorporation and our amended and restated bylaws contain provisions that could delay or prevent a merger, acquisition or other change in control that stockholders may consider favorable, including transactions in which stockholders might otherwise receive a premium for their shares. These provisions may also prevent or delay attempts by stockholders to replace or remove our current management or members of our board of directors. These provisions include:
• | providing for a classified board of directors with staggered three-year terms, which could delay the ability of stockholders to change the membership of a majority of our board of directors; |
• | not providing for cumulative voting in the election of directors, which limits the ability of minority stockholders to elect director candidates; |
• | authorizing our board of directors to issue, without stockholder approval, preferred stock rights senior to those of common stock, which could be used to significantly dilute the ownership of a hostile acquirer; |
• | prohibiting stockholder action by written consent, which forces stockholder action to be taken at an annual or special meeting of our stockholders; |
• | limiting the persons who may call special meetings of stockholders, which could delay the ability of our stockholders to force consideration of a proposal or to take action, including the removal of directors; and |
• | requiring advance notification of stockholder nominations and proposals, which may discourage or deter a potential acquirer from conducting a solicitation of proxies to elect the acquirer’s own slate of directors or otherwise attempting to obtain control of us. |
The affirmative vote of the holders of at least 66 2/3% of our shares of capital stock entitled to vote is generally necessary to amend or repeal the above provisions that are contained in our amended and restated certificate of incorporation. Also, absent approval of our board of directors, our amended and restated bylaws may only be amended or repealed by the affirmative vote of the holders of at least 50% of our shares of capital stock entitled to vote.
In addition, we are subject to the provisions of Section 203 of the Delaware General Corporation Law. These provisions may prohibit large stockholders, in particular those owning 15% or more of our outstanding common stock, from engaging in certain business combinations without approval of substantially all of our stockholders for a certain period of time.
These and other provisions in our amended and restated certificate of incorporation, our amended and restated bylaws and under Delaware law could discourage potential takeover attempts, reduce the price that investors might be willing to pay for shares of our common stock in the future and result in the market price being lower than it would be without these provisions.
Item 1B. | Unresolved Staff Comments |
Not applicable.
Item 2. | Properties |
Our corporate headquarters are located in Foster City, California, where we currently have a seven year lease for approximately 97,674 square feet of space that commenced on August 1, 2012. We also lease facilities for our distributed sales
23
and international operations in Exton, Pennsylvania; Dublin, Ireland; Edina, Minnesota; London, United Kingdom; Mississauga, Ontario, Canada; Munich, Germany; Paris, France; Sydney, Australia; Tokyo, Japan; Moscow, Russia; and Warsaw, Poland.
We believe that our facilities are suitable to meet our current needs. We intend to expand our facilities or add new facilities as we add employees and enter new geographic markets, and we believe that suitable additional or alternative space will be available as needed to accommodate any such growth. However, we expect to incur additional expenses in connection with such new or expanded facilities, including our corporate headquarters.
Item 3. | Legal Proceedings |
In December 2007, we were the subject of a lawsuit by a competitor, Accenture Global Services GmbH and Accenture LLP (collectively “Accenture”). In May 2011, we prevailed in the U.S. District Court for the District of Delaware regarding the invalidity of one of Accenture’s patents. In October 2011, the parties agreed to resolve the litigation, subject to a potential additional payment by us if Accenture was successful in appealing the validity of its patent. In September 2013, the U.S. Court of Appeals for the Federal Circuit affirmed the lower court decision in our favor and, in June 2014, the U.S. Supreme Court denied Accenture’s final appeal, ending the litigation. We will have no additional payments relating to the settlement.
In addition to the matters described above, from time-to-time, we are involved in various other legal proceedings and receive claims, arising from the normal course of business activities.
Item 4. | Mine Safety Disclosures |
Not applicable.
24
PART II
Item 5. | Market for Registrant’s Common Equity, Related Stockholder Matters and Issuer Purchases of Equity |
Securities
Our common stock is listed on the New York Stock Exchange (“NYSE”) under the symbol “GWRE”. The following table sets forth the high and low sales price per share of our common stock as reported on the NYSE for the periods indicated:
Fiscal Year 2014 | Fiscal Year 2013 | ||||||||||||||
High | Low | High | Low | ||||||||||||
First Quarter | $ | 51.01 | $ | 42.80 | $ | 33.15 | $ | 24.00 | |||||||
Second Quarter | $ | 50.66 | $ | 43.83 | $ | 34.54 | $ | 25.46 | |||||||
Third Quarter | $ | 57.38 | $ | 37.42 | $ | 41.20 | $ | 30.25 | |||||||
Fourth Quarter | $ | 41.98 | $ | 34.85 | $ | 45.73 | $ | 37.31 | |||||||
On July 31, 2014, the last reported sale price of our common stock on the New York Stock Exchange was $40.50 per share. As of July 31, 2014, we had 99 holders of record of our common stock. The actual number of stockholders is greater than this number of record holders, and includes stockholders who are beneficial owners, but whose shares are held in street name by brokers and other nominees. This number of holders of record also does not include stockholders whose shares may be held in trust by other entities.
We have never declared or paid, and do not anticipate declaring or paying, any cash dividends on our capital stock. Any future determination as to the declaration and payment of dividends, if any, will be at the discretion of our board of directors and will depend on then existing conditions, including our financial condition, operating results, contractual restrictions, capital requirements, business prospects and other factors our board of directors may deem relevant.
Performance Graph
This performance graph shall not be deemed “soliciting material” or to be “filed” with the Securities and Exchange Commission for purposes of Section 18 of the Securities Exchange Act of 1934, as amended (“the Exchange Act”) or otherwise subject to the liabilities under that Section, and shall not be deemed to be incorporated by reference into any filing of the company under the Securities Act of 1933, as amended (the “Securities Act”) or the Exchange Act.
The following graph shows a comparison from January 25, 2012, (the date our common stock commenced trading on the NYSE) through July 31, 2014, of the cumulative total return for our common stock, the NASDAQ Composite Total Returns Index and the Zacks Computer Software Services Total Return Index. Such returns are based on historical results and are not intended to suggest future performance. Data for the NASDAQ Composite Index and the Zacks Computer Software Services Total Return Index assume reinvestment of dividends.
25
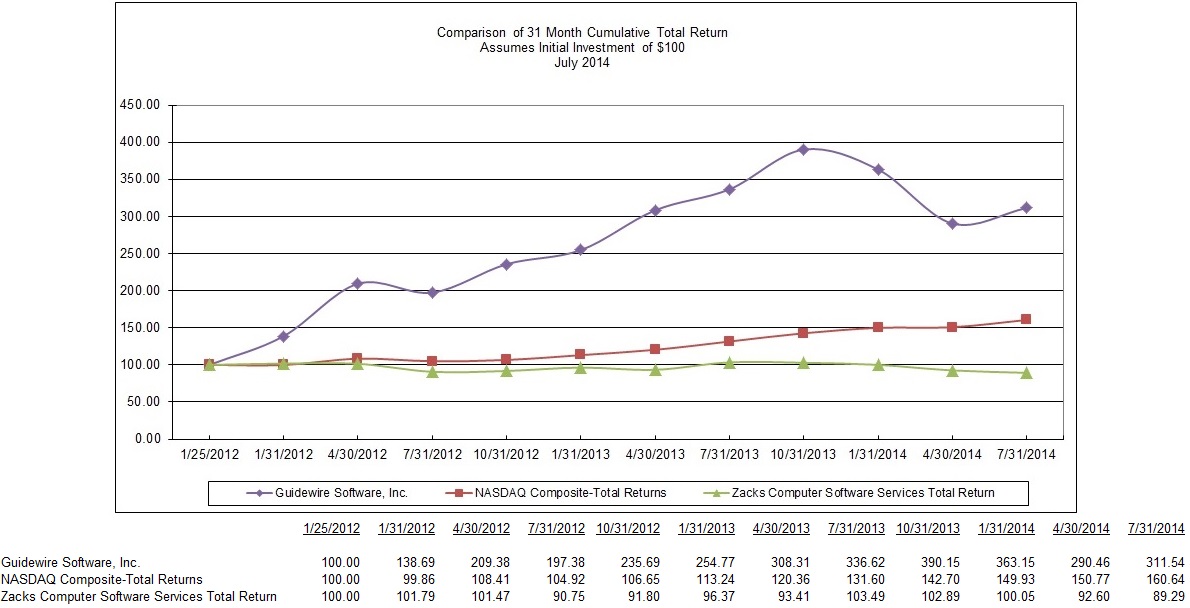
Unregistered Sales of Equity Securities and Use of Proceeds
Issuer Purchases of Equity Securities
There were no repurchases of shares of our common stock made during the three months ended July 31, 2014.
Item 6. | Selected Financial Data |
SELECTED CONSOLIDATED FINANCIAL DATA
The selected consolidated statements of income data for the years ended July 31, 2014, 2013 and 2012 and the consolidated balance sheet data as of July 31, 2014 and 2013 are derived from our audited consolidated financial statements included elsewhere in this Annual Report on Form 10-K. The selected consolidated statements of income for the years ended July 31, 2011 and 2010 and the consolidated balance sheet data as of July 31, 2012, 2011 and 2010 are derived from our unaudited consolidated financial statements which are not included in this Annual Report on Form 10-K. Our historical results are not necessarily indicative of the results that may be expected in any future annual or interim period. You should read the following selected consolidated historical financial data below in conjunction with “Management’s Discussion and Analysis of Financial Condition and Results of Operations” and the consolidated financial statements and related notes included elsewhere in this Annual Report on Form 10-K.
In July of fiscal 2014, we elected to change our accounting policy to recognize stock-based compensation expense from the accelerated attribution method of accounting to the straight-line method of accounting for our time-based units (or service-only awards). We believe the straight-line method of accounting for stock-based compensation expense for service-only awards better reflects the employees’ pattern of service. Comparative financial information, including stock-based compensation information and Adjusted EBITDA, for prior periods have been adjusted to apply the straight-line method retrospectively. See Note 2 “Change in Accounting Policy - Stock-based Compensation” to the consolidated financial statements included in this Annual Report on Form 10-K for further information.
26
Fiscal years ended July 31, | |||||||||||||||||||
2014 | 2013 | 2012 | 2011 | 2010 | |||||||||||||||
(unaudited) | (unaudited) | ||||||||||||||||||
(in thousands, except share and per share data) | |||||||||||||||||||
Total revenues | $ | 350,246 | $ | 300,649 | $ | 232,061 | $ | 172,472 | $ | 144,691 | |||||||||
Total cost of revenues (1) (3) | 148,947 | 125,651 | 90,005 | 68,072 | 55,325 | ||||||||||||||
Total gross profit | 201,299 | 174,998 | 142,056 | 104,400 | 89,366 | ||||||||||||||
Operating expenses: (1) | |||||||||||||||||||
Research and development (3) | 76,178 | 62,991 | 49,056 | 34,418 | 28,220 | ||||||||||||||
Sales and marketing (3) | 71,295 | 50,948 | 36,781 | 28,820 | 26,766 | ||||||||||||||
General and administrative (3) | 35,404 | 31,320 | 27,285 | 22,554 | 15,829 | ||||||||||||||
Litigation provision | — | — | — | 10,000 | — | ||||||||||||||
Total operating expenses | 182,877 | 145,259 | 113,122 | 95,792 | 70,815 | ||||||||||||||
Income (loss) from operations | 18,422 | 29,739 | 28,934 | 8,608 | 18,551 | ||||||||||||||
Interest income, net | 1,350 | 498 | 308 | 156 | 95 | ||||||||||||||
Other income (expenses), net | 174 | (114 | ) | (726 | ) | 1,269 | (391 | ) | |||||||||||
Income before provision for income taxes (1) | 19,946 | 30,123 | 28,516 | 10,033 | 18,255 | ||||||||||||||
Provision for (benefit from) income taxes (1) | 5,225 | 5,465 | 9,852 | (26,175 | ) | 2,199 | |||||||||||||
Net income (1) | $ | 14,721 | $ | 24,658 | $ | 18,664 | $ | 36,208 | $ | 16,056 | |||||||||
Earnings per share: (1) | |||||||||||||||||||
Basic | $ | 0.22 | $ | 0.44 | $ | 0.36 | $ | 0.85 | $ | 0.33 | |||||||||
Diluted | $ | 0.21 | $ | 0.40 | $ | 0.32 | $ | 0.78 | $ | 0.31 | |||||||||
Shares used in computing earnings per share: (1) (2) | |||||||||||||||||||
Basic | 65,748,896 | 56,331,018 | 34,774,983 | 14,064,055 | 13,535,736 | ||||||||||||||
Diluted | 69,112,733 | 61,569,195 | 41,759,338 | 17,288,637 | 16,300,661 | ||||||||||||||
(1) | See Note 2 “Change in Accounting Policy - Stock-Based Compensation” in Notes to Consolidated Financial Statements. |
(2) | See Note 5 to our consolidated financial statements for an explanation of the calculations of our basic and diluted earnings per share attributable to common stockholders. |
(3) | Includes stock-based compensation as follows: |
Fiscal years ended July 31, | |||||||||||||||||||
2014 | 2013 | 2012 | 2011 | 2010 | |||||||||||||||
(unaudited) | (unaudited) | ||||||||||||||||||
(in thousands) | |||||||||||||||||||
Cost of license and other | $ | 184 | $ | — | $ | — | $ | — | $ | — | |||||||||
Cost of maintenance revenue | 797 | 830 | 288 | 111 | 40 | ||||||||||||||
Cost of services revenue | 11,929 | 6,910 | 2,461 | 1,001 | 739 | ||||||||||||||
Research and development | 9,008 | 5,843 | 2,385 | 1,018 | 715 | ||||||||||||||
Sales and marketing | 10,744 | 3,672 | 1,496 | 772 | 781 | ||||||||||||||
General and administrative | 9,876 | 8,250 | 6,293 | 2,041 | 542 | ||||||||||||||
Total stock-based compensation expenses (1) | $ | 42,538 | $ | 25,505 | $ | 12,923 | $ | 4,943 | $ | 2,817 | |||||||||
(1) | See Note 2 “Change in Accounting Policy - Stock-Based Compensation” of Notes to Consolidated Financial Statements. |
27
As of July 31, | |||||||||||||||||||
2014 | 2013 | 2012 | 2011 | 2010 | |||||||||||||||
(unaudited) | (unaudited) | (unaudited) | |||||||||||||||||
(in thousands) | |||||||||||||||||||
Cash and cash equivalents | $ | 148,101 | $ | 79,767 | $ | 205,718 | $ | 59,625 | $ | 37,411 | |||||||||
Working capital (deficit) | 421,044 | 135,309 | 169,278 | 12,540 | (5,382 | ) | |||||||||||||
Short-term and long-term investments | 499,680 | 127,972 | — | — | — | ||||||||||||||
Total assets | 757,227 | 305,673 | 281,286 | 125,451 | 60,055 | ||||||||||||||
Total stockholders’ equity (deficit) (1) | 650,686 | 221,832 | 181,000 | 17,061 | (25,145 | ) | |||||||||||||
(1) | See Note 2 “Change in Accounting Policy - Stock-Based Compensation” of Notes to Consolidated Financial Statements. |
Adjusted EBITDA
We believe Adjusted EBITDA, a non-GAAP financial measure, is useful in evaluating our operating performance compared to that of other companies in our industry, as this metric generally eliminates the effects of certain items that may vary for different companies for reasons unrelated to overall operating performance. We believe that:
• | Adjusted EBITDA provides investors and other users of our financial information consistency and comparability with our past financial performance, facilitates period-to-period comparisons of operations and facilitates comparisons with other companies, many of which use similar non-GAAP financial measures to supplement their GAAP results; and |
• | it is useful to exclude non-cash charges, such as depreciation and amortization, stock-based compensation and one-time charges such as our litigation provision from Adjusted EBITDA because the amount of such expense in any specific period may not directly correlate to the underlying performance of our business operations and these expenses can vary significantly between periods. |
We use Adjusted EBITDA in conjunction with traditional GAAP measures as part of our overall assessment of our performance, including the preparation of our annual operating budget and quarterly forecasts, to evaluate the effectiveness of our business strategies and to communicate with our board of directors concerning our financial performance.
Adjusted EBITDA should not be considered as a substitute for other measures of financial performance reported in accordance with GAAP. There are limitations to using non-GAAP financial measures, including that other companies may calculate these measures differently than we do. We compensate for the inherent limitations associated with using Adjusted EBITDA through disclosure of these limitations, presentation of our financial statements in accordance with GAAP and reconciliation of Adjusted EBITDA to the most directly comparable GAAP measure, net income (loss).
The following provides a reconciliation of net income to Adjusted EBITDA:
Fiscal years ended July 31, | |||||||||||||||||||
2014 | 2013 | 2012 | 2011 | 2010 | |||||||||||||||
(unaudited, in thousands) | |||||||||||||||||||
Net income (1) | $ | 14,721 | $ | 24,658 | $ | 18,664 | $ | 36,208 | $ | 16,056 | |||||||||
Non-GAAP adjustments: | |||||||||||||||||||
Provision for (benefit from) income taxes (1) | 5,225 | 5,465 | 9,852 | (26,175 | ) | 2,199 | |||||||||||||
Other (income) expense, net | (174 | ) | 114 | 726 | (1,269 | ) | 391 | ||||||||||||
Interest income, net | (1,350 | ) | (498 | ) | (308 | ) | (156 | ) | (95 | ) | |||||||||
Litigation provision | — | — | — | 10,000 | — | ||||||||||||||
Depreciation and amortization | 6,751 | 4,821 | 2,917 | 2,226 | 1,376 | ||||||||||||||
Stock-based compensation (1) | 42,538 | 25,505 | 12,923 | 4,943 | 2,817 | ||||||||||||||
Adjusted EBITDA (1) | $ | 67,711 | $ | 60,065 | $ | 44,774 | $ | 25,777 | $ | 22,744 | |||||||||
(1) | See Note 2 “Change in Accounting Policy - Stock-Based Compensation” of Notes to Consolidated Financial Statements. |
28
Item 7. | Management’s Discussion and Analysis of Financial Condition and Results of Operations |
The following discussion and analysis should be read in conjunction with our consolidated financial statements and related notes thereto included in Item 8 and the Risk Factors included in Item 1A of Part I of this Annual Report on Form 10-K. All information presented herein is based on our fiscal calendar. Unless otherwise stated, references in this report to particular years or quarters refer to our fiscal years ended in July and the associated quarters of those fiscal years. We assume no obligation to revise or update any forward-looking statements for any reason, except as required by law.
Overview
We are a leading provider of software products that help Property & Casualty (“P&C”) insurers replace their legacy core systems and transform their business. Designed to be flexible and scalable, Guidewire InsuranceSuiteTM enables insurers to deliver excellent service, increase market share and lower operating costs. We also sell additional products in the areas of data management, mobile and portals, and hosted analytic applications which complement Guidewire InsuranceSuite and align with our mission to build software products that transform the P&C industry.
We sell our products to a wide variety of global P&C insurance carriers ranging from some of the largest global insurance carriers or their subsidiaries to national carriers to regional carriers. We continue to expand our global reach with sales and marketing growth in Europe and Asia Pacific, geographies in which we are building pipeline and strengthening our presence. Our customer engagement is led by our direct sales model and supported by our System Integrator (“SI”) partners. Customers can buy our software applications, PolicyCenter, ClaimCenter and BillingCenter, either separately or in combination as a suite. Strong customer relationships are a key driver of our success given the long-term nature of our contracts and the importance of customer references for new sales. We continue to focus on developing and maintaining our customer relationships through customer service and account management.
We see opportunities for orders from new customers, but our sales cycles remain long as customers are deliberate and the decision making process is long. We must also earn creditability as we expand our sales operations and enter new markets which involves extensive customer due diligence and reference checks. Finally, our new products are sold as complementary or adjacent to our InsuranceSuite which naturally limits the quantity of potential customers. We also see upsell opportunities with our existing customers for both InsuranceSuite and our newer products in data management, mobile and portals and hosted analytic applications. We continue to invest in sales and marketing as well as our SI partnerships and we work to align with each insurer’s strategic goals in order to address any sales cycle risk.
We primarily enter into term based licenses ranging from 3 to 7 years. These contracts are renewable on an annual or multi-year basis. We generally price our licenses based on the amount of direct written premiums (“DWP”) that will be managed by our solutions. We typically invoice our customers annually in advance or, in certain cases, quarterly for both recurring term license and maintenance fees. Our sales and marketing efforts are affected by seasonal variations in which our customer orders are higher in the second and fourth quarters of our fiscal year. We primarily derive our services revenues from implementation, integration and training services. Guidewire implementation teams assist customers in building implementation plans, integrating our software with their existing systems, and defining business rules and specific requirements unique to each customer and installation.
To extend our technology leadership position in the global market, we continue to focus on product innovation through our investment in research and development. We continue to invest in Guidewire InsuranceSuite - PolicyCenter, ClaimCenter and BillingCenter. Further, we are also investing in new technologies and offerings, such as data management, mobile and portals and hosted analytic applications. These investments complement Guidewire InsuranceSuite and enable our customers to accelerate the pace and impact of their transformation initiatives. New technology and product development is central to our core strategy and our commitment to our customers. Our product innovation strategy is critical to our growth and global expansion or otherwise responding to competitive pressures which could limit our ability to capture the global P&C market share. Our success depends on our continued ability to develop new or enhanced versions of our existing products to meet evolving customer requirements and enabling successful transformations.
We also partner with leading SI consulting firms to achieve scalable, cost-effective implementations for our customers. Our extensive relationships with SIs and industry partners have strengthened and expanded in line with the interest in and adoption of our products. We encourage our partners to co-market, pursue joint sales initiatives and drive broader adoption of our technology, helping us grow our business more efficiently and enabling us to focus our engineering resources on continued innovation and further enhancement of our solutions. Our track record of success with customers and their implementations is central to our strategy. We continue to focus and invest time and resources recruiting SI partners in new markets and ensuring that all partners are ready to assist with implementing our new products.
29
We face a number of risks in the execution of our strategy including expanding to new markets, lengthy sales cycles, intense competition in the global market, reliance on sales to a relatively small number of large customers, product development, customer buying patterns, and the overall adoption of our products. In response to these risks and factors as well as others we might face, we continue to invest in many areas of our business. Our investments in sales and marketing align with our goal of winning new customers in both existing markets and new markets. Further, our sales investments also enable us to maintain a persistent, consultative relationship with our existing customers in order to sell new products and solutions. Our investments in technology and product development allow us to sell in more markets and address a broader spectrum of customer needs as they embark on transformation initiatives. We will also continue to invest in our consulting services and our SI partner ecosystem with a goal of ensuring that all customers are successful in their transformation journey.
Key Business Metrics
We use certain key metrics to evaluate and manage our business, including rolling four-quarter recurring revenues from term licenses and total maintenance. In addition, we present select GAAP and non-GAAP financial metrics that we use internally to manage the business and that we believe are useful for investors. These metrics include Adjusted EBITDA and operating cash flow.
Four-Quarter Recurring Revenues
We measure four-quarter recurring revenues by adding the total term license revenues and total maintenance revenues recognized in the preceding four quarters ended in the stated period and excluding perpetual license revenues, revenues from perpetual buyout rights and services revenues. This metric allows us to better understand the trends in our recurring revenues because it typically reduces the variations in any particular quarter caused by seasonality, the effects of the annual invoicing of our term licenses and certain effects of contractual provisions that may accelerate or delay revenue recognition in some cases. Our four-quarter recurring revenues for each of the nine periods presented were:
Four quarters ended | |||||||||||||||||||||||||||||||||||
July 31, 2014 | April 30, 2014 | January 31, 2014 | October 31, 2013 | July 31, 2013 | April 30, 2013 | January 31, 2013 | October 31, 2012 | July 31, 2012 | |||||||||||||||||||||||||||
(in thousands) | |||||||||||||||||||||||||||||||||||
Term license revenues | $ | 139,902 | $ | 125,485 | $ | 115,144 | $ | 110,640 | $ | 112,863 | $ | 95,303 | $ | 92,792 | $ | 83,114 | $ | 74,869 | |||||||||||||||||
Total maintenance revenues | 41,888 | 39,836 | 38,510 | 37,830 | 37,561 | 35,548 | 34,207 | 31,802 | 29,538 | ||||||||||||||||||||||||||
Total four-quarter recurring revenues | $ | 181,790 | $ | 165,321 | $ | 153,654 | $ | 148,470 | $ | 150,424 | $ | 130,851 | $ | 126,999 | $ | 114,916 | $ | 104,407 | |||||||||||||||||
Adjusted EBITDA
We believe Adjusted EBITDA, a non-GAAP measure, is useful, in addition to other financial measures presented in accordance with GAAP, in evaluating our operating performance compared to that of other companies in our industry, as this metric generally eliminates the effects of certain items that may vary for different companies for reasons unrelated to overall operating performance. Please refer to Item 6, Selected Financial Data, for further details on why we use this metric and why we believe this metric is useful to our stockholders.
The following table provides a reconciliation of Net income to Adjusted EBITDA:
Fiscal years ended July 31, | |||||||||||
2014 | 2013 | 2012 | |||||||||
(unaudited, in thousands) | |||||||||||
Net income (1) | $ | 14,721 | $ | 24,658 | $ | 18,664 | |||||
Non-GAAP Adjustments: | |||||||||||
Provision for income taxes (1) | 5,225 | 5,465 | 9,852 | ||||||||
Other (income) expense, net | (174 | ) | 114 | 726 | |||||||
Interest income, net | (1,350 | ) | (498 | ) | (308 | ) | |||||
Depreciation and amortization | 6,751 | 4,821 | 2,917 | ||||||||
Stock-based compensation (1) | 42,538 | 25,505 | 12,923 | ||||||||
Adjusted EBITDA (1) | $ | 67,711 | $ | 60,065 | $ | 44,774 | |||||
(1) | See Note 2 “Change in Accounting Policy - Stock-Based Compensation” of Notes to Consolidated Financial Statements. |
30
Operating Cash Flows
We monitor our cash flows from operating activities, or operating cash flows, as a key measure of our overall business performance, which enables us to analyze our financial performance without the effects of certain non-cash items such as depreciation and amortization and stock-based compensation expenses. Additionally, operating cash flows takes into account the impact of changes in deferred revenues, which reflects the receipt of cash payment for products before they are recognized as revenues. Our operating cash flows are significantly impacted by timing of invoicing and collections of accounts receivable, annual bonus payment, as well as payments of payroll and other taxes. They were also impacted by the payment of a litigation settlement during the three months ended October 31, 2011. As a result, our operating cash flows fluctuate significantly on a quarterly basis. Operating cash flows were $75.5 million, $32.5 million and $17.1 million for fiscal years 2014, 2013 and 2012, respectively. For a further discussion of our operating cash flows, see “Liquidity and Capital Resources—Cash Flows from Operating Activities.”
Critical Accounting Policies and Estimates
Our consolidated financial statements have been prepared in conformity with generally accepted accounting principles in the United States and include our accounts and the accounts of our wholly-owned subsidiaries. The preparation of our consolidated financial statements requires our management to make estimates, assumptions, and judgments that affect the reported amounts of assets and liabilities and disclosures for contingent assets and liabilities as of the date of the financial statements, and the reported amounts of revenues and expenses during the applicable periods. Management bases its estimates, assumptions and judgments on historical experience and on various other factors that are believed to be reasonable under the circumstances. Different assumptions and judgments would change the estimates used in the preparation of our consolidated financial statements which, in turn, could change the results from those reported. The accounting policies described below are significantly affected by critical accounting estimates. Such accounting policies require significant judgments, assumptions, and estimates used in the preparation of the consolidated financial statements and actual results could differ materially from the amounts reported based on these policies. To the extent there are material differences between our estimates and the actual results, our future consolidated results of operations may be affected.
Revenue Recognition
We enter into arrangements to deliver multiple products or services (multiple-elements). We apply software revenue recognition rules and allocate the total revenues among elements based on vendor-specific objective evidence (“VSOE”) of fair value of each element. We recognize revenue on a net basis excluding taxes collected from customers and remitted to government authorities.
Revenues are derived from three sources:
(i) | License fees, related to term (or time-based) licenses, perpetual software licenses, and other; |
(ii) | Maintenance fees, related to email and phone support, bug fixes and unspecified software updates and upgrades released when, and if available during the maintenance term; and |
(iii) | Services fees, related to professional services related to implementation of our software, reimbursable travel and training. |
Revenues are recognized when all of the following criteria are met:
• | Persuasive evidence of an arrangement exists. Evidence of an arrangement consists of a written contract signed by both the customer and management prior to the end of the period. |
• | Delivery or performance has occurred. Our software is delivered electronically to the customer. Delivery is considered to have occurred when we provide the customer access to the software along with login credentials. |
• | Fees are fixed or determinable. Arrangements where a significant portion of the fee is due beyond 90 days from delivery are not considered to be fixed or determinable. Revenues from such arrangements are recognized as payments become due, assuming all other revenue recognition criteria have been met. Fees from term licenses are generally due in annual or, in certain cases, quarterly installments over the term of the agreement beginning on the effective date of the license. Accordingly, fees from term licenses are not considered to be fixed or determinable until they become due. |
• | Collectability is probable. Collectability is assessed on a customer-by-customer basis, based primarily on creditworthiness as determined by credit checks and analysis, as well as customer payment history. Payment terms generally range from 30 to 90 days from invoice date. If it is determined prior to revenue recognition that collection of an arrangement fee is not probable, revenues are deferred until collection becomes probable or cash is collected, assuming all other revenue recognition criteria are satisfied. |
31
VSOE of fair value does not exist for our software licenses; therefore, we allocate revenues to software licenses using the residual method. Under the residual method, the amount recognized for license fees is the difference between the total fixed and determinable fees and the VSOE of fair value for the undelivered elements under the arrangement.
The VSOE of fair value for elements of an arrangement is based upon the normal pricing and discounting practices for those elements when sold separately. VSOE of fair value for maintenance is established using the stated maintenance renewal rate in the customer’s contract. We generally enter into term licenses ranging from 3 to 7 years. For term licenses with duration of one year or less, no VSOE of fair value for maintenance exists. VSOE of fair value for services is established if a substantial majority of historical stand-alone selling prices for a service fall within a reasonably narrow price range.
If the undelivered elements are all service elements and VSOE of fair value does not exist for one or more service element, the total arrangement fee is recognized ratably over the longest service period starting at software delivery, assuming all the related services have been made available to the customer.
In certain offerings sold as fixed fee arrangements, we recognize services revenues on a proportional performance basis as performance obligations are completed by using the ratio of labor hours to date as an input measure compared to total estimated labor hours for the consulting services.
In cases where professional services are deemed to be essential to the functionality of the software, the arrangement is accounted for using contract accounting until the essential services are complete. If reliable estimates of total project costs can be made, we apply the percentage-of-completion method whereby percentage toward completion is measured by using the ratio of service billings to date compared to total estimated service billings for the consulting services. Service billings approximate labor hours as an input measure since they are generally billed monthly on a time and material basis. The fees related to the maintenance are recognized over the period the maintenance is provided.
If reliable estimates of total project costs cannot be made or VSOE for maintenance has not been established and it is reasonably assured that no loss will be incurred under the arrangement, revenues are recognized pursuant to the zero gross margin method. Under this method, revenues recognized are limited to the costs incurred for the implementation services. When zero gross margin method is applied for lack of reliable project estimates and subsequently project estimates become reliable, we switch to the percentage-of-completion; resulting in a cumulative effect adjustment for deferred license revenues to the extent of progress toward completion, and the related deferred professional service margin is recognized in full as revenues. Such cumulative effect adjustment for license revenues was zero, $3.2 million and $0.9 million for the fiscal years ended July 31, 2014, 2013 and 2012, respectively, and for service revenues was zero, $1.7 million and $0.9 million for the fiscal years ended July 31, 2014, 2013 and 2012, respectively.
Deferred Revenues
Deferred revenues represent license, maintenance and professional services amounts, which are billed to or collected from customers for which the related revenues have not been recognized. The revenues are deferred when one or more of the revenue recognition criteria have not been met. The current portion of deferred revenues represents the amount that is expected to be recognized as revenues within one year from the balance sheet date. We generally invoice fees for licenses and maintenance to our customers in annual or, in certain cases, quarterly installments payable in advance. Accordingly, the deferred revenues balance does not represent the total contract value of annual or multi-year, non-cancellable arrangements.
Stock-Based Compensation
We recognize compensation expense related to stock options and restricted stock units (“RSUs”) granted to employees based on the estimated fair value of the awards on the date of grant, net of estimated forfeitures. The RSUs are subject to time-based vesting, which generally occurs over a period of four years. If an employee terminates employment from us prior to the occurrence of the performance-based condition, the employee does not forfeit the RSUs to the extent the time-based vesting requirements were satisfied prior to termination. The awards expire 10 years from the grant date. We estimate the grant date fair value, and the resulting stock-based compensation expense, of our stock options using the Black-Scholes option-pricing model. We recognize the fair value of stock-based compensation for awards which contain only service conditions on a straight-line basis over the requisite service period, which is generally the vesting period of the respective awards. We recognize the compensation cost for awards which contain performance conditions based upon the probability of that performance condition being met, net of estimated forfeitures, using the graded method. Compensation cost for RSUs is generally recognized over the time-based vesting period.
In the fourth quarter of fiscal 2014, we changed our policy for recognizing stock-based compensation expense from the accelerated attribution method of accounting to the straight-line method of accounting for certain share-based compensation awards. Comparative financial information for prior periods have been adjusted to apply the straight-line method
32
retrospectively. See Note 2 “Change in Accounting Policy - Stock-based Compensation” to the consolidated financial statements included in this Annual Report on Form 10-K for further information.
Income Taxes
Income taxes are accounted for under the asset and liability method. Deferred tax assets and liabilities are recognized for the future tax consequences attributable to differences between the financial statement carrying amounts of existing assets and liabilities and their respective tax bases and operating loss and tax credit carryforwards. Deferred tax assets and liabilities are measured using enacted tax rates expected to apply to taxable income in the years in which those temporary differences are expected to be recovered or settled. Deferred tax assets related to excess tax benefits are recorded when utilized. The effect on deferred tax assets and liabilities of a change in tax rates is recognized in income in the period that includes the enactment date. We record a valuation allowance to reduce deferred tax assets to an amount of which realization is more likely than not.
Accounting guidance related to accounting for uncertainties in income taxes provides that a tax benefit from an uncertain tax position may be recognized when it is more likely than not that the position will be sustained upon examination, including resolutions of any related appeals or litigation processes, based on the technical merits of the position. This interpretation also provides guidance on measurement, derecognition, classification, interest and penalties, accounting in interim periods, disclosure and transition.
We record interest and penalties related to unrecognized tax benefits as income tax expense in our consolidated statement of income.
Recent Accounting Pronouncement
See Note 1 “The Company and Summary of Significant Accounting Policies and Estimates” in the Notes to the Consolidated Financial Statements in Item 8 of Part II of this Annual Report on Form 10-K, for a full description of recent accounting pronouncements, including the expected dates of adoption, which is incorporated herein by reference.
Results of Operations
The following tables set forth our results of operations for the periods presented. The data has been derived from the Consolidated Financial Statements contained in this Annual Report on Form 10-K which, in the opinion of our management, reflect all adjustments, consisting only of normal recurring adjustments, necessary to present fairly the financial position and results of operations for the interim periods presented. The operating results for any period should not be considered indicative of results for any future period.
33
Fiscal years ended July 31, | |||||||||||
2014 | 2013 | 2012 | |||||||||
Revenues: | (in thousands) | ||||||||||
License | $ | 151,921 | $ | 123,560 | $ | 97,136 | |||||
Maintenance | 41,888 | 37,561 | 29,538 | ||||||||
Services | 156,437 | 139,528 | 105,387 | ||||||||
Total revenues | 350,246 | 300,649 | 232,061 | ||||||||
Cost of revenues: (1) | |||||||||||
License | 4,442 | 920 | 762 | ||||||||
Maintenance | 8,118 | 7,216 | 5,193 | ||||||||
Services | 136,387 | 117,515 | 84,050 | ||||||||
Total cost of revenues | 148,947 | 125,651 | 90,005 | ||||||||
Gross profit: (1) | |||||||||||
License | 147,479 | 122,640 | 96,374 | ||||||||
Maintenance | 33,770 | 30,345 | 24,345 | ||||||||
Services | 20,050 | 22,013 | 21,337 | ||||||||
Total gross profit | 201,299 | 174,998 | 142,056 | ||||||||
Operating expenses: (1) | |||||||||||
Research and development | 76,178 | 62,991 | 49,056 | ||||||||
Sales and marketing | 71,295 | 50,948 | 36,781 | ||||||||
General and administrative | 35,404 | 31,320 | 27,285 | ||||||||
Total operating expenses | 182,877 | 145,259 | 113,122 | ||||||||
Income from operations | 18,422 | 29,739 | 28,934 | ||||||||
Interest income, net | 1,350 | 498 | 308 | ||||||||
Other income (expenses), net | 174 | (114 | ) | (726 | ) | ||||||
Income before provision for income taxes (1) | 19,946 | 30,123 | 28,516 | ||||||||
Provision for income taxes (1) | 5,225 | 5,465 | 9,852 | ||||||||
Net income (1) | $ | 14,721 | $ | 24,658 | $ | 18,664 | |||||
Revenues: | |||||||||||
License | 43 | % | 41 | % | 42 | % | |||||
Maintenance | 12 | 13 | 13 | ||||||||
Services | 45 | 46 | 45 | ||||||||
Total revenues | 100 | 100 | 100 | ||||||||
Total cost of revenues (1) | 42 | 42 | 39 | ||||||||
Total gross profit (1) | 58 | 58 | 61 | ||||||||
Operating expenses: (1) | |||||||||||
Research and development | 22 | 21 | 21 | ||||||||
Sales and marketing | 20 | 17 | 16 | ||||||||
General and administrative | 10 | 10 | 12 | ||||||||
Litigation provision | — | — | — | ||||||||
Total operating expenses | 52 | 48 | 49 | ||||||||
Income from operations | 6 | 10 | 12 | ||||||||
Interest income, net | — | — | — | ||||||||
Other income (expenses), net | — | — | — | ||||||||
Income before provision for income taxes (1) | 6 | 10 | 12 | ||||||||
Provision for income taxes (1) | 2 | 2 | 4 | ||||||||
Net Income (1) | 4 | % | 8 | % | 8 | % | |||||
(1) | See Note 2 “Change in Accounting Policy - Stock-Based Compensation” of Notes to Consolidated Financial Statements. |
34
Comparison of the Fiscal Years Ended July 31, 2014 and 2013
Revenues
Please refer to Note 1 of Notes to Consolidated Financial Statements for a description of our accounting policy related to revenue recognition.
Fiscal years ended July 31, | ||||||||||||||||||||
2014 | 2013 | Change | ||||||||||||||||||
% of total | % of total | |||||||||||||||||||
Amount | revenues | Amount | revenues | ($) | (%) | |||||||||||||||
(in thousands, except percentages) | ||||||||||||||||||||
Revenues: | ||||||||||||||||||||
License | $ | 151,921 | 43 | % | $ | 123,560 | 41 | % | $ | 28,361 | 23 | % | ||||||||
Maintenance | 41,888 | 12 | 37,561 | 13 | 4,327 | 12 | ||||||||||||||
Services | 156,437 | 45 | 139,528 | 46 | 16,909 | 12 | ||||||||||||||
Total revenues | $ | 350,246 | 100 | % | $ | 300,649 | 100 | % | $ | 49,597 | 17 | % | ||||||||
License Revenues
The $28.4 million increase in license revenues during fiscal year 2014 was primarily driven by increased adoption of our InsuranceSuite software, and increased sales and marketing efforts in North America and Europe.
Fiscal years ended July 31, | ||||||||||||||||||||
2014 | 2013 | Change | ||||||||||||||||||
% of license | % of license | |||||||||||||||||||
Amount | revenues | Amount | revenues | ($) | (%) | |||||||||||||||
(In thousands, except percentages) | ||||||||||||||||||||
License revenues: | ||||||||||||||||||||
Term | $ | 139,902 | 92 | % | $ | 112,863 | 91 | % | $ | 27,039 | 24 | % | ||||||||
Perpetual | 12,019 | 8 | 10,697 | 9 | 1,322 | 12 | ||||||||||||||
Total license revenues | $ | 151,921 | 100 | % | $ | 123,560 | 100 | % | $ | 28,361 | 23 | % | ||||||||
The $27.0 million increase in term license revenues during the fiscal year 2014 was primarily driven by $31.3 million of revenues recognized from new orders or expanded orders from existing customers, offset by a net decrease of $4.3 million of revenues due to contractual terms that affected license revenue recognition from customer contracts.
The $1.3 million increase in perpetual license revenues during the fiscal year 2014 was primarily driven by revenues from existing customers for additional products in the current period.
Maintenance Revenues
The $4.3 million increase in maintenance revenues during the fiscal year 2014 reflects our growing customer base.
Services Revenues
The $16.9 million increase in service revenues during the fiscal year 2014 was primarily driven by an additional $14.4 million of revenues related to implementation of our software and $2.5 million revenues related to training and reimbursable travel costs. This increase is net of $2.3 million of services billings that were deferred due to certain contractual terms during the fiscal year 2014.
Deferred Revenues
35
As of July 31, | ||||||||||||||
2014 | 2013 | Change | ||||||||||||
Amount | Amount | ($) | (%) | |||||||||||
(In thousands, except percentages) | ||||||||||||||
Deferred revenues: | ||||||||||||||
Deferred license revenues | $ | 19,295 | $ | 14,435 | $ | 4,860 | 34 | % | ||||||
Deferred maintenance revenues | 28,702 | 22,017 | 6,685 | 30 | ||||||||||
Deferred services revenues | 7,335 | 4,744 | 2,591 | 55 | ||||||||||
Total deferred revenues | $ | 55,332 | $ | 41,196 | $ | 14,136 | 34 | % | ||||||
The $4.9 million increase in deferred license revenues compared to prior year end was primarily driven by $3.7 million of deferred license billings for new deals during the fiscal year 2014 and remaining revenues are deferred due to other contractual terms that affected license revenue recognition.
The $6.7 million increase in deferred maintenance revenues compared to the prior year end was primarily driven by our growing customer base and reflects the seasonal nature of the billing of maintenance revenues.
The $2.6 million increase in deferred services revenues compared to the prior year end was primarily driven by $2.3 million of services billings deferred due to certain contractual terms during the fiscal year 2014.
Included in our long-term deferred revenues as of July 31, 2014, is $4.4 million of deferred revenue for one customer. The contractual obligation for this customer will be met in the first quarter of fiscal year 2015 and the revenue will be recognized in the first quarter of fiscal year 2015.
Our deferred revenues consist only of amounts that have been invoiced, but not yet recognized as revenues. As a result, deferred revenues and change in deferred revenues are incomplete measures of the strength of our business and are not necessarily indicative of our future performance.
Cost of Revenues and Gross Profit
Fiscal years ended July 31, | ||||||||||||||
2014 | 2013 | Change | ||||||||||||
Amount | Amount | ($) | (%) | |||||||||||
(In thousands, except percentages) | ||||||||||||||
Cost of revenues: (1) | ||||||||||||||
License | $ | 4,442 | $ | 920 | $ | 3,522 | 383 | % | ||||||
Maintenance | 8,118 | 7,216 | 902 | 13 | ||||||||||
Services | 136,387 | 117,515 | 18,872 | 16 | ||||||||||
Total cost of revenues | $ | 148,947 | $ | 125,651 | $ | 23,296 | 19 | % | ||||||
Includes stock-based compensation of: (1) | ||||||||||||||
Cost of license revenues | $ | 184 | $ | — | $ | 184 | ||||||||
Cost of maintenance revenues | 797 | 830 | (33 | ) | ||||||||||
Cost of services revenues | 11,929 | 6,910 | 5,019 | |||||||||||
Total | $ | 12,910 | $ | 7,740 | $ | 5,170 | ||||||||
(1) | See Note 2 “Change in Accounting Policy - Stock-Based Compensation” of Notes to Consolidated Financial Statements. |
The $23.3 million increase in cost of revenues was primarily due to a 17% increase in revenues for fiscal year 2014. The increased costs were primarily driven by an increase of $10.4 million in personnel-related expenses as a result of an average increase of 47 additional employees hired during the fiscal year 2014 primarily to provide implementation services to our customers, a $5.2 million increase in stock-based compensation expenses, a $4.4 million increase in non-billable travel related expenses, professional services, administrative expenses and royalties owed on third-party licensed technology, and $3.3 million increase in billable expenses and third-party consultant costs.
We expect our cost of revenues to increase in absolute dollars in future periods to provide additional implementation services to our growing customer base.
36
Fiscal years ended July 31, | ||||||||||||||||||||
2014 | 2013 | Change | ||||||||||||||||||
Amount | margin % | Amount | margin % | ($) | (%) | |||||||||||||||
(In thousands, except percentages) | ||||||||||||||||||||
Gross profit: (1) | ||||||||||||||||||||
License | $ | 147,479 | 97 | % | $ | 122,640 | 99 | % | $ | 24,839 | 20 | % | ||||||||
Maintenance | 33,770 | 81 | 30,345 | 81 | 3,425 | 11 | ||||||||||||||
Services | 20,050 | 13 | 22,013 | 16 | (1,963 | ) | (9 | ) | ||||||||||||
Total gross profit | $ | 201,299 | 57 | % | $ | 174,998 | 58 | % | $ | 26,301 | 15 | % | ||||||||
(1) | See Note 2 “Change in Accounting Policy - Stock-Based Compensation” of Notes to Consolidated Financial Statements. |
The $26.3 million increase in gross profit during the fiscal year 2014 was primarily due to increases in license and service revenues that were partially offset by increases in corresponding costs of revenues. License margins decreased to 97% for the fiscal year 2014 from 99% in the fiscal year 2013, due to amortization of acquired intangibles and royalties owed on third-party licensed technology. Service margin decreased to 13% for the fiscal year 2014 from 16% in the fiscal year 2013, primarily due to an increase in personnel-related costs, as well as increases in stock-based compensation and third-party consultant costs. Gross margin decreased slightly to 57% for the fiscal year 2014 from 58% for the fiscal year 2013, primarily due to an increase in revenues being attributed to services, which have lower margins than license and maintenance revenues, as well as a decrease in service margin.
We expect our quarterly gross margin to vary in percentage terms in future periods as we experience changes in the mix between higher gross margin license revenues and lower gross margin service revenues.
Operating Expenses
Fiscal years ended July 31, | ||||||||||||||||||||
2014 | 2013 | Change | ||||||||||||||||||
% of total | % of total | |||||||||||||||||||
Amount | revenues | Amount | revenues | ($) | (%) | |||||||||||||||
(In thousands, except percentages) | ||||||||||||||||||||
Operating expenses: (1) | ||||||||||||||||||||
Research and development | $ | 76,178 | 22 | % | $ | 62,991 | 21 | % | $ | 13,187 | 21 | % | ||||||||
Sales and marketing | 71,295 | 20 | 50,948 | 17 | 20,347 | 40 | ||||||||||||||
General and administrative | 35,404 | 10 | 31,320 | 10 | 4,084 | 13 | ||||||||||||||
Total operating expenses | $ | 182,877 | 52 | % | $ | 145,259 | 48 | % | $ | 37,618 | 26 | % | ||||||||
Includes stock-based compensation of: (1) | ||||||||||||||||||||
Research and development | $ | 9,008 | $ | 5,843 | $ | 3,165 | ||||||||||||||
Sales and marketing | 10,744 | 3,672 | 7,072 | |||||||||||||||||
General and administrative | 9,876 | 8,250 | 1,626 | |||||||||||||||||
Total | $ | 29,628 | $ | 17,765 | $ | 11,863 | ||||||||||||||
(1) | See Note 2 “Change in Accounting Policy - Stock-Based Compensation” of Notes to Consolidated Financial Statements. |
The $37.6 million increase in operating expenses was primarily driven by increased personnel-related and operational expenses, including higher stock-based compensation, travel-related costs, marketing programs, professional services costs including consulting, as a result of hiring 46 additional employees during the fiscal year 2014 in these functional areas.
We expect all of our operating expense line items to increase in absolute dollars in future periods to support our future growth strategy.
Research and Development
The $13.2 million increase in research and development expenses was primarily due to an increase of $7.1 million in personnel-related expenses as a result of an average of 32 additional employees during the fiscal year 2014, a $3.2 million increase in stock-based compensation and a $2.9 million increase in other professional services expenses and operational costs.
Sales and Marketing
37
The $20.3 million increase in sales and marketing expenses was primarily due to a $9.6 million increase in personnel-related expenses primarily as a result of an average of 52 additional employees during the fiscal year 2014, a $7.1 million increase in stock-based compensation, a $1.8 million increase in travel-related costs and marketing programs, and a $1.8 million increase in operational costs.
General and Administrative
The $4.1 million increase in general and administrative expenses was primarily due to a $4.8 million increase in personnel-related expenses primarily as a result of an average of 19 additional employees during the fiscal year 2014, and a $1.6 million increase in stock-based compensation. These increases were offset by a $2.3 million decrease in operational costs.
Other Income (Expense)
Fiscal years ended July 31, | |||||||||||||
2014 | 2013 | Change | |||||||||||
Amount | Amount | ($) | (%) | ||||||||||
(In thousands, except percentages) | |||||||||||||
Interest income, net | $ | 1,350 | $ | 498 | $ | 852 | * | ||||||
Other expense, net | 174 | (114 | ) | 288 | * | ||||||||
Total | $ | 1,524 | $ | 384 | $ | 1,140 | * | ||||||
* | Not meaningful |
Interest Income, Net
Interest income increased by $0.9 million primarily due to higher interest income from the yield earned on the proceeds of our follow-on public offering and the investment of excess cash in the fiscal year 2014.
Other Expense, Net
Other expense increased by $0.3 million primarily due to higher currency exchange losses resulting from the U.S. dollar strengthening against the Australian dollar, Canadian dollar, Euro, and British pound during the fiscal year 2014 compared to the fiscal year 2013.
Provision for Income Taxes
We recognized an income tax provision of $5.2 million for the fiscal year 2014 compared to $5.5 million for the fiscal year 2013. Our effective income tax rate increased to 26.2% for the fiscal year 2014 compared to 18.1% for the fiscal year 2013, which was primarily due to a decrease in tax credits.
Comparison of the Fiscal Years Ended July 31, 2013 and 2012
Revenues
Please refer to Note 1 of Notes to Consolidated Financial Statements for a description of our accounting policy related to revenue recognition.
Fiscal years ended July 31, | ||||||||||||||||||||
2013 | 2012 | Change | ||||||||||||||||||
% of total revenues | % of total revenues | |||||||||||||||||||
Amount | Amount | ($) | (%) | |||||||||||||||||
(in thousands, except percentages) | ||||||||||||||||||||
Revenues: | ||||||||||||||||||||
License | $ | 123,560 | 41 | % | $ | 97,136 | 42 | % | $ | 26,424 | 27 | % | ||||||||
Maintenance | 37,561 | 13 | 29,538 | 13 | 8,023 | 27 | ||||||||||||||
Services | 139,528 | 46 | 105,387 | 45 | 34,141 | 32 | ||||||||||||||
Total revenues | $ | 300,649 | 100 | % | $ | 232,061 | 100 | % | $ | 68,588 | 30 | % | ||||||||
License Revenues
38
The $26.4 million increase in license revenues during the fiscal year 2013 was primarily driven by continued adoption of our PolicyCenter software, increased adoption of our BillingCenter and InsuranceSuite software, and increased sales and marketing efforts in North America and Europe.
Fiscal years ended July 31, | ||||||||||||||||||||
2013 | 2012 | Change | ||||||||||||||||||
% of license revenues | % of license revenues | |||||||||||||||||||
Amount | Amount | ($) | (%) | |||||||||||||||||
(In thousands, except percentages) | ||||||||||||||||||||
License revenues: | ||||||||||||||||||||
Term | $ | 112,863 | 91 | % | $ | 74,869 | 77 | % | $ | 37,994 | 51 | % | ||||||||
Perpetual | 10,697 | 9 | 22,267 | 23 | (11,570 | ) | (52 | ) | ||||||||||||
Total license revenues | $ | 123,560 | 100 | % | $ | 97,136 | 100 | % | $ | 26,424 | 27 | % | ||||||||
The $38.0 million increase in term license revenues during the fiscal year 2013 was driven by $32.0 million of additional revenues recognized during the fiscal year 2013 from new orders, $5.8 million of additional revenues recognized upon attainment of the required revenue recognition criteria related to prior year orders during the fiscal year 2013, and $2.7 million of revenues recognized due to timing of invoicing and corresponding due dates. In addition, there was $0.9 million of additional revenues recognized when VSOE of fair value of maintenance was established for one customer during the fiscal year 2013. These increases were partially offset by a decrease of $2.5 million of revenues recognized due to completion of project implementations in prior periods, and a decrease of $1.1 million of revenues recognized for one customer that exercised a perpetual buyout option in the prior period.
The $11.6 million decrease in perpetual license revenues during the fiscal year 2013 was primarily driven by new customers increasingly signing term license agreements in the current period. This decrease was net of a $3.0 million increase in revenues related to new orders, and $2.5 million of revenues recognized for one customer from milestone billing upon completion of a project.
Maintenance Revenues
The $8.0 million increase in maintenance revenues was primarily driven by $6.8 million of additional revenues recognized from new and existing orders, and $1.1 million of revenues recognized upon attainment of the required revenue recognition criteria related to prior year orders during the period.
Services Revenues
The $34.1 million increase in services revenues was primarily driven by an additional $29.4 million of revenues related to implementation of our software. Included in this increase is $1.7 million of revenues recognized when reliable estimates were obtained from one customer during the prior period, $4.0 million of revenues recognized upon completion of implementation projects continued from prior fiscal years, and $0.7 million of revenues recognized when VSOE of fair value of maintenance was established for one customer during the fiscal year 2013. In addition, an increase of $2.5 million was recognized related to training and an increase of $2.2 million in revenues were recognized related to reimbursable travel expenses.
Deferred Revenues
As of July 31, | ||||||||||||||
2013 | 2012 | Change | ||||||||||||
Amount | Amount | ($) | (%) | |||||||||||
(In thousands, except percentages) | ||||||||||||||
Deferred revenues: | ||||||||||||||
Deferred license revenues | $ | 14,435 | $ | 25,766 | $ | (11,331 | ) | (44 | )% | |||||
Deferred maintenance revenues | 22,017 | 21,536 | 481 | 2 | ||||||||||
Deferred services revenues | 4,744 | 8,214 | (3,470 | ) | (42 | ) | ||||||||
Total deferred revenues | $ | 41,196 | $ | 55,516 | $ | (14,320 | ) | (26 | )% | |||||
The $11.3 million decrease in deferred license revenues was primarily driven by $5.8 million of revenues recognized from existing orders entered into in prior fiscal years where we attained the required revenue recognition criteria during the fiscal year 2013, of which $3.2 million of revenues was due to the attainment of reliable estimates for one customer. In
39
addition, $5.2 million of revenues were recognized during the fiscal year 2013 related to implementation projects completed in prior fiscal years and for which revenue is recognized over the related maintenance term due to lack of VSOE, $1.4 million of revenues recognized from prior fiscal year orders and $0.9 million of revenues recognized when VSOE of fair value of maintenance was established for one customer during the fiscal year 2013. This decrease was partially offset by $2.0 million of deferred license billings for new deals during the fiscal year 2013, including $0.9 million deferred due to lack of attainment of revenue recognition criteria as of July 31, 2013.
The $0.5 million increase in deferred maintenance revenues during the fiscal year 2013 was primarily driven by $1.6 million of revenues deferred for billings of new and existing orders during the fiscal year 2013, partially offset by $1.1 million of revenues recognized upon attainment of the required revenue recognition criteria during fiscal year 2013.
The $3.5 million decrease in deferred services revenues was primarily driven by $4.0 million of revenues recognized related to an implementation project completed in prior fiscal years and for which revenue is recognized over the related maintenance term due to lack of VSOE. Further, $1.7 million of revenues were recognized upon obtainment of reliable estimates for one customer during the fiscal year 2013 and $0.7 million of revenues were recognized when VSOE of fair value of maintenance was established for one customer during fiscal year 2013. This decrease was partially offset by $1.2 million of services revenues deferred during the fiscal year 2013 due to lack of attainment of revenue recognition and $2.0 million of services revenues deferred for contracts where revenue is recognized based on completion of a services performance obligation during the period.
Included in our deferred revenues as of July 31, 2013, is $1.8 million of deferred revenue for one customer that is subject to refund in the event of nonperformance of certain project implementation milestones.
Our deferred revenues consist only of amounts that have been invoiced, but not yet recognized as revenues. As a result, deferred revenues and change in deferred revenues are incomplete measures of the strength of our business and are not necessarily indicative of our future performance.
Cost of Revenues and Gross Profit
Fiscal years ended July 31, | ||||||||||||||
2013 | 2012 | Change | ||||||||||||
Amount | Amount | ($) | (%) | |||||||||||
(In thousands, except percentages) | ||||||||||||||
Cost of revenues: (1) | ||||||||||||||
License | $ | 920 | $ | 762 | $ | 158 | 21 | % | ||||||
Maintenance | 7,216 | 5,193 | 2,023 | 39 | ||||||||||
Services | 117,515 | 84,050 | 33,465 | 40 | ||||||||||
Total cost of revenues | $ | 125,651 | $ | 90,005 | $ | 35,646 | 40 | % | ||||||
Includes stock-based compensation of: (1) | ||||||||||||||
Cost of license revenues | $ | — | $ | — | $ | — | ||||||||
Cost of maintenance revenues | 830 | 288 | 542 | |||||||||||
Cost of services revenues | 6,910 | 2,461 | 4,449 | |||||||||||
Total | $ | 7,740 | $ | 2,749 | $ | 4,991 | ||||||||
(1) | See Note 2 “Change in Accounting Policy - Stock-Based Compensation” of Notes to Consolidated Financial Statements. |
The $35.6 million increase in cost of revenues was primarily due to a 30% increase in revenues for the fiscal year 2013. The increased costs were primarily driven by an increase of $16.8 million in personnel-related expenses as a result of 146 additional employees hired during the fiscal year 2013 primarily to provide implementation services to our customers, a $8.4 million increase in billable expenses and third-party consultant costs, a $5.6 million increase in non-billable travel-related expenses, professional services and administrative expenses and a $4.9 million increase in stock-based compensation expenses.
40
Fiscal years ended July 31, | ||||||||||||||||||||
2013 | 2012 | Change | ||||||||||||||||||
Amount | margin % | Amount | margin % | ($) | (%) | |||||||||||||||
(In thousands, except percentages) | ||||||||||||||||||||
Gross profit: (1) | ||||||||||||||||||||
License | $ | 122,640 | 99 | % | $ | 96,374 | 99 | % | $ | 26,266 | 27 | % | ||||||||
Maintenance | 30,345 | 81 | 24,345 | 82 | 6,000 | 25 | ||||||||||||||
Services | 22,013 | 16 | 21,337 | 20 | 676 | 3 | ||||||||||||||
Total gross profit | $ | 174,998 | 58 | % | $ | 142,056 | 61 | % | $ | 32,942 | 23 | % | ||||||||
(1) | See Note 2 “Change in Accounting Policy - Stock-Based Compensation” of Notes to Consolidated Financial Statements. |
Gross profit increased by $32.9 million primarily due to increased license revenues during the fiscal year 2013. Gross margin decreased to 58% for the fiscal year 2013 from 61% for the fiscal year 2012, primarily due to the increase in lower gross margin services revenues as a percentage of total revenues. The decrease in services margin in the current fiscal year is due to the increases in personnel-related expenses and stock-based compensation expenses discussed above, which outpaced the increase in revenues.
Operating Expenses
Fiscal years ended July 31, | |||||||||||||||||||||
2013 | 2012 | Change | |||||||||||||||||||
% of total | % of total | ||||||||||||||||||||
Amount | revenues | Amount | revenues | ($) | (%) | ||||||||||||||||
(In thousands, except percentages) | |||||||||||||||||||||
Operating expenses: (1) | |||||||||||||||||||||
Research and development | $ | 62,991 | 21 | % | $ | 49,056 | 21 | % | $ | 13,935 | 28 | % | |||||||||
Sales and marketing | 50,948 | 17 | 36,781 | 16 | 14,167 | 39 | |||||||||||||||
General and administrative | 31,320 | 10 | 27,285 | 12 | 4,035 | 15 | |||||||||||||||
Total operating expenses | $ | 145,259 | 48 | % | $ | 113,122 | 49 | % | $ | 32,137 | 28 | % | |||||||||
Includes stock-based compensation of: (1) | |||||||||||||||||||||
Research and development | $ | 5,843 | $ | 2,385 | $ | 3,458 | |||||||||||||||
Sales and marketing | 3,672 | 1,496 | 2,176 | ||||||||||||||||||
General and administrative | 8,250 | 6,293 | 1,957 | ||||||||||||||||||
Total | $ | 17,765 | $ | 10,174 | $ | 7,591 | |||||||||||||||
(1) | See Note 2 “Change in Accounting Policy - Stock-Based Compensation” of Notes to Consolidated Financial Statements. |
The $32.1 million increase in operating expenses was primarily driven by increased personnel-related and operational expenses, including higher stock-based compensation, professional services costs including consulting and other professional service cost, travel-related costs, marketing programs, professional services costs including consulting, as a result of hiring 166 additional employees during the fiscal year 2013 in these functional areas.
We expect all of our operating expense line items to increase in absolute dollars in future periods to support our future growth strategy.
Research and Development
The $13.9 million increase in research and development expenses was primarily due to an increase of $6.8 million in personnel-related expenses as a result of 75 additional employees during the fiscal year 2013, a $3.7 million increase in administrative and other professional services expenses and a $3.4 million increase in stock-based compensation.
Sales and Marketing
The $14.2 million increase in sales and marketing expenses was primarily due to a $6.6 million increase in personnel-related expenses primarily as a result of 55 additional employees during the fiscal year 2013, a $2.7 million increase in travel-related costs, marketing programs and professional services, a $2.7 million increase in operations costs, and a $2.2 million increase in stock-based compensation.
41
General and Administrative
The $4.0 million increase in general and administrative expenses was primarily due to a $4.0 million increase in personnel-related expenses primarily as a result of 36 additional employees during the fiscal year 2013, a $2.0 million increase in stock-based compensation, and a $1.6 million increase in professional services. These increases were offset by a $3.6 million decrease in operational expenses.
Other Income (Expense)
Fiscal years ended July 31, | |||||||||||||
2013 | 2012 | Change | |||||||||||
Amount | Amount | ($) | (%) | ||||||||||
(In thousands, except percentages) | |||||||||||||
Interest income, net | $ | 498 | $ | 308 | $ | 190 | * | ||||||
Other expense, net | (114 | ) | (726 | ) | 612 | * | |||||||
Total | $ | 384 | $ | (418 | ) | $ | 802 | * | |||||
* Not meaningful
Interest Income, Net
Interest income increased by $0.2 million primarily due to higher interest income from the yield earned on the initial public offering (“IPO”) proceeds and the investment of excess cash in the fiscal year 2013.
Other Income (Expense), Net
Other expense decreased by $0.6 million primarily due to lower currency exchange losses resulting from the U.S. dollar strengthening against the Australian dollar, Canadian dollar and British pound during fiscal year 2013 compared to fiscal year 2012.
Provision for Income Taxes
We recognized an income tax provision of $5.5 million for the fiscal year 2013 compared to $9.9 million for the fiscal year 2012. Our effective income tax rate decreased to 18.1% for the fiscal year 2013 increased compared to 34.5% for the fiscal year 2012, which was primarily due to the increase in tax credits.
Quarterly Results of Operations
The following table sets forth our unaudited quarterly consolidated statements of operations data for each of the eight quarters ended July 31, 2014. In management’s opinion, the data below have been prepared on the same basis as the audited consolidated financial statements and reflect all necessary adjustments, consisting only of normal recurring adjustments, necessary for a fair statement of this data. The results of historical periods are not necessarily indicative of the results to be expected for a full year or any future period. The following two tables present our unaudited quarterly consolidated statements of operations data first in dollars and then as a percentage of total revenues for the periods presented.
In the fourth quarter of fiscal 2014, we changed our policy for recognizing stock-based compensation expense from the accelerated attribution method of accounting to the straight-line method of accounting for certain stock-based compensation awards. Comparative quarterly data for prior periods have been adjusted to apply the straight-line method retrospectively. See Note 2 “Change in Accounting Policy - Stock-based Compensation” footnote to the consolidated financial statements included in this Annual Report on Form 10-K for further information.
42
Fiscal quarters ended | |||||||||||||||||||||||||||||||
July 31, 2014 | April 30, 2014 | January 31, 2014 | October 31, 2013 | July 31, 2013 | April 30, 2013 | January 31, 2013 | October 31, 2012 | ||||||||||||||||||||||||
(unaudited) (in thousands, except per share amounts) | |||||||||||||||||||||||||||||||
Revenues: | |||||||||||||||||||||||||||||||
License | $ | 65,909 | $ | 31,927 | $ | 35,215 | $ | 18,870 | $ | 49,078 | $ | 22,918 | $ | 30,752 | $ | 20,812 | |||||||||||||||
Maintenance | 11,919 | 10,440 | 9,890 | 9,639 | 9,871 | 9,110 | 9,210 | 9,370 | |||||||||||||||||||||||
Services | 40,379 | 39,668 | 38,370 | 38,020 | 37,961 | 36,222 | 32,226 | 33,119 | |||||||||||||||||||||||
Total revenues | 118,207 | 82,035 | 83,475 | 66,529 | 96,910 | 68,250 | 72,188 | 63,301 | |||||||||||||||||||||||
Cost of revenues: (1) | |||||||||||||||||||||||||||||||
License | 1,154 | 849 | 1,593 | 846 | 484 | 139 | 130 | 167 | |||||||||||||||||||||||
Maintenance | 2,301 | 2,133 | 1,902 | 1,782 | 2,096 | 1,980 | 1,670 | 1,470 | |||||||||||||||||||||||
Services | 35,193 | 33,293 | 32,672 | 35,229 | 32,873 | 32,437 | 27,731 | 24,474 | |||||||||||||||||||||||
Total cost of revenues (2) | 38,648 | 36,275 | 36,167 | 37,857 | 35,453 | 34,556 | 29,531 | 26,111 | |||||||||||||||||||||||
Gross profit: (1) | |||||||||||||||||||||||||||||||
License | 64,755 | 31,078 | 33,622 | 18,024 | 48,594 | 22,779 | 30,622 | 20,645 | |||||||||||||||||||||||
Maintenance | 9,618 | 8,307 | 7,988 | 7,857 | 7,775 | 7,130 | 7,540 | 7,900 | |||||||||||||||||||||||
Services | 5,186 | 6,375 | 5,698 | 2,791 | 5,088 | 3,785 | 4,495 | 8,645 | |||||||||||||||||||||||
Total gross profit | 79,559 | 45,760 | 47,308 | 28,672 | 61,457 | 33,694 | 42,657 | 37,190 | |||||||||||||||||||||||
Operating expenses: (1) | |||||||||||||||||||||||||||||||
Research and development (2) | 21,365 | 19,761 | 17,525 | 17,527 | 18,311 | 16,163 | 14,762 | 13,755 | |||||||||||||||||||||||
Sales and marketing (2) | 21,609 | 16,735 | 17,278 | 15,673 | 15,783 | 12,155 | 11,473 | 11,537 | |||||||||||||||||||||||
General and administrative (2) | 10,164 | 9,117 | 8,024 | 8,099 | 8,231 | 7,575 | 7,296 | 8,218 | |||||||||||||||||||||||
Total operating expenses | 53,138 | 45,613 | 42,827 | 41,299 | 42,325 | 35,893 | 33,531 | 33,510 | |||||||||||||||||||||||
Income (loss) from operations | 26,421 | 147 | 4,481 | (12,627 | ) | 19,132 | (2,199 | ) | 9,126 | 3,680 | |||||||||||||||||||||
Interest income, net | 431 | 415 | 346 | 158 | 139 | 137 | 132 | 90 | |||||||||||||||||||||||
Other income (expenses), net | 2 | 115 | (58 | ) | 115 | (31 | ) | (246 | ) | 27 | 136 | ||||||||||||||||||||
Income (loss) before provision for (benefit from) income taxes (1) | 26,854 | 677 | 4,769 | (12,354 | ) | 19,240 | (2,308 | ) | 9,285 | 3,906 | |||||||||||||||||||||
Provision for (benefit from) income taxes (1) | 7,097 | 2,590 | 1,437 | (5,899 | ) | 5,406 | (2,596 | ) | 6,073 | (3,418 | ) | ||||||||||||||||||||
Net income (loss) (1) | $ | 19,757 | $ | (1,913 | ) | $ | 3,332 | $ | (6,455 | ) | $ | 13,834 | $ | 288 | $ | 3,212 | $ | 7,324 | |||||||||||||
Basic net income (loss) per share (1) | $ | 0.29 | $ | (0.03 | ) | $ | 0.05 | $ | (0.11 | ) | $ | 0.24 | $ | 0.01 | $ | 0.06 | $ | 0.13 | |||||||||||||
Diluted net income (loss) per share (1) | $ | 0.28 | $ | (0.03 | ) | $ | 0.05 | $ | (0.11 | ) | $ | 0.22 | $ | — | $ | 0.05 | $ | 0.12 | |||||||||||||
(1) | See Note 2 “Change in Accounting Policy - Stock-Based Compensation” of Notes to Consolidated Financial Statements. |
43
(2) | Includes stock-based compensation as follows: |
Fiscal quarters ended | |||||||||||||||||||||||||||||||
July 31, 2014 | April 30, 2014 | January 31, 2014 | October 31, 2013 | July 31, 2013 | April 30, 2013 | January 31, 2013 | October 31, 2012 | ||||||||||||||||||||||||
(unaudited) (in thousands) | |||||||||||||||||||||||||||||||
Stock based compensation expenses: (1) | |||||||||||||||||||||||||||||||
Cost of license revenues | $ | 43 | $ | 45 | $ | 51 | $ | 45 | $ | — | $ | — | $ | — | $ | — | |||||||||||||||
Cost of maintenance revenues | 225 | 211 | 201 | 160 | 218 | 216 | 225 | 171 | |||||||||||||||||||||||
Cost of services revenues | 3,067 | 3,028 | 3,120 | 2,714 | 2,049 | 1,829 | 1,735 | 1,297 | |||||||||||||||||||||||
Research and development | 2,351 | 2,260 | 2,402 | 1,995 | 2,066 | 1,374 | 1,345 | 1,058 | |||||||||||||||||||||||
Marketing and sales | 2,604 | 2,291 | 3,790 | 2,059 | 880 | 913 | 1,047 | 832 | |||||||||||||||||||||||
General and administrative | 2,556 | 2,532 | 2,575 | 2,213 | 1,811 | 1,778 | 1,976 | 2,685 | |||||||||||||||||||||||
Total stock-based compensation expenses | $ | 10,846 | $ | 10,367 | $ | 12,139 | $ | 9,186 | $ | 7,024 | $ | 6,110 | $ | 6,328 | $ | 6,043 | |||||||||||||||
(1) See Note 2 “Change in Accounting Policy - Stock-Based Compensation” of Notes to Consolidated Financial Statements.
The impact of this accounting policy change revised our previously reported information by the following (in thousands, except per share amounts):
Fiscal quarters ended | |||||||||||||||||||||||||||
April 30, 2014 | January 31, 2014 | October 31, 2013 | July 31, 2013 | April 30, 2013 | January 31, 2013 | October 31, 2012 | |||||||||||||||||||||
(unaudited) (in thousands, except share amounts) | |||||||||||||||||||||||||||
Cost of license revenue | $ | 4 | $ | (53 | ) | $ | (57 | ) | $ | — | $ | — | $ | — | $ | — | |||||||||||
Cost of maintenance revenue | (105 | ) | (149 | ) | (121 | ) | (87 | ) | (99 | ) | (117 | ) | (94 | ) | |||||||||||||
Cost of services revenue | (966 | ) | (2,352 | ) | (1,885 | ) | (1,266 | ) | (1,337 | ) | (1,740 | ) | (1,352 | ) | |||||||||||||
Research and development | (873 | ) | (1,535 | ) | (1,223 | ) | (532 | ) | (691 | ) | (1,123 | ) | (1,009 | ) | |||||||||||||
Sales and marketing | (1,233 | ) | (1,491 | ) | (1,461 | ) | (838 | ) | 240 | (916 | ) | (839 | ) | ||||||||||||||
General and administrative | (372 | ) | (1,189 | ) | (766 | ) | (221 | ) | (276 | ) | (149 | ) | (448 | ) | |||||||||||||
Income before provision for income taxes | 3,470 | 6,733 | 5,424 | 2,940 | 2,185 | 4,049 | 3,737 | ||||||||||||||||||||
Provision for (benefit from) income taxes | 4,025 | 2,509 | 1,264 | 1,211 | (773 | ) | 6,338 | (3,140 | ) | ||||||||||||||||||
Net income (loss) | (555 | ) | 4,224 | 4,160 | 1,729 | 2,958 | (2,289 | ) | 6,877 | ||||||||||||||||||
Basic net income (loss) per share | $ | (0.01 | ) | $ | 0.06 | $ | 0.07 | $ | 0.03 | $ | 0.06 | $ | (0.04 | ) | $ | 0.12 | |||||||||||
Diluted net income (loss) per share | $ | (0.01 | ) | $ | 0.06 | $ | 0.07 | $ | 0.03 | $ | 0.05 | $ | (0.04 | ) | $ | 0.11 | |||||||||||
44
Fiscal quarters ended | |||||||||||||||||||||||
July 31, 2014 | April 30, 2014 | January 31, 2014 | October 31, 2013 | July 31, 2013 | April 30, 2013 | January 31, 2013 | October 31, 2012 | ||||||||||||||||
(unaudited) | |||||||||||||||||||||||
(percentage of total revenues) | |||||||||||||||||||||||
Revenues: | |||||||||||||||||||||||
License | 56 | % | 39 | % | 42 | % | 28 | % | 51 | % | 34 | % | 42 | % | 33 | % | |||||||
Maintenance | 10 | 13 | 12 | 15 | 10 | 13 | 13 | 15 | |||||||||||||||
Services | 34 | 48 | 46 | 57 | 39 | 53 | 45 | 52 | |||||||||||||||
Total revenues | 100 | 100 | 100 | 100 | 100 | 100 | 100 | 100 | |||||||||||||||
Total cost of revenues (1) | 33 | 44 | 43 | 57 | 37 | 51 | 41 | 41 | |||||||||||||||
Total gross profit (1) (2) | 67 | 56 | 57 | 43 | 63 | 49 | 59 | 59 | |||||||||||||||
Operating expenses: (1) | |||||||||||||||||||||||
Research and development | 18 | 24 | 21 | 26 | 19 | 24 | 20 | 22 | |||||||||||||||
Sales and marketing | 18 | 21 | 21 | 24 | 16 | 18 | 16 | 18 | |||||||||||||||
General and administrative | 9 | 11 | 9 | 12 | 8 | 11 | 10 | 13 | |||||||||||||||
Total operating expenses | 45 | 56 | 51 | 62 | 43 | 53 | 46 | 53 | |||||||||||||||
Income (loss) from operations | 22 | — | 6 | (19 | ) | 20 | (4 | ) | 13 | 6 | |||||||||||||
Interest income, net | — | 1 | — | — | — | — | — | — | |||||||||||||||
Other income (expenses), net | — | — | — | — | — | — | — | — | |||||||||||||||
Income (loss) before provision for (benefit from) income taxes (1) | 22 | 1 | 6 | (19 | ) | 20 | (4 | ) | 13 | 6 | |||||||||||||
Provision for (benefit from) income taxes (1) | 6 | 3 | 2 | (9 | ) | 6 | (4 | ) | 8 | (5 | ) | ||||||||||||
Net income (loss) (1) | 16 | % | (2 | )% | 4 | % | (10 | )% | 14 | % | — | % | 5 | % | 11 | % | |||||||
(1) | See Note 2 “Change in Accounting Policy - Stock-Based Compensation” of Notes to Consolidated Financial Statements. |
(2) | The table below shows gross profit as a percentage of each component of revenues, referred to as gross margin: |
Fiscal quarters ended | |||||||||||||||||||||||
July 31, 2014 | April 30, 2014 | January 31, 2014 | October 31, 2013 | July 31, 2013 | April 30, 2013 | January 31, 2013 | October 31, 2012 | ||||||||||||||||
(unaudited) (gross margin by component of revenues) | |||||||||||||||||||||||
Gross margin (1) | |||||||||||||||||||||||
License | 98 | % | 97 | % | 95 | % | 96 | % | 99 | % | 99 | % | 100 | % | 99 | % | |||||||
Maintenance | 81 | 80 | 81 | 82 | 79 | 78 | 82 | 84 | |||||||||||||||
Services | 13 | 16 | 15 | 7 | 13 | 10 | 14 | 26 | |||||||||||||||
Total gross margin | 67 | % | 56 | % | 57 | % | 43 | % | 63 | % | 49 | % | 59 | % | 59 | % | |||||||
(1) | See Note 2 “Change in Accounting Policy - Stock-Based Compensation” of Notes to Consolidated Financial Statements. |
Quarterly Trends
In general, our year-over-year quarterly revenues have increased as a result of an increase in the number of customers licensed to use our products as well as purchases of additional licenses by our existing customers. We have historically experienced seasonal variations in our revenues as a result of increased customer orders in our second and fourth fiscal quarters and subsequent annual fees and as a result of attainment of revenue recognition criteria related to orders from prior periods. We generally see increased orders in our second fiscal quarter, which is the quarter ended January 31, due to customer buying patterns. We also see increased orders in our fourth fiscal quarter due to efforts by our sales team to achieve annual incentives. Notwithstanding the fact that we generally see increased orders in our second and fourth fiscal quarters, we expect to see additional quarterly revenue fluctuations that may, in some cases, mask these expected seasonal variations. Our quarterly growth in revenues may not match up to new orders we receive in a given quarter. This mismatch is primarily due to the following reasons:
45
• | for the initial year of a multi-year term license, we generally recognize revenues when payment is due and payment may not be due until a subsequent fiscal quarter; |
• | we may enter into license agreements with specified terms for product upgrades or functionality, which may require us to delay revenue recognition for the initial period; and |
• | we may enter into license agreements with other contractual terms that may affect the timing of revenue recognition. |
Our revenue seasonality may fluctuate versus comparable prior periods or prior quarters within the same fiscal year based on when new orders are executed in the quarter and the payment terms of each order. Additionally, our revenue may fluctuate if our customers make an early payment of their annual fees. Our ability to renew existing contracts for multiple year terms versus annual automatic renewals may impact revenue recognition.
We generally charge annual software license fees for our multi-year term licenses and price our licenses based on the amount of direct written premiums (“DWP”) that will be managed by our solutions. However, in rare circumstances, our customers desire the ability to purchase our products on a perpetual license basis, resulting in an acceleration of revenue recognition. Milestone payments in a perpetual license order also cause seasonal variations. Our perpetual license revenues are not consistent from period to period. In addition, a few of our multi-year term licenses provide the customer with the option to purchase a perpetual license at the end of the initial contract term, which we refer to as a perpetual buyout right. The mix of our contract terms for our licenses and the exercise of perpetual buyout rights at the end of the initial contract term by our customers may lead to variability in our results of operations. Increases in perpetual license sales and exercises of perpetual buyout rights by our customers may affect our ability to show consistent growth in license revenues in subsequent periods. Reductions in perpetual licenses in future periods could cause adverse period-to-period comparisons of our financial results.
In addition, because we price our products based on the amount of DWP that will be managed by our solutions, license revenues from each customer may fluctuate up or down based upon insurance policies sold by the customer in the preceding year. If we enter into a new territory, our revenue recognition pattern may change, depending on the contractual terms and local laws and regulations.
Our services revenues are also subject to seasonal fluctuations, though to a lesser degree than our license revenues. Our services revenues are impacted by the number of professional days in a given fiscal quarter. The quarter ended January 31 usually has fewer professional days due to the impact of the Thanksgiving, Christmas and New Year’s holidays. Because we pay our services professionals the same amounts throughout the year, our gross margins on our services revenues are lower in the quarter ended January 31.
Our gross profit in absolute dollars varied from quarter to quarter in the quarters presented. Our cost to maintain our infrastructure is generally fixed within a given quarter. Therefore, when applied against our generally fixed costs, higher revenues in a quarter result in higher overall gross profits.
In most of the quarters presented, our operating expenses increased as a result of an increase in the number of total employees. From July 31, 2012 to July 31, 2014, we added 343 additional employees in order to drive our sales efforts and increase our technical support, services, research and development and administrative personnel to support our growth.
Research and development expenses in absolute dollars increased sequentially in every quarter presented. Increases were primarily a result of increasing headcount to maintain and improve the functionality of our software products. Research and development expenses varied as a percentage of revenues throughout the periods presented primarily due to the timing of revenues recognized but generally increased year-over-year as we continued to invest in our software development. We expect to increase research and development expenses in absolute dollars and as a percentage of revenues on an annual basis as we expect to increase our investment in our software development in our ongoing efforts to ensure we maintain our technology leadership position.
Sales and marketing expenses in absolute dollars varied from quarter-to-quarter in the quarters presented. Increases were primarily a result of increasing headcount in our direct sales teams, as well as increased marketing programs and events and timing of the programs. Sales and marketing expenses as a percentage of revenues varied from quarter-to-quarter primarily due to the timing of revenues recognized, marketing programs and commissions earned and expensed, but increased year-over-year as sales and marketing expenses grew along with our revenues.
General and administrative expenses in absolute dollars varied from quarter-to-quarter in the quarters presented. Increases were primarily a result of increasing headcount to support the growth of our business. General and administrative
46
expenses varied as a percentage of revenues due to the timing of revenues recognized and the timing of professional service fees.
In the first quarter of fiscal 2014, and first and third quarters of fiscal 2013, we recorded an income tax benefit primarily resulting from the reinstatement of federal research and development credits, the benefit from incentive stock option (ISO) tax deductions, and permanent differences related to stock-based compensation.
Our quarterly results of operations may fluctuate significantly due to a variety of factors, many of which are outside of our control, making our results of operations variable and difficult to predict. Such factors include those discussed above and those set forth in “Risk Factors—We may experience quarterly and annual fluctuations in our results of operations due to a number of factors” and “Seasonal and other variations related to our revenue recognition may cause significant fluctuations in our results of operations and cash flows” in item 1A of Part I of this Annual Report on Form 10-K. One or more of these factors may cause our results of operations to vary widely. As such, we believe that our quarterly results of operations may vary significantly in the future and that sequential quarterly comparisons of our results of operations may not be meaningful and should not be relied upon as an indication of future performance.
Liquidity and Capital Resources
Cash flows provided by operating activities were $75.5 million, $32.5 million and $17.1 million during the years ended July 31, 2014, 2013 and 2012, respectively. The year ended July 31, 2012 included the payment by us of a $10.0 million litigation settlement payment. We had capital expenditures of $5.0 million, $9.2 million and $5.6 million for the years ended July 31, 2014, 2013 and 2012, respectively. Our capital expenditures consisted of purchases of property and equipment, primarily consisting of computer hardware, software and leasehold improvements. As of July 31, 2014, 2013 and 2012, we had $148.1 million, $79.8 million and $205.7 million of cash and cash equivalents, respectively, and working capital of $421.0 million, $135.3 million and $169.3 million, respectively.
We experienced positive cash flows from operations during fiscal years 2014, 2013 and 2012. Our cash flows from operations are significantly impacted by timing of invoicing and collections of accounts receivable, annual bonus payment, as well as payments of payroll and other taxes. We expect that we will continue to generate positive cash flows from operations on an annual basis, although this may fluctuate significantly on a quarterly basis. In particular, we typically use more cash during the first fiscal quarter ended October 31, as we generally pay cash bonuses to our employees for the prior fiscal year during that period and pay seasonally higher sales commissions from increased orders in our fourth fiscal quarter. As such, we believe that our existing cash and cash equivalents and sources of liquidity will be sufficient to fund our operations for at least the next 12 months. Our future capital requirements will depend on many factors, including our rate of revenues growth, the expansion of our sales and marketing activities and the timing and extent of our spending to support our research and development efforts and expansion into other markets. We may also seek to invest in, or acquire complementary businesses, applications or technologies.
Cash Flows
The following summary of cash flows for the periods indicated has been derived from our consolidated financial statements included elsewhere in this Annual Report on Form 10-K:
Fiscal years ended July 31, | |||||||||||
2014 | 2013 | 2012 | |||||||||
(in thousands) | |||||||||||
Net cash provided by operating activities | $ | 75,491 | $ | 32,547 | $ | 17,094 | |||||
Net cash used in investing activities | (380,420 | ) | (148,913 | ) | (3,296 | ) | |||||
Net cash provided by (used in) financing activities | 372,564 | (8,621 | ) | 133,007 | |||||||
Cash Flows from Operating Activities
Net cash provided by operating activities increased in fiscal year 2014 from fiscal year 2013 primarily due to larger adjustments for non-cash items consisting of $17.0 million from stock-based compensation expenses, other non-cash items of $3.0 million, and $1.9 million from depreciation and amortization. These increases were partially offset by a decrease in net income of $9.9 million and adjustments for non-cash items of $4.5 million from excess tax benefits related to the exercise of stock options and $2.4 million from deferred taxes. Changes in assets and liabilities provided additional cash of $37.8 million due to increases in deferred revenues of $28.2 million, accounts payable, accruals and other liabilities of $9.1 million, and an increase in assets of $0.5 million in the fiscal year 2014 compared to fiscal year 2013.
47
Net cash provided by operating activities increased in fiscal year 2013 from fiscal year 2012 primarily due to a $6.0 million increase in net income, a $12.6 million increase in stock-based compensation expenses, $1.9 million from depreciation and amortization, and other non-cash items of $0.5 million. These increases were partially offset by increases in deferred tax assets of $7.5 million in fiscal year 2013, whereas deferred tax assets were being utilized in fiscal year 2012. Additionally, excess tax benefits increased by $2.1 million in fiscal year 2013 compared to fiscal year 2012. Changes in assets and liabilities provided additional cash of $4.0 million due to increases in deferred revenues of $3.7 million, and an increase of $0.6 million in accounts receivable and prepaid expenses, offset by a decrease of $0.3 million in accounts payable, accruals and other liabilities.
Cash Flows from Investing Activities
Our investing activities consist primarily of purchase and sales of short-term and long-term investments, capital expenditures to purchase property and equipment, and changes in our restricted cash. In the future, we expect we will continue to invest in capital expenditures to support our expanding operations.
Cash used in investing activities increased by $231.5 million in fiscal year 2014 from fiscal year 2013 primarily due to the investment of excess cash into available-for-sale securities from our stock issuance in October 2013, through net purchases of available-for-sale securities of $246.8 million. The increase was offset by the absence of a business acquisition in fiscal 2014 of $14.6 and decrease in capital expenditures of $4.2 million. The prior year included the release of restricted cash related to secured lines of credit for $3.5 million.
Net cash used in investing activities increased in fiscal year 2013 from fiscal year 2012 primarily due to the investment of excess cash after our IPO. Net purchases of available-for-sale securities were $128.5 million. Additionally, fiscal year 2013 included the acquisition of Millbrook, Inc. for $14.7 million and an increase in capital expenditures driven by the final payments related to our headquarters move which were accrued as of July 31, 2012.
Cash Flows from Financing Activities
Our financing activities consist primarily of cash receipts from the exercise of stock options, payments of taxes withheld from vesting of RSUs and excess tax benefits realized on the exercise or release of each of these items. In fiscal year 2014 and 2012, we received net inflows of cash from financing activities related to public offerings.
Net cash provided by financing activities increased by $381.2 million in fiscal year 2014 from fiscal year 2013 due to our follow-on offering of common stock for $389.5 million in net proceeds, after deducting underwriters’ discounts and commissions and $4.5 million increase in excess tax benefit from exercise of stock options and vesting of RSUs. These proceeds were offset by a $12.5 million increase in taxes remitted related to the vesting of RSUs held by employees. Additionally, proceeds from stock options exercises decreased by $0.3 million as we have granted more RSUs than stock options in recent years to employees.
Net cash from financing activities decreased from cash provided by financing activities to net cash used in financing activities. This was primarily due to the receipt of $143.4 million of proceeds from our IPO and follow-on public offering in fiscal year 2012, which was partially offset by $3.5 million of costs paid in connection with these offerings. In addition, fiscal year 2013 payments of taxes related to RSUs vesting increased by $7.9 million. These decreases of cash were partially offset by $4.1 million of increased proceeds from option exercises, and $2.1 million of excess tax benefits recognized related to our stock-based compensation transactions.
Anticipated Cash Flows
We believe our existing cash, cash equivalents and investment balances, together with anticipated cash flows from operations, should be sufficient to meet our working capital and operating resource requirements for at least the next twelve months. After the next twelve months, we may find it necessary to obtain additional funds. In the event additional funds are required, we may not be able to obtain additional financing on favorable terms or at all.
Contractual Obligations
The following summarizes our contractual obligations as of July 31, 2014:
48
Payments due by period | |||||||||||||||||||
Less than 1 year | 1 to 3 years | 3 to 5 years | More than 5 years | Total | |||||||||||||||
(in thousands) | |||||||||||||||||||
Operating lease obligations (1) | $ | 5,786 | $ | 11,545 | $ | 10,765 | $ | — | $ | 28,096 | |||||||||
Royalty obligations (2) | 398 | 577 | 110 | — | 1,085 | ||||||||||||||
Purchase commitments (3) | 6,141 | 1,865 | — | — | 8,006 | ||||||||||||||
Total | $ | 12,325 | $ | 13,987 | $ | 10,875 | $ | — | $ | 37,187 | |||||||||
(1) | Operating lease agreements primarily represent our obligations to make payments under our non-cancellable lease agreements for our corporate headquarters and offices through 2019. |
(2) | Royalty obligations primarily represent our obligations under our non-cancellable agreements related to certain revenue-generating agreements. |
(3) | Purchase commitments consist of agreements to purchase services, entered into in the ordinary course of business. These represent non-cancellable commitments for which a penalty would be imposed if the agreement was canceled for any reason other than an event of default as described by the agreement. |
As of July 31, 2014, we had unrecognized tax benefits of $8.0 million associated with our U.S. federal and California research and development tax credits. We are unable to estimate when any cash settlement with a taxing authority might occur.
Off-Balance Sheet Arrangements
Through July 31, 2014, we did not have any relationships with unconsolidated entities or financial partnerships, such as entities often referred to as structured finance or special purpose entities, which would have been established for the purpose of facilitating off-balance sheet arrangements or other contractually narrow or limited purposes.
Item 7A. Quantitative and Qualitative Disclosures about Market Risk
We are exposed to market risks in the ordinary course of our business. Market risk represents the risk of loss that may impact our financial position due to adverse changes in financial market prices and rates. Our market risk exposure is primarily a result of fluctuations in interest rates and foreign currency exchange rates. We do not hold or issue financial instruments for trading purposes.
Interest Rate Sensitivity
Our exposure to market risk for changes in interest rates relates primarily to our cash, cash equivalents, and investments as of July 31, 2014, and 2013. Our cash, cash equivalents, and investments as of July 31, 2014, and 2013 were $647.8 million and $207.7 million, respectively, and consisted primarily of cash, corporate bonds, U. S. agency debt securities, commercial paper, money market funds, and municipal debt securities. Our primary exposure to market risk is interest income sensitivity, which is affected by changes in the general level of the interest rates in the United States. However, because of the short-term nature of our interest-bearing securities, a ten percent change in market interest rates would not be expected to have a material impact on our consolidated financial condition or results of operations.
Foreign Currency Exchange Risk
Our results of operations and cash flows are subject to fluctuations due to changes in foreign currency exchange rates, particularly changes in the Canadian dollar, Australian dollar, Euro, British pound and Japanese yen. The volatility of exchange rates depends on many factors that we cannot forecast with reliable accuracy. We believe our operating activities act as a natural hedge for a substantial portion of our foreign currency exposure because we typically collect revenues and incur costs in the currency in the location in which we provide our application. Although we have experienced and will continue to experience fluctuations in our net income (loss) as a result of transaction gains (losses) related to transactions denominated in currencies other than the U.S. dollar, we believe that a 10% change in foreign exchange rates would not have a material impact on our results of operations. As our international operations grow, we will continue to reassess our approach to manage our risk relating to fluctuations in currency rates.
49
Item 8. | Financial Statements and Supplemental Data |
GUIDEWIRE SOFTWARE, INC. AND SUBSIDIARIES
INDEX TO CONSOLIDATED FINANCIAL STATEMENTS
The supplementary financial information required by this Item 8 is included in Item 7 under the caption “Quarterly Results of Operations.”
50
Report of Independent Registered Public Accounting Firm
The Board of Directors and Stockholders
Guidewire Software, Inc.:
We have audited the accompanying consolidated balance sheets of Guidewire Software, Inc. and subsidiaries (the Company) as of July 31, 2014 and 2013, and the related consolidated statements of income, comprehensive income, stockholders’ equity, and cash flows for each of the years in the three-year period ended July 31, 2014. We also have audited the Company’s internal control over financial reporting as of July 31, 2014, based on criteria established in Internal Control — Integrated Framework (1992) issued by the Committee of Sponsoring Organizations of the Treadway Commission (COSO). The Company’s management is responsible for these consolidated financial statements, for maintaining effective internal control over financial reporting, and for its assessment of the effectiveness of internal control over financial reporting, included in Item 9A. Our responsibility is to express an opinion on these consolidated financial statements and an opinion on the Company’s internal control over financial reporting based on our audits.
We conducted our audits in accordance with the standards of the Public Company Accounting Oversight Board (United States). Those standards require that we plan and perform the audits to obtain reasonable assurance about whether the financial statements are free of material misstatement and whether effective internal control over financial reporting was maintained in all material respects. Our audits of the consolidated financial statements included examining, on a test basis, evidence supporting the amounts and disclosures in the financial statements, assessing the accounting principles used and significant estimates made by management, and evaluating the overall financial statement presentation. Our audit of internal control over financial reporting included obtaining an understanding of internal control over financial reporting, assessing the risk that a material weakness exists, and testing and evaluating the design and operating effectiveness of internal control based on the assessed risk. Our audits also included performing such other procedures as we considered necessary in the circumstances. We believe that our audits provide a reasonable basis for our opinions.
A company’s internal control over financial reporting is a process designed to provide reasonable assurance regarding the reliability of financial reporting and the preparation of financial statements for external purposes in accordance with generally accepted accounting principles. A company’s internal control over financial reporting includes those policies and procedures that (1) pertain to the maintenance of records that, in reasonable detail, accurately and fairly reflect the transactions and dispositions of the assets of the company; (2) provide reasonable assurance that transactions are recorded as necessary to permit preparation of financial statements in accordance with generally accepted accounting principles, and that receipts and expenditures of the company are being made only in accordance with authorizations of management and directors of the company; and (3) provide reasonable assurance regarding prevention or timely detection of unauthorized acquisition, use, or disposition of the company’s assets that could have a material effect on the financial statements.
Because of its inherent limitations, internal control over financial reporting may not prevent or detect misstatements. Also, projections of any evaluation of effectiveness to future periods are subject to the risk that controls may become inadequate because of changes in conditions, or that the degree of compliance with the policies or procedures may deteriorate.
In our opinion, the consolidated financial statements referred to above present fairly, in all material respects, the financial position of Guidewire Software, Inc. and subsidiaries as of July 31, 2014 and 2013, and the results of their operations and their cash flows for each of the years in the three-year period ended July 31, 2014, in conformity with U.S. generally accepted accounting principles. Also in our opinion, the Company maintained, in all material respects, effective internal control over financial reporting as of July 31, 2014, based on criteria established in Internal Control — Integrated Framework (1992) issued by COSO.
As discussed in Note 2 to the consolidated financial statements, in the year ended July 31, 2014, the Company has elected to change its method of accounting for recognizing stock-based compensation expense.
/s/ KPMG LLP
Santa Clara, California
September 17, 2014
51
GUIDEWIRE SOFTWARE, INC. AND SUBSIDIARIES
CONSOLIDATED BALANCE SHEETS
(in thousands, except for share data)
July 31, 2014 | July 31, 2013 | ||||||
ASSETS | |||||||
CURRENT ASSETS: | |||||||
Cash and cash equivalents | $ | 148,101 | $ | 79,767 | |||
Short-term investments | 296,231 | 76,932 | |||||
Accounts receivable | 49,839 | 40,885 | |||||
Deferred tax assets, current | 11,431 | 2,897 | |||||
Prepaid expenses and other current assets | 10,828 | 9,612 | |||||
Total current assets | 516,430 | 210,093 | |||||
Long-term investments | 203,449 | 51,040 | |||||
Property and equipment, net | 12,607 | 12,914 | |||||
Intangible assets, net | 5,439 | 6,879 | |||||
Deferred tax assets, noncurrent (1) | 8,681 | 14,494 | |||||
Goodwill | 9,205 | 9,048 | |||||
Other assets | 1,416 | 1,205 | |||||
TOTAL ASSETS | $ | 757,227 | $ | 305,673 | |||
LIABILITIES AND STOCKHOLDERS’ EQUITY | |||||||
CURRENT LIABILITIES: | |||||||
Accounts payable | $ | 7,030 | $ | 6,517 | |||
Accrued employee compensation | 34,912 | 26,302 | |||||
Deferred revenues, current | 48,937 | 37,351 | |||||
Other current liabilities | 4,507 | 4,614 | |||||
Total current liabilities | 95,386 | 74,784 | |||||
Deferred revenues, noncurrent | 6,395 | 3,845 | |||||
Other liabilities | 4,760 | 5,212 | |||||
Total liabilities | 106,541 | 83,841 | |||||
Commitments and contingencies (Note 6) | |||||||
STOCKHOLDERS’ EQUITY: | |||||||
Common stock, par value $0.0001 per share—500,000,000 shares authorized as of July 31, 2014 and 2013, respectively; 69,082,261 and 57,909,277 shares issued and outstanding as of July 31, 2014 and 2013, respectively | 7 | 6 | |||||
Additional paid-in capital (1) | 629,076 | 215,151 | |||||
Accumulated other comprehensive loss | (1,367 | ) | (1,574 | ) | |||
Retained earnings (1) | 22,970 | 8,249 | |||||
Total stockholders’ equity | 650,686 | 221,832 | |||||
TOTAL LIABILITIES AND STOCKHOLDERS’ EQUITY | $ | 757,227 | $ | 305,673 | |||
(1) | See Note 2 “Change in Accounting Policy - Stock-Based Compensation” of Notes to Consolidated Financial Statements. |
See accompanying Notes to Consolidated Financial Statements.
52
GUIDEWIRE SOFTWARE, INC. AND SUBSIDIARIES
CONSOLIDATED STATEMENTS OF INCOME
(in thousands, except share and per share amounts)
Fiscal years ended July 31, | |||||||||||
2014 | 2013 | 2012 | |||||||||
Revenues: | |||||||||||
License | $ | 151,921 | $ | 123,560 | $ | 97,136 | |||||
Maintenance | 41,888 | 37,561 | 29,538 | ||||||||
Services | 156,437 | 139,528 | 105,387 | ||||||||
Total revenues | 350,246 | 300,649 | 232,061 | ||||||||
Cost of revenues: (1) | |||||||||||
License | 4,442 | 920 | 762 | ||||||||
Maintenance | 8,118 | 7,216 | 5,193 | ||||||||
Services | 136,387 | 117,515 | 84,050 | ||||||||
Total cost of revenues | 148,947 | 125,651 | 90,005 | ||||||||
Gross profit: (1) | |||||||||||
License | 147,479 | 122,640 | 96,374 | ||||||||
Maintenance | 33,770 | 30,345 | 24,345 | ||||||||
Services | 20,050 | 22,013 | 21,337 | ||||||||
Total gross profit | 201,299 | 174,998 | 142,056 | ||||||||
Operating expenses: (1) | |||||||||||
Research and development | 76,178 | 62,991 | 49,056 | ||||||||
Sales and marketing | 71,295 | 50,948 | 36,781 | ||||||||
General and administrative | 35,404 | 31,320 | 27,285 | ||||||||
Total operating expenses | 182,877 | 145,259 | 113,122 | ||||||||
Income from operations | 18,422 | 29,739 | 28,934 | ||||||||
Interest income, net | 1,350 | 498 | 308 | ||||||||
Other income (expenses), net | 174 | (114 | ) | (726 | ) | ||||||
Income before provision for income taxes (1) | 19,946 | 30,123 | 28,516 | ||||||||
Provision for income taxes (1) | 5,225 | 5,465 | 9,852 | ||||||||
Net income (1) | $ | 14,721 | $ | 24,658 | $ | 18,664 | |||||
Earnings per share: (1) | |||||||||||
Basic | $ | 0.22 | $ | 0.44 | $ | 0.36 | |||||
Diluted | $ | 0.21 | $ | 0.40 | $ | 0.32 | |||||
Shares used in computing earnings per share: (1) | |||||||||||
Basic | 65,748,896 | 56,331,018 | 34,774,983 | ||||||||
Diluted | 69,112,733 | 61,569,195 | 41,759,338 | ||||||||
(1) | See Note 2 “Change in Accounting Policy - Stock-Based Compensation” of Notes to Consolidated Financial Statements. |
See accompanying Notes to Consolidated Financial Statements.
53
GUIDEWIRE SOFTWARE, INC. AND SUBSIDIARIES
CONSOLIDATED STATEMENTS OF COMPREHENSIVE INCOME
(in thousands)
Fiscal years ended July 31, | |||||||||||
2014 | 2013 | 2012 | |||||||||
Net income (1) | $ | 14,721 | $ | 24,658 | $ | 18,664 | |||||
Other comprehensive income (loss): | |||||||||||
Foreign currency translation adjustments | 288 | (1,102 | ) | (287 | ) | ||||||
Unrealized (loss) gain on available-for-sale securities, net of tax expense (benefit) of $(7), $0 and $0 | (42 | ) | 24 | — | |||||||
Reclassification adjustment for gains included in net income | (39 | ) | — | — | |||||||
Other comprehensive income (loss) | 207 | (1,078 | ) | (287 | ) | ||||||
Comprehensive income | $ | 14,928 | $ | 23,580 | $ | 18,377 | |||||
(1) | See Note 2 “Change in Accounting Policy - Stock-Based Compensation” of Notes to Consolidated Financial Statements. |
See accompanying Notes to Consolidated Financial Statements.
54
GUIDEWIRE SOFTWARE, INC. AND SUBSIDIARIES
CONSOLIDATED STATEMENTS OF STOCKHOLDERS’ EQUITY
(in thousands, except share amounts)
Convertible preferred stock | Common stock | Additional paid-in capital | Accumulated other comprehensive income (loss) | Retained Earnings (Accumulated deficit) | Total stockholders’ equity | ||||||||||||||||||||||||
Shares | Amount | Shares | Amount | ||||||||||||||||||||||||||
Balance as of July 31, 2011 (1) | 25,357,721 | $ | 36,500 | 14,422,557 | $ | 1 | $ | 15,842 | $ | (209 | ) | $ | (35,073 | ) | $ | 17,061 | |||||||||||||
Proceeds from issuance of common stock in connection with public offerings, net of underwriting discounts and commission | — | — | 10,927,500 | 1 | 143,385 | — | — | 143,386 | |||||||||||||||||||||
Costs incurred in connection with public offerings | — | — | — | — | (3,502 | ) | — | — | (3,502 | ) | |||||||||||||||||||
Conversion of preferred stock to common stock | (25,357,721 | ) | (36,500 | ) | 25,357,721 | 3 | 36,497 | — | — | — | |||||||||||||||||||
Issuance of common stock upon exercise of stock options | — | — | 2,211,967 | — | 5,067 | — | — | 5,067 | |||||||||||||||||||||
Issuance of common stock upon RSU release, net of shares withheld for taxes | — | — | 1,018,228 | — | (12,798 | ) | — | — | (12,798 | ) | |||||||||||||||||||
Repurchase of unvested common stock | — | — | (3,005 | ) | — | — | — | — | — | ||||||||||||||||||||
Conversion of warrants to common stock | — | — | 21,640 | — | — | — | — | — | |||||||||||||||||||||
Stock-based compensation | — | — | — | — | 12,923 | — | — | 12,923 | |||||||||||||||||||||
Tax benefit from the exercise of stock options and vesting of RSUs | — | — | — | — | 486 | — | — | 486 | |||||||||||||||||||||
Net income | — | — | — | — | — | — | 18,664 | 18,664 | |||||||||||||||||||||
Foreign currency translation adjustment | — | — | — | — | — | (287 | ) | — | (287 | ) | |||||||||||||||||||
Balance as of July 31, 2012 | — | — | 53,956,608 | 5 | 197,900 | (496 | ) | (16,409 | ) | 181,000 | |||||||||||||||||||
Issuance of common stock upon exercise of stock options | — | — | 2,904,248 | 1 | 9,123 | — | — | 9,124 | |||||||||||||||||||||
Issuance of common stock upon RSU release, net of shares withheld for taxes | — | — | 1,048,421 | — | (19,963 | ) | — | — | (19,963 | ) | |||||||||||||||||||
Stock-based compensation | — | — | — | — | 25,505 | — | — | 25,505 | |||||||||||||||||||||
Tax benefit from the exercise of stock options and vesting of RSUs | — | — | — | — | 2,586 | — | — | 2,586 | |||||||||||||||||||||
Net income | — | — | — | — | — | — | 24,658 | 24,658 | |||||||||||||||||||||
Foreign currency translation adjustment | — | — | — | — | — | (1,102 | ) | — | (1,102 | ) | |||||||||||||||||||
Unrealized gains on available-for-sale securities | — | — | — | — | — | 24 | — | 24 | |||||||||||||||||||||
Balance as of July 31, 2013 | — | — | 57,909,277 | 6 | 215,151 | (1,574 | ) | 8,249 | 221,832 | ||||||||||||||||||||
Proceeds from issuance of common stock in connection with public offering, net of underwriting discounts and commission | — | — | 8,306,291 | 1 | 389,948 | — | — | 389,949 | |||||||||||||||||||||
Costs incurred in connection with public offering | — | — | — | — | (408 | ) | — | — | (408 | ) | |||||||||||||||||||
Issuance of common stock upon exercise of stock options | — | — | 1,579,469 | — | 8,755 | — | — | 8,755 | |||||||||||||||||||||
Issuance of common stock upon RSU release, net of shares withheld for taxes | — | — | 1,287,224 | — | (32,799 | ) | — | — | (32,799 | ) | |||||||||||||||||||
Stock-based compensation | — | — | — | — | 42,538 | — | — | 42,538 | |||||||||||||||||||||
Tax benefit from the exercise of stock options and vesting of RSUs | — | — | — | — | 5,891 | — | — | 5,891 | |||||||||||||||||||||
Net income | — | — | — | — | — | — | 14,721 | 14,721 | |||||||||||||||||||||
Foreign currency translation adjustment | — | — | — | — | — | 288 | — | 288 | |||||||||||||||||||||
Unrealized gains on available-for-sale securities, net of tax | — | — | — | — | — | (42 | ) | — | (42 | ) | |||||||||||||||||||
Reclassification adjustment for gains included in net income | — | — | — | — | — | (39 | ) | — | (39 | ) | |||||||||||||||||||
Balance as of July 31, 2014 | — | $ | — | 69,082,261 | $ | 7 | $ | 629,076 | $ | (1,367 | ) | $ | 22,970 | $ | 650,686 | ||||||||||||||
(1) | See Note 2 “Change in Accounting Policy - Stock-Based Compensation” of Notes to Consolidated Financial Statements. |
See accompanying Notes to Consolidated Financial Statements.
55
GUIDEWIRE SOFTWARE, INC. AND SUBSIDIARIES
CONSOLIDATED STATEMENTS OF CASH FLOWS
(in thousands)
Fiscal years ended July 31, | |||||||||||
2014 | 2013 | 2012 | |||||||||
CASH FLOWS FROM OPERATING ACTIVITIES: | |||||||||||
Net income (1) | $ | 14,721 | $ | 24,658 | $ | 18,664 | |||||
Adjustments to reconcile net income to net cash provided by operating activities: | |||||||||||
Depreciation and amortization | 6,751 | 4,821 | 2,917 | ||||||||
Stock-based compensation (1) | 42,538 | 25,505 | 12,923 | ||||||||
Excess tax benefit from exercise of stock options and vesting of RSUs | (7,067 | ) | (2,586 | ) | (486 | ) | |||||
Deferred taxes (1) | (2,718 | ) | (265 | ) | 7,235 | ||||||
Other noncash items affecting net income | 3,589 | 554 | — | ||||||||
Changes in operating assets and liabilities: | |||||||||||
Accounts receivable | (9,276 | ) | (8,478 | ) | (9,325 | ) | |||||
Prepaid expenses and other assets | (1,372 | ) | (2,690 | ) | (2,442 | ) | |||||
Accounts payable | 393 | 355 | 1,059 | ||||||||
Accrued employee compensation | 8,463 | 147 | 8,244 | ||||||||
Other liabilities | 5,288 | 4,574 | (3,907 | ) | |||||||
Deferred revenues | 14,181 | (14,048 | ) | (17,788 | ) | ||||||
Net cash provided by operating activities | 75,491 | 32,547 | 17,094 | ||||||||
CASH FLOWS FROM INVESTING ACTIVITIES: | |||||||||||
Purchases of available-for-sale securities | (687,419 | ) | (212,035 | ) | — | ||||||
Sales and maturities of available-for-sale securities | 312,149 | 83,567 | — | ||||||||
Acquisition, net of cash acquired | (157 | ) | (14,749 | ) | — | ||||||
Purchase of property and equipment | (4,993 | ) | (9,228 | ) | (5,619 | ) | |||||
Decrease in restricted cash | — | 3,532 | 2,323 | ||||||||
Net cash used in investing activities | (380,420 | ) | (148,913 | ) | (3,296 | ) | |||||
CASH FLOWS FROM FINANCING ACTIVITIES: | |||||||||||
Proceeds from issuance of common stock upon exercise of stock options | 8,755 | 9,123 | 5,067 | ||||||||
Taxes remitted on RSU awards vested | (32,799 | ) | (20,330 | ) | (12,430 | ) | |||||
Proceeds from issuance of common stock in connection with stock offerings, net of underwriting discounts and commission | 389,949 | — | 143,386 | ||||||||
Costs paid in connection with stock offerings | (408 | ) | — | (3,502 | ) | ||||||
Excess tax benefit from exercise of stock options and vesting of RSUs | 7,067 | 2,586 | 486 | ||||||||
Net cash provided by (used in) financing activities | 372,564 | (8,621 | ) | 133,007 | |||||||
Effect of foreign exchange rate changes on cash and cash equivalents | 699 | (964 | ) | (712 | ) | ||||||
NET INCREASE (DECREASE) IN CASH AND CASH EQUIVALENTS | 68,334 | (125,951 | ) | 146,093 | |||||||
CASH AND CASH EQUIVALENTS—BEGINNING OF YEAR | 79,767 | 205,718 | 59,625 | ||||||||
CASH AND CASH EQUIVALENTS—END OF YEAR | $ | 148,101 | $ | 79,767 | $ | 205,718 | |||||
SUPPLEMENTAL DISCLOSURES OF CASH FLOW INFORMATION: | |||||||||||
Cash paid for interest | $ | 4 | $ | — | $ | 7 | |||||
Cash paid for income taxes | $ | 2,141 | $ | 2,266 | $ | 2,058 | |||||
SUPPLEMENTAL DISCLOSURES OF NONCASH FINANCING ACTIVITIES: | |||||||||||
Conversion of convertible preferred stock and warrants into common stock upon initial public offering | $ | — | $ | — | $ | 36,506 | |||||
Accruals for purchase of property and equipment | $ | 768 | $ | 693 | $ | 4,387 | |||||
(1) | See Note 2 “Change in Accounting Policy - Stock-Based Compensation” of Notes to Consolidated Financial Statements. |
See accompanying Notes to Consolidated Financial Statements.
56
GUIDEWIRE SOFTWARE, INC. AND SUBSIDIARIES
NOTES TO CONSOLIDATED FINANCIAL STATEMENTS
1. The Company and Summary of Significant Accounting Policies and Estimates
Business
Guidewire Software, Inc., a Delaware corporation, was incorporated on September 20, 2001. The Company together with its subsidiaries (the “Company”) provides Internet-based software platforms for core insurance operations, including underwriting and policy administration, claim management and billing. The Company’s customers include insurance carriers for property and casualty and workers’ compensation insurance. The Company has wholly-owned subsidiaries in Australia, Canada, China, France, Germany, Hong Kong, Ireland, Italy, Japan, Poland and the United Kingdom.
The Company offers a suite of applications to enable core property and casualty (“P&C”) insurance operations comprised of the following products: PolicyCenter, ClaimCenter and BillingCenter, as well as other newer product initiatives. The Company also provides maintenance support and provides professional services to the extent requested by its customers.
Public Offerings
On January 30, 2012, the Company closed its initial public offering (“IPO”) whereby 10,177,500 shares of common stock were sold to the public, including the underwriters’ full exercise of their overallotment option of 1,327,500 shares of common stock, at a price of $13.00 per share. The Company received aggregate proceeds of approximately $123.0 million from the IPO, including the exercise of the underwriters’ overallotment option, net of underwriters’ discounts and commissions, but before deduction of offering costs of approximately $3.5 million, including $2.8 million of capitalized costs. Upon the closing of the IPO, all shares of the Company’s outstanding convertible preferred stock automatically converted into 25,357,721 shares of common stock. Outstanding warrants to purchase 69,529 shares of convertible preferred stock at $5.03 per share were contractually adjusted to purchase 69,529 shares of common stock at $5.03 per share. Subsequent to the Company’s IPO and during April 2012 all eligible warrants were converted for 21,640 shares of the Company’s common stock and the remainder was canceled.
On April 24, 2012, the Company closed its follow-on public offering of 9,200,000 shares of its common stock, which included 750,000 shares of common stock sold by the Company and 8,450,000 shares of common stock sold by selling stockholders, including the underwriters’ full exercise of their overallotment option from the Company and selling stockholders. The public offering price of the shares sold in the offering was $28.25 per share. The Company received aggregate proceeds of approximately $20.4 million from the follow-on offering, net of underwriters’ discounts and commissions applicable to the sale of shares by the Company, but before deduction of offering costs of approximately $1.0 million payable by the Company, including $0.7 million of capitalized costs. The Company did not receive any proceeds from the sale of shares by the selling stockholders.
On October 28, 2013, the Company closed its follow-on public offering of 8,306,291 shares of its common stock, including the underwriters’ partial exercise of their over-allotment option from the Company. The public offering price of the shares sold in the offering was $48.75 per share. The Company received aggregate proceeds of approximately $389.9 million from the follow-on offering, net of underwriters’ discounts and commissions applicable to the sale of shares by the Company, but before deduction of offering costs of approximately $0.4 million payable by the Company. No shares were sold by the Company’s shareholders in this follow-on public offering.
Basis of Presentation
The consolidated financial statements include the Company and its wholly-owned subsidiaries, and reflect all adjustments (all of which are normal and recurring in nature) that, in the opinion of management, are necessary for a fair presentation of the periods presented. All inter-company balances and transactions have been eliminated in consolidation.
Use of Estimates
The preparation of the accompanying consolidated financial statements in conformity with U.S. GAAP requires management to make estimates and assumptions about future events that affect the amounts of assets and liabilities reported, disclosures about contingent assets and liabilities, and reported amounts of revenues and expenses. Significant items subject to such estimates include revenue recognition, the useful lives of property and equipment, allowance for doubtful accounts, valuation allowance for deferred tax assets, stock-based compensation, annual bonus attainment, income tax uncertainties, valuation of goodwill and intangible assets, and contingencies. These estimates and assumptions are based on management’s best estimates and judgment. Management regularly evaluates its estimates and assumptions using historical experience and other factors; however, actual results could differ significantly from these estimates.
57
Foreign Currency Translation
The functional currency of the Company’s foreign subsidiaries is their respective local currency. The Company translates all assets and liabilities of foreign subsidiaries to U.S. dollars at the current exchange rate as of the applicable consolidated balance sheet date. Revenues and expenses are translated at the average exchange rate prevailing during the period. The effects of foreign currency translations are recorded in accumulated other comprehensive loss as a separate component of stockholders’ deficit in the accompanying consolidated statement of stockholders’ equity. Realized gains and losses from foreign currency transactions are recorded as other income (expense) in the consolidated statements of income.
Cash, Cash Equivalents, Investments and Restricted Cash
Cash and cash equivalents are comprised of cash and highly liquid investments with remaining maturities of 90 days or less at the date of purchase. Cash equivalents consist of commercial paper and money market funds. Restricted cash is held in certificates of deposit pursuant to lease agreements, and, in prior periods, pursuant to secured letter of credit agreements. The Company classifies investments as short-term when they have remaining contractual maturities of less than one year from the balance sheet date, and as long-term when the investments have remaining contractual maturities of more than one year from the balance sheet date. The Company’s investment policy is consistent with the definition of available-for-sale securities. From time to time, the Company may sell certain securities but the objectives are generally not to generate profits on short-term differences in price.
Property and Equipment
Property and equipment are stated at cost less accumulated depreciation and amortization. Depreciation is calculated on a straight-line basis over the estimated useful lives of the assets. Leasehold improvements are amortized over the shorter of the lease term or the estimated useful lives of the related assets. Maintenance and repairs that do not extend the life or improve an asset are expensed in the period incurred.
The estimated useful lives of property and equipment are as follows:
Computer hardware | 3 years | |
Software | 3 years | |
Furniture and fixtures | 3 years | |
Leasehold improvements | Shorter of the lease term or estimated useful life | |
Product Development Costs
Certain software development costs incurred subsequent to the establishment of technological feasibility are subject to capitalization and amortized over the estimated lives of the related products. Technological feasibility is established upon completion of a working model. Through July 31, 2014, costs incurred subsequent to the establishment of technological feasibility have been immaterial, and therefore, all software development costs have been charged to research and development expense in the accompanying consolidated statements of income as incurred.
Impairment of Long-Lived Assets, Intangible Assets and Goodwill
The Company evaluates its long-lived assets, consisting of property and equipment and intangible assets, for indicators of possible impairment when events or changes in circumstances indicate that the carrying amount of certain assets may not be recoverable. Impairment exists if the carrying amounts of such assets exceed the estimates of future net undiscounted cash flows expected to be generated by such assets. Should impairment exist, the impairment loss would be measured based on the excess carrying value of the assets over the estimated fair value of the assets. The Company has not written down any of its long-lived assets as a result of impairment during any of the periods presented.
The Company tests goodwill for impairment annually during the fourth quarter of each fiscal year and in the interim whenever events or changes in circumstances indicate that the carrying amount may be impaired. An entity may first assess qualitative factors to determine whether it is more likely than not (a likelihood of more than 50%) that the fair value of a reporting unit is less than its carrying amount as a basis for determining whether it is necessary to perform the two-step goodwill impairment test.
In performing the qualitative assessment, the Company would consider events and circumstances, including but not limited to, macroeconomic conditions, industry and market considerations, cost factors, overall financial performance, changes in management or key personnel, changes in strategy, changes in customers, changes in the composition or carrying amount of a reporting unit’s net assets and changes in the price of our common stock. If, after assessing the totality of events or
58
circumstances, the Company determines that it is more likely than not that the fair value of a reporting unit is greater than its carrying amount, then the two-step goodwill impairment test is not performed.
If the two-step goodwill test is performed, the Company would evaluate and test our goodwill for impairment at a reporting-unit level using expected future cash flows to be generated by the reporting unit. If the carrying amount of a reporting unit exceeds its fair value, an impairment loss is recognized for any excess of the carrying amount of the reporting unit’s goodwill over the calculated fair value of the goodwill.
The Company acquired goodwill during the fourth quarter of fiscal 2013. The Company did not recognize any goodwill impairment losses in fiscal 2014.
Concentration of Credit Risk
Financial instruments that potentially subject the Company to concentrations of credit risk consist of cash, cash equivalents and accounts receivable. The Company maintains its cash and cash equivalents with high quality financial institutions. The Company is exposed to credit risk for cash held in financial institutions in the event of a default to the extent that such amounts recorded on the balance sheet are in excess of amounts that are insured by the Federal Deposit Insurance Corporation (“FDIC”).
No customer accounted for 10% or more of the Company’s revenues for the years ended July 31, 2014, 2013 and 2012. The Company had one customer that accounted for 10% of total accounts receivable as of July 31, 2014 and 2013, respectively.
Accounts Receivable and Allowance for Doubtful Accounts
The Company performs ongoing credit evaluations of its customers. Accounts receivable are recorded at invoiced amounts, net of the Company’s estimated allowances for doubtful accounts. The allowance for doubtful accounts is estimated based on an assessment of the Company’s ability to collect on customer accounts receivable. The Company regularly reviews the allowance by considering certain factors such as historical experience, industry data, credit quality, age of accounts receivable balances and current economic conditions that may affect a customer’s ability to pay. In cases where the Company is aware of circumstances that may impair a specific purchaser’s ability to meet their financial obligations, the Company records a specific allowance against amounts due from the customer and thereby reduces the net recognized receivable to the amount the Company reasonably believes will be collected. There is judgment involved with estimating the Company’s allowance for doubtful accounts and if the financial condition of its customers were to deteriorate, resulting in their inability to make the required payments, the Company may be required to record additional allowances or charges against revenues. The Company writes-off accounts receivable against the allowance when it determines a balance is uncollectible and no longer actively pursues collection of the receivable. The Company’s accounts receivable are not collateralized by any security. The Company has had no allowance for doubtful accounts or bad debt expense in the periods presented in this Annual Report on Form 10-K.
Revenue Recognition
The Company enters into arrangements to deliver multiple products or services (multiple-elements). The Company applies software revenue recognition rules and allocates the total revenues among elements based on vendor-specific objective evidence (“VSOE”) of fair value of each element. The Company recognizes revenue on a net basis excluding taxes collected from customers and remitted to government authorities.
Revenues are derived from three sources:
(i) | License fees, related to term (or time-based) licenses, perpetual software licenses, and other; |
(ii) | Maintenance fees, related to email and phone support, bug fixes and unspecified software updates and upgrades released when, and if available during the maintenance term; and |
(iii) | Services fees, related to professional services related to implementation of our software, reimbursable travel and training. |
Revenues are recognized when all of the following criteria are met:
• | Persuasive evidence of an arrangement exists. Evidence of an arrangement consists of a written contract signed by both the customer and management prior to the end of the period. |
• | Delivery or performance has occurred. The Company’s software is delivered electronically to the customer. Delivery is considered to have occurred when the Company provides the customer access to the software along with login credentials. |
• | Fees are fixed or determinable. Arrangements where a significant portion of the fee is due beyond 90 days from delivery are not considered to be fixed or determinable. Revenues from such arrangements is recognized as |
59
payments become due, assuming all other revenue recognition criteria have been met. Fees from term licenses are generally due in annual or, in certain cases, quarterly installments over the term of the agreement beginning on the effective date of the license. Accordingly, fees from term licenses are not considered to be fixed or determinable until they become due.
• | Collectability is probable. Collectability is assessed on a customer-by-customer basis, based primarily on creditworthiness as determined by credit checks and analysis, as well as customer payment history. Payment terms generally range from 30 to 90 days from invoice date. If it is determined prior to revenue recognition that collection of an arrangement fee is not probable, revenues are deferred until collection becomes probable or cash is collected, assuming all other revenue recognition criteria are satisfied. |
VSOE of fair value does not exist for the Company’s software licenses; therefore, the Company allocates revenues to software licenses using the residual method. Under the residual method, the amount recognized for license fees is the difference between the total fixed and determinable fees and the VSOE of fair value for the undelivered elements under the arrangement.
The VSOE of fair value for elements of an arrangement is based upon the normal pricing and discounting practices for those elements when sold separately. VSOE of fair value for maintenance is established using the stated maintenance renewal rate in the customer’s contract. The Company generally enters into term licenses ranging from 3 to 7 years. For term licenses with duration of one year or less, no VSOE of fair value for maintenance exists. VSOE of fair value for services is established if a substantial majority of historical stand-alone selling prices for a service fall within a reasonably narrow price range.
If the undelivered elements are all service elements and VSOE of fair value does not exist for one or more service element, the total arrangement fee is recognized ratably over the longest service period starting at software delivery, assuming all the related services have been made available to the customer.
In certain offerings sold as fixed fee arrangements, the Company recognizes services revenues on a proportional performance basis as performance obligations are completed by using the ratio of labor hours to date as an input measure compared to total estimated labor hours for the consulting services.
In cases where professional services are deemed to be essential to the functionality of the software, the arrangement is accounted for using contract accounting until the essential services are complete. If reliable estimates of total project costs can be made, the Company applies the percentage-of-completion method whereby percentage toward completion is measured by using the ratio of service billings to date compared to total estimated service billings for the consulting services. Service billings approximate labor hours as an input measure since they are generally billed monthly on a time and material basis. The fees related to the maintenance are recognized over the period the maintenance is provided.
If reliable estimates of total project costs cannot be made or VSOE for maintenance has not been established and it is reasonably assured that no loss will be incurred under the arrangement, revenues are recognized pursuant to the zero gross margin method. Under this method, revenues recognized are limited to the costs incurred for the implementation services. When zero gross margin method is applied for lack of reliable project estimates and subsequently project estimates become reliable, the Company switches to the percentage-of-completion; resulting in a cumulative effect adjustment for deferred license revenues to the extent of progress toward completion, and the related deferred professional service margin is recognized in full as revenues. Such cumulative effect adjustment for license revenues was zero, $3.2 million and $0.9 million for the fiscal years ended July 31, 2014, 2013 and 2012, respectively, and for service revenues was zero, $1.7 million and $0.9 million for the fiscal years ended July 31, 2014, 2013 and 2012, respectively.
Deferred Revenues
Deferred revenues represent license, maintenance and professional services amounts, which are billed to or collected from customers for which the related revenues have not been recognized. The revenues are deferred when one or more of the revenue recognition criteria have not been met. The current portion of deferred revenues represents the amount that is expected to be recognized as revenues within one year from the balance sheet date. The Company generally invoices fees for licenses and maintenance to its customers in annual or, in certain cases, quarterly installments payable in advance. Accordingly, the deferred revenues balance does not represent the total contract value of annual or multi-year, non-cancellable arrangements.
Sales Commissions
Sales commissions are recognized as an expense when earned by the sales representative, generally occurring at the time the customer order is signed. Substantially all of the effort by the sales force is expended through the time of closing the sale, with limited to no involvement thereafter.
60
Warranties
The Company generally provides a warranty for its software products and services to its customers for periods ranging from 3 to 12 months. The Company’s software products are generally warranted to be free of defects in materials and workmanship under normal use and the products are also generally warranted to substantially perform as described in published documentation. The Company’s services are generally warranted to be performed in a professional manner and to materially conform to the specifications set forth in the related customer contract. In the event there is a failure of such warranties, the Company generally will correct the problem or provide a reasonable workaround or replacement product. If the Company cannot correct the problem or provide a workaround or replacement product, then the customer’s remedy is generally limited to refund of the fees paid for the nonconforming product or services. Warranty expense has been insignificant.
Advertising Costs
Advertising costs are expensed as incurred and amounted to approximately $0.2 million, $0.1 million and $0.1 million during the years ended July 31, 2014, 2013 and 2012, respectively.
Stock-Based Compensation
The Company recognizes compensation expense related to stock options and restricted stock units (“RSUs”) granted to employees based on the estimated fair value of the awards on the date of grant, net of estimated forfeitures. The RSUs are subject to time-based vesting, which generally occurs over a period of four years. The awards expire 10 years from the grant date. The Company estimates the grant date fair value, and the resulting stock-based compensation expense, of the Company’s stock options using the Black-Scholes option-pricing model. The Company recognizes the fair value of stock-based compensation for awards which contain only service conditions on a straight-line basis over the requisite service period, which is generally the vesting period of the respective awards. The Company recognizes the compensation cost for awards which contain performance conditions based upon the probability of that performance condition being met, net of estimated forfeitures, using the graded method. Compensation cost for RSUs is generally recognized over the time-based vesting period.
In the fourth quarter of fiscal 2014, the Company changed its policy for recognizing stock-based compensation expense from the accelerated attribution method of accounting to the straight-line method of accounting for certain share-based compensation awards. Comparative financial statements for prior periods have been adjusted to apply the straight-line method retrospectively. See Note 2 “Change in Accounting Policy - Stock-based Compensation” for further information.
Income Taxes
Income taxes are accounted for under the asset and liability method. Deferred tax assets and liabilities are recognized for the future tax consequences attributable to differences between the financial statement carrying amounts of existing assets and liabilities and their respective tax bases and operating loss and tax credit carryforwards. Deferred tax assets and liabilities are measured using enacted tax rates expected to apply to taxable income in the years in which those temporary differences are expected to be recovered or settled. Deferred tax assets related to excess tax benefits are recorded when utilized. The effect on deferred tax assets and liabilities of a change in tax rates is recognized in income in the period that includes the enactment date. The Company records a valuation allowance to reduce deferred tax assets to an amount of which realization is more likely than not.
Accounting guidance related to accounting for uncertainties in income taxes provides that a tax benefit from an uncertain tax position may be recognized when it is more likely than not that the position will be sustained upon examination, including resolutions of any related appeals or litigation processes, based on the technical merits of the position. This interpretation also provides guidance on measurement, derecognition, classification, interest and penalties, accounting in interim periods, disclosure and transition.
The Company records interest and penalties related to unrecognized tax benefits as income tax expense in its consolidated statement of income.
Recent Accounting Pronouncement
Disclosure of Uncertainties about an Entity’s Ability to Continue as a Going Concern
In August 2014, the Financial Accounting Standards Board (“FASB”) issued Accounting Standards Update (“ASU”) No. 2014-15, Presentation of Financial Statements-Going Concern (Subtopic 205-40). This ASU provides guidance to determine when and how to disclose going-concern uncertainties in the financial statements. The new standard requires management to perform interim and annual assessments of an entity’s ability to continue as a going concern within one year of the date that the financial statements are issued. An entity must provide certain disclosures if conditions or events raise substantial doubt about
61
the entity’s ability to continue as a going concern. The standard will be effective for the Company beginning July 31, 2017. The Company is evaluating the impact of the adoption of this accounting standard update on its consolidated financial statements.
Stock-Based Compensation
In June 2014, the FASB issued ASU No. 2014-12, Accounting for Share-Based Payments When the Terms of an Award Provide That a Performance Target Could Be Achieved after the Requisite Service Period (Topic 718). This ASU provides authoritative guidance for share-based payments with a performance condition that could be achieved after the requisite service period when an employee is eligible to retire or otherwise terminate employment before the end of the period in which the performance target could be achieved and still be eligible. The standard will be effective for the Company beginning August 1, 2016. The Company is evaluating the impact of the adoption of this accounting standard update on its consolidated financial statements.
Revenue from Contracts with Customers
In May 2014, the FASB issued ASU No. 2014-09, Revenue from Contracts with Customers (Topic 606), which provides guidance for revenue recognition. This ASU affects any entity that either enters into contracts with customers to transfer goods or services or enters into contracts for the transfer of non-financial assets. This ASU will supersede the revenue recognition requirements in Topic 605, Revenue Recognition, and most industry-specific guidance. This ASU also supersedes some cost guidance included in Subtopic 605-35, Revenue Recognition-Construction-Type and Production-Type Contracts. The standard will be effective for the Company beginning August 1, 2017. The Company is currently evaluating the impact of the adoption of this accounting standard update on its consolidated financial statements.
Presentation of Unrecognized Tax Benefits
In July 2013, the FASB issued ASU No. 2013-11, Presentation of an Unrecognized Tax Benefit When a Net Operating Loss Carryforward, a Similar Tax Loss, or a Tax Credit Carryforward Exists (Topic 740). This ASU provides authoritative guidance that requires an entity to present an unrecognized tax benefit (“UTB”), or a portion of a UTB, in the financial statements as a reduction to a deferred tax asset for a net operating loss carryforward, a similar tax loss, or a tax credit carryforward, except as follows. To the extent that a net operating loss carryforward, a similar tax loss, or a tax credit carryforward is not available at the reporting date under the tax law of the applicable jurisdiction to settle any additional income taxes that would result from the disallowance of a tax position or the tax law of the applicable jurisdiction does not require the entity to use, and the entity does not intend to use, the deferred tax asset for such purpose, the UTB should be presented in the financial statements as a liability and should not be combined with deferred tax assets. The guidance is effective prospectively for fiscal years and interim reporting periods within those years, beginning after December 15, 2013. The Company does not expect this guidance to have a material impact on its consolidated financial statements.
2. Change in Accounting Policy - Stock-Based Compensation
In the fourth quarter of fiscal 2014, the Company changed its policy for recognizing stock-based compensation expense from the accelerated attribution method of accounting to the straight-line method of accounting for its time-based units (or service-only awards). The Company believes the straight-line method of accounting for stock-based compensation expense for service-only awards better reflects the employees’ pattern of service. The change in accounting method has been retrospectively applied to all prior periods presented herein. Comparative financial statements of prior years have been adjusted to apply the new method retrospectively. As a result of the accounting change, retained earnings increased by $38.5 million at July 31, 2014. The following tables summarize the impact of the change in accounting method on line items in the previously issued consolidated balance sheet as of July 31, 2013, consolidated statements of income for the years ended July 31, 2013, and 2012, and the consolidated statements of cash flows for the years ended July 31, 2013, and 2012.
As of July 31, 2013 | |||||||||
CONSOLIDATED BALANCE SHEET | As previously reported | As adjusted | Effect of change | ||||||
(in thousands) | |||||||||
Deferred tax assets, non-current | 21,091 | 14,494 | (6,597 | ) | |||||
Additional paid-in capital | 237,769 | 215,151 | (22,618 | ) | |||||
Retained earnings (accumulated deficit) | (7,788 | ) | 8,249 | 16,037 | |||||
62
Fiscal years ended July 31, | ||||||||||||||||||||||||
2013 | 2012 | |||||||||||||||||||||||
CONSOLIDATED STATEMENTS OF INCOME | As Previously Reported | As Adjusted | Effect of Change | As Previously Reported | As Adjusted | Effect of Change | ||||||||||||||||||
(in thousands, except share and per share amounts) | ||||||||||||||||||||||||
Cost of maintenance revenue | $ | 7,613 | 7,216 | (397 | ) | $ | 5,288 | $ | 5,193 | $ | (95 | ) | ||||||||||||
Cost of services revenue | 123,210 | 117,515 | (5,695 | ) | 85,360 | 84,050 | (1,310 | ) | ||||||||||||||||
Research and development | 66,346 | 62,991 | (3,355 | ) | 50,462 | 49,056 | (1,406 | ) | ||||||||||||||||
Sales and marketing | 53,301 | 50,948 | (2,353 | ) | 38,254 | 36,781 | (1,473 | ) | ||||||||||||||||
General and administrative | 32,414 | 31,320 | (1,094 | ) | 28,336 | 27,285 | (1,051 | ) | ||||||||||||||||
Income before provision for income taxes | 17,212 | 30,123 | 12,911 | 23,179 | 28,516 | 5,337 | ||||||||||||||||||
Provision for income taxes | 1,829 | 5,465 | 3,636 | 7,979 | 9,852 | 1,873 | ||||||||||||||||||
Net income | $ | 15,383 | $ | 24,658 | $ | 9,275 | $ | 15,200 | $ | 18,664 | $ | 3,464 | ||||||||||||
Basic earnings per share | $ | 0.27 | $ | 0.44 | $ | 0.17 | $ | 0.29 | $ | 0.36 | $ | 0.07 | ||||||||||||
Diluted earnings per share | $ | 0.25 | $ | 0.40 | $ | 0.15 | $ | 0.25 | $ | 0.32 | $ | 0.07 | ||||||||||||
Shares used in computing basic earnings per share | 56,331,018 | 56,331,018 | — | 34,774,983 | 34,774,983 | — | ||||||||||||||||||
Shares used in computing diluted earnings per share | 61,943,087 | 61,569,195 | (373,892 | ) | 41,509,185 | 41,759,338 | 250,153 | |||||||||||||||||
Fiscal years ended July 31, | ||||||||||||||||||||||
2013 | 2012 | |||||||||||||||||||||
CONSOLIDATED STATEMENTS OF CASH FLOWS | As Previously Reported | As Adjusted | Effect of Change | As Previously Reported | As Adjusted | Effect of Change | ||||||||||||||||
(in thousands | ||||||||||||||||||||||
CASH FLOWS FROM OPERATING ACTIVITIES: | ||||||||||||||||||||||
Net income | $ | 15,383 | $ | 24,658 | $ | 9,275 | $ | 15,200 | 18,664 | 3,464 | ||||||||||||
Stock-based compensation | 38,399 | 25,505 | (12,894 | ) | 18,258 | 12,923 | (5,335 | ) | ||||||||||||||
Deferred taxes | (3,901 | ) | (265 | ) | 3,636 | 5,362 | 7,235 | 1,873 | ||||||||||||||
3. Fair Value of Financial Instruments
Available-for-sale investments within cash equivalents and investments consist of the following:
July 31, 2014 | |||||||||||||||
Amortized Cost | Unrealized Gains | Unrealized Losses | Estimated Fair Value | ||||||||||||
(in thousands) | |||||||||||||||
U.S. agency securities | $ | 94,048 | $ | 30 | $ | (21 | ) | $ | 94,057 | ||||||
Asset-backed securities | 1,363 | — | (2 | ) | 1,361 | ||||||||||
Commercial paper | 132,442 | 14 | (4 | ) | 132,452 | ||||||||||
Corporate bonds | 297,731 | 104 | (182 | ) | 297,653 | ||||||||||
U.S. government bonds | 17,991 | 3 | (3 | ) | 17,991 | ||||||||||
Foreign government bonds | 2,755 | — | (1 | ) | 2,754 | ||||||||||
Certificate of deposit | 6,709 | — | (1 | ) | 6,708 | ||||||||||
Money market funds | 53,959 | — | — | 53,959 | |||||||||||
Municipal debt securities | 12,985 | 13 | (1 | ) | 12,997 | ||||||||||
Total | $ | 619,983 | $ | 164 | $ | (215 | ) | $ | 619,932 | ||||||
63
July 31, 2013 | |||||||||||||||
Amortized Cost | Unrealized Gains | Unrealized Losses | Estimated Fair Value | ||||||||||||
(in thousands) | |||||||||||||||
U.S. agency securities | $ | 37,087 | $ | 21 | $ | (4 | ) | $ | 37,104 | ||||||
Asset-backed securities | 4,522 | — | (1 | ) | 4,521 | ||||||||||
Commercial paper | 35,777 | 11 | (1 | ) | 35,787 | ||||||||||
Corporate bonds | 63,281 | 23 | (14 | ) | 63,290 | ||||||||||
Foreign government bonds | 776 | — | (1 | ) | 775 | ||||||||||
Money market funds | 33,216 | — | — | 33,216 | |||||||||||
Municipal debt securities | 9,105 | 4 | (14 | ) | 9,095 | ||||||||||
Total | $ | 183,764 | $ | 59 | $ | (35 | ) | $ | 183,788 | ||||||
The following table shows the gross unrealized losses and fair value of the Company’s investments with unrealized losses, aggregated by investment category and length of time that individual securities have been in a continuous unrealized loss position:
July 31, 2014 | |||||||||||||||||||||||
Less Than 12 Months | 12 Months or Greater | Total | |||||||||||||||||||||
Fair Value | Gross Unrealized Losses | Fair Value | Gross Unrealized Losses | Fair Value | Gross Unrealized Losses | ||||||||||||||||||
(in thousands) | |||||||||||||||||||||||
U.S. agency securities | $ | 46,980 | $ | (21 | ) | $ | — | $ | — | $ | 46,980 | $ | (21 | ) | |||||||||
Asset-backed securities | 1,361 | (2 | ) | — | — | 1,361 | (2 | ) | |||||||||||||||
Commercial paper | 14,389 | (4 | ) | — | — | 14,389 | (4 | ) | |||||||||||||||
Corporate bonds | 176,742 | (182 | ) | — | — | 176,742 | (182 | ) | |||||||||||||||
U. S. government bonds | 9,489 | (3 | ) | — | — | 9,489 | (3 | ) | |||||||||||||||
Foreign government bonds | 2,754 | (1 | ) | — | — | 2,754 | (1 | ) | |||||||||||||||
Certificate of deposit | 2,699 | (1 | ) | — | — | 2,699 | (1 | ) | |||||||||||||||
Municipal debt securities | — | — | 2,200 | (1 | ) | 2,200 | (1 | ) | |||||||||||||||
Total | $ | 254,414 | $ | (214 | ) | $ | 2,200 | $ | (1 | ) | $ | 256,614 | $ | (215 | ) | ||||||||
As of July 31, 2014, the Company had 93 investments in an unrealized loss position. The unrealized losses on its available-for-sale securities were primarily a result of unfavorable changes in interest rates subsequent to the initial purchase of these securities. The Company does not intend to sell, nor believe it will need to sell, these securities before recovering the associated unrealized losses. The Company does not consider any portion of the unrealized losses at July 31, 2014 to be an other-than-temporary impairment, nor are any unrealized losses considered to be credit losses. The Company has recorded the securities at fair value in its condensed consolidated balance sheets, with unrealized gains and losses reported as a component of accumulated other comprehensive loss. The amount of realized gains and losses reclassified into earnings are based on the specific identification of the securities sold. The realized gains and losses from sales of securities in the periods presented were immaterial.
The following table summarizes the contractual maturities of the Company’s available-for-sale securities as of July 31, 2014:
64
Expected maturities for the year ending July 31, | |||||||||||
2015 | 2016 | Total | |||||||||
(in thousands) | |||||||||||
U.S. agency securities | $ | 29,062 | $ | 64,995 | $ | 94,057 | |||||
Asset-backed securities | 1,361 | — | 1,361 | ||||||||
Commercial paper | 132,452 | — | 132,452 | ||||||||
Corporate bonds | 172,648 | 125,005 | 297,653 | ||||||||
U.S. government bonds | 9,995 | 7,996 | 17,991 | ||||||||
Foreign government bonds | — | 2,754 | 2,754 | ||||||||
Certificate of deposit | 4,009 | 2,699 | 6,708 | ||||||||
Money market funds | 53,959 | — | 53,959 | ||||||||
Municipal debt securities | 12,997 | — | 12,997 | ||||||||
Total | $ | 416,483 | $ | 203,449 | $ | 619,932 | |||||
Fair value is defined as the exchange price that would be received for an asset or an exit price paid to transfer a liability in the principal or most advantageous market for the asset or liability in an orderly transaction between market participants on the measurement date. Valuation techniques used to measure fair value must maximize the use of observable inputs and minimize the use of unobservable inputs. The current accounting guidance for fair value measurements defines a three-level valuation hierarchy for disclosures as follows:
Level 1-Unadjusted quoted prices in active markets for identical assets or liabilities;
Level 2-Inputs other than quoted prices included within Level I that are observable, unadjusted quoted prices in markets that are not active, or other inputs that are observable or can be corroborated by observable market data; and
Level 3-Unobservable inputs that are supported by little or no market activity, which require the Company to develop its own assumptions.
The categorization of a financial instrument within the valuation hierarchy is based upon the lowest level of input that is significant to the fair value measurement. The carrying value of the Company’s accounts receivable, accounts payable and accrued liabilities approximates their fair value due to the short-term nature of these instruments and is based on Level 2 inputs.
The Company bases the fair value of our Level 1 financial instruments, which are in active markets, using quoted market prices for identical instruments.
The Company obtains the fair value of our Level 2 financial instruments, which are not in active markets, from a third-party professional pricing service using quoted market prices for identical or comparable instruments, rather than direct observations of quoted prices in active markets. The Company’s professional pricing service gathers observable inputs for all of our fixed income securities from a variety of industry data providers (e.g. large custodial institutions) and other third-party sources. Once the observable inputs are gathered, all data points are considered and an average price is determined.
The Company validates the quoted market prices provided by our primary pricing service by comparing their assessment of the fair values of our Level 2 investment portfolio balance against the fair values of our Level 2 investment portfolio balance provided by our investment managers. Our investment managers use similar techniques to our professional pricing service to derive pricing as described above.
The Company did not own any Level 3 financial assets or liabilities as of July 31, 2014, or 2013.
65
The following tables summarize the Company’s financial assets and liabilities measured at fair value on a recurring basis, by level within the fair value hierarchy:
July 31, 2014 | |||||||||||||||
Level 1 | Level 2 | Level 3 | Total | ||||||||||||
(in thousands) | |||||||||||||||
Assets | |||||||||||||||
Cash and cash equivalents: | |||||||||||||||
Commercial paper | $ | — | $ | 66,293 | $ | — | $ | 66,293 | |||||||
Money market funds | 53,959 | — | — | 53,959 | |||||||||||
Short-term investments: | |||||||||||||||
U.S. agency securities | — | 29,062 | — | 29,062 | |||||||||||
Asset-backed securities | — | 1,361 | — | 1,361 | |||||||||||
Commercial paper | — | 66,159 | — | 66,159 | |||||||||||
U. S. government bonds | — | 9,995 | — | 9,995 | |||||||||||
Corporate bonds | — | 172,648 | — | 172,648 | |||||||||||
Certificate of deposit | — | 4,009 | — | 4,009 | |||||||||||
Municipal debt securities | — | 12,997 | — | 12,997 | |||||||||||
Long-term investments: | |||||||||||||||
U.S. agency securities | — | 64,995 | — | 64,995 | |||||||||||
Certificate of deposit | — | 2,699 | — | 2,699 | |||||||||||
Corporate bonds | — | 125,005 | — | 125,005 | |||||||||||
U.S. government bonds | — | 7,996 | — | 7,996 | |||||||||||
Foreign government bonds | — | 2,754 | — | 2,754 | |||||||||||
Total assets | $ | 53,959 | $ | 565,973 | $ | — | $ | 619,932 | |||||||
July 31, 2013 | |||||||||||||||
Level 1 | Level 2 | Level 3 | Total | ||||||||||||
(in thousands) | |||||||||||||||
Assets | |||||||||||||||
Cash and cash equivalents: | |||||||||||||||
Commercial paper | $ | — | $ | 20,597 | $ | — | $ | 20,597 | |||||||
Corporate bonds | — | 2,003 | — | 2,003 | |||||||||||
Money market funds | 33,216 | — | — | 33,216 | |||||||||||
Short-term investments: | |||||||||||||||
U.S. agency securities | — | 9,097 | — | 9,097 | |||||||||||
Asset-backed securities | — | 2,421 | — | 2,421 | |||||||||||
Commercial paper | — | 15,190 | — | 15,190 | |||||||||||
Corporate bonds | — | 47,572 | — | 47,572 | |||||||||||
Foreign government bonds | — | 775 | — | 775 | |||||||||||
Municipal debt securities | — | 1,877 | — | 1,877 | |||||||||||
Long-term investments: | |||||||||||||||
U.S. agency securities | — | 28,007 | — | 28,007 | |||||||||||
Asset-backed securities | — | 2,100 | — | 2,100 | |||||||||||
Corporate bonds | — | 13,715 | — | 13,715 | |||||||||||
Municipal debt securities | — | 7,218 | — | 7,218 | |||||||||||
Total assets | $ | 33,216 | $ | 150,572 | $ | — | $ | 183,788 | |||||||
66
4. Balance Sheet Components
Property and Equipment
Property and equipment consist of the following:
July 31, 2014 | July 31, 2013 | ||||||
(in thousands) | |||||||
Computer hardware | $ | 11,882 | $ | 8,820 | |||
Software | 4,605 | 4,460 | |||||
Furniture and fixtures | 2,732 | 2,666 | |||||
Leasehold improvements | 7,069 | 6,536 | |||||
Total property and equipment | 26,288 | 22,482 | |||||
Less accumulated depreciation | (13,681 | ) | (9,568 | ) | |||
Property and equipment, net | $ | 12,607 | $ | 12,914 | |||
As of July 31, 2014, and 2013, no property and equipment was pledged as collateral against borrowings. Amortization of leasehold improvements is included in depreciation expense. Depreciation expense was $5.3 million, $4.5 million and $2.6 million during the years ended July 31, 2014, 2013 and 2012, respectively.
Goodwill and Intangible Assets
The following table presents changes in the carrying amount of goodwill:
Total | |||
(in thousands) | |||
Goodwill, July 31, 2013 | $ | 9,048 | |
Changes in carrying value | 157 | ||
Goodwill, July 31, 2014 | $ | 9,205 | |
Refer to Note 11, Acquisition, for further details on goodwill acquired during the period.
Intangible assets consist of the following:
July 31, 2014 | July 31, 2013 | |||||||
(in thousands) | ||||||||
Acquired technology: | ||||||||
Cost | $ | 7,200 | $ | 7,200 | ||||
Accumulated amortization | (1,761 | ) | (321 | ) | ||||
Net | $ | 5,439 | $ | 6,879 | ||||
Amortization expense was $1.4 million, $0.3 million and $0.3 million during the years ended July 31, 2014, 2013 and 2012, respectively. Estimated aggregate amortization expense for each of the next five fiscal years is as follows:
Future Amortization | ||||
Fiscal Year Ending July 31, | (in thousands) | |||
2015 | $ | 1,440 | ||
2016 | 1,440 | |||
2017 | 1,440 | |||
2018 | 1,119 | |||
Total | $ | 5,439 | ||
Accrued Employee Compensation
Accrued employee compensation consists of the following:
67
July 31, 2014 | July 31, 2013 | ||||||
(in thousands) | |||||||
Accrued bonuses | $ | 19,213 | $ | 13,072 | |||
Accrued commission | 3,593 | 2,043 | |||||
Accrued vacation | 8,100 | 7,335 | |||||
Payroll accruals | 4,006 | 3,852 | |||||
Total | $ | 34,912 | $ | 26,302 | |||
Accumulated Other Comprehensive Loss
Changes in accumulated other comprehensive losses by component were as follows:
Foreign Currency Items | Unrealized gain (loss) on available-for-sale securities | Total | |||||||||
(In thousands) | |||||||||||
Balance as of July 31,2012 | $ | (496 | ) | $ | — | $ | (496 | ) | |||
Other comprehensive income (loss) before reclassification adjustments: | (1,102 | ) | 24 | (1,078 | ) | ||||||
Tax effect | — | — | — | ||||||||
Balance as of July 31, 2013 | (1,598 | ) | 24 | (1,574 | ) | ||||||
Other comprehensive income (loss) before reclassification adjustments: | 288 | (49 | ) | 239 | |||||||
Amounts reclassified from accumulated other comprehensive income (loss) to earnings | — | (39 | ) | (39 | ) | ||||||
Tax effect | — | 7 | 7 | ||||||||
Balance as of July 31, 2014 | $ | (1,310 | ) | $ | (57 | ) | $ | (1,367 | ) | ||
5. Net Income per Share
For the years ended July 31, 2014, and 2013, the Company calculated basic earnings per share by dividing the net income by the weighted average number of shares of common stock outstanding for the period. The diluted earnings per share is computed by giving effect to all potential dilutive common stock equivalents outstanding for the period. For purposes of this calculation, options to purchase common stock and restricted stock units are considered to be common stock equivalents.
For the year ended July 31, 2012, the Company’s basic and diluted earnings per share are presented in conformity with the two-class method, which is required because the Company issued securities other than common stock that participate in dividends with the common stock (“participating securities”), to compute the earnings per share attributable to common stockholders. The Company determined that it had participating securities in the form of noncumulative convertible preferred stock for the periods up to their conversion immediately prior to the closing of the Company’s IPO on January 30, 2012 when all convertible preferred stock was converted to common stock.
The two-class method requires that the Company calculate the earnings per share using net income attributable to the common stockholders, which will differ from the Company’s net income. Net income attributable to the common stockholders is generally equal to the net income less assumed periodic preferred stock dividends with any remaining earnings, after deducting assumed dividends, to be allocated on a pro-rata basis between the outstanding common and preferred stock as of the end of each period. The basic earnings per share attributable to common stockholders is calculated by dividing the net income attributable to common stockholders by the weighted average number of shares of common stock outstanding for the period. The diluted net income per share attributable to common stockholders is computed by giving effect to all potential dilutive common stock equivalents outstanding for the period. For purposes of this calculation, convertible preferred stock, options to purchase common stock and restricted stock units are considered to be common stock equivalents.
In the fourth quarter of fiscal 2014, the Company changed its policy for recognizing stock-based compensation expense from the accelerated attribution method of accounting to the straight-line method of accounting for its time-based units (or service-only awards). This change was applied retroactively to all historical periods and all historical basic and diluted net income per share figures have been adjusted to reflect this change. See Note 2 “Change in Accounting Policy - Stock-based Compensation” for additional discussion.
68
The following table sets forth the computation of the Company’s basic and diluted net income per share for the years ended July 31, 2014, 2013 and 2012:
Fiscal years ended July 31, | |||||||||||
2014 | 2013 | 2012 | |||||||||
(in thousands, except share and per share amounts) | |||||||||||
Numerator: | |||||||||||
Net income (1) | $ | 14,721 | $ | 24,658 | $ | 18,664 | |||||
Non-cumulative dividends to preferred stockholders | — | — | (1,574 | ) | |||||||
Undistributed earnings allocated to preferred stockholders | — | — | (4,444 | ) | |||||||
Net income, basic | 14,721 | 24,658 | 12,646 | ||||||||
Adjustments to net income for dilutive options and restricted stock options | — | — | 574 | ||||||||
Net income, diluted | $ | 14,721 | $ | 24,658 | $ | 13,220 | |||||
Net income per share: (1) | |||||||||||
Basic | $ | 0.22 | $ | 0.44 | $ | 0.36 | |||||
Diluted | $ | 0.21 | $ | 0.40 | $ | 0.32 | |||||
(1) | See Note 2 “Change in Accounting Policy - Stock-Based Compensation” of Notes to Consolidated Financial Statements. |
Fiscal years ended July 31, | ||||||||
2014 | 2013 | 2012 | ||||||
(in thousands, except share and per share amounts) | ||||||||
Denominator: (1) | ||||||||
Weighted average shares used in computing net income per share: | ||||||||
Basic | 65,748,896 | 56,331,018 | 34,774,983 | |||||
Weighted average effect of diluted stock options | 1,896,766 | 3,392,797 | 5,082,507 | |||||
Weighted average effect of dilutive restricted stock units | 1,467,071 | 1,845,380 | 1,871,982 | |||||
Weighted average effect of dilutive stock warrants (2) | — | — | 29,866 | |||||
Diluted | 69,112,733 | 61,569,195 | 41,759,338 | |||||
(1) | See Note 2 “Change in Accounting Policy - Stock-Based Compensation” of Notes to Consolidated Financial Statements. |
(2) | Series C convertible preferred stock warrants were automatically converted to equivalent common stock warrants upon the Company’s IPO on January 24, 2012 and converted or cancelled as of April 30, 2012. |
The following outstanding shares of common stock equivalents were excluded from the computation of diluted net income per share for the periods presented because including them would have been antidilutive:
Fiscal years ended July 31, | ||||||||
2014 | 2013 | 2012 | ||||||
Stock options to purchase common stock (1) | 206,136 | 320,325 | 5,037 | |||||
Restricted stock units (1) | 76,840 | 64,397 | 136,905 | |||||
(1) | See Note 2 “Change in Accounting Policy - Stock-Based Compensation” of Notes to Consolidated Financial Statements |
69
6. Commitments and Contingencies
The following table presents a summary of the Company’s contractual obligations and commitments as of July 31, 2014:
Lease Obligations | Royalty Obligations (1) | Purchase Commitments (2) | Total | ||||||||||||
Fiscal Year Ending July 31, | (in thousands) | ||||||||||||||
2015 | $ | 5,786 | $ | 398 | $ | 6,141 | $ | 12,325 | |||||||
2016 | 5,835 | 365 | 1,589 | 7,789 | |||||||||||
2017 | 5,710 | 212 | 276 | 6,198 | |||||||||||
2018 | 5,663 | 110 | — | 5,773 | |||||||||||
2019 | 5,102 | — | — | 5,102 | |||||||||||
Total | $ | 28,096 | $ | 1,085 | $ | 8,006 | $ | 37,187 | |||||||
(1) | Royalty obligations primarily represent our obligations under our non-cancellable agreements related to software used in certain revenue-generating agreements. |
(2) | Purchase commitments consist of agreements to purchase services, entered into in the ordinary course of business. These represent non-cancellable commitments for which a penalty would be imposed if the agreement was canceled for any reason other than an event of default as described by the agreement. |
Leases
The Company leases certain facilities and equipment under operating leases. The Company entered into an operating lease agreement in September 2007 for its corporate headquarters in California that expired in July 2012. In connection with the lease, the Company opened a letter of credit which expired upon the expiration of the lease in July 2012. On November 23, 2009, the Company entered into a sublease agreement for additional conference space expiring in July 2012. On December 5, 2011, the Company entered into a seven-year lease for a facility to serve as its new corporate headquarters, located in Foster City, California, for approximately 97,674 square feet of space commencing August 1, 2012. In connection with the new lease, the Company opened an unsecured letter of credit with Silicon Valley Bank for $1.2 million. On August 1, 2014, the Company amended its operating lease agreement to reduce the unsecured letter of credit to $0.8 million.
Lease expense for all worldwide facilities and equipment, which is being recognized on a straight-line basis over terms of the various leases, was $5.8 million, $5.3 million and $4.0 million during the years ended July 31, 2014, 2013 and 2012, respectively. This expense is net of sublease income of $1.2 million for the year ended July 31, 2012.
Letters of Credit
The Company had two and three outstanding letters of credit required to secure contractual commitments and prepayments as of July 31, 2014 and 2013, respectively. In addition to the unsecured letter of credit for the building lease, the Company had an unsecured letter of credit agreement related to a customer arrangement for PLN 10.0 million (approximately $3.2 million as of July 31, 2014) to secure contractual commitments and prepayments. No amounts were outstanding under our unsecured letters of credit as of July 31, 2014 or July 31, 2013.
Legal Proceedings
In December 2007, the Company was the subject of a lawsuit by a competitor, Accenture Global Services GmbH and Accenture LLP (collectively “Accenture”). In May 2011, the Company prevailed in the U.S. District Court for the District of Delaware regarding the invalidity of one of Accenture’s patents. In October 2011, the parties agreed to resolve the litigation, subject to a potential additional payment by the Company if Accenture was successful in appealing the validity of its patent. In September 2013, the U.S. Court of Appeals for the Federal Circuit affirmed the lower court decision in the Company’s favor and, in June 2014, the U.S. Supreme Court denied Accenture’s final appeal, ending the litigation. The Company will have no additional payments relating to the settlement.
In addition to the matters described above, from time to time, the Company is involved in various other legal proceedings and receives claims, arising from the normal course of business activities. The Company has accrued for estimated losses in the accompanying consolidated financial statements for matters with respect to which the Company believes the likelihood of an adverse outcome is probable and the amount of the loss is reasonably estimable.
Indemnification
The Company sells software licenses and services to its customers under contracts (“Software License”). Each Software License contains the terms of the contractual arrangement with the customer and generally includes certain provisions for
70
defending the customer against any claims that the Company’s software infringes upon a patent, copyright, trademark, or other proprietary right of a third party. Software Licenses also indemnify the customer against losses, expenses, and liabilities from damages that may be assessed against the customer in the event the Company’s software is found to infringe upon such third party rights.
The Company has not had to reimburse any of its customers for losses related to indemnification provisions and no material claims against the Company are outstanding as of July 31, 2014 and 2013. For several reasons, including the lack of prior indemnification claims and the lack of a monetary liability limit for certain infringement cases under various Software Licenses, the Company cannot estimate the amount of potential future payments, if any, related to indemnification provisions.
The Company has also agreed to indemnify its directors and executive officers for costs associated with any fees, expenses, judgments, fines and settlement amounts incurred by any of these persons in any action or proceeding to which any of these persons is, or is threatened to be, made a party by reason of the person’s service as a director or officer, including any action by the Company, arising out of that person’s services as the Company’s director or officer or that person’s services provided to any other company or enterprise at the Company’s request. The Company maintains director and officer insurance coverage that may enable the Company to recover a portion of any future amounts paid.
7. Stockholders’ Equity and Stock-Based Compensation
Stock-Based Compensation Expense
Stock-based compensation expense related to all employee and non-employee stock-based awards is as follows:
Fiscal years ended July 31, | |||||||||||
2014 | 2013 | 2012 | |||||||||
Stock-based compensation expense: (1) | (in thousands) | ||||||||||
Cost of license revenues | $ | 184 | $ | — | $ | — | |||||
Cost of maintenance revenues | 797 | 830 | 288 | ||||||||
Cost of services revenues | 11,929 | 6,910 | 2,461 | ||||||||
Research and development | 9,008 | 5,843 | 2,385 | ||||||||
Sales and marketing | 10,744 | 3,672 | 1,496 | ||||||||
General and administrative | 9,876 | 8,250 | 6,293 | ||||||||
Total stock-based compensation expense | 42,538 | 25,505 | 12,923 | ||||||||
Tax benefit from stock-based compensation | 15,905 | 9,902 | 5,061 | ||||||||
Total stock-based compensation expense, net of tax effect | $ | 26,633 | $ | 15,603 | $ | 7,862 | |||||
(1) | See Note 2 “Change in Accounting Policy - Stock-Based Compensation” of Notes to Consolidated Financial Statements |
Included in fiscal 2014 stock-based compensation was $1.6 million of expense for performance-based awards, which were tied to fiscal year 2014 financial results. Stock-based compensation for the year ended July 31, 2013, includes $1.0 million of expense related to the modification of RSUs upon accelerated vesting terms for the retirement of one of the Company’s executives, $0.2 million reversal of previously recognized expense for unvested awards upon termination of one of the Company’s officers, and $1.7 million of expense for multiple performance-based awards, which were mainly tied to fiscal year 2013 financial results. Amounts for the year ended July 31, 2012, include a stock compensation expense of $1.2 million related to service performed prior to the IPO for RSUs granted to the Company’s Chief Executive Officer whereby the performance condition for these grants was satisfied upon the Company’s IPO closing, and a $0.9 million related to a change in estimated forfeiture rate upon the IPO event.
As of July 31, 2014, total unrecognized compensation cost, adjusted for estimated forfeitures, was as follows:
71
As of July 31, 2014 | |||||
Unrecognized Expense | Average Expected Recognition Period | ||||
(in thousands) | (in years) | ||||
Restricted stock units | $ | 83,505 | 2.2 | ||
Stock options | 6,019 | 2.0 | |||
$ | 89,524 | ||||
RSUs
RSU activity under the Company’s equity incentive plans is as follows:
RSUs Outstanding | ||||||
Number of RSUs Outstanding | Weighted Average Grant Date Fair Value | |||||
Balance as of July 31, 2013 | 4,027,601 | $ | 19.27 | |||
Granted | 1,667,433 | 43.87 | ||||
Released | (2,007,423 | ) | 18.59 | |||
Canceled | (303,390 | ) | 31.48 | |||
Balance as of July 31, 2014 | 3,384,221 | $ | 30.70 | |||
The weighted average per share grant date fair value of RSUs granted during each of the fiscal years ended July 31, 2014, 2013 and 2012was $43.87, $33.68 and $13.65, respectively. The fair value of RSUs released during the years ended July 31, 2014, 2013 and 2012 was $91.3 million, $56.2 million and $41.2 million, respectively.
On March 9, 2011, the Company granted a series of three awards totaling 878,800 performance-based RSUs to its President and Chief Executive Officer. Each of these RSUs was subject to time-based vesting and performance vesting. In addition, each of the RSUs was subject to a separate performance condition, as follows:
• | The RSUs covering 502,200 shares of common stock were subject to satisfaction of an IPO of the Company’s equity securities, which occurred in January 2012; |
• | The RSUs covering 251,100 shares of common stock were subject to full and final dismissal or final adjudication of certain specified litigation to the satisfaction of the Board, which occurred in July 2011; and |
• | The RSUs covering 125,500 shares of common stock were subject to satisfaction of a pre-established revenue target for fiscal year 2012, which was satisfied upon close of fiscal year 2012. |
Stock Options
Stock option activity under the Company’s equity incentive plans is as follows:
Number of Stock Options Outstanding | Weighted Average Exercise Price | Weighted Average Remaining Contractual Life | Aggregate Intrinsic Value (1) | |||||||||
(in years) | (in thousands) | |||||||||||
Balance as of July 31, 2013 | 3,763,228 | $ | 6.74 | 5.7 | $ | 139,315 | ||||||
Granted | 225,930 | 46.63 | ||||||||||
Exercised | (1,580,344 | ) | 5.53 | |||||||||
Canceled | (8,561 | ) | 21.75 | |||||||||
Balance as of July 31, 2014 | 2,400,253 | $ | 11.24 | 5.5 | $ | 71,640 | ||||||
Vested and expected to vest as of July 31, 2014 | 2,376,443 | $ | 10.96 | 5.4 | $ | 71,503 | ||||||
Exercisable as of July 31, 2014 | 2,040,125 | $ | 6.32 | 5.5 | $ | 70,039 | ||||||
(1) | Aggregate intrinsic value represents the difference between the exercise price of the option and the Company’s closing stock price of $40.50 and $43.76 on July 31, 2014, and July 31, 2013, respectively. |
72
The options exercisable as of July 31, 2014, include options that are exercisable prior to vesting. The total intrinsic value of options exercised was approximately $65.3 million, $86.0 million and $31.2 million for the years ended July 31, 2014, 2013 and 2012, respectively. The weighted average grant date fair value of options granted was $46.63, $14.06 and $4.51 for the years ended July 31, 2014, 2013 and 2012, respectively.
Additional information regarding options outstanding as of July 31, 2014 is as follows:
Options Outstanding | Options Exercisable | ||||||||||||||
Exercise Price | Number of Options Outstanding | Remaining Contractual Life (Years) | Exercise Price per Share | Number of Options Exercisable | Exercise Price per Share | ||||||||||
$0.16—1.00 | 99,010 | 1.4 | $ | 0.68 | 99,010 | $ | 0.68 | ||||||||
1.25—2.56 | 71,150 | 2.1 | 2.17 | 71,150 | 2.17 | ||||||||||
2.74 | 423,312 | 3.0 | 2.74 | 423,312 | 2.74 | ||||||||||
3.50 | 124,860 | 3.7 | 3.50 | 124,860 | 3.50 | ||||||||||
3.73 | 351,886 | 4.7 | 3.73 | 351,886 | 3.73 | ||||||||||
3.92 | 338,523 | 5.4 | 3.92 | 338,523 | 3.92 | ||||||||||
4.50—7.50 | 309,954 | 6.8 | 7.14 | 304,954 | 7.13 | ||||||||||
8.65—11.00 | 210,337 | 7.1 | 8.78 | 208,878 | 8.78 | ||||||||||
29.03—32.25 | 221,476 | 8.1 | 31.99 | 67,905 | 31.41 | ||||||||||
35.00—53.15 | 249,745 | 9.1 | 45.53 | 49,647 | 46.07 | ||||||||||
2,400,253 | 5.5 | $ | 11.24 | 2,040,125 | $ | 6.32 | |||||||||
Valuation of Awards
Determining Fair Value of Stock Options
The fair value of the common stock underlying the stock options and restricted stock units granted prior to the IPO have been determined by the Board. Because there had been no public market for the Company’s common stock, the Board had determined the fair value of the common stock at the time of the grant by considering a number of objective and subjective factors including valuations of comparable companies, sales of redeemable convertible preferred stock to unrelated third parties, operating and financial performance, lack of liquidity of capital stock and general and industry-specific economic outlook, amongst other factors. The fair value of the underlying common stock was determined by the Board until the Company’s common stock was listed on the New York Stock Exchange upon IPO. Awards granted subsequent to the Company’s IPO reflect the fair value of common stock as of the end of trading on the grant date.
The fair value of each grant of stock options was determined by the Company and the Board using the methods and assumptions discussed below. Each of these inputs is subjective and generally requires significant judgment to determine.
Valuation Method—The Company estimates the fair value of its stock options using the Black-Scholes option-pricing model.
Expected Term—The expected term represents the period that the stock-based awards are expected to be outstanding. The Company uses the simplified method to determine the expected term for its option grants as provided by the Securities and Exchange Commission. The simplified method calculates the expected term as the average of the time-to-vesting and the contractual life of the options. The Company uses the simplified method to determine its expected term because of its limited history of stock option exercise activity.
Expected Volatility—The expected volatility is derived from the historical stock volatilities of several comparable publicly listed peers over a period approximately equal to the expected term of the options as the Company has limited trading history by which to determine the volatility of its own common stock.
Risk-Free Interest Rate— The risk-free interest rate is based on the U.S. Treasury yield curve in effect at the time of grant for zero coupon U.S. Treasury notes with maturities approximately equal to the expected term of the options.
Expected Dividend—The expected dividend is zero as the Company has never paid dividends and has no expectations to do so.
73
Summary of Assumptions—The fair value of the employee stock options were estimated on the grant dates using a Black-Scholes option-pricing model with the following weighted average assumptions:
Fiscal years ended July 31, | |||||
2014 | 2013 | 2012 | |||
Expected life (in years) | 5.0 - 6.1 | 5.1 - 6.1 | 5.3 - 6.3 | ||
Risk-free interest rate | 1.5% - 2.0% | 0.6% - 1.2% | 1.2% - 1.5% | ||
Expected volatility | 41.3% - 46.2% | 45.1% - 48.7% | 44.1% - 46.4% | ||
Expected dividend yield | —% | —% | —% | ||
Forfeiture Rate—The Company estimates its forfeiture rate based on an analysis of its actual forfeitures and will continue to evaluate the adequacy of the forfeiture rate based on actual forfeiture experience, analysis of employee turnover behavior, and other factors. The impact from a forfeiture rate adjustment will be recognized in full in the period of adjustment, and if the actual number of future forfeitures differs from that estimated, the Company may be required to record adjustments to stock-based compensation expense in future periods.
In the fourth quarter of fiscal 2014, the Company changed its policy for recognizing stock-based compensation expense from the accelerated attribution method of accounting to the straight-line method of accounting for certain share-based compensation awards. See Note 2 “Change in Accounting Policy - Stock-based Compensation” for additional discussion.
Convertible Preferred Stock
Upon the closing of the Company’s IPO on January 30, 2012, all outstanding convertible preferred stock was converted into 25,357,721 shares of common stock on a one-to-one basis. As of July 31, 2014 and 2013, the Company was authorized to issue 25,000,000 shares of convertible preferred stock, respectively, with a par value of $0.0001 per share. As of July 31, 2014 and 2013, no shares of convertible preferred stock were issued and outstanding.
Common Stock Reserved for Future Issuance
As of July 31, 2014 and 2013, the Company was authorized to issue 500,000,000 common shares with a par value of $0.0001 per share, respectively, and 69,082,261 and 57,909,277 common shares were issued and outstanding, respectively. As of July 31, 2014 and 2013, the Company had reserved shares of common stock, on an as-if-converted basis, for future issuance as follows:
July 31, 2014 | July 31, 2013 | ||||
Exercise of stock options to purchase common stock | 2,400,253 | 3,763,228 | |||
Vesting of restricted stock units | 3,384,221 | 4,027,601 | |||
Issuances of shares available under stock plans | 11,703,962 | 9,194,058 | |||
Total common stock reserved for issuance | 17,488,436 | 16,984,887 | |||
Equity Incentive Plans
In February 2007, the Company’s board of directors (“Board”) adopted and the stockholders approved the 2006 Stock Plan (“2006 Plan”) as an amendment and restatement of the stockholder-approved 2002 Stock Option/Stock Issuance Plan, as amended, which provided for the issuance of incentive and nonstatutory options to employees and nonemployees of the Company.
In July 2009, the Board adopted and the stockholders approved the 2009 Stock Plan (“French Plan”), which provided for nonstatutory options to employees.
In June 2010, the Board adopted and the stockholders approved the 2010 Restricted Stock Unit Plan (“2010 Plan”), which provided for the issuance of restricted and performance stock units to employees and nonemployees.
On September 14, 2011, the Board, upon the recommendation of the Compensation Committee of the Board (“Committee”), adopted the 2011 Stock Plan (“2011 Plan”), which was subsequently approved by the Company’s stockholders in January 2012. The 2011 Plan provides flexibility to the Committee to use various equity-based incentive awards as compensation tools to motivate the Company’s workforce. The Company had initially reserved 7,500,000 shares of its common stock for the issuance of awards under the 2011 Plan. In addition, the number of shares remaining available for grant under the 2006 Plan and 2010 Plan immediately prior to the closing of the IPO were added to the shares available under the 2011 Plan. The number of shares remaining available for grant under the French Plan expired upon the IPO. The 2011 Plan provides that
74
the number of shares reserved and available for issuance under the plan will automatically increase each January 1, beginning on January 1, 2013, by up to 5% of the outstanding number of shares of the Company’s common stock on the immediately preceding December 31. This number is subject to adjustment in the event of a stock split, stock dividend or other defined changes in the Company’s capitalization. With the adoption of the 2011 Plan upon the completion of the Company’s IPO, both option and RSU grants now reduce the 2011 Plan reserve. As of July 31, 2014, the Company had reserved 11,703,962 shares of common stock for issuance under the 2011 Plan.
The shares the Company issues under the 2011 Plan will be authorized but unissued shares or shares that are reacquired. The shares of common stock underlying any awards under the 2011 Plan, 2010 Plan and 2006 Plan that are forfeited, canceled, held back upon exercise or settlement of an award to satisfy the exercise price or tax withholding, reacquired by the Company prior to vesting, satisfied without any issuance of stock or are otherwise terminated (other than by exercise) are added back to the shares of common stock available for issuance under the 2011 Plan. The shares of common stock underlying any outstanding awards under the French Plan that are forfeited, canceled or otherwise not issued will expire and not be available for future issuance.
No awards may be granted under the 2011 Plan after the date that is 10 years from the effectiveness of the plan. No awards under the 2011 Plan were granted prior to the Company’s IPO. Following the closing of the IPO, no additional awards will be made under the 2006 Plan, French Plan and 2010 Plan.
8. Income Taxes
The Company’s income before provision for income taxes for the years ended July 31, 2014, 2013 and 2012 is as follows:
Fiscal years ended July 31, | |||||||||||
2014 | 2013 | 2012 | |||||||||
(in thousands) | |||||||||||
Domestic | $ | 11,956 | $ | 25,725 | $ | 22,370 | |||||
International | 7,990 | 4,398 | 6,146 | ||||||||
Income before provision for income taxes (1) | $ | 19,946 | $ | 30,123 | $ | 28,516 | |||||
(1) | See Note 2 “Change in Accounting Policy - Stock-Based Compensation” of Notes to Consolidated Financial Statements. |
The provision for income taxes consists of the following:
Fiscal years ended July 31, | |||||||||||
2014 | 2013 | 2012 | |||||||||
(in thousands) | |||||||||||
Current: | |||||||||||
U.S. federal | $ | 5,235 | $ | 1,296 | $ | — | |||||
State | 1,326 | 999 | 544 | ||||||||
Foreign | 2,509 | 3,479 | 1,522 | ||||||||
Total current | 9,070 | 5,774 | 2,066 | ||||||||
Deferred: | |||||||||||
U.S. federal | (4,277 | ) | (258 | ) | 6,968 | ||||||
State | 78 | 483 | (69 | ) | |||||||
Foreign | 354 | (534 | ) | 887 | |||||||
Total deferred | (3,845 | ) | (309 | ) | 7,786 | ||||||
Total provision for income taxes (1) | $ | 5,225 | $ | 5,465 | $ | 9,852 | |||||
(1) | See Note 2 “Change in Accounting Policy - Stock-Based Compensation” of Notes to Consolidated Financial Statements. |
75
The total income tax expense differs from the amounts computed by applying the statutory federal income tax rate of 35% during the years ended July 31, 2014, 2013 and 2012 as follows:
Fiscal years ended July 31, | |||||||||||
2014 | 2013 | 2012 | |||||||||
(in thousands) | |||||||||||
Computed tax expense | $ | 6,977 | $ | 10,538 | $ | 9,972 | |||||
Nondeductible items and other | 1,164 | (577 | ) | 694 | |||||||
State taxes, net of federal benefit | 840 | (858 | ) | (644 | ) | ||||||
Foreign income taxed at different rates | (207 | ) | 1,405 | 258 | |||||||
Tax credits | (3,612 | ) | (7,199 | ) | (1,356 | ) | |||||
Change in valuation allowance | 63 | 2,156 | 928 | ||||||||
Total provision for income taxes (1) | $ | 5,225 | $ | 5,465 | $ | 9,852 | |||||
(1) See Note 2 “Change in Accounting Policy - Stock-Based Compensation” of Notes to Consolidated Financial Statements.
The tax effects of temporary differences that gave rise to significant portions of deferred tax assets and liabilities are as follows:
As of July 31, | |||||||
2014 | 2013 | ||||||
(in thousands) | |||||||
Accruals and reserves | $ | 8,487 | $ | 3,646 | |||
Stock-based compensation | 4,347 | 5,076 | |||||
Deferred revenues | 1,485 | 510 | |||||
Property and equipment | 298 | — | |||||
State taxes | 1 | — | |||||
Net operating loss carryforwards | 1,161 | 2,244 | |||||
Tax credits | 11,699 | 14,233 | |||||
Total deferred tax assets | 27,478 | 25,709 | |||||
Less valuation allowance | 4,938 | 4,874 | |||||
Net deferred tax assets | 22,540 | 20,835 | |||||
Less deferred tax liabilities: | |||||||
Property and equipment | — | 440 | |||||
Intangible assets | 1,701 | 2,268 | |||||
Foreign deferred revenue | 727 | 736 | |||||
Total net deferred tax assets | $ | 20,112 | $ | 17,391 | |||
During the years ended July 31, 2014, 2013 and 2012, the Company was able to consider positive evidence in determining the realizability of its deferred tax assets, including projections for future growth, and determined a significant portion of the valuation allowance was not required. A valuation allowance of $4.9 million and $4.9 million remained as of July 31, 2014 and 2013, respectively, for California research and development credits that were not more likely than not realizable.
As of July 31, 2014, the Company had U. S. federal, California and other states net operating loss (“NOL”) carryforwards of $177.5 million, $83.2 million, and $7.0 million, respectively. The U. S. federal and California NOL carryforwards will start to expire in 2026 and 2016, respectively.
The Company had research and development tax credit (“R&D credit”) carryforwards of the following:
Fiscal years ended July 31, | |||||||||||
2014 | 2013 | 2012 | |||||||||
(in thousands) | |||||||||||
U.S. federal | $ | 15,956 | $ | 12,973 | $ | 6,565 | |||||
California | 11,657 | 11,980 | 7,558 | ||||||||
Total R&D credit carryforwards | $ | 27,613 | $ | 24,953 | $ | 14,123 | |||||
76
The U.S. federal R&D credit will start to expire in 2023. California R&D tax credits have no expiration.
The excess tax benefits associated with stock option exercises are recorded directly to stockholders’ equity only when realized through reduction to income tax payable on the tax returns. As a result, the pre-tax excess tax benefits included in federal and California net operating loss carryforwards on the tax returns but not reflected in deferred tax assets for fiscal year 2014 are $176.3 million and $74.3 million, respectively.
Federal and California laws impose restrictions on the utilization of net operating loss carryforwards and R&D credit carryforwards in the event of a change in ownership of the Company, which constitutes an “ownership change” as defined by Internal Revenue Code Sections 382 and 383. The Company experienced an ownership change in the past that does not materially impact the availability of its net operating losses and tax credits. Nevertheless, should there be an ownership change in the future; the Company’s ability to utilize existing carryforwards could be substantially restricted.
The Company provides U.S. income taxes on the earnings of foreign subsidiaries, unless the subsidiaries’ earnings are considered indefinitely reinvested outside the United States. As of July 31, 2014, U.S. income taxes were not provided for on the cumulative total of $19.4 million of undistributed earnings from certain foreign subsidiaries. As of July 31, 2014, the unrecognized deferred tax liability for these earnings was approximately $2.3 million.
Unrecognized Tax Benefits
The following table summarizes the activity related to unrecognized tax benefits:
Fiscal years ended July 31, | |||||||||||
2014 | 2013 | 2012 | |||||||||
(in thousands) | |||||||||||
Unrecognized benefit - beginning of period | $ | 6,727 | $ | 3,937 | $ | 2,419 | |||||
Gross increases - prior period tax positions | (368 | ) | 370 | 478 | |||||||
Gross increases - current period tax positions | 1,617 | 2,420 | 1,040 | ||||||||
Unrecognized benefit - end of period | $ | 7,976 | $ | 6,727 | $ | 3,937 | |||||
During the year ended July 31, 2014, the Company’s unrecognized tax benefits increased by $1.2 million, primarily associated with the Company’s federal and California R&D credits. As of July 31, 2014, the Company had unrecognized tax benefits of $4.3 million that, if recognized, would affect the Company’s effective tax rate.
The Company or one of its subsidiaries files income taxes in the U.S. federal jurisdiction and various states and foreign jurisdictions. If the Company utilizes net operating losses or tax credits in future years, the U.S. federal, state and local, and non-U.S. tax authorities may examine the tax returns covering the period in which the net operating losses and tax credits arose. As a result, the Company’s tax returns in the U.S. and California remain open to examination from fiscal years 2002 through 2014. Substantially all material foreign income tax matters in Australia have been concluded through the year ended July 31, 2007. The Company has been audited in Canada and substantially concluded all material income tax matters through July 31, 2009.
As of July 31, 2014, the Company has tax audits in progress in certain foreign jurisdictions. To the extent the final tax liabilities are different from the amounts originally accrued, the increases or decreases are recorded as income tax expense or benefit in the consolidated statements of income. While the Company believes that the resolution of these audits will not have a material adverse impact on the Company’s results of operations, the outcome is subject to uncertainty.
9. Employee 401(k) Plan
The Company’s employee savings and retirement plan is qualified under Section 401 of the Internal Revenue Code. The plan is available to all regular employees on the Company’s U.S. payroll and provides employees with tax-deferred salary deductions and alternative investment options. Employees may contribute up to 60% of their eligible salary up to the statutory prescribed annual limit. Beginning January 1, 2014, the Company increased its matching for employees’ contributions up to $4,000 per participant per calendar year.
77
10. Segment Information
The Company operates in one segment. The Company’s chief operating decision maker (the “CODM”), its Chief Executive Officer, manages the Company’s operations on a consolidated basis for purposes of allocating resources. When evaluating the Company’s financial performance, the CODM reviews separate revenues information for the Company’s license, maintenance and professional services offerings, while all other financial information is reviewed on a consolidated basis. All of the Company’s principal operations and decision-making functions are located in the United States.
The following table sets forth revenues by country based on the billing address of the customer:
Fiscal years ended July 31, | |||||||||||
2014 | 2013 | 2012 | |||||||||
(in thousands) | |||||||||||
United States | $ | 203,791 | $ | 172,793 | $ | 127,484 | |||||
Canada | 39,100 | 42,632 | 35,690 | ||||||||
Other Americas | 8,106 | 6,932 | 3,850 | ||||||||
Total Americas | 250,997 | 222,357 | 167,024 | ||||||||
United Kingdom | 37,890 | 20,660 | 16,212 | ||||||||
Other EMEA | 35,149 | 27,543 | 14,672 | ||||||||
Total EMEA | 73,039 | 48,203 | 30,884 | ||||||||
APAC | 26,210 | 30,089 | 34,153 | ||||||||
Total revenues | $ | 350,246 | $ | 300,649 | $ | 232,061 | |||||
No country other than those listed above accounted for more than 10% of revenues during the years ended July 31, 2014, 2013 and 2012.
The following table sets forth the Company’s long-lived assets, including goodwill and intangibles, net by geographic region:
July 31, 2014 | July 31, 2013 | ||||||
(in thousands) | |||||||
Americas | $ | 25,573 | $ | 27,280 | |||
Europe | 950 | 1,276 | |||||
Asia Pacific | 728 | 285 | |||||
Total | $ | 27,251 | $ | 28,841 | |||
11. | Acquisition |
On May 10, 2013, the Company purchased all of the outstanding equity interests of Millbrook, Inc., a privately held provider of data models and platforms, technology accelerators and business intelligence solutions for P&C insurers. The aggregate cost of the acquisition was $14.7 million net of acquired cash. In addition, the Company issued $3.7 million in RSUs, vesting of which is subject to time-based vesting requirements and therefore is excluded from the purchase consideration. The related value is recognized as compensation expense over the requisite service period. The Company believes that the acquisition of Millbrook will enhance reporting capabilities of our software. The results of Millbrook’s operations from May 10, 2013 to July 31, 2013 are included in the Company’s results for the fourth quarter of fiscal year 2013 and were not material. Transaction expenses of $0.7 million were expensed as incurred.
The aggregate cost of the acquisition, net of acquired cash, was allocated as follows:
78
Total Purchase Price Allocation | Estimated Useful Lives | |||||
(in thousands) | (in years) | |||||
Assets acquired, net | $ | 590 | n/a | |||
Developed technology | 7,200 | 5.0 | ||||
Deferred tax liability | (2,094 | ) | n/a | |||
Goodwill | 9,048 | n/a | ||||
Total purchase price | $ | 14,744 | ||||
Management assigned fair values to the identifiable intangible assets by applying the income approach. This fair value measurement is based on significant inputs that are not observable in the market and thus represents a Level 3 measurement. The valuation models were based on estimates of future operating projections of the acquired business and rights to sell new products containing the acquired technology as well as judgments on the discount rates used and other variables. The Company developed forecasts based on a number of factors including pricing projections of future products, expected customer interest, a discount rate that is representative of the weight average cost of capital, and a long-term sustainable growth rate based on market analysis. The Company is amortizing the acquired intangible asset on a straight-line basis over its estimated useful life.
The pro-forma results of operations have not been presented because the effects of the business combination described above were not material to our consolidated results of operations.
Item 9. | Changes in and Disagreements with Accountant on Accounting and Financial Disclosure |
None.
Item 9A. | Controls and Procedures |
Evaluation of Disclosure Controls and Procedures
Our management, with the participation of our principal executive officer and principal financial officer, has evaluated the effectiveness of our disclosure controls and procedures (as defined in Rules 13a- 15(e) and 15d- 15(e) under the Securities Exchange Act of 1934, as amended (the “Exchange Act”)), as of the end of the period covered by this Annual Report on Form 10-K. Based on such evaluation, our principal executive officer and principal financial officer have concluded that as of such date, our disclosure controls and procedures were effective.
Management’s Annual Report on Internal Control Over Financial Reporting
Our management is responsible for establishing and maintaining adequate internal control over financial reporting for the Company as defined in Rule 13a-15(f) or 15d-15(f) of the Exchange Act. Internal control over financial reporting is a process designed to provide reasonable assurance regarding the reliability of financial reporting and the preparation of financial statements for external purposes in accordance with generally accepted accounting principles, and includes those policies and procedures that: (i) pertain to the maintenance of records that, in reasonable detail, accurately and fairly reflect the transactions and dispositions of our assets; (ii) provide reasonable assurance that transactions are recorded as necessary to permit preparation of financial statements in accordance with generally accepted accounting principles, and that our receipts and expenditures are being made only in accordance with authorizations of our management and directors; and (iii) provide reasonable assurance regarding prevention or timely detection of unauthorized acquisition, use or disposition of our assets that could have a material effect on our financial statements.
Because of its inherent limitations, internal control over financial reporting may not prevent or detect misstatements. Also, projections of any evaluation of effectiveness to future periods are subject to the risk that controls may become inadequate because of changes in conditions, or that the degree of compliance with the policies or procedures may deteriorate.
Our management assessed the effectiveness of the Company’s internal control over financial reporting as of July 31, 2014, using the criteria set forth by the Committee of Sponsoring Organizations of the Treadway Commission (COSO) in its Internal Control-Integrated Framework (1992). Based on this assessment and those criteria, management concluded that our internal control over financial reporting was effective as of July 31, 2014.
79
Our internal control over financial reporting has been audited by KPMG LLP, an independent registered public accounting firm, as stated in their report, which appears in Part II, Item 8 of this Form 10-K.
Inherent Limitations of Internal Controls
Our management, including our Chief Executive Officer and Chief Financial Officer, does not expect that our disclosure controls and procedures or our internal controls will prevent all errors and all fraud. A control system, no matter how well conceived and operated, can provide only reasonable, not absolute, assurance that the objectives of the control system are met. Because of the inherent limitations in all control systems, no evaluation of controls can provide absolute assurance that all control issues and instances of fraud, if any, within the Company have been detected. These inherent limitations include the realities that judgments in decision-making can be faulty, and that breakdowns can occur because of a simple error or mistake. Additionally, controls can be circumvented by the individual acts of some persons, by collusion of two or more people, or by management override of the control. The design of any system of controls also is based in part upon certain assumptions about the likelihood of future events, and there can be no assurance that any design will succeed in achieving its stated goals under all potential future conditions. Over time, controls may become inadequate because of changes in conditions, or the degree of compliance with the policies or procedures may deteriorate. Because of the inherent limitations in a cost-effective control system, misstatements due to error or fraud may occur and not be detected.
Changes in Internal Control over Financial Reporting
There were no changes in our internal control over financial reporting during our most recent fiscal quarter that have materially affected, or are reasonably likely to materially affect, our internal control over financial reporting.
Item 9B. | Other Information |
In September 2014, the Compensation Committee of the Board of Directors approved a new form of employment agreement for our executive officers (the “New Form of Executive Agreement”). The terms of the New Form of Executive Agreement are substantially similar to those in the prior form of employment agreement for our executive officers, except that the New Form of Executive Agreement provides each executive officer with, among other things, 100% (rather than 12 months’) accelerated vesting of all outstanding equity awards upon a qualifying termination that occurs within two months before or within twelve months following a change in control of the company. The New Form of Executive Agreement is also an “at will” agreement and no longer has a three-year term. This new form will replace any existing employment agreements in place with our executive officers. We have filed the form of Executive Agreement as Exhibit 10.6 to this Annual Report on Form 10-K.
PART III
Item 10. | Directors, Executive Officers and Corporate Governance |
The information required by this item concerning our executive officers is set forth under the heading “Executive Officers of the Registrant” in Part I, Item 1 of this Annual Report on Form 10-K.
We have adopted a Code of Business Conduct and Ethics that applies to all of our directors, officers and employees, including our principal executive officer and principal financial officer. The Code of Business Conduct and Ethics is posted on our investor relations website.
We will post any amendments to, or waivers from, a provision of this Code of Business Conduct and Ethics by posting such information on our website, at the address and location specified above.
The other information required by this item will be contained in our definitive proxy statement to be filed with the Securities and Exchange Commission in connection with our 2014 annual meeting of stockholders (the “Proxy Statement”), which is expected to be filed not later than 120 days after the end of our fiscal year ended July 31, 2014, and is incorporated in this report by reference.
Item 11. | Executive Compensation |
The information required by this item will be set forth in the Proxy Statement and is incorporated herein by reference.
80
Item 12. | Security Ownership of Certain Beneficial Owners and Management and Related Stockholder Matters |
The information required by this item will be set forth in the Proxy Statement and is incorporated herein by reference.
Item 13. | Certain Relationships and Related Transactions and Director Independence |
The information, if any, required by this item will be set forth in the Proxy Statement and is incorporated herein by reference.
Item 14. | Principal Accountant Fees and Services |
The information required by this item will be set forth in the Proxy Statement and is incorporated herein by reference.
81
PART IV
Item 15. | Exhibits and Financial Statement Schedules |
(a) The following documents are filed as part of this report:
1. Consolidated Financial Statements
See Index to Consolidated Financial Statements at Item 8 herein.
2. Financial Statement Schedules
Schedules not listed above have been omitted because the information required to be set forth therein is not applicable or is shown in the financial statements or notes herein.
3. Exhibits
See the Exhibit Index immediately following the signature page of this Annual Report on Form 10-K.
The exhibits listed below are filed or incorporated by reference as part of this Annual Report on Form 10-K.
82
Signatures
Pursuant to the requirements of Section 13 or 15(d) of the Securities Exchange Act of 1934, the registrant has duly caused this report to be signed on its behalf by the undersigned, thereunto duly authorized.
GUIDEWIRE SOFTWARE, INC. | ||
By: | /S/ MARCUS S. RYU | |
Marcus S. Ryu | ||
President and Chief Executive Officer | ||
POWER OF ATTORNEY
Each person whose individual signature appears below hereby authorizes and appoints Marcus S. Ryu, Karen Blasing, and Winston King, and each of them, with full power of substitution and resubstitution and full power to act without the other, as his or her true and lawful attorney-in-fact and agent to act in his or her name, place and stead and to execute in the name and on behalf of each person, individually and in each capacity stated below, and to file any and all amendments to this Annual Report on Form 10-K, and to file the same, with all exhibits thereto, and other documents in connection therewith, with the Securities and Exchange Commission, granting unto said attorneys-in-fact and agents, and each of them, full power and authority to do and perform each and every act and thing, ratifying and confirming all that said attorneys-in-fact and agents or any of them or their or his substitute or substitutes may lawfully do or cause to be done by virtue thereof.
Pursuant to the requirements of the Securities Exchange Act of 1934, this report has been signed below by the following persons on behalf of the registrant and in the capacities and on the dates indicated.
Signature | Title | Date | ||
/S/ MARCUS S. RYU | President, Chief Executive Officer and Director (Principal Executive Officer) | September 17, 2014 | ||
Marcus S. Ryu | ||||
/S/ KAREN BLASING | Chief Financial Officer (Principal Financial and Accounting Officer) | September 17, 2014 | ||
Karen Blasing | ||||
/S/ John Cavoores | Director | September 17, 2014 | ||
John Cavoores | ||||
/S/ Craig Conway | Director (Chairman of the Board) | September 17, 2014 | ||
Craig Conway | ||||
/S/ Andrew Brown | Director | September 17, 2014 | ||
Andrew Brown | ||||
/S/ Guy Dubois | Director | September 17, 2014 | ||
Guy Dubois | ||||
/S/ Paul Lavin | Director | September 17, 2014 | ||
Paul Lavin | ||||
/S/ Clifton Thomas Weatherford | Director | September 17, 2014 | ||
Clifton Thomas Weatherford | ||||
83
EXHIBIT INDEX
Exhibit Number | Description | Incorporated by Reference From Form | Incorporated by Reference From Exhibit Number | Date Filed | |||||
3.1 | Amended and Restated Certificate of Incorporation. | 10-Q | 3.1 | March 14, 2012 | |||||
3.2 | Amended and Restated Bylaws. | 8-K | 3.1 | January 22, 2013 | |||||
4.1 | Form of Common Stock certificate of the Registrant. | S-1/A | 4.1 | January 9, 2012 | |||||
10.1 | Form of Indemnification Agreement between the Registrant and each of its directors and executive officers. | S-1/A | 10.1 | October 28, 2011 | |||||
10.2 | 2006 Stock Plan and forms of agreements thereunder. | S-1 | 10.2 | September 2, 2011 | |||||
10.3 | 2009 Stock Plan and forms of agreements thereunder. | S-1 | 10.3 | September 2, 2011 | |||||
10.4 | 2010 Restricted Stock Unit Plan and forms of agreements thereunder. | S-1 | 10.4 | September 2, 2011 | |||||
10.5 | 2011 Stock Plan and forms of agreements thereunder. | S-1/A | 10.5 | December 13, 2011 | |||||
10.6 | Form of Executive Agreement. | Filed herewith | — | — | |||||
10.7 | Senior Executive Incentive Bonus Plan. | S-1/A | 10.12 | December 13, 2011 | |||||
10.8 | Lease Agreement between Parkside Towers, L.P. and the Registrant dated as of December 5, 2011. | S-1/A | 10.13 | December 13, 2011 | |||||
18.1 | KPMG, LLP Preferability Letter. | Filed herewith | — | — | |||||
21.1 | Subsidiaries of the Registrant. | 10-K | 21.1 | September 26, 2013 | |||||
23.1 | Consent of KPMG LLP, Independent Registered Public Accounting Firm. | Filed herewith | — | — | |||||
31.1 | Certification of the Chief Executive Officer pursuant to Section 302 of the Sarbanes-Oxley Act. | Filed herewith | — | — | |||||
31.2 | Certification of the Chief Financial Officer pursuant to Section 302 of the Sarbanes-Oxley Act. | Filed herewith | — | — | |||||
32.1* | Certification of the Chief Executive Officer and the Chief Financial Officer pursuant to Section 906 of the Sarbanes-Oxley Act. | Furnished herewith | — | — | |||||
101.INS** | XBRL Instance Document. | Filed herewith | — | ||||||
101.SCH** | XBRL Taxonomy Extension Schema Document. | Filed herewith | — | ||||||
101.CAL** | XBRL Taxonomy Extension Calculation Linkbase Document. | Filed herewith | — — | ||||||
101.DEF** | XBRL Taxonomy Extension Definition Linkbase Document. | Filed herewith | — | ||||||
101.LAB** | XBRL Taxonomy Extension Label Linkbase Document. | Filed herewith | — — | ||||||
101.PRE** | XBRL Taxonomy Extension Presentation Linkbase Document. | Filed herewith | — | ||||||
* | The certifications furnished in Exhibit 32.1 hereto are deemed to accompany this Annual Report on Form 10-K and will not be deemed “filed” for purposes of Section 18 of the Securities Exchange Act of 1934, as amended. Such certifications will not be deemed to be incorporated by reference into any filings under the Securities Act of 1933, as amended, or the Securities Exchange Act of 1934, as amended, except to the extent that the registrant specifically incorporates it by reference. |
84
** | Users of this data are advised that, pursuant to Rule 406T of Regulation S-T, these interactive data files are deemed not filed or part of a registration statement or prospectus for purposes of Sections 11 or 12 of the Securities Act of 1933 or Section 18 of the Securities Exchange Act of 1934 and otherwise are not subject to liability under these sections. |
85