Attached files
| file | filename |
|---|---|
| 8-K - 8-K - PIONEER ENERGY SERVICES CORP | a8kinvpres09162014.htm |

DEUTSCHE BANK 2014 ENERGY CONFERENCE September 16th, 2014

Forward-looking Statements 2 This presentation contains various forward-looking statements and information that are based on management’s current expectations and assumptions about future events. Forward-looking statements are generally accompanied by words such as “estimate,” “project,” “predict,” “expect,” “anticipate,” “plan,” “intend,” “seek,” “will,” “should,” “goal” and other words that convey the uncertainty of future events and outcomes. Forward-looking information includes, among other matters, statements regarding the Company’s anticipated growth, quality of assets, rig utilization rate, capital spending by oil and gas companies, production rates, the Company's growth strategy, and the Company's international operations. Although the Company believes that the expectations and assumptions reflected in such forward-looking statements are reasonable, it can give no assurance that such expectations and assumptions will prove to have been correct. Such statements are subject to certain risks, uncertainties and assumptions, including general economic and business conditions and industry trends, levels and volatility of oil and gas prices, decisions about exploration and development projects to be made by oil and gas exploration and production companies, risks associated with economic cycles and their impact on capital markets and liquidity, the continued demand for the drilling services or production services in the geographic areas where we operate, the highly competitive nature of our business, our future financial performance, including availability, terms and deployment of capital, future compliance with covenants under our senior secured revolving credit facility and our senior notes, the supply of marketable drilling rigs, well servicing rigs, coiled tubing and wireline units within the industry, changes in technology and improvements in our competitors’ equipment, the continued availability of drilling rig, well servicing rig, coiled tubing and wireline unit components, the continued availability of qualified personnel, the success or failure of our acquisition strategy, including our ability to finance acquisitions, manage growth and effectively integrate acquisitions, and changes in, or our failure or inability to comply with, governmental regulations, including those relating to the environment. Should one or more of these risks, contingencies or uncertainties materialize, or should underlying assumptions prove incorrect, actual results may vary materially from those expected. Many of these factors have been discussed in more detail in the Company's annual report on Form 10- K for the fiscal year ended December 31, 2013 and the Company’s quarterly report on Form 10-Q for the quarter ended June 30, 2014. Unpredictable or unknown factors that the Company has not discussed in this presentation or in its filings with the Securities and Exchange Commission could also have material adverse effects on actual results of matters that are the subject of the forward-looking statements. All forward-looking statements speak only as the date on which they are made and the Company undertakes no duty to update or revise any forward-looking statements. We advise our shareholders to use caution and common sense when considering our forward-looking statements.
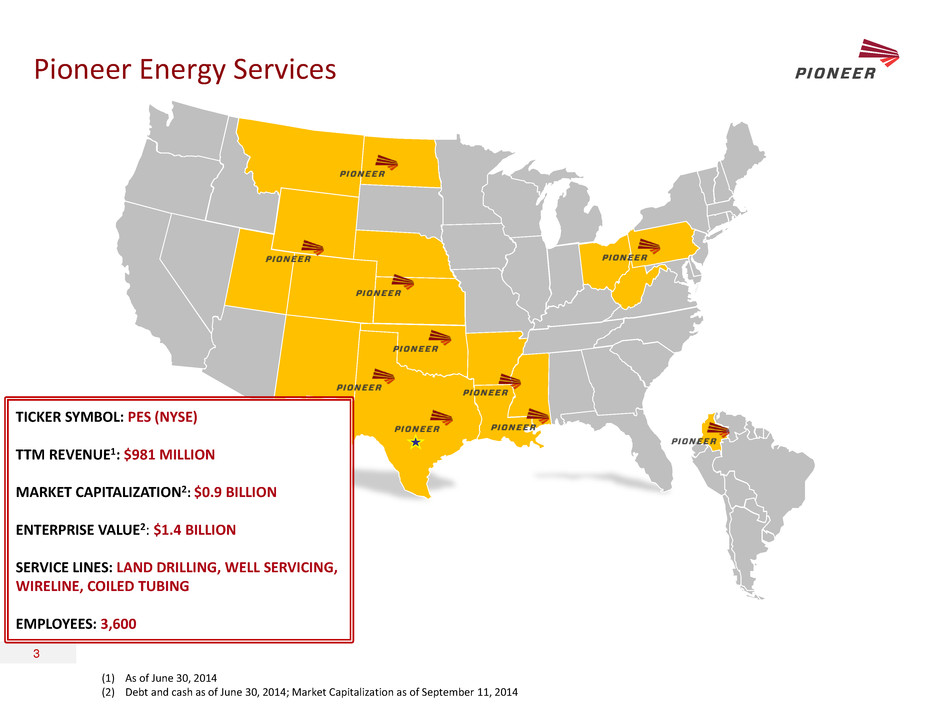
Pioneer Energy Services 3 (1) As of June 30, 2014 (2) Debt and cash as of June 30, 2014; Market Capitalization as of September 11, 2014 TICKER SYMBOL: PES (NYSE) TTM REVENUE1: $981 MILLION MARKET CAPITALIZATION2: $0.9 BILLION ENTERPRISE VALUE2: $1.4 BILLION SERVICE LINES: LAND DRILLING, WELL SERVICING, WIRELINE, COILED TUBING EMPLOYEES: 3,600

Diversified Services 4 % of TTM REVENUE1 (1) Revenue breakdown based on trailing twelve month revenue as of June 30, 2014 of $981MM DRILLING SERVICES Drilling Services - US 54 Rigs Drilling Services – Colombia 8 Rigs Total Drilling 62 Rigs PRODUCTION SERVICES Well Servicing 112 Rigs Wireline 120 Units Coiled Tubing 16 Units Production Services 49% Drilling - Colombia 10% Drilling - US 41%
Recent Updates 5 Drilling Services • Quarter-to-date utilization through August was 87% Colombia • All eight rigs are currently earning revenue • One rig is on stacked rate awaiting a well site • Two rigs on mobilization rates Production Services • Well servicing quarter-to-date utilization through August was 101% • Coiled tubing quarter-to-date utilization through August was 57%
Investment Considerations Summary 6 • Exposure to the full well life cycle including drilling, completions, workovers and on-going well maintenance • Approximately 60% of US revenue1 attributable to three key U.S. markets: Bakken shale, Eagle Ford shale and the Permian • Accretive organic growth opportunities in all four core service lines • Industry-leading safety results continue to strengthen our activity levels and client base (1) Trailing twelve months as of June 30, 2014
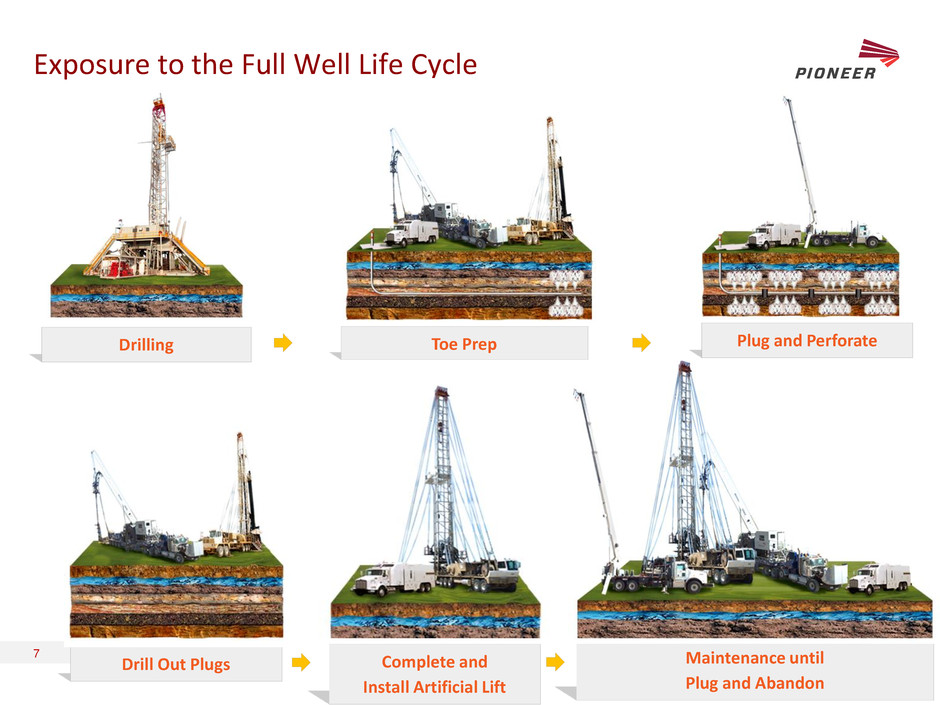
Exposure to the Full Well Life Cycle 7 Plug and Perforate Toe Prep Drilling Maintenance until Plug and Abandon Drill Out Plugs Complete and Install Artificial Lift
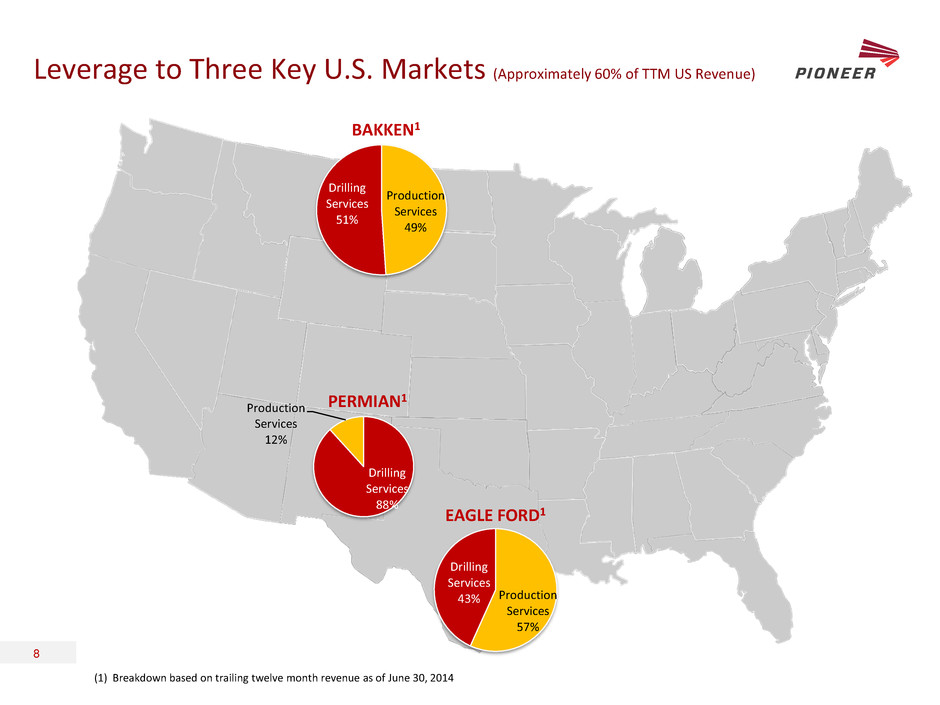
Leverage to Three Key U.S. Markets (Approximately 60% of TTM US Revenue) 8 Production Services 49% Drilling Services 51% Drilling Services 88% Production Services 12% Production Services 57% Drilling Services 43% EAGLE FORD1 PERMIAN1 BAKKEN1 (1) Breakdown based on trailing twelve month revenue as of June 30, 2014

Accretive Organic Growth Opportunities 9 • Adding nine well servicing rigs, six wireline units and four coiled tubing units in 2014 • Adding 16 well servicing rigs and eight wireline units in 2015 • Executed five new-build drilling rig contracts for delivery in 2015 DRILLING SERVICES WELL SERVICING WIRELINE COILED TUBING 3 6 10 13 13 17 17 2009 2010 2011 2012 2013 2014E 2015E 74 74 89 108 109 118 134 2009 2010 2011 2012 2013 2014E 2015E 63 84 105 120 119 125 133 2009 2010 2011 2012 2013 2014E 2015E 71 71 64 69 62 62 67 2009 2010 2011 2012 2013 2014E 2015E

PRODUCTION SERVICES
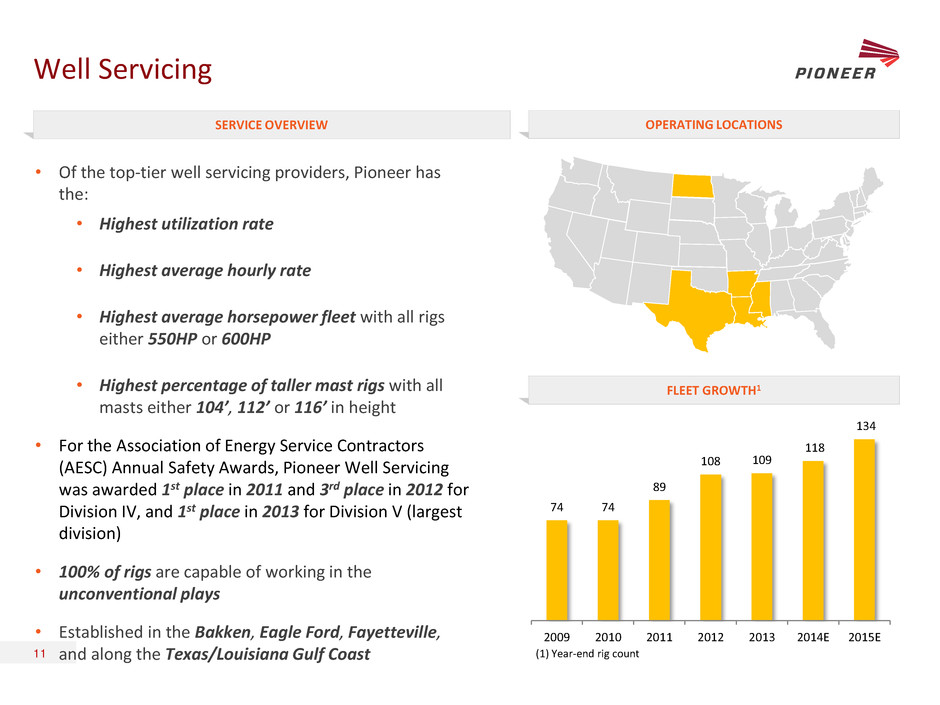
Well Servicing 11 • Of the top-tier well servicing providers, Pioneer has the: • Highest utilization rate • Highest average hourly rate • Highest average horsepower fleet with all rigs either 550HP or 600HP • Highest percentage of taller mast rigs with all masts either 104’, 112’ or 116’ in height • For the Association of Energy Service Contractors (AESC) Annual Safety Awards, Pioneer Well Servicing was awarded 1st place in 2011 and 3rd place in 2012 for Division IV, and 1st place in 2013 for Division V (largest division) • 100% of rigs are capable of working in the unconventional plays • Established in the Bakken, Eagle Ford, Fayetteville, and along the Texas/Louisiana Gulf Coast (1) Year-end rig count SERVICE OVERVIEW OPERATING LOCATIONS FLEET GROWTH1 74 74 89 108 109 118 134 2009 2010 2011 2012 2013 2014E 2015E
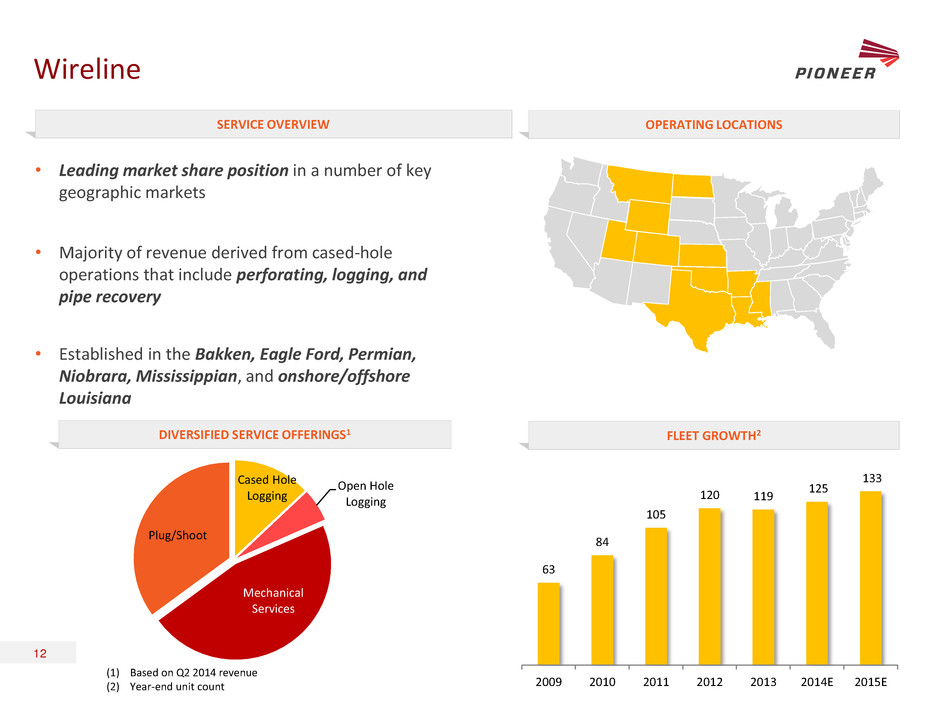
Wireline 12 • Leading market share position in a number of key geographic markets • Majority of revenue derived from cased-hole operations that include perforating, logging, and pipe recovery • Established in the Bakken, Eagle Ford, Permian, Niobrara, Mississippian, and onshore/offshore Louisiana (1) Based on Q2 2014 revenue (2) Year-end unit count SERVICE OVERVIEW OPERATING LOCATIONS FLEET GROWTH2 DIVERSIFIED SERVICE OFFERINGS1 Cased Hole Logging Open Hole Logging Mechanical Services Plug/Shoot 63 84 105 120 119 125 133 2009 2010 2011 2012 2013 2014E 2015E
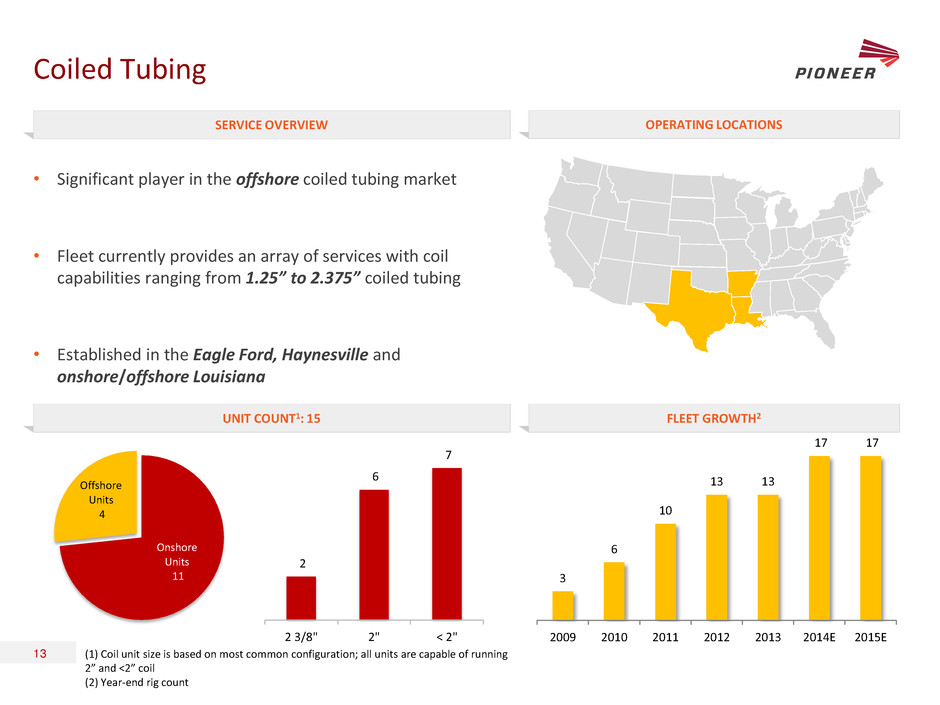
Coiled Tubing 13 • Significant player in the offshore coiled tubing market • Fleet currently provides an array of services with coil capabilities ranging from 1.25” to 2.375” coiled tubing • Established in the Eagle Ford, Haynesville and onshore/offshore Louisiana SERVICE OVERVIEW OPERATING LOCATIONS UNIT COUNT1: 15 FLEET GROWTH2 (1) Coil unit size is based on most common configuration; all units are capable of running 2” and <2” coil (2) Year-end rig count 2 6 7 2 3/8" 2" < 2" Onshore Units 11 Offshore Units 4 3 6 10 13 13 17 17 2009 2010 2011 2012 2013 2014E 2015E

DRILLING SERVICES
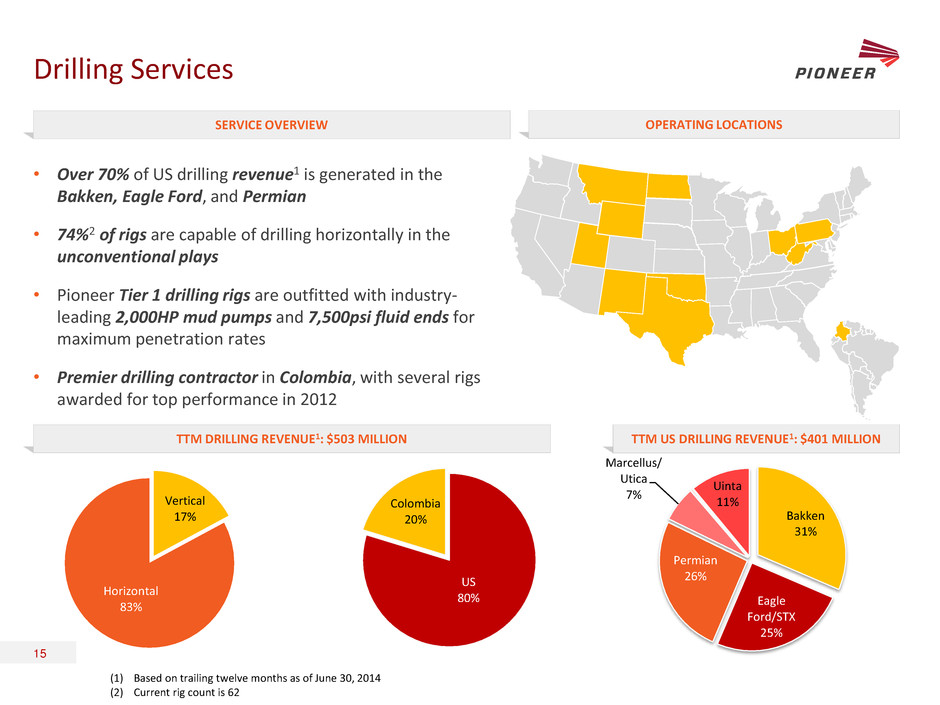
Drilling Services 15 • Over 70% of US drilling revenue1 is generated in the Bakken, Eagle Ford, and Permian • 74%2 of rigs are capable of drilling horizontally in the unconventional plays • Pioneer Tier 1 drilling rigs are outfitted with industry- leading 2,000HP mud pumps and 7,500psi fluid ends for maximum penetration rates • Premier drilling contractor in Colombia, with several rigs awarded for top performance in 2012 (1) Based on trailing twelve months as of June 30, 2014 (2) Current rig count is 62 SERVICE OVERVIEW OPERATING LOCATIONS TTM DRILLING REVENUE1: $503 MILLION TTM US DRILLING REVENUE1: $401 MILLION US 80% Colombia 20% Vertical 17% Horizontal 83% Bakken 31% Eagle Ford/STX 25% Permian 26% Marcellus/ Utica 7% Uinta 11%
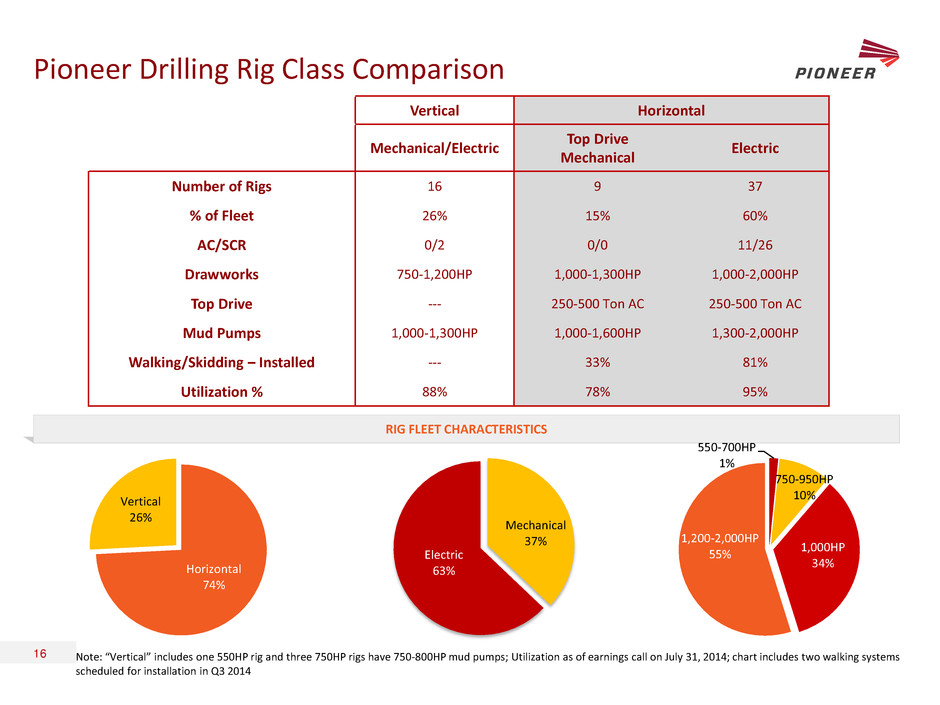
Pioneer Drilling Rig Class Comparison 16 RIG FLEET CHARACTERISTICS Vertical Horizontal Mechanical/Electric Top Drive Mechanical Electric Number of Rigs 16 9 37 % of Fleet 26% 15% 60% AC/SCR 0/2 0/0 11/26 Drawworks 750-1,200HP 1,000-1,300HP 1,000-2,000HP Top Drive --- 250-500 Ton AC 250-500 Ton AC Mud Pumps 1,000-1,300HP 1,000-1,600HP 1,300-2,000HP Walking/Skidding – Installed --- 33% 81% Utilization % 88% 78% 95% Mechanical 37% Electric 63% Note: “Vertical” includes one 550HP rig and three 750HP rigs have 750-800HP mud pumps; Utilization as of earnings call on July 31, 2014; chart includes two walking systems scheduled for installation in Q3 2014 550-700HP 1% 750-950HP 10% 1,000HP 34% 1,200-2,000HP 55% Horizontal 74% Vertical 26%
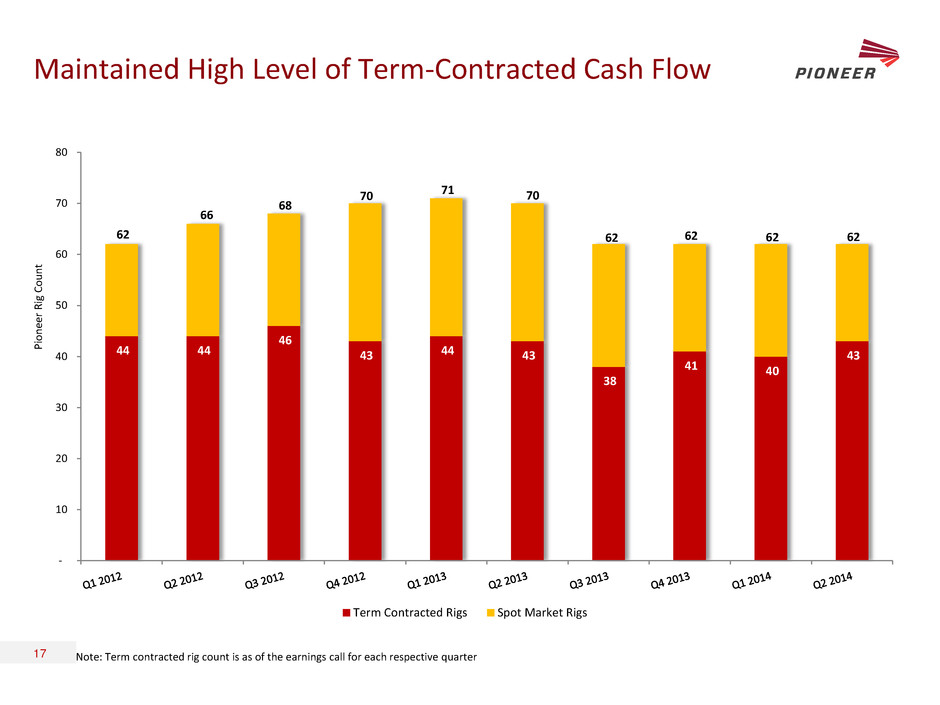
Maintained High Level of Term-Contracted Cash Flow 17 Note: Term contracted rig count is as of the earnings call for each respective quarter 44 44 46 43 44 43 38 41 40 43 62 66 68 70 71 70 62 62 62 62 - 10 20 30 40 50 60 70 80 Pi o n ee r R ig C o u n t Term Contracted Rigs Spot Market Rigs
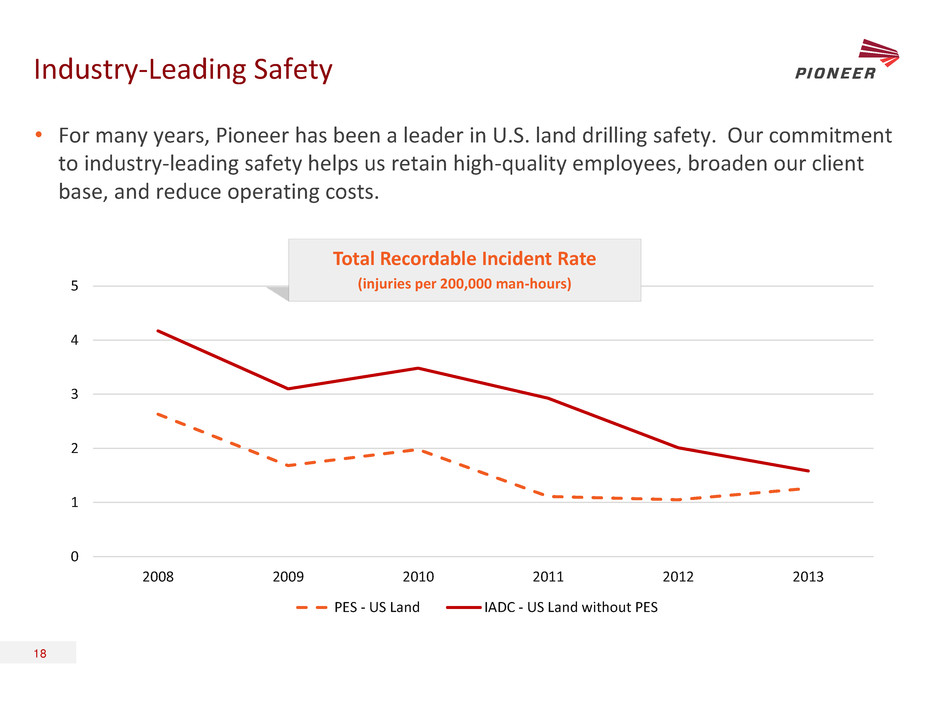
Industry-Leading Safety 18 • For many years, Pioneer has been a leader in U.S. land drilling safety. Our commitment to industry-leading safety helps us retain high-quality employees, broaden our client base, and reduce operating costs. 0 1 2 3 4 5 2008 2009 2010 2011 2012 2013 PES - US Land IADC - US Land without PES Total Recordable Incident Rate (injuries per 200,000 man-hours)

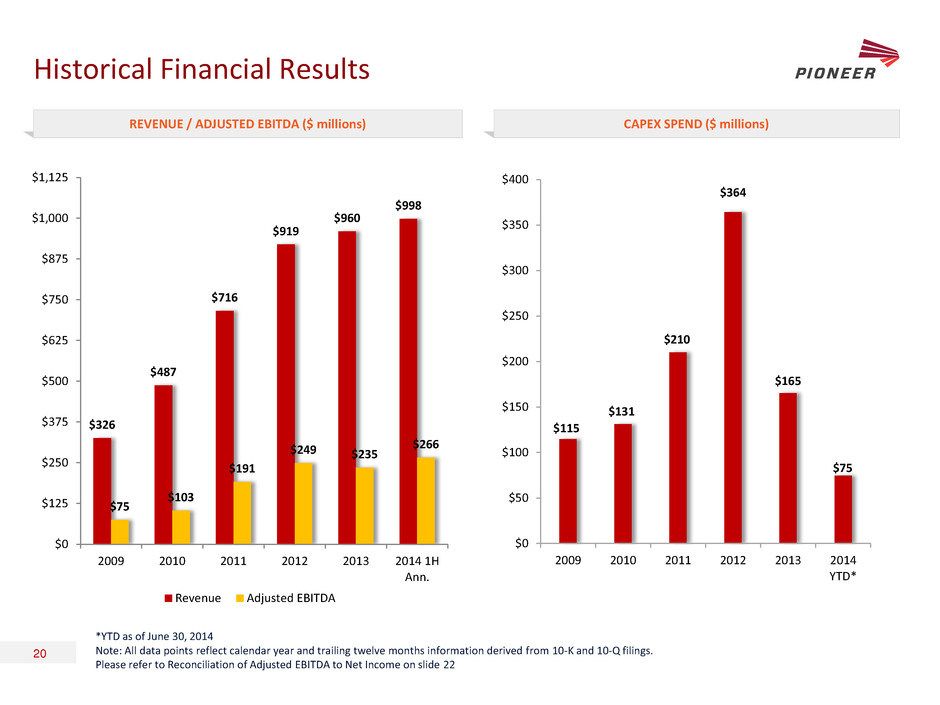
Historical Financial Results 20 REVENUE / ADJUSTED EBITDA ($ millions) CAPEX SPEND ($ millions) *YTD as of June 30, 2014 Note: All data points reflect calendar year and trailing twelve months information derived from 10-K and 10-Q filings. Please refer to Reconciliation of Adjusted EBITDA to Net Income on slide 22 $326 $487 $716 $919 $960 $998 $75 $103 $191 $249 $235 $266 $0 $125 $250 $375 $500 $625 $750 $875 $1,000 $1,125 2009 2010 2011 2012 2013 2014 1H Ann. Revenue Adjusted EBITDA $115 $131 $210 $364 $165 $75 $0 $50 $100 $150 $200 $250 $300 $350 $400 2009 2010 2011 2012 2013 2014 YTD*
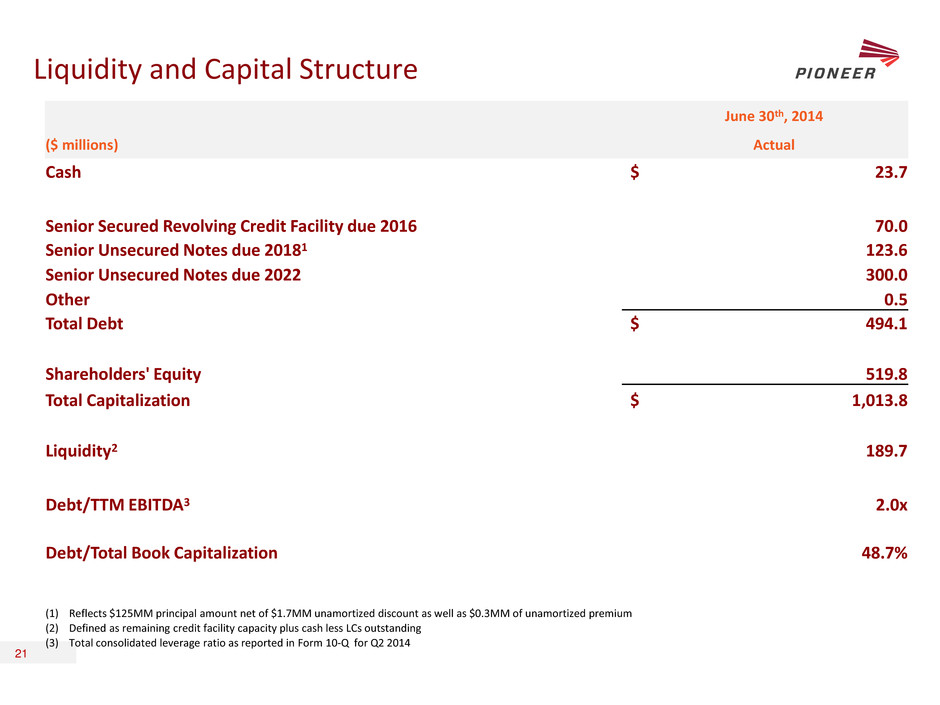
Liquidity and Capital Structure 21 June 30th, 2014 ($ millions) Actual Cash $ 23.7 Senior Secured Revolving Credit Facility due 2016 70.0 Senior Unsecured Notes due 20181 123.6 Senior Unsecured Notes due 2022 300.0 Other 0.5 Total Debt $ 494.1 Shareholders' Equity 519.8 Total Capitalization $ 1,013.8 Liquidity2 189.7 Debt/TTM EBITDA3 2.0x Debt/Total Book Capitalization 48.7% (1) Reflects $125MM principal amount net of $1.7MM unamortized discount as well as $0.3MM of unamortized premium (2) Defined as remaining credit facility capacity plus cash less LCs outstanding (3) Total consolidated leverage ratio as reported in Form 10-Q for Q2 2014
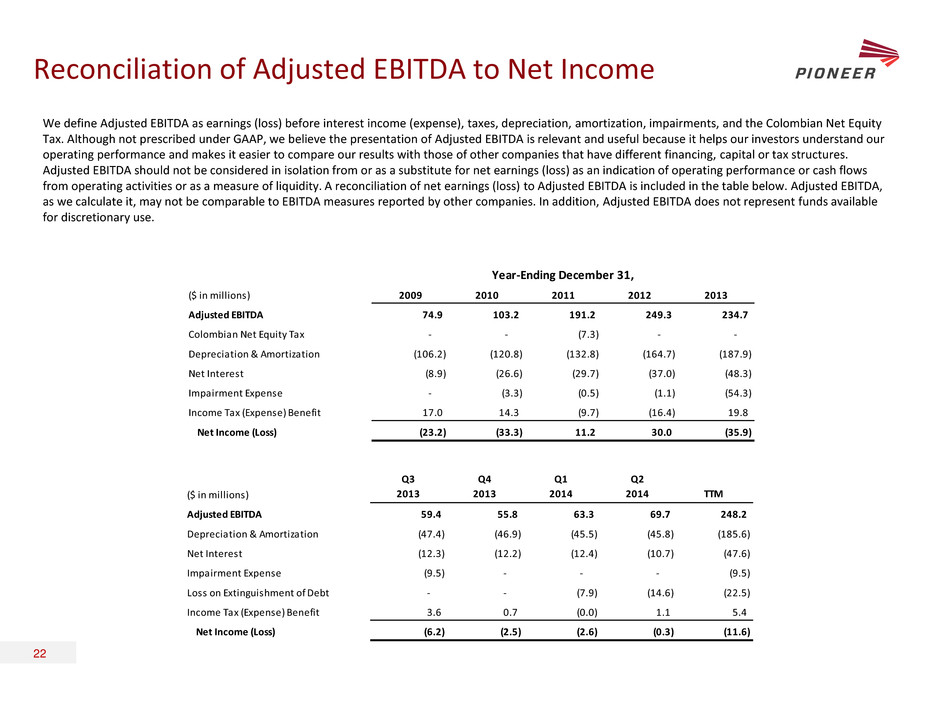
Reconciliation of Adjusted EBITDA to Net Income 22 We define Adjusted EBITDA as earnings (loss) before interest income (expense), taxes, depreciation, amortization, impairments, and the Colombian Net Equity Tax. Although not prescribed under GAAP, we believe the presentation of Adjusted EBITDA is relevant and useful because it helps our investors understand our operating performance and makes it easier to compare our results with those of other companies that have different financing, capital or tax structures. Adjusted EBITDA should not be considered in isolation from or as a substitute for net earnings (loss) as an indication of operating performance or cash flows from operating activities or as a measure of liquidity. A reconciliation of net earnings (loss) to Adjusted EBITDA is included in the table below. Adjusted EBITDA, as we calculate it, may not be comparable to EBITDA measures reported by other companies. In addition, Adjusted EBITDA does not represent funds available for discretionary use. ($ in illi n ) 2009 2010 2011 2012 2013 Adjust EBITDA 74.9 103.2 191.2 249.3 234.7 Colombian Net Equity Tax - - (7.3) - - Depreciation & Amortization (106.2) (120.8) (132.8) (164.7) (187.9) Net Interest (8.9) (26.6) (29.7) (37.0) (48.3) Impairment Expense - (3.3) (0.5) (1.1) (54.3) Income Tax (Expense) Benefit 17.0 14.3 (9.7) (16.4) 19.8 Net Income (Loss) (23.2) (33.3) 11.2 30.0 (35.9) Year-Ending December 31, ($ in illions) Q3 2013 Q4 2013 Q1 2014 Q2 2014 TTM Adjusted EBITDA 59.4 55.8 63.3 69.7 248.2 Depreciation & Amortization (47.4) (46.9) (45.5) (45.8) (185.6) Net Interest (12.3) (12.2) (12.4) (10.7) (47.6) Impairment Expense (9.5) - - - (9.5) Loss on Extinguishment of Debt - - (7.9) (14.6) (22.5) Income Tax (Expense) Benefit 3.6 0.7 (0.0) 1.1 5.4 Net Income (Loss) (6.2) (2.5) (2.6) (0.3) (11.6)
