Attached files
| file | filename |
|---|---|
| EX-31.1 - EX-31.1 - QUINSTREET, INC | d743713dex311.htm |
| EX-31.2 - EX-31.2 - QUINSTREET, INC | d743713dex312.htm |
| EX-32.1 - EX-32.1 - QUINSTREET, INC | d743713dex321.htm |
| EX-10.27 - EX-10.27 - QUINSTREET, INC | d743713dex1027.htm |
| EXCEL - IDEA: XBRL DOCUMENT - QUINSTREET, INC | Financial_Report.xls |
| EX-23.1 - EX-23.1 - QUINSTREET, INC | d743713dex231.htm |
Table of Contents
Index to Financial Statements
UNITED STATES
SECURITIES AND EXCHANGE COMMISSION
Washington, D.C. 20549
Form 10-K
| x | ANNUAL REPORT PURSUANT TO SECTION 13 OR 15(d) OF THE SECURITIES EXCHANGE ACT OF 1934 |
For the Fiscal Year Ended June 30, 2014
OR
| ¨ | TRANSITION REPORT PURSUANT TO SECTION 13 OR 15(d) OF THE SECURITIES EXCHANGE ACT OF 1934 |
Commission file number: 001-34628
QuinStreet, Inc.
(Exact name of registrant as specified in its charter)
| Delaware | 77-0512121 | |
| (State or other jurisdiction of incorporation or organization) |
(I.R.S. Employer Identification No.) |
950 Tower Lane, 6th Floor
Foster City, California 94404
(Address of principal executive offices, including zip code)
(650) 587-7700
(Registrant’s telephone number, including area code)
Securities registered pursuant to Section 12(b) of the Act:
| Title of Each Class |
Name of Each Exchange on Which Registered | |
| Common Stock, par value $0.001 per share | The NASDAQ Stock Market LLC (NASDAQ Global Select Market) |
Securities registered pursuant to Section 12(g) of the Act: None
Indicate by check mark if the registrant is a well-known seasoned issuer, as defined in Rule 405 of the Securities Act. Yes ¨ No x
Indicate by check mark if the registrant is not required to file reports pursuant to Section 13 or Section 15(d) of the Act. Yes ¨ No x
Indicate by check mark whether the registrant (1) has filed all reports required to be filed by Section 13 or 15(d) of the Securities Exchange Act of 1934 during the preceding 12 months (or for such shorter period that the registrant was required to file such reports), and (2) has been subject to such filing requirements for the past 90 days. Yes x No ¨
Indicate by check mark whether the registrant has submitted electronically and posted on its corporate Web site, if any, every Interactive Data File required to be submitted and posted pursuant to Rule 405 of Regulation S-T during the preceding 12 months (or for such shorter period that the registrant was required to submit and post such files). Yes x No ¨
Indicate by check mark if disclosure of delinquent filers pursuant to Item 405 of Regulation S-K is not contained herein and will not be contained, to the best of registrant’s knowledge, in definitive proxy or information statements incorporated by reference in Part III of this Form 10-K or any amendment to this Form 10-K. ¨
Indicate by check mark whether the registrant is a large accelerated filer, an accelerated filer, a non-accelerated filer, or a smaller reporting company. See the definitions of “large accelerated filer,” “accelerated filer” and “smaller reporting company” in Rule 12b-2 of the Exchange Act. (Check one):
| Large accelerated filer | ¨ | Accelerated filer | x | |||
| Non-accelerated filer | ¨ (Do not check if a smaller reporting company) | Smaller reporting company | ¨ | |||
Indicate by check mark whether the registrant is a shell company (as defined in Rule 12b-2 of the Exchange Act). Yes ¨ No x
As of December 31, 2013, the aggregate market value of the voting stock held by non-affiliates of the registrant, based on the closing sale price of the Company’s common stock as reported by the NASDAQ Global Select Market on such date, was $301,515,627. For purposes of this disclosure, shares held by persons who hold more than 5% of the outstanding shares of common stock and shares held by executive officers and directors of the registrant have been excluded because such persons may be deemed to be affiliates. This determination of executive officer or affiliate status is not a conclusive determination for other purposes.
Number of shares of common stock outstanding as of September 5, 2014: 44,378,603
Documents Incorporated by Reference:
Portions of the registrant’s definitive proxy statement relating to its 2014 annual stockholders’ meeting are incorporated by reference into Part III of this Annual Report on Form 10-K where indicated.
Table of Contents
Index to Financial Statements
QUINSTREET, INC.
FOR THE FISCAL YEAR ENDED JUNE 30, 2014
| Page | ||||||
| PART I. | ||||||
| Item 1. | 3 | |||||
| Item 1A. | 12 | |||||
| Item 1B. | 30 | |||||
| Item 2. | 30 | |||||
| Item 3. | 30 | |||||
| Item 4. | 30 | |||||
| PART II. | ||||||
| Item 5. | 31 | |||||
| Item 6. | 33 | |||||
| Item 7. | Management’s Discussion and Analysis of Financial Condition and Results of Operations |
35 | ||||
| Item 7A. | 52 | |||||
| Item 8. | 54 | |||||
| Item 9. | Changes In and Disagreements with Accountants on Accounting and Financial Disclosure |
88 | ||||
| Item 9A. | 88 | |||||
| Item 9B. | 89 | |||||
| PART III. | ||||||
| Item 10. | 90 | |||||
| Item 11. | 90 | |||||
| Item 12. | Security Ownership of Certain Beneficial Owners and Management and Related Stockholder Matters |
90 | ||||
| Item 13. | Certain Relationships and Related Transactions, and Director Independence |
90 | ||||
| Item 14. | 90 | |||||
| PART IV. | ||||||
| Item 15. | 91 | |||||
| 92 | ||||||
2
Table of Contents
Index to Financial Statements
PART I
SPECIAL NOTE REGARDING FORWARD-LOOKING STATEMENTS
This report contains forward-looking statements. All statements other than statements of historical facts, including statements regarding our future financial condition, business strategy and plans and objectives of management for future operations, are forward-looking statements. Terminology such as “believe,” “may,” “might,” “objective,” “estimate,” “continue,” “anticipate,” “intend,” “should,” “plan,” “expect,” “predict,” “potential,” or the negative of these terms or other similar expressions is intended to identify forward-looking statements. We have based these forward-looking statements largely on our current expectations and projections about future events and financial trends that we believe may affect our financial condition, results of operations, business strategy and financial needs. These forward-looking statements are subject to a number of known and unknown risks and uncertainties that could cause our actual results to differ materially from those expressed or implied in our forward-looking statements. Such risks and uncertainties include, among others, those listed in Part 1, Item 1A. “Risk Factors” of this Annual Report on Form 10-K and elsewhere in this report, such as but not limited to:
| • | our emerging industry and relatively new business model; |
| • | changes in the economic condition, market dynamics, regulatory or legislative environment affecting our business or our clients’ businesses; |
| • | our dependence on Internet search companies to attract Internet visitors; |
| • | our dependence on unimpeded access to the Internet by us and Internet visitors; |
| • | our ability to accurately forecast our operating results and appropriately plan our expenses; |
| • | our ability to compete in our industry; |
| • | our ability to develop our websites to allow Internet visitors to access our websites through mobile devices; |
| • | our ability to develop new services and enhancements and features to meet new demands from our clients; and |
| • | our ability to successfully challenge regulatory audits, investigations or allegations of noncompliance with laws. |
Except as required by law, we undertake no obligation to update publicly any forward-looking statements for any reason to conform these statements to actual results or to changes in our expectations. Given these risks and uncertainties, readers are cautioned not to place undue reliance on such forward-looking statements, and we qualify all of our forward-looking statements by these cautionary statements.
Our Company
QuinStreet is a leader in performance marketing online. We have built a strong set of capabilities to engage Internet visitors with targeted media and to connect our marketing clients with their potential customers online. We focus on serving clients in large, information-intensive industry verticals where relevant, targeted media and offerings help visitors make informed choices, find the products that match their needs, and thus become qualified customer prospects for our clients. Presently, our primary client verticals are the education and financial services industries. We also have a presence in the business-to-business technology, home services and medical industries.
3
Table of Contents
Index to Financial Statements
We generate revenue by delivering measurable online marketing results to our clients. These results are typically in the form of qualified leads, clicks, calls or customers that are generated from our marketing activities on our websites or via third-party publishers with whom we have relationships. Clients primarily pay us for leads that they can convert into customers, typically in a call center or through other offline customer acquisition processes, or for clicks from our websites that they can convert into applications or customers on their websites. We are predominantly paid on a negotiated or market-driven “per lead” or “per click” basis. Media costs to generate qualified leads, clicks, calls or customers are borne by us as a cost of providing our services.
QuinStreet was incorporated in California on April 16, 1999 and reincorporated in Delaware on December 31, 2009. We have been a pioneer in the development and application of measurable marketing on the Internet. Clients pay us for the actual opt-in actions by prospects or customers that result from our marketing activities on their behalf, versus traditional impression-based advertising and marketing models in which an advertiser pays for more general exposure to an advertisement. We have been particularly focused on developing and delivering measurable marketing results in the search engine “ecosystem,” the entry point of the Internet for most of the visitors we convert into qualified leads, clicks, calls or customers for our clients. We own or partner with vertical content websites that attract Internet visitors from organic search engine rankings due to the quality and relevancy of their content to search engine users. We also acquire targeted visitors for our websites through the purchase of pay-per-click, or PPC, advertisements on search engines. We complement search engine companies by building websites with content and offerings that are relevant and responsive to their searchers, and by increasing the value of the PPC search advertising they sell by matching visitors with offerings and converting them into customer prospects for our clients.
Market Opportunity
Change in marketing strategy and approach
We believe that marketing approaches are changing as budgets shift from offline, analog advertising media to digital advertising media such as Internet marketing. These changing approaches are fundamental, and require a shift to fundamentally new competencies, including:
From qualitative, impression-driven marketing to analytic, data-driven marketing
Growth in Internet marketing is enabling a more data-driven approach to advertising. The measurability of online marketing allows marketers to collect a significant amount of detailed data on the performance of their marketing campaigns, including the effectiveness of ad format and placement and user responses. This data can then be analyzed and used to improve marketing campaign performance and cost-effectiveness on substantially shorter cycle times than with traditional offline media.
From account management-based client relationships to results-based client relationships
Marketers are becoming increasingly focused on strategies that deliver specific, measurable results. For example, marketers are attempting to better understand how their marketing spending produces measurable objectives such as meeting their target marketing cost per new customer. As marketers adopt more results-based approaches, the basis of client relationships with their marketing services providers is shifting from being more account management-based to being more results-oriented.
From marketing messages pushed on audiences to marketing messages pulled by self-directed audiences
Traditional marketing messages such as television and radio advertisements are broadcast to a broad audience. The Internet is enabling more self-directed and targeted marketing. For example, when Internet visitors click on PPC search advertisements, they are expressing an interest in and proactively engaging with information about a product or service related to that advertisement. The growth of self-directed marketing, primarily through
4
Table of Contents
Index to Financial Statements
online channels, allows marketers to present more targeted and potentially more relevant marketing messages to potential customers who have taken the first step in the buying process, which can in turn increase the effectiveness of marketers’ spending.
From marketing spending focused on large media buys to marketing spending optimized for fragmented media
We believe that media is becoming increasingly fragmented and that marketing strategies are changing to adapt to this trend. There are millions of Internet websites, tens of thousands of which have significant numbers of visitors. While this fragmentation can create challenges for marketers, it also allows for improved audience segmentation and the delivery of highly targeted marketing messages, but new technologies and approaches are necessary to effectively manage marketing given the increasing complexity resulting from more media fragmentation.
Increasing complexity of online marketing
Online marketing is a dynamic and increasingly complex advertising medium. There are numerous online channels for marketers to reach potential customers, including search engines, Internet portals, vertical content websites, affiliate networks, display and contextual ad networks, email, video advertising, and social media. We refer to these and other marketing channels as media. Each of these channels may involve multiple ad formats and different pricing models, amplifying the complexity of online marketing. We believe that this complexity increases the demand for our vertical marketing and media services due to our capabilities and to our experience managing and optimizing online marketing programs across multiple channels. Also, marketers and agencies often lack our ability to aggregate offerings from multiple clients in the same industry vertical, an approach that allows us to cover a wide selection of visitor segments and provide more potential matches to visitor needs. This approach can allow us to convert more Internet visitors into qualified leads, clicks, calls or customers from targeted media sources, giving us an advantage when buying or monetizing that media.
Our Business Model
We deliver cost-effective marketing results to our clients most typically in the form of a qualified lead or inquiry, in the form of a qualified click, or in the form of a call. Leads, clicks or calls can then convert into a customer or sale for clients at a rate that results in an acceptable marketing cost to them. We are paid typically by clients when we deliver qualified leads, clicks, calls or customers as defined by our agreements with them. References to the delivery of customers means the sale of completed customer transactions (e.g., bound insurance policies or customer appointments with clients). Because we bear the costs of media, our programs must deliver a value to our clients and provide for a media yield, or generation of acceptable margin on our media costs, that provides a sound financial outcome for us. To deliver leads, clicks, calls and customers to our clients, generally we:
| • | own or access targeted media; |
| • | run advertisements or other forms of marketing messages and programs in that media to create visitor responses in the form most typically of leads (visitor generated contact information and requests), clicks (to further qualification or matching steps, or to online client applications or offerings), or calls (to our owned and operated call centers or that of our clients or their agents); |
| • | match these leads, clicks, calls, or customers to client offerings or brands that we believe can meet visitor interests or needs, converting visitors into qualified leads, clicks, calls or customers for our clients; and |
| • | optimize client matches and media yield such that we achieve desired results for clients and a sound financial outcome for us. |
5
Table of Contents
Index to Financial Statements
Media cost, or the cost to attract targeted Internet visitors, is the largest cost input to producing the measurable marketing results we deliver to clients. Balancing our clients’ customer acquisition cost and conversion objectives — or the rate at which the leads, clicks or calls that we deliver to them convert into customers — with our media costs and yield objectives, represents the primary challenge in our business model. We have been able to effectively balance these competing demands by focusing on our media sources and capabilities, conversion optimization, and our mix of offerings and client coverage. We also seek to mitigate media cost risk by working with third-party publishers predominantly on a revenue-share basis; media purchased on a revenue-share basis has represented the majority of our media costs and of the Internet visitors we convert into qualified leads, clicks, calls or customers for clients, contributing significantly to our ability to maintain profitability.
Media and Internet visitor mix
We are a client-driven organization. We seek to be one of the largest providers of measurable marketing results on the Internet in the client industry verticals we serve by meeting the needs of clients for results, reliability and volume. Meeting those client needs requires that we maintain a diversified and flexible mix of Internet visitor sources due to the dynamic nature of online media. Our media mix changes with changes in Internet visitor usage patterns. We adapt to those changes on an ongoing basis, and also proactively adjust our mix of vertical media sources to respond to client or vertical-specific circumstances and to achieve our financial objectives. Generally, our Internet visitor sources include:
| • | websites owned and operated by us, with content and offerings that are relevant to our clients’ target customers; |
| • | visitors acquired from PPC advertisements purchased on major search engines and sent to our websites; |
| • | revenue sharing agreements with third-party publishers with whom we have a relationship and whose content or traffic is relevant to our clients’ target customers; |
| • | email lists owned by us or by third parties; and |
| • | advertisements run through online advertising networks, directly with major websites or portals, social media networks, or mobile networks, on a revenue-share or purchased basis. |
Conversion optimization
Once we acquire targeted Internet visitors from any of our numerous online media sources, we seek to convert that media into qualified leads, clicks, calls or customers at a rate that balances client results with our media costs or yield objectives. We start by providing Internet visitors with information and product offerings on our websites and in our marketing programs that we believe match their interests. Achieving acceptable client results and media yield then requires ongoing testing, measuring, analysis, feedback, and adaptation of the key components of our Internet marketing programs. These components include the marketing or advertising messaging, content mix, visitor navigation path, mix and coverage of client offerings presented, and point-of-sale conversion messaging — the content that is presented to an Internet visitor immediately prior to converting that individual into a lead or click or call or customer for our clients. This data complexity is managed by us with technology, data reporting, marketing processes, and personnel. We believe that our scale and more than fourteen-year track record give us an advantage, as managing this complexity often implies a steep experience-based learning curve.
Offerings and client coverage
The Internet is a self-directed medium. Internet visitors choose the websites they visit and their online navigation paths, and always have the option of clicking away to a different website or web page. Having offerings, content or clients that match the interests or needs of website visitors is key to providing results and
6
Table of Contents
Index to Financial Statements
adequate media yield. Our vertical focus allows us to continuously revise and improve this matching process, to better understand the various segments of visitors and client offerings available to be matched, and to ensure that we enable Internet visitors to find what they seek.
Our Competitive Advantages
Vertical focus and expertise
We focus our efforts on large, attractive client market verticals and on building our depth of media and coverage of clients and client offerings within them. We have been a pioneer in developing vertical marketing and media on the Internet and in providing measurable marketing results to clients. We focus on clients who are moving their marketing spending to measurable online formats and on information-intensive client verticals with large underlying market opportunities and high product or customer lifetime values. This focus allows us to utilize targeted media, in-depth industry and client knowledge, and customer segmentation and breadth of client offerings, or coverage, to deliver results for our clients, and greater media yield and buying power.
Measurable marketing experience, expertise and data
We have substantial experience at designing and deploying marketing programs that match Internet visitors to information or product offerings, and that can deliver economically attractive, measurable results to our clients, cost-effectively for us. Such results require frequent testing and balancing of numerous variables, including Internet visitor sources, mix of content and of client and product offerings, visitor navigation paths, prospect qualification, and advertising creative design, among others. The complexity of executing these marketing campaigns is challenging. Due to our scale and more than fourteen-year track record, we have successfully executed thousands of Internet marketing programs, and we have gained significant experience managing and optimizing this complexity to meet our clients’ volume, quality and cost objectives, while also achieving media yield and buying power requirements for our business model.
Targeted media
Targeted media attracts Internet visitors who are relatively narrowly focused demographically or in their interests. Targeted media can deliver better measurable marketing results for our clients, at lower media costs for us, due to higher rates of conversion of Internet visitors into leads, clicks, calls, or customers for targeted offerings and, often, due to less competition from display advertisers. We have significant experience at creating, identifying, partnering, monetizing, and managing targeted media on the Internet. This array of targeted media can represent a share of targeted traffic in our verticals on the Internet that is meaningful and attractive to clients. Many of the targeted media sources for our marketing programs are proprietary or more defensible because of our direct ownership of websites in our client verticals, our acquisition of targeted Internet visitors directly from search engines to our websites, and our relationships and media buying power advantages with media properties or sources owned by others. Examples of websites that we own and operate include Schools.com, OnlineDegrees.com, and AlliedHealthWorld.com in our education client vertical; CarInsurance.com, Insurance.com, Insure.com, CardRatings.com, and MoneyRates.com in our financial services client vertical; eWeek.com and ITBusinessEdge.com in our business-to-business technology client vertical; reliableremodeler.com and improvementcenter.com in our home services client vertical; and ElderCarelink.com in our medical client vertical.
Proprietary technology
We have developed a core technology platform and a common set of applications for managing and optimizing measurable marketing programs across multiple client verticals at scale. The primary objectives and effects of our technologies are to achieve higher media yield, deliver better results for our clients, and more efficiently and effectively manage our scale and complexity. We continuously strive to develop technologies that
7
Table of Contents
Index to Financial Statements
allow us to better match Internet visitors in our client verticals to the information, clients or product offerings visitors seek at scale. In so doing, our technologies can allow us to simultaneously improve visitor satisfaction, increase our media yield, and achieve higher rates of conversions of leads, clicks, calls or customers for our clients — a cycle of increased value for Internet visitors and our clients and competitive advantage for us. Some of the key applications in our technology platform are:
| • | an ad server for tracking the placement and performance of content, creative messaging, and offerings on our websites and on those of publishers with whom we work; |
| • | database-driven applications for dynamically matching content, offers or brands to Internet visitors’ expressed needs or interests; |
| • | a platform for measuring and managing the performance of tens of thousands of PPC search engine advertising campaigns; |
| • | dashboards or reporting tools for displaying operating and financial metrics for thousands of ongoing marketing campaigns; and, |
| • | a compliance tool capable of cataloging and filtering content from the thousands of websites on which our marketing programs appear to ensure adherence to client branding guidelines and to regulatory requirements. |
Approximately one-third of our employees are engineers, focused on building, maintaining and operating our technology platform.
Client relationships
We are a reliable source of measurably effective marketing results for our clients. We endeavor to work collaboratively and in a data-driven way with clients to improve our results for them. We believe our successful client relationships are due to:
| • | our close, often direct, relationships with most of our large clients; |
| • | our ability to deliver measurable and attractive return on investment, or ROI, on clients’ marketing spending; |
| • | our ownership of, or access to large amounts of, targeted media inventory and associated Internet visitors in the client verticals on which we focus; and |
| • | our ability to consistently and reliably deliver large quantities of qualified leads, clicks, calls or customers. |
As our high client retention rates, combined with our depth and breadth of online media in our primary client verticals indicate, we are an important marketing channel partner for our clients.
Client-driven online marketing approach
We focus on providing measurable Internet marketing and media services to our clients in a way that seeks to protect and enhances their brands and their relationships with prospective customers. The Internet marketing programs we execute are designed to adhere to strict client branding and regulatory guidelines, and are intended to match our clients’ brands and offers with expressed customer interest. We have contractual arrangements with third-party publishers to ensure that they follow our clients’ brand guidelines, and we utilize our proprietary technologies and trained personnel to help ensure compliance. In addition, we believe that providing relevant, helpful content and client offers that match an Internet visitor’s self-selected interest in a product or service, such as requesting information about an education program or financial product, makes that visitor more likely to convert into a customer for our clients. We do not engage in online marketing practices such as spyware or deceptive promotions, as we believe that these do not provide value to Internet visitors and can undermine our clients’ brands.
8
Table of Contents
Index to Financial Statements
Acquisition strategy and success
We have successfully acquired vertical online marketing and media companies, including vertical website businesses, marketing services companies, and technologies. Our scale, breadth of capabilities and common technology platform have historically enabled us to integrate and generate value from acquisitions through our:
| • | ability to monetize Internet media, coupled with client demand for our services, providing us with a particular advantage in acquiring targeted online media properties in the client verticals on which we focus; |
| • | capabilities in online media allowing us to generate a greater volume of leads, clicks, calls or customers, and therefore create more value, than other owners of marketing services companies that have aggregated client budgets or relationships; and |
| • | application of technologies across our business volume to create more value than previous owners of the technology. |
Scale
We are one of the largest Internet performance marketing companies in the world. Our scale allows us to better meet the needs of large clients for reliability, volume and quality of service. It allows us to invest more in technologies that improve media yield, client results and our operating efficiency. We are also able to invest more in other forms of research and development, including determining and developing new types of vertical media, new approaches to engaging website visitors, and new segments of Internet visitors and client budgets, all of which can lead to advantages in media costs, and effectiveness in delivering client results.
Our Strategy
Our goal is to continue to be one of the largest and most successful performance marketing companies on the Internet, and eventually in other digitized media forms. We believe that we are in the early stages of a very large and long-term business opportunity. Our strategy for pursuing this opportunity includes the following key components:
| • | focus on generating sustainable revenues by providing measurable value to our clients; |
| • | build QuinStreet and our industry sustainably by behaving ethically in all we do and by providing quality content and website experiences to Internet visitors; |
| • | remain vertically focused, choosing to grow through depth, expertise and coverage in our current client verticals; enter new client verticals selectively over time, organically and through acquisitions; |
| • | build a world class organization, with best-in-class capabilities for delivering measurable marketing results to clients and high yields or returns on media costs; |
| • | develop and evolve the best technologies and platform for managing vertical marketing and media on the Internet; focus on technologies that enhance media yield, improve client results and achieve scale efficiencies; |
| • | build, buy and partner with vertical content websites that provide the most relevant and highest quality visitor experiences in the client and media verticals we serve; and |
| • | be a client-driven organization; develop a broad set of media sources and capabilities to reliably meet client needs. |
Clients
In fiscal years 2014, 2013 and 2012, no client comprised more than 10% of annual net revenue, and our top 20 clients accounted for 52%, 52% and 54% of net revenue. Since our service was first offered in 2001, we have
9
Table of Contents
Index to Financial Statements
developed a broad client base with many multi-year relationships. We enter into Internet marketing contracts with our clients, most of which are cancelable with little or no prior notice. In addition, these contracts do not contain penalty provisions for cancellation before the end of the contract term.
Sales and Marketing
We have an internal sales team that consists of employees focused on signing new clients and account managers who maintain and seek to increase our business with existing clients. Our sales people and account managers are each focused on a particular client vertical so that they develop an expertise in the marketing needs of our clients in that particular vertical.
Our marketing programs include attendance at trade shows and conferences and limited advertising.
Technology and Infrastructure
We have developed a suite of technologies to manage, improve and measure the results of the marketing programs we offer our clients. We use a combination of proprietary and third-party software as well as hardware from established technology vendors. We use specialized software for client management, building and managing websites, acquiring and managing media, managing our third-party publishers, and the matching of Internet visitors to our marketing clients. We have invested significantly in these technologies and plan to continue to do so to meet the demands of our clients and Internet visitors, to increase the scalability of our operations, and enhance management information systems and analytics in our operations. Our development teams work closely with our marketing and operating teams to develop applications and systems that can be used across our business. In fiscal years 2014, 2013 and 2012, we spent $19.5 million, $19.0 million and $21.1 million on product development.
Our primary data center is at a third-party co-location center in San Francisco, California. All of the critical components of the system are redundant, and we have a backup data center in Las Vegas, Nevada. We have implemented these backup systems and redundancies to minimize the risk associated with earthquakes, fire, power loss, telecommunications failure, and other events beyond our control.
Intellectual Property
We rely on a combination of patent, trade secret, trademark and copyright laws in the United States and other jurisdictions together with confidentiality agreements and technical measures to protect the confidentiality of our proprietary rights. To protect our trade secrets, we control access to our proprietary systems and technology and enter into confidentiality and invention assignment agreements with our employees and consultants and confidentiality agreements with other third parties. QuinStreet is a registered trademark in the United States and other jurisdictions. We also have registered and unregistered trademarks for the names of many of our websites, and we own the domain registrations for our many website domains.
Our Competitors
Our primary competition falls into two categories: advertising and direct marketing services agencies, and online marketing and media companies. We compete for business on the basis of a number of factors including return on marketing expenditures, price, access to targeted media, ability to deliver large volumes or precise types of customer prospects, and reliability.
Advertising and direct marketing services agencies
Online and offline advertising and direct marketing services agencies control the majority of the large client marketing spending for which we primarily compete. So, while they are sometimes our competitors, agencies are
10
Table of Contents
Index to Financial Statements
also often our clients. We compete with agencies to attract marketing budget or spending from offline forms to the Internet or, once designated to be spent online, to be spent with us versus the agency or by the agency with others. When spending online, agencies spend with QuinStreet and with portals, other websites and ad networks.
Online marketing and media companies
We compete with other Internet marketing and media companies, in many forms, for online marketing budgets. Most of these competitors compete with us in one vertical. Examples include BankRate in the financial services client vertical and Education Dynamics in the education client vertical. Some of our competition also comes from agencies or clients spending directly with larger websites or portals, including Google, Yahoo! and Microsoft.
Government Regulation
We provide services through a number of different online and offline channels. As a result, we are subject to many Federal and state laws and regulations, including restrictions on the use of unsolicited commercial email, such as the CAN-SPAM Act and state email marketing laws, and restrictions on the use of marketing activities conducted by telephone, including the Telemarketing Sales Rule (the “TSR”) and the Telephone Consumer Protection Act (the “TCPA”). Our business is also subject to Federal and state laws and regulations regarding privacy, search engines, Internet tracking technologies, direct marketing, data security, data privacy, pricing, sweepstakes, promotions, intellectual property ownership and infringement, trade secrets, export of encryption technology, acceptable content and quality of goods, and taxation, among others.
In addition, we provide services to a number of our clients that operate in highly regulated industries, particularly in our education and financial services verticals. Historically, we have generated nearly half of our revenue from our education client vertical, and nearly all of that revenue was generated from post-secondary educational institutions. Post-secondary educational institutions are subject to extensive Federal and state regulations, including the Higher Education Act, Department of Education regulations and individual state higher education regulations. The regulations govern many aspects of these clients’ operations, including marketing and recruiting activities, as well as the school’s eligibility to participate in Title IV Federal student financial aid programs, which is the principal source of funding for many of our education clients. There have been significant changes to these regulations in the recent past, and a high level of regulatory activity and heightened legislative scrutiny is expected to continue in the post-secondary education sector. In our financial services vertical, our websites and marketing services are subject to various Federal, state and local laws, including state licensing laws, Federal and state laws prohibiting unfair acts and practices, and Federal and state advertising laws. In addition, we are a licensed insurance agent in all fifty states. The costs of compliance with these and new laws may increase in the future and any failure on our part to comply with such laws may subject us to significant liabilities.
Employees
As of June 30, 2014, we had 667 employees, which consisted of 191 employees in product development, 63 in sales and marketing, 46 in general and administration and 367 in operations. None of our employees is represented by a labor union, except for our employees in Brazil who are represented by a union as required by Brazilian law.
Available Information
We file reports with the Securities and Exchange Commission (“SEC”), including annual reports on Form 10-K, quarterly reports on Form 10-Q, current reports on Form 8-K and other filings required by the SEC. We make these reports and filings available free of charge on our website via the investor relations page on www.quinstreet.com as soon as reasonably practicable after such material is electronically filed with or furnished
11
Table of Contents
Index to Financial Statements
to the SEC. We also webcast our earnings calls and certain events we host with members of the investment community on our investor relations page at http://investor.quinstreet.com. The content of our website is not intended to be incorporated by reference into this report or in any other report or document we file, and any reference to this website and others included in this report is intended to be an inactive textual reference only.
The public may read and copy any materials we file with the SEC at the SEC’s Public Reference Room at 100 F Street, NE, Washington, DC 20549. The public may obtain information on the operation of the Public Reference Room by calling the SEC at 1-800-SEC-0330. The SEC maintains an Internet site (http://www.sec.gov) that contains reports, proxy and information statements, and other information regarding issuers that file electronically with the SEC.
Investing in our common stock involves a high degree of risk. You should carefully consider the risks described below and the other information in this periodic report. If any of such risks actually occur, our business, results of operations or financial condition could be adversely affected. In those cases, the trading price of our common stock could decline and you may lose all or part of your investment.
Risks Related to Our Business and Industry
We operate in an emerging industry and have a relatively new business model, which makes it difficult to evaluate our business and prospects.
We derive nearly all of our revenue from the sale of online marketing and media services, which is an emerging industry that has undergone rapid and dramatic changes in its relatively short history and which is characterized by rapidly-changing Internet media, evolving industry standards, regulatory uncertainty, and changing user and client demands. As a result, we face risks and uncertainties such as but not limited to:
| • | our emerging industry and relatively new business model; |
| • | changes in the economic condition, market dynamics, regulatory or legislative environment affecting our business or our clients’ businesses; |
| • | our dependence on Internet search companies to attract Internet visitors; |
| • | our dependence on unimpeded access to the Internet by us and Internet visitors; |
| • | our ability to accurately forecast our results of operations and appropriately plan our expenses; |
| • | our ability to compete in our industry; |
| • | our ability to develop our websites to allow Internet visitors to access our websites through mobile devices; |
| • | our ability to develop new services and enhancements and features to meet new demands from our clients; and |
| • | our ability to successfully challenge regulatory audits, investigations or allegations of noncompliance with laws. |
If we are unable to address these risks, our business, results of operations and prospects could suffer.
Negative changes in the economic condition, market dynamics or regulatory environment have caused, and may continue to cause, our revenue to decline and our business and growth to suffer.
Adverse macroeconomic conditions could cause decreases or delays in spending by our advertisers and could harm our ability to generate revenue and our results of operations. Moreover, to date, we have generated a large majority of our revenue from clients in our education and financial services client verticals. We expect that
12
Table of Contents
Index to Financial Statements
a majority of our revenue, at least in the near term, will continue to be generated from clients in our education and financial services client verticals. Changes in the market conditions or the regulatory environment in these two highly-regulated client verticals in particular have negatively impacted, and may continue to negatively impact, our clients’ businesses, marketing practices and budgets and, therefore, our financial results.
Our and our clients’ businesses are subject to many regulatory requirements. Current or future regulations could have a material adverse effect on our business, results of operations and financial condition.
Our business is subject to many laws and regulatory requirements, including Federal, state, and local laws and regulations regarding unsolicited commercial email, telemarketing, user privacy, search engines, Internet tracking technologies, direct marketing, data security, data privacy, pricing, sweepstakes, promotions, intellectual property ownership and infringement, trade secrets, export of encryption technology, acceptable content and quality of goods, and taxation, among others. Each of our education, financial services and other client verticals is also subject to various laws and regulations, and our marketing activities on behalf of our clients are regulated. Many of these laws are frequently changing, and keeping our business in compliance with or bringing our business into compliance with new laws may be costly, affect our revenue and harm our financial results. Violations or alleged violations of laws by us, our third-party publishers or clients could result in damages, fines, criminal prosecution, unfavorable publicity, and restrictions on our ability to operate, any of which could have a material adverse effect on our business, results of operations and financial condition. In addition, new laws or regulations or changes in enforcement of existing laws or regulations applicable to our clients could affect the activities or strategies of our clients and, therefore, lead to reductions in their level of business with us.
For example, the Federal Communications Commission recently amended the Telephone Consumer Protection Act that affects telemarketing calls. Certain provisions of the regulations became effective in July 2012, and additional regulations requiring prior express written consent for certain types of telephonic communications became effective in October 2013. Our efforts to comply with the TCPA has not had a material impact on traffic conversion rates. However, depending on future traffic and product mix, it could potentially have a material effect on our revenue and profitability. Additionally, we generate leads from which customers provide a wireless number, and in turn a significant amount of revenue comes from calls made by our internal call centers as well as by third-party call centers. We also purchase a portion of our lead data from third-party publishers and cannot guarantee that these third-parties will comply with the regulations. Any failure by us or the third-party publishers on which we rely for telemarketing, email marketing and other lead generation activities to adhere to or successfully implement appropriate processes and procedures in response to existing regulations and changing regulatory requirements could result in legal liability or damage to our reputation in the marketplace, either of which could have a material adverse effect on our business, results of operations and financial condition. Furthermore, our clients may make business decisions based on their own experiences with the TCPA regardless of our products and the changes we implemented to comply with the new regulations. These decisions may negatively affect our revenue or profitability.
From time to time, we are subject to audits, inquiries, investigations, claims of non-compliance and lawsuits by Federal and state governmental agencies, regulatory agencies, attorneys general, and other governmental or regulatory bodies, any of whom may allege violations of legal requirements. For example, in June 2012, we entered into an Assurance of Voluntary Compliance agreement following a civil investigation into certain of our marketing practices related to our education client vertical that was conducted by the attorneys general of a number of states. If the results of any future investigations, audits, inquiries, claims or litigation are unfavorable to us, we may be required to pay monetary fines or penalties or have restrictions placed on our business, which could materially adversely affect our business, financial condition, results of operations, and cash flows.
Federal and state regulations governing clients in our education vertical have negatively affected, and may continue to negatively affect, our clients’ businesses, marketing practices and budgets, any or all of which could have a material adverse effect on our financial results.
Historically, we have generated nearly half of our revenue from our education client vertical, and nearly all of that revenue was generated from post-secondary educational institutions. Post-secondary educational institutions are
13
Table of Contents
Index to Financial Statements
subject to extensive Federal and state regulations, including the Higher Education Act, Department of Education regulations and individual state higher education regulations. The regulations govern many aspects of these clients’ operations, including marketing and recruiting activities, as well as the school’s eligibility to participate in Title IV Federal student financial aid programs, which is the principal source of funding for many of our education clients. There have been significant changes to these regulations in the recent past, and a high level of regulatory activity and heightened legislative scrutiny is expected to continue in the post-secondary education sector. For example, in June 2014, the Department of Education imposed certain restrictions on access to Federal student aid for one of our for-profit education clients, Corinthian Colleges Inc., pending an investigation of the company’s marketing and recruiting activities. Changes in, or new interpretations of, applicable laws, regulations, standards or policies applicable to these clients could have a material adverse effect on their accreditation, authorization to operate in various states, or receipt of funds under Title IV programs, any of which, in turn, may harm our ability to generate revenue from these clients and our financial results.
We depend on third-party publishers for a significant portion of our visitors. Any decline in the supply of media available through these websites or increase in the price of this media could cause our revenue to decline or our cost to reach visitors to increase.
A significant portion of our revenue is attributable to visitor traffic originating from third-party publishers. In many instances, third-party publishers can change the media inventory they make available to us at any time and, therefore, impact our results of operations. In addition, third-party publishers may place significant restrictions on our offerings. These restrictions may prohibit advertisements from specific clients or specific industries, or restrict the use of certain creative content or formats. If a third-party publisher decides not to make media inventory available to us, or decides to demand a higher revenue share or places significant restrictions on the use of such inventory, we may not be able to find media inventory from other websites that satisfy our requirements in a timely and cost-effective manner. In addition, the number of competing online marketing service providers and advertisers that acquire inventory from websites continues to increase. Consolidation of Internet advertising networks and third-party publishers could eventually lead to a concentration of desirable inventory on websites or networks owned by a small number of individuals or entities, which could limit the supply or impact the pricing of inventory available to us. For example, since 2012, our revenue has declined in our financial services client vertical primarily due to volume declines caused by losses of available media from third-party publishers acquired by competitors, changes in search engine algorithms which reduced or eliminated traffic from some third-party publishers and increased competition for quality media. We cannot assure you that we will be able to acquire media inventory that meets our clients’ performance, price and quality requirements, in which case our revenue could decline or our operating costs could increase.
Our results of operations have fluctuated in the past and may do so in the future, which makes our results of operations difficult to predict and could cause our results of operations to fall short of analysts’ and investors’ expectations.
Historically, quarterly and annual results of operations have fluctuated due to changes in our business, our industry and the general economic climate. We expect our future results of operations to vary significantly from quarter to quarter due to a variety of factors, many of which are beyond our control. Our fluctuating results of operations could cause our performance and outlook to be below the expectations of securities analysts and investors, causing the price of our common stock to fall. Our business is changing and evolving, and, as a result, our historical results of operations may not be useful to you in predicting our future results of operations. Factors that may increase the volatility of our results of operations include the following:
| • | changes in client volume; |
| • | loss of or reduced demand by existing clients; |
| • | the availability and price of quality media; |
| • | consolidation of media sources; |
14
Table of Contents
Index to Financial Statements
| • | changes in search engine algorithms that affect our and our publishers’ websites; and |
| • | regulatory and legislative changes. |
As a result of changes in our business model and increased expenditures for certain businesses, products, services and technologies, we anticipate downward pressure on our Adjusted EBITDA margin.
We have invested and expect to continue to invest in new businesses, products, services and technologies, including more expensive forms of media. We may have insufficient revenue to fully offset liabilities and expenses in connection with these investments and may experience inadequate, unpredictable return of capital on our investments. As a result of these investments, we expect downward pressure on our Adjusted EBITDA margin.
We depend upon Internet search providers to direct a significant portion of the visitors to our and our third-party publishers’ websites. Changes in search engine algorithms have in the past and may in the future harm the websites’ placements in both paid and organic search result listings, which may cause the number of visitors to our websites and, our third-party publishers’ websites as well as our revenue to decline.
Our success depends on our ability to attract online visitors to our and our third-party publishers’ websites and convert them into prospects for our clients in a cost-effective manner. We depend on Internet search providers to direct a substantial share of visitors to our websites. Search providers offer two types of search results: organic and paid listings. Organic listings are displayed based solely on formulas designed by the search companies. Paid listings are displayed based on a combination of the advertiser’s bid price for particular keywords and the search engines’ assessment of the website’s relevance and quality.
Our ability to maintain or grow the number of visitors to our websites from search providers is not entirely within our control. Search providers frequently revise their algorithms and changes in their algorithms could cause our websites to receive less favorable placements. We have experienced fluctuations in organic rankings for a number of our websites and some of our paid listing campaigns have also been harmed by search engine algorithmic changes. Search providers could determine that our or our third-party publishers’ websites’ content is either not relevant or is of poor quality.
In addition, we may fail to optimally manage our paid listings, or our proprietary bid management technologies may fail. To attract and retain visitors, we use search engine optimization (“SEO”) which involves developing content to optimize ranking in search engine results. Our ability to successfully manage SEO efforts across our owned and operated websites and our third-party publishers’ websites depends on our timely and effective modification of SEO practices implemented in response to periodic changes in search engine algorithms and methodologies and changes in search query trends. If we fail to successfully manage our SEO strategy, our websites may receive less favorable placement in organic or paid listings, which would reduce the number of visitors to our sites, decrease conversion rates and repeat business and have a detrimental effect on our ability to generate revenue. If visits to our websites decrease, we may need to use more costly sources to replace lost visitors, and such increased expense could adversely affect our business and profitability. Even if we succeed in driving traffic to our owned and operated websites and to our clients’ websites, we may not be able to effectively monetize this traffic or otherwise retain customers. Our failure to do so could result in lower advertising revenue from our owned and operated websites as well as third-party publishers’ websites, which would have an adverse effect on our business, financial condition and results of operations.
If we fail to compete effectively against other online marketing and media companies and other competitors, we could lose clients and our revenue may decline.
The market for online marketing is intensely competitive, and we expect this competition to continue to increase in the future both from existing competitors and, given the relatively low barriers to entry into the
15
Table of Contents
Index to Financial Statements
market, from new competitors. We compete both for clients and for limited high-quality media. We compete for clients on the basis of a number of factors, including return on investment of client’s marketing spending, price and client service.
We compete with Internet and traditional media companies for a share of clients’ overall marketing budgets, including:
| • | online marketing or media services providers such as Education Dynamics in the education client vertical and BankRate in the financial services client vertical; |
| • | offline and online advertising agencies; |
| • | major Internet portals and search engine companies with advertising networks; |
| • | other online marketing service providers, including online affiliate advertising networks and industry-specific portals or lead generation companies; |
| • | third-party publishers with their own sales forces that sell their online marketing services directly to clients; |
| • | in-house marketing groups and activities at current or potential clients; |
| • | offline direct marketing agencies; |
| • | mobile and social media; and |
| • | television, radio and print companies. |
Competition for web traffic among websites and search engines, as well as competition with traditional media companies, has resulted and may continue to result in significant increases in media pricing, declining margins, reductions in revenue, and loss of market share. In addition, if we expand the scope of our services, we may compete with a greater number of websites, clients and traditional media companies across an increasing range of different services, including in vertical markets where competitors may have advantages in expertise, brand recognition and other areas. Internet search companies with brand recognition, such as Google, Yahoo! and Microsoft, have significant numbers of direct sales personnel and substantial proprietary advertising inventory and web traffic that provide a significant competitive advantage and have a significant impact on pricing for Internet advertising and web traffic. Some of these companies may offer or develop more vertically targeted products that match customers with products and services and, thus, compete with us more directly. The trend toward consolidation in online marketing may also affect pricing and availability of media inventory and web traffic. Many of our current and potential competitors also enjoy other competitive advantages over us, such as longer operating histories, greater brand recognition, larger client bases, greater access to advertising inventory on high-traffic websites, and significantly greater financial, technical and marketing resources. As a result, we may not be able to compete successfully. Competition from other marketing service providers’ online and offline offerings has affected and may continue to affect both volume and price, and, thus, revenue, profit margins and profitability. If we fail to deliver results that are superior to those that other online marketing service providers deliver to clients, we could lose clients, and our revenue may decline.
More people are using mobile devices to access the internet. If we fail to develop our websites to keep pace with this shift in user devices, we may not remain competitive and could lose clients or advertising inventory.
The number of people who access the Internet through mobile devices such as smart phones and tablets has increased dramatically in the past few years, and we expect the trend to continue. Our online marketing services and content were originally designed for desktop or laptop computers. The shift from desktop or laptop computers to mobile devices could potentially deteriorate the user experience for visitors to our websites and may make it more difficult for visitors to respond to our offerings. It may also require us to develop new offerings specifically
16
Table of Contents
Index to Financial Statements
designed for mobile devices. Additionally, the monetization of our online marketing services and content on these mobile devices might not be as lucrative for us compared to those on desktop and laptop computers. If we fail to develop our websites cost effectively and improve the monetization capabilities of our mobile marketing services, we may not remain competitive, which may negatively affect our business and results of operations.
A reduction in online marketing spend by our clients, a loss of clients or lower advertising yields may seriously harm our business, financial condition and results of operations. In addition, a substantial portion of our revenue is generated from a limited number of clients and, if we lose a major client, our revenue will decrease and our business and prospects may be harmed.
We rely on clients’ marketing spend on our owned and operated websites and on our network of third-party publisher websites. We have historically derived, and we expect to continue to derive, the majority of our revenue through the delivery of qualified leads, clicks, calls and customers. One component of our platform that we use to generate client interest is our system of monetization tools, which is designed to match content with client offerings in a manner that optimizes revenue yield and end-user experience. Clients will stop spending marketing funds on our owned and operated websites or our third-party publisher websites if their investments do not generate sales leads, and ultimately customers or if we do not deliver advertisements in an appropriate and effective manner. The failure of our yield-optimized monetization technology to effectively match advertisements or client offerings with our content in a manner that results in increased revenue for our clients would have an adverse impact on our ability to maintain or increase our revenue from client marketing spend.
Even if our content is effectively matched with advertisements or client offerings, our current clients may not fulfill their obligations under their existing contracts with us and they may not continue to place marketing spend or advertisements on our websites beyond the terms of their existing contracts. If any of our clients decided not to continue marketing spend or advertising on our owned and operated websites or on our third-party publisher websites, we could experience a rapid decline in our revenue over a relatively short period of time. Any factors that limit the amount our clients are willing to and do spend on marketing or advertising with us, or to purchase leads from us, could have a material adverse effect on our business.
Furthermore, a substantial portion of our revenue is generated from a limited number of clients. None of our clients account for 10% or more of our revenue. However, we have a few clients that account for a large portion of our net revenue for the fiscal year ended June 30, 2014. Our clients can generally terminate their contracts with us at any time, with limited prior notice or penalty. Clients who have longer-term contracts may fail to honor their existing contracts, fail to renew their contracts or reduce their level of business with us, leading to lower revenue.
In addition, reductions in business by one or more significant clients may trigger price reductions for our other clients whose prices for certain products are determined in whole or in part by client bidding or competition. Any such price reduction could result in lower revenue. We expect that a limited number of clients will continue to account for a significant percentage of our revenue, and the loss of any one of these clients, or material reduction in their marketing spending with us, could decrease our revenue and harm our business.
We rely on our management team and other key employees, and the loss of one or more key employees could harm our business.
Our success and future growth depend upon the continued services of our management team, including Douglas Valenti, Chief Executive Officer, and other key employees in all areas of our organization. From time to time, there may be changes in our key employees resulting from the hiring or departure of executives and employees, which could disrupt our business. We have experienced declines in our business and a depressed stock price, making our equity and cash incentive compensation programs less attractive to current and potential key employees. If we lose the services of key employees or if we are unable to attract and retain additional qualified employees, our business and growth could suffer.
17
Table of Contents
Index to Financial Statements
Third-party publishers or vendors may engage in unauthorized or unlawful acts that could subject us to significant liability or cause us to lose clients.
We generate a significant portion of our web visitors from online media that we purchase from third-party publishers. We also rely on third-party call centers and email marketers. Some of these third-parties are authorized to use our clients’ brands, subject to contractual restrictions. Any activity by third-party publishers or vendors that clients view as potentially damaging to their brands can harm our relationship with the client and cause the client to terminate its relationship with us, resulting in a loss of revenue. In addition, we may also face liability for any failure of our third-party publishers or vendors to comply with regulatory requirements, as further described in the risk factor beginning, “Our business is subject to many regulatory requirements, and current or future regulation could have a material adverse effect on our business, results of operations and financial condition.”
The law is unsettled on the extent of liability that an advertiser in our position has for the activities of third-party publishers or vendors. Recent Department of Education regulations impose strict liability on our education clients for misrepresentations made by their marketing service providers. In addition, certain of our contracts impose liability on us for the acts of our third-party publishers or vendors. We could be subject to costly litigation and, if we are unsuccessful in defending ourselves, we could incur damages for the unauthorized or unlawful acts of third-party publishers or vendors.
We gather, transmit and store consumer personally identifiable information and unauthorized access to or accidental disclosure of this information may cause us to incur significant expenses and may negatively affect our reputation and business.
We gather, transmit and store consumer personally identifiable information. This information may include social security numbers, credit scores, credit card information, and financial and health information, some of which is held and managed by our third-party vendors. As a result, we are subject to certain contractual terms, including third-party security reviews, as well as Federal, state and foreign laws and regulations designed to protect personally identifiable information. Despite our implementation of security measures and controls, our computer systems may be susceptible to electronic or physical computer break-ins, viruses and other disruptions and security breaches. In the past, we have experienced security incidents involving access to our user databases. Although, to our knowledge, no sensitive financial or personal information has been compromised in the past, any future security incidents could result in the compromise of such data and subject us to liability or result in cancellation of client contracts. In addition, the increased use of mobile devices by our employees increases the risk of unintentional disclosure of personally identifiable information. Any perceived or actual unauthorized disclosure of personally identifiable information, whether through breach of our network by an unauthorized party, employee theft, misuse, or error could harm our reputation, impair our ability to attract website visitors and to attract and retain our clients, or subject us to claims or litigation arising from damages suffered by consumers, and thereby harm our business and results of operations. In addition, we could incur significant costs in complying with the multitude of state, Federal and foreign laws regarding personally identifiable information.
If we fail to continually enhance and adapt our products and services to keep pace with rapidly changing technologies and industry standards, we may not remain competitive and could lose clients or advertising inventory.
The online media and marketing industry is characterized by rapidly changing standards, changing technologies, frequent new product and service introductions, and changing user and client demands. The introduction of new technologies and services embodying new technologies and the emergence of new industry standards and practices could render our existing technologies and services obsolete and unmarketable or require unanticipated investments in technology. We continually make enhancements and other modifications to our proprietary technologies, and these changes may contain design or performance defects that are not readily apparent. If our proprietary technologies fail to achieve their intended purpose or are less effective than technologies used by our competitors, our business could be harmed.
18
Table of Contents
Index to Financial Statements
Our future success will depend in part on our ability to successfully adapt to these rapidly changing online media formats and other technologies. If we fail to adapt successfully, we could lose clients or advertising inventory.
Acquisitions and investments could complicate operations, or could result in dilution and other harmful consequences that may adversely impact our business and results of operations.
Acquisitions have historically been an important element of our overall corporate strategy and use of capital. Any possible future acquisitions could be material to our financial condition and results of operations. We may evaluate and enter into discussions regarding a wide array of potential strategic transactions. The process of integrating an acquired company, business or technology has created, and will continue to create, unforeseen operating difficulties and expenditures. The areas where we face risks include:
| • | diversion of management time and focus from operating our business to acquisition integration challenges; |
| • | failure to successfully further develop the acquired business or technology; |
| • | implementation or remediation of controls, procedures and policies at the acquired company; |
| • | integration of the acquired company’s accounting, human resource, and other administrative systems, and coordination of product, engineering and sales and marketing functions; |
| • | transition of operations, users and customers onto our existing platforms; |
| • | failure to obtain required approvals on a timely basis, if at all, from governmental authorities, or conditions placed upon approval, under competition and antitrust laws which could, among other things, delay or prevent us from completing a transaction, or otherwise restrict our ability to realize the expected financial or strategic goals of an acquisition; |
| • | in the case of foreign acquisitions, the need to integrate operations across different cultures and languages and to address the particular economic, currency, political and regulatory risks associated with specific countries; |
| • | cultural challenges associated with integrating employees from the acquired company into our organization, and retention of employees from the businesses we acquire; |
| • | liability for activities of the acquired company before the acquisition, including patent and trademark infringement claims, violations of laws, commercial disputes, tax liabilities and other known and unknown liabilities; and |
| • | litigation or other claims in connection with the acquired company, including claims from terminated employees, customers, former stockholders or other third-parties. |
Our failure to address these risks or other problems encountered in connection with our past or future acquisitions and investments could cause us to fail to realize the anticipated benefits of such acquisitions or investments, incur unanticipated liabilities and harm our business generally.
Future acquisitions could also result in dilutive issuances of our equity securities, the incurrence of debt, contingent liabilities, amortization expenses, impairment of goodwill or restructuring charges, any of which could harm our financial condition or results. Also, the anticipated benefit of many of our acquisitions may not materialize.
We rely on certain advertising agencies for the purchase of various advertising and marketing services on behalf of their clients. Such agencies may have or develop high-risk credit profiles, which may result in credit risk to us.
A portion of our client business is sourced through advertising agencies and, in many cases, we contract with these agencies and not directly with the underlying client. Contracting with these agencies subjects us to
19
Table of Contents
Index to Financial Statements
greater credit risk than where we contract with clients directly. In many cases, agencies are not required to pay us unless and until they are paid by the underlying client. In addition, many agencies are thinly capitalized and have or may develop high-risk credit profiles. This credit risk may vary depending on the nature of an agency’s aggregated client base. If an agency became insolvent, or if an underlying client did not pay the agency, we may be required to write off account receivables as bad debt. Any such write-offs could have a materially negative effect on our results of operations for the periods in which the write-offs occur.
We have a significant amount of debt, which may limit our ability to fund general corporate requirements and obtain additional financing, limit our flexibility in responding to business opportunities and competitive developments and increase our vulnerability to adverse economic and industry conditions.
As of June 30, 2014, we had debt with a principal balance of $77.5 million. As a result of obligations associated with our debt, we may not have sufficient liquidity:
| • | to respond to business opportunities, competitive developments and adverse economic conditions; |
| • | to fund all of our costs if our revenue declines or costs increase; and |
| • | to repay the principal balance of our debt when due. |
Our debt obligations may also impair our ability to obtain additional financing, if needed. Our indebtedness is secured by substantially all of our assets, leaving us with limited collateral for additional financing. Moreover, the terms of our indebtedness restrict our ability to take certain actions, including the incurrence of additional indebtedness, certain mergers and acquisitions, investments, asset sales, dividends, and stock repurchases. In addition, even if we are able to raise needed equity financing, we are required to use a portion of the net proceeds of certain types of equity financings to repay the outstanding balance of our term loan. A failure to pay interest or indebtedness when due could result in a variety of adverse consequences, including the acceleration of our indebtedness. In such a situation, it is unlikely that we would be able to fulfill our obligations under our credit facility or repay the accelerated indebtedness or otherwise cover our costs.
Damage to our reputation could harm our business, financial condition and results of operations.
Our business is dependent on attracting a large number of visitors to our and our third-party publishers’ websites and providing leads, clicks, calls, and customers to our clients, which depends in part on our reputation within the industry and with our clients. Certain other companies within our industry regularly engage in activities that others may view as unlawful or inappropriate. These activities by third-parties, such as spyware or deceptive promotions, may be seen as characteristic of participants in our industry and, therefore, may harm the reputation of all participants in our industry, including us.
Our ability to attract potential customers and, thereby, clients, also depends in part on customers receiving competitive levels of customer service, responsiveness and prices from our lead purchaser clients. If our clients do not provide competitive levels of service to customers, our reputation and therefore our ability to attract additional clients and customers could be harmed.
In addition, from time to time, we may be subject to investigations, inquiries or litigation by various regulators, which may harm our reputation regardless of the outcome of any such action. For example, in 2012, we responded to a civil investigation conducted by the attorneys general of a number of states into certain of our marketing and business practices resulting in us entering into an Assurance of Voluntary Compliance agreement. Negative perceptions of our business may result in additional regulation, enforcement actions by the government and increased litigation, any of which may affect our business and result in lower revenue.
We also believe that building brand awareness is important to achieving increased demand for certain of our products and services. Accordingly, we have dedicated, and expect to continue to dedicate, significant operating
20
Table of Contents
Index to Financial Statements
capital and resources to building brand awareness, which may not be successful. Our failure to build brand awareness may adversely affect our ability to attract and retain clients in a cost-effective manner and as a result, our business, financial condition and results of operations.
Any damage to our reputation, including from publicity from legal proceedings against us or companies that work within our industry, governmental proceedings, consumer class action litigation, or the disclosure of information security breaches or private information misuse, could adversely affect our business, financial condition and results of operations.
If we do not effectively manage any future growth or if we are not able to scale our business quickly enough to meet our clients’ growing needs, our operating performance will suffer and we may lose clients.
We have historically experienced growth in our operations and operating locations. This growth placed, and any future growth will continue to place, significant demands on our management and our operational and financial infrastructure. Growth, if any, may make it more difficult for us to accomplish the following:
| • | successfully scaling our technology to accommodate a larger business and integrate acquisitions; |
| • | maintaining our standing with key vendors, including Internet search companies and third-party publishers; |
| • | maintaining our client service standards; and |
| • | developing and improving our operational, financial and management controls and maintaining adequate reporting systems and procedures. |
Our future success depends in part on the efficient performance of our software and technology infrastructure. As the numbers of websites and Internet users increase, our technology infrastructure may not be able to meet the increased demand. Unexpected constraints on our technology infrastructure could lead to slower website response times or system failures and adversely affect the availability of websites and the level of user responses received, which could result in the loss of clients or revenue or harm to our business and results of operations.
In addition, our personnel, systems, procedures, and controls may be inadequate to support our future operations if we return to growth. The improvements required to manage growth may require us to make significant expenditures, expand, train and manage our employee base, and reallocate valuable management resources. We may spend substantial amounts to purchase or lease data centers and equipment, upgrade our technology and network infrastructure to handle increased traffic on our owned and operated websites and roll out new products and services. This expansion could be expensive and complex and could result in inefficiencies or operational failures. If we do not implement this expansion successfully, or if we experience inefficiencies and operational failures during its implementation, the quality of our products and services and our users’ experience could decline. This could damage our reputation and cause us to lose current and potential customers and clients. The costs associated with these adjustments to our architecture could harm our operating results. Accordingly, if we fail to effectively manage future growth, our operating performance will suffer, and we may lose clients, key vendors and key personnel.
Interruption or failure of our information technology and communications systems could impair our ability to effectively deliver our services, which could cause us to lose clients and harm our results of operations.
Our delivery of marketing and media services depends on the continuing operation of our technology infrastructure and systems. Any damage to or failure of our systems could result in interruptions in our ability to deliver offerings quickly and accurately or process visitors’ responses emanating from our various web presences. Interruptions in our service could reduce our revenue and profits, and our reputation could be damaged if people believe our systems are unreliable. Our systems and operations are vulnerable to damage or
21
Table of Contents
Index to Financial Statements
interruption from earthquakes, terrorist attacks, floods, fires, power loss, break-ins, hardware or software failures, telecommunications failures, computer viruses or other attempts to harm our systems, and similar events. If we or third-party data centers that we utilize were to experience a major power outage, we would have to rely on back-up generators. These back-up generators may not operate properly through a major power outage and their fuel supply could also be inadequate during a major power outage or disruptive event. Furthermore, we do not currently have backup generators at our Foster City, California headquarters. Information systems such as ours may be disrupted by even brief power outages, or by the fluctuations in power resulting from switches to and from back-up generators. This could give rise to obligations to certain of our clients which could have an adverse effect on our results of operations for the period of time in which any disruption of utility services to us occurs.
Our primary data center is at a third-party co-location center in San Francisco, California. All of the critical components of the system are redundant and we have a backup data center in Las Vegas, Nevada. We have implemented these backup systems and redundancies to minimize the risk associated with earthquakes, fire, power loss, telecommunications failure, and other events beyond our control; however, these backup systems may fail or may not be adequate to prevent losses.
Any unscheduled interruption in our service would result in an immediate loss of revenue. If we experience frequent or persistent system failures, the attractiveness of our technologies and services to clients and third-party publishers could be permanently harmed. The steps we have taken to increase the reliability and redundancy of our systems are expensive, reduce our operating margin and may not be successful in reducing the frequency or duration of unscheduled interruptions.
We rely on call centers, Internet and data center providers, and other third-parties for key aspects of the process of providing services to our clients, and any failure or interruption in the services and products provided by these third-parties could harm our business.
We rely on internal and third-party call centers as well as third-party vendors, including data center and Internet providers. Notwithstanding disaster recovery and business continuity plans and precautions instituted to protect our clients and us from events that could interrupt delivery of services, there is no guarantee that such interruptions would not result in a prolonged interruption in our ability to provide services to our clients. Any temporary or permanent interruption in the services provided by our call centers or third-party providers could significantly harm our business.
In addition, any financial or other difficulties our third-party providers face may have negative effects on our business, the nature and extent of which we cannot predict. We exercise little control over our third-party vendors, which increases our vulnerability to problems with the services they provide. We license technology and related databases from third-parties to facilitate analysis and storage of data and delivery of offerings. We have experienced interruptions and delays in service and availability for data centers, bandwidth and other technologies in the past. Any errors, failures, interruptions or delays experienced in connection with these third-party technologies and services could adversely affect our business and could expose us to liabilities to third-parties.
Our business depends on continued and unimpeded access to the Internet by us and our users. Internet access providers may be able to block, degrade, or charge for access to certain of our products and services, which could lead to additional expenses and the loss of customers and clients.
Our products and services depend on the ability of our users to access the Internet. Currently, this access is provided by companies that have significant market power in the broadband and Internet access marketplace, including incumbent telephone companies, cable companies, mobile communications companies, and government-owned service providers. Some of these providers have taken, or have stated that they may take measures, including legal actions, that could degrade, disrupt, or increase the cost of user access to our advertisements or our third-party publishers’ advertisements by restricting or prohibiting the use of infrastructure
22
Table of Contents
Index to Financial Statements
to support or facilitate our offerings, or by charging increased fees to us or our users to provide our offerings. Such interference could result in a loss of existing customers and clients, and increased costs, and could impair our ability to attract new customers and clients, thereby harming our revenue and growth.
We may need additional capital in the future to meet our financial obligations and to pursue our business objectives. Additional capital may not be available or may not be available on favorable terms and our business and financial condition could therefore be adversely affected.
While we anticipate that our existing cash and cash equivalents, together with availability under our credit facility and cash from operations, will be sufficient to fund our operations for at least the next 12 months, we may need to raise additional capital to fund operations in the future or to finance acquisitions. If we seek to raise additional capital in order to meet various objectives, including developing future technologies and services, increasing working capital, acquiring businesses, and responding to competitive pressures, capital may not be available on favorable terms or may not be available at all. In addition, pursuant to the terms of our credit facility, we are required to use a portion of the net proceeds of certain equity financings to repay the outstanding balance of our term loan. Lack of sufficient capital resources could significantly limit our ability to take advantage of business and strategic opportunities. Any additional capital raised through the sale of equity or debt securities with an equity component would dilute our stock ownership. If adequate additional funds are not available, we may be required to delay, reduce the scope of, or eliminate material parts of our business strategy, including potential additional acquisitions or development of new technologies.
Our quarterly revenue and results of operations may fluctuate significantly from quarter to quarter due to seasonal fluctuations in advertising spending.
In addition to other factors that cause our results of operations to fluctuate, results are also subject to significant seasonal fluctuation. In particular, our quarters ending December 31 (our second fiscal quarter) are typically characterized by seasonal weakness. In our second fiscal quarters, there is generally lower availability of lead supply from some forms of media during the holiday period on a cost effective basis and some of our clients have lower budgets. In our quarters ending March 31 (our third fiscal quarter), this trend generally reverses with better lead availability and often new budgets at the beginning of the year for our clients with fiscal years ending December 31.
If the market for online marketing services fails to continue to develop, our success may be limited, and our revenue may decrease.
The online marketing services market is relatively new and rapidly evolving, and it uses different measurements from traditional media to gauge its effectiveness. Some of our current or potential clients have little or no experience using the Internet for advertising and marketing purposes and have allocated only limited portions of their advertising and marketing budgets to the Internet. The adoption of online marketing, particularly by those companies that have historically relied upon traditional media for advertising, requires the acceptance of a new way of conducting business, exchanging information and evaluating new advertising and marketing technologies and services.
In particular, we are dependent on our clients’ adoption of new metrics to measure the success of online marketing campaigns. Certain of our metrics are subject to inherent challenges in measurement, and real or perceived inaccuracies in such metrics may harm our reputation and negatively affect our business. We present key metrics such as cost-per-click, cost-per-lead and cost-per-acquisition some of which are calculated using internal data. We periodically review and refine our some of our methodologies for monitoring, gathering, and calculating these metrics. Based on this process, from time to time we update our methodologies. While our metrics are based on what we believe to be reasonable measurements and methodologies, there are inherent challenges in deriving our metrics. In addition, our user metrics may differ from estimates published by third-parties or from similar metrics of our competitors due to differences in methodology. If advertisers or publishers
23
Table of Contents
Index to Financial Statements
do not perceive our metrics to be accurate, or if we discover material inaccuracies in our metrics, it could negatively affect our business model and current or potential clients’ willingness to adopt our metrics.
We may also experience resistance from traditional advertising agencies who may be advising our clients. We cannot assure you that the market for online marketing services will continue to grow. If the market for online marketing services fails to continue to develop or develops more slowly than we anticipate, the success of our business may be limited, and our revenue may decrease.
If we do not adequately protect our intellectual property rights, our competitive position and business may suffer.
Our ability to compete effectively depends upon our proprietary systems and technology. We rely on patent, trade secret, trademark and copyright law, confidentiality agreements, and technical measures to protect our proprietary rights. We enter into confidentiality agreements with our employees, consultants, independent contractors, advisors, client vendors, and publishers. These agreements may not effectively prevent unauthorized disclosure of confidential information or unauthorized parties from copying aspects of our services or obtaining and using our proprietary information. Further, these agreements may not provide an adequate remedy in the event of unauthorized disclosures or uses, and we cannot assure you that our rights under such agreements will be enforceable. Effective patent, trade secret, copyright, and trademark protection may not be available in all countries where we currently operate or in which we may operate in the future. Some of our systems and technologies are not covered by any copyright, patent or patent application. We cannot guarantee that: (i) our intellectual property rights will provide competitive advantages to us; (ii) our ability to assert our intellectual property rights against potential competitors or to settle current or future disputes will be effective; (iii) our intellectual property rights will be enforced in jurisdictions where competition may be intense or where legal protection may be weak; (iv) any of the patent, trademark, copyright, trade secret or other intellectual property rights that we presently employ in our business will not lapse or be invalidated, circumvented, challenged, or abandoned; (v) competitors will not design around our protected systems and technology; or (vi) that we will not lose the ability to assert our intellectual property rights against others.
We have from time to time become aware of third-parties who we believe may have infringed our intellectual property rights. Such infringement or infringement of which we are not yet aware could reduce our competitive advantages and cause us to lose clients, third-party publishers or could otherwise harm our business. Policing unauthorized use of our proprietary rights can be difficult and costly. Litigation, while it may be necessary to enforce or protect our intellectual property rights, could result in substantial costs and diversion of resources and management attention and could adversely affect our business, even if we are successful on the merits. In addition, others may independently discover trade secrets and proprietary information, and in such cases we could not assert any trade secret rights against such parties.
Third-parties may sue us for intellectual property infringement, which, even if unsuccessful, could require us to expend significant costs to defend or settle.
We cannot be certain that our internally developed or acquired systems and technologies do not and will not infringe the intellectual property rights of others. In addition, we license content, software and other intellectual property rights from third-parties and may be subject to claims of infringement if such parties do not possess the necessary intellectual property rights to the products they license to us.
In addition, we have in the past, and may in the future, be subject to legal proceedings and claims that we have infringed the patents or other intellectual property rights of third-parties. These claims sometimes involve patent holding companies or other adverse patent owners who have no relevant product revenue and against whom our own intellectual property rights, if any, may therefore provide little or no deterrence. For example, in December 2012, Internet Patents Corporation (“IPC”) filed a patent infringement lawsuit against us in the Northern District of California alleging that some of our websites infringe a patent held by IPC. IPC is a non-practicing entity that relies
24
Table of Contents
Index to Financial Statements
on asserting its patents as its primary source of revenue. In addition, third-parties have asserted and may in the future assert intellectual property infringement claims against our clients, and we have agreed in certain circumstances to indemnify and defend against such claims. Any intellectual property-related infringement claims, whether or not meritorious and regardless of the outcome of the litigation, could result in costly litigation and could divert management resources and attention. Should we be found liable for infringement, we may be required to enter into licensing agreements, if available on acceptable terms or at all, pay substantial damages, or limit or curtail our systems and technologies. Moreover, we may need to redesign some of our systems and technologies to avoid future infringement liability. Any of the foregoing could prevent us from competing effectively and increase our costs.
Additionally, the laws relating to use of trademarks on the Internet are unsettled, particularly as they apply to search engine functionality. For example, other Internet marketing and search companies have been sued for trademark infringement and other intellectual property-related claims for displaying ads or search results in response to user queries that include trademarked terms. The outcomes of these lawsuits have differed from jurisdiction to jurisdiction. We may be subject to trademark infringement, unfair competition, misappropriation or other intellectual property-related claims which could be costly to defend and result in substantial damages or otherwise limit or curtail our activities, and therefore adversely affect our business or prospects.
Limitations on our ability to collect and use data derived from user activities, as well as new technologies that block our ability to deliver Internet-based advertising, could significantly diminish the value of our services and have an adverse effect on our ability to generate revenue.
When a user visits our websites, we use technologies, including “cookies,” to collect information such as the user’s IP address and the user’s past responses to our offerings. We access and analyze this information in order to determine the effectiveness of a marketing campaign and to determine how to modify the campaign. The use of cookies is the subject of litigation, regulatory scrutiny and industry self-regulatory activities, including the discussion of “do-not-track” technologies and guidelines.
Additionally, users are able to block or delete cookies from their browser. Periodically, certain of our clients and publishers seek to prohibit or limit our collection or use of data derived from the use of cookies. Technologies, tools, software and applications (including new and enhanced web browsers) have been developed and are likely to continue to be developed that can block or allow users to opt out of display, search, and Internet-based advertising and content, delete or block the cookies used to deliver such advertising, or shift the location in which advertising appears on pages so that our advertisements do not show up in the most monetizable places on our pages or are obscured. As a result, the adoption of such technologies, tools, software, and applications could reduce the number of display and search advertisements that we are able to deliver and/or our ability to deliver Internet-based advertising and this, in turn, could reduce our results of operations.
Interruptions, failures or defects in our data collection systems, as well as privacy concerns regarding the collection of user data, could also limit our ability to analyze data from our clients’ marketing campaigns. This risk is heightened when we deliver marketing services to clients in the financial services client vertical. If our access to data is limited in the future, we may be unable to provide effective technologies and services to clients and we may lose clients and revenue.
If we fail to maintain proper and effective internal controls, our ability to produce accurate financial statements on a timely basis or effectively prevent fraud could be impaired, which would adversely affect our ability to operate our business.
In order to comply with the Sarbanes-Oxley Act of 2002, our management is responsible for establishing and maintaining adequate internal control over financial reporting to provide reasonable assurance regarding the reliability of our financial reporting and the preparation of financial statements for external purposes in accordance with U.S. generally accepted accounting principles. We may in the future discover areas of our
25
Table of Contents
Index to Financial Statements
internal financial and accounting controls and procedures that need improvement. Our internal control over financial reporting will not prevent or detect all error and all fraud. A control system, no matter how well designed and operated, can provide only reasonable, not absolute, assurance that the control system’s objectives will be met. All control systems have inherent limitations, and, accordingly, no evaluation of controls can provide absolute assurance that misstatements due to error or fraud will not occur or that all control issues and instances of fraud will be detected. If we are unable to maintain proper and effective internal controls, we may not be able to produce accurate financial statements on a timely basis, which could adversely affect our ability to operate our business and could result in regulatory action.
As a creator and a distributor of Internet content, we face potential liability and expenses for legal claims based on the nature and content of the materials that we create or distribute. If we are required to pay damages or expenses in connection with these legal claims, our results of operations and business may be harmed.
We display original content and third-party content on our websites and in our marketing messages. As a result, we face potential liability based on a variety of theories, including defamation, negligence, deceptive advertising (including Department of Education regulations regarding misrepresentation in education marketing), copyright or trademark infringement. We are also exposed to risk that content provided by third-parties is inaccurate or misleading, and for material posted to our websites by users and other third-parties. These claims, whether brought in the United States or abroad, could divert management time and attention away from our business and result in significant costs to investigate and defend, regardless of the merit of these claims. In addition, if we become subject to these types of claims and are not successful in our defense, we may be forced to pay substantial damages.
We face additional risks in conducting business in international markets.
We have entered into certain international markets and may enter into additional international markets in the future. We have limited experience in marketing, selling and supporting our services outside of the United States, and we may not be successful in introducing or marketing our services abroad. There are risks and challenges inherent in conducting business in international markets, such as:
| • | adapting our technologies and services to foreign clients’ preferences and customs; |
| • | successfully navigating foreign laws and regulations, including marketing, privacy regulations, employment and labor regulations; |
| • | changes in foreign political and economic conditions; |
| • | tariffs and other trade barriers, fluctuations in currency exchange rates and potentially adverse tax consequences; |
| • | language barriers or cultural differences; |
| • | reduced or limited protection for intellectual property rights in foreign jurisdictions; |
| • | difficulties and costs in staffing, managing or overseeing foreign operations; |
| • | education of potential clients who may not be familiar with online marketing; |
| • | challenges in collecting accounts receivables; and |
| • | successfully interpreting and complying with the U.S. Foreign Corrupt Practices Act and similar worldwide anti-bribery laws, particularly when operating in countries with varying degrees of governmental corruption. |
If we are unable to successfully expand and market our services abroad, our business and future growth may be harmed, and we may incur costs that may not lead to future revenue.
26
Table of Contents
Index to Financial Statements
We recognized an impairment in the carrying value of goodwill. Additional such charges in the future could negatively affect our results of operations and financial condition.
We continue to have a substantial amount of goodwill and purchased intangible assets on our balance sheet as a result of historical acquisitions. The carrying value of goodwill represents the fair value of an acquired business in excess of identifiable assets and liabilities as of the acquisition date. The carrying value of intangible assets with identifiable useful lives represents the fair value of relationships, content, domain names, acquired technology, among others, as of the acquisition date, and are amortized based on their economic lives. Goodwill expected to contribute indefinitely to our cash flows is not amortized, but must be evaluated for impairment at least annually. If the carrying value exceeds current fair value as determined based on the discounted future cash flows of the related business, the goodwill or intangible asset is considered impaired and is reduced to fair value via a non-cash charge to earnings. Events and conditions that could result in impairment include adverse changes in the regulatory environment, a reduced market capitalization or other factors leading to reduction in expected long-term growth or profitability.
Goodwill impairment analysis and measurement is a process that requires significant judgment. Our stock price and any estimated control premium are factors affecting the assessment of the fair value of our underlying reporting units for purposes of performing any goodwill impairment assessment. For example, our public market capitalization sustained a decline after December 31, 2012 and June 30, 2014 to a value below the net book carrying value of our equity, triggering the need for a goodwill impairment analysis. As a result of our goodwill impairment analysis, we recorded a goodwill impairment charge in those periods.
It is possible that another material change could occur in the future. We will continue to conduct impairment analyses of our goodwill on an annual basis, unless indicators of possible impairment arise that would cause a triggering event, and we would be required to take additional impairment charges in the future if any recoverability assessments reflect estimated fair values that are less than our recorded values. Further impairment charges with respect to our goodwill could have a material adverse effect on our results of operations and financial condition.
We could lose clients if we fail to detect click-through or other fraud on advertisements in a manner that is acceptable to our clients.
We are exposed to the risk of fraudulent clicks or actions on our websites or our third-party publishers’ websites, which could lead our clients to become dissatisfied with our campaigns, and in turn, lead to loss of clients and related revenue. Click-through fraud occurs when an individual clicks on an ad displayed on a website, or an automated system is used to create such clicks, with the intent of generating the revenue share payment to the publisher rather than viewing the underlying content. Action fraud occurs when online lead forms are completed with false or fictitious information in an effort to increase a publisher’s compensable actions. From time to time, we have experienced fraudulent clicks or actions. We do not charge our clients for fraudulent clicks or actions when they are detected, and such fraudulent activities could negatively affect our profitability or harm our reputation. If fraudulent clicks or actions are not detected, the affected clients may experience a reduced return on their investment in our marketing programs, which could lead the clients to become dissatisfied with our campaigns, and in turn, lead to loss of clients and related revenue. Additionally, we have, from time to time, had to, and in the future may have to, terminate relationships with publishers who we believed to have engaged in fraud. Termination of such relationships entails a loss of revenue associated with the legitimate actions or clicks generated by such publishers.
As a public company, we are subject to compliance initiatives that will require substantial time from our management and result in significantly increased costs that may adversely affect our operating results and financial condition.
The Securities Exchange Act of 1934, Sarbanes-Oxley Act of 2002, the Dodd-Frank Wall Street Reform and Consumer Protection Act of 2010, and other rules implemented by the SEC and NASDAQ, impose various
27
Table of Contents
Index to Financial Statements
requirements on public companies, including requiring changes in corporate governance practices. These and proposed corporate governance laws and regulations under consideration may further increase our compliance costs. If compliance with these various legal and regulatory requirements diverts our management’s attention from other business concerns, it could have a material adverse effect on our business, financial condition and results of operations. We also expect that these laws and regulations may make it more difficult and more expensive for us to obtain director and officer liability insurance, and we may be required to accept reduced policy limits and coverage or incur substantially higher costs to obtain the same or similar coverage than used to be available. As a result, it may be more difficult for us to attract and retain qualified individuals to serve on our board of directors, on committees of our board of directors, or as executive officers.
Risks Related to the Ownership of Our Common Stock
Our stock price has been volatile, and you may not be able to resell shares of our common stock at or above the price you paid.
The trading price of our common stock has been volatile since our initial public offering and may continue to be subject to wide fluctuations in response to various factors, some of which are beyond our control. These factors include those discussed in this “Risk Factors” section of this periodic report and others such as:
| • | our ability to return to growth and to manage any such growth effectively; |
| • | changes in earnings estimates or recommendations by securities analysts; |
| • | announcements about our revenue, earnings or other financial results that are not in line with analyst expectations; |
| • | our ability to find, develop or retain high quality targeted media on a cost effective basis; |
| • | relatively low trading volume in our stock, which creates inherent volatility regardless of factors related to our business performance or prospects; |
| • | the sale of, or indication of the intent to sell, substantial amounts of our common stock by our directors, officers or substantial shareholders; |
| • | announcements by us or our competitors of new services, significant contracts, commercial relationships, acquisitions or capital commitments; |
| • | our commencement of, or involvement in, litigation; and |
| • | negative publicity about us, our industry, our clients or our clients’ industries. |
In recent years, the stock market in general, and the market for technology and Internet-based companies in particular, has experienced extreme price and volume fluctuations that have often been unrelated or disproportionate to the operating performance of those companies. Broad market and industry factors may seriously affect the market price of our common stock, regardless of our actual operating performance. In addition, in the past, following periods of volatility in the overall market and the market price of a particular company’s securities, securities class action litigation has often been instituted against these companies. Such litigation, if instituted against us, could result in substantial costs and a diversion of our management’s attention and resources.
If securities or industry analysts do not publish research or reports about our business, or if they issue an adverse opinion regarding our stock, our stock price and trading volume could decline.
The trading market for our common stock is influenced by the research and reports that industry or securities analysts publish about us, our business or the industries or businesses of our clients. If any of the analysts issue an adverse opinion regarding our stock or if our actual results do not meet analyst estimates, our
28
Table of Contents
Index to Financial Statements
stock price would likely decline. If one or more of these analysts ceases coverage of our company or fails to publish reports on us regularly, we could lose visibility in the financial markets, which in turn could cause our stock price or trading volume to decline.
Our directors and executive officers and their respective affiliates have substantial influence over us and could delay or prevent a change in corporate control.
As of June 30, 2014, our directors and executive officers, together with their affiliates, beneficially owned approximately 25% of our outstanding common stock. As a result, these stockholders, acting together, have substantial influence over the outcome of matters submitted to our stockholders for approval, including the election of directors and any merger, consolidation or sale of all or substantially all of our assets. In addition, these stockholders, acting together, have significant influence over the management and affairs of our company. Accordingly, this concentration of ownership may have the effect of:
| • | delaying, deferring or preventing a change in corporate control; |
| • | impeding a merger, consolidation, takeover or other business combination involving us; or |
| • | discouraging a potential acquirer from making a tender offer or otherwise attempting to obtain control of us. |
Provisions in our charter documents under Delaware law and in contractual obligations could discourage a takeover that stockholders may consider favorable and may lead to entrenchment of management.
Our amended and restated certificate of incorporation and bylaws contain provisions that could have the effect of delaying or preventing changes in control or changes in our management without the consent of our board of directors. These provisions include:
| • | a classified board of directors with three-year staggered terms, which may delay the ability of stockholders to change the membership of a majority of our board of directors; |
| • | no cumulative voting in the election of directors, which limits the ability of minority stockholders to elect director candidates; |
| • | the exclusive right of our board of directors to elect a director to fill a vacancy created by the expansion of the board of directors or the resignation, death or removal of a director, which prevents stockholders from being able to fill vacancies on our board of directors; |
| • | the ability of our board of directors to issue shares of preferred stock and to determine the price and other terms of those shares, including preferences and voting rights, without stockholder approval, which could be used to significantly dilute the ownership of a hostile acquirer; |
| • | a prohibition on stockholder action by written consent, which forces stockholder action to be taken at an annual or special meeting of our stockholders; |
| • | the requirement that a special meeting of stockholders may be called only by the chairman of the board of directors, the chief executive officer or the board of directors, which may delay the ability of our stockholders to force consideration of a proposal or to take action, including the removal of directors; and |
| • | advance notice procedures that stockholders must comply with in order to nominate candidates to our board of directors or to propose matters to be acted upon at a stockholders’ meeting, which may discourage or deter a potential acquiror from conducting a solicitation of proxies to elect the acquiror’s own slate of directors or otherwise attempting to obtain control of us. |
We are also subject to certain anti-takeover provisions under Delaware law. Under Delaware law, a corporation may not, in general, engage in a business combination with any holder of 15% or more of its capital stock unless the holder has held the stock for three years or, among other things, the board of directors has approved the transaction.
29
Table of Contents
Index to Financial Statements
We do not currently intend to pay dividends on our common stock and, consequently, your ability to achieve a return on your investment will depend on appreciation in the price of our common stock.
We have not declared or paid dividends on our common stock and we do not intend to do so in the near term. We currently intend to invest our future earnings, if any, to fund our growth. Additionally, the terms of our credit facility restrict our ability to pay dividends. Therefore, you are not likely to receive any dividends on your common stock in the near term.
Item 1B. Unresolved Staff Comments
None.
Our principal executive offices are located in a leased facility in Foster City, California, consisting of approximately 63,998 square feet of office space under a lease that expires in October 2018 with the option to extend the lease term by another two years. This facility accommodates our principal engineering, sales, marketing, operations, finance and administrative activities. We also lease additional facilities to accommodate sales, marketing, and operations throughout the United States. Outside of the United States, we also lease facilities to accommodate engineering, sales, marketing, and operations in Brazil and India.
We may add new facilities and expand our existing facilities as we add employees and expand our markets, and we believe that suitable additional or substitute space will be available as needed to accommodate any such expansion of our operations.
In December 2012, Internet Patents Corporation (“IPC”) filed a patent infringement lawsuit against us in the United States District Court for the Northern District of California, alleging that we had infringed a patent held by IPC. In September 2013, the court dismissed a related case because it found that the patent is invalid, and on the same date, the court issued IPC an Order to Show Cause that the lawsuit against us should not be dismissed. In October 2013, IPC filed a response to the order and the court subsequently dismissed the case against us. In January 2014, IPC filed its appeal in the United States Court of Appeals for the Federal Circuit. While we deny IPC’s claims and believe that the probability of any loss is remote, there can be no assurance that we will prevail in this matter and any adverse ruling or settlement may have a significant impact on our business and operating results. In addition, regardless of the outcome of the matter, we may incur significant legal fees defending the action until it is resolved.
From time to time, we may become involved in other legal proceedings and claims arising in the ordinary course of our business.
Item 4. Mine Safety Disclosures
Not Applicable.
30
Table of Contents
Index to Financial Statements
PART II
Item 5. Market for Registrant’s Common Equity, Related Stockholder Matters and Issuer Purchases of Equity Securities
Our common stock has been traded on the NASDAQ Global Select Market under the symbol “QNST” since our initial public offering on February 11, 2010. Prior to this time, there was no public market for our common stock. The following table shows the high and low sale prices per share of our common stock as reported on the NASDAQ Global Select Market for the periods indicated:
| Fiscal Year Ended June 30, 2013 |
High | Low | ||||||
| First quarter ended September 30, 2012 |
$ | 10.15 | $ | 8.06 | ||||
| Second quarter ended December 31, 2012 |
$ | 8.81 | $ | 5.66 | ||||
| Third quarter ended March 31, 2013 |
$ | 7.03 | $ | 5.41 | ||||
| Fourth quarter ended June 30, 2013 |
$ | 8.74 | $ | 5.76 | ||||
| Fiscal Year Ended June 30, 2014 |
High | Low | ||||||
| First quarter ended September 30, 2013 |
$ | 9.71 | $ | 8.40 | ||||
| Second quarter ended December 31, 2013 |
$ | 9.62 | $ | 8.00 | ||||
| Third quarter ended March 31, 2014 |
$ | 9.09 | $ | 6.02 | ||||
| Fourth quarter ended June 30, 2014 |
$ | 6.72 | $ | 5.10 | ||||
On September 5, 2014, the closing price as reported on the NASDAQ Global Select Market of our common stock was $4.66 per share and we had approximately 104 stockholders of record of our common stock.
We have never declared or paid, and do not anticipate declaring or paying, any dividends on our common stock. Any future determination as to the declaration and payment of dividends, if any, will be at the discretion of our board of directors and will depend on then existing conditions, including our financial condition, operating results, contractual restrictions, capital requirements, business prospects and other factors our board of directors may deem relevant. Our credit facility also restricts our ability to pay dividends.
For equity compensation plan information refer to Item 12 in Part III of this Annual Report on Form 10-K.
31
Table of Contents
Index to Financial Statements
Performance Graph
The following performance graph shall not be deemed “soliciting material” or to be “filed” with the Securities and Exchange Commission for purposes of Section 18 of the Securities Exchange Act of 1934, as amended, or the Exchange Act, or otherwise subject to the liabilities under that Section, and shall not be deemed to be incorporated by reference into any filing of QuinStreet, Inc. under the Securities Act of 1933, as amended, or the Exchange Act.
The following performance graph shows a comparison from February 11, 2010 (the date our common stock commenced trading on the NASDAQ Global Select Market) through June 30, 2014 of cumulative total return for our common stock, the NASDAQ Composite Index and the RDG Internet Composite Index. Such returns are based on historical results and are not intended to suggest future performance. Data for the NASDAQ Composite Index and the RDG Internet Composite Index assume reinvestment of dividends.
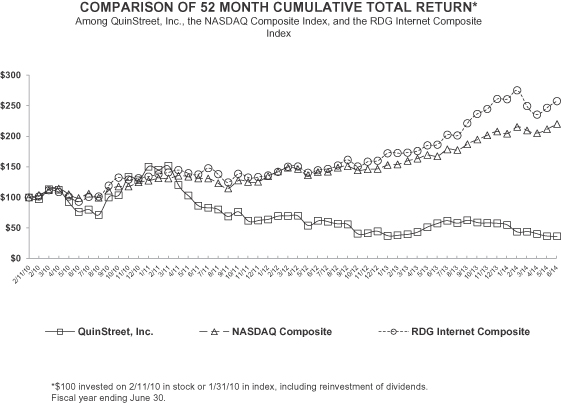
Recent Sales of Unregistered Securities
There were no unregistered sales of our equity securities during the fiscal year ended June 30, 2014.
32
Table of Contents
Index to Financial Statements
Item 6. Selected Consolidated Financial Data
The following selected consolidated financial data should be read together with “Management’s Discussion and Analysis of Financial Condition and Results of Operations” and with the consolidated financial statements and accompanying notes appearing elsewhere in this report. The selected consolidated financial data in this section is not intended to replace our consolidated financial statements and the accompanying notes. The results of acquired businesses have been included in our consolidated financial statements since their respective dates of acquisition. Our historical results are not necessarily indicative of our future results and any interim results are not necessarily indicative of the results for a full fiscal year.
We derived the consolidated statements of operations data for the fiscal years ended June 30, 2014, 2013, and 2012 and the consolidated balance sheets data as of June 30, 2014 and 2013 from our audited consolidated financial statements appearing elsewhere in this report. The consolidated statements of operations data for the fiscal year ended June 30, 2011 and 2010 and the consolidated balance sheets data as of June 30, 2012, 2011 and 2010 are derived from our audited consolidated financial statements, which are not included in this report.
| Fiscal Year Ended June 30, | ||||||||||||||||||||
| 2014 | 2013 | 2012 | 2011 | 2010 | ||||||||||||||||
| (In thousands, except per share data) | ||||||||||||||||||||
| Consolidated Statements of Operations Data: |
||||||||||||||||||||
| Net revenue |
$ | 282,549 | $ | 305,101 | $ | 370,468 | $ | 403,021 | $ | 334,835 | ||||||||||
| Cost of revenue (1) |
241,907 | 251,591 | 283,466 | 291,991 | 240,730 | |||||||||||||||
|
|
|
|
|
|
|
|
|
|
|
|||||||||||
| Gross profit |
40,642 | 53,510 | 87,002 | 111,030 | 94,105 | |||||||||||||||
| Operating expenses: (1) |
||||||||||||||||||||
| Product development |
19,548 | 19,048 | 21,051 | 24,163 | 19,726 | |||||||||||||||
| Sales and marketing |
16,385 | 14,705 | 14,074 | 17,382 | 16,698 | |||||||||||||||
| General and administrative |
17,046 | 16,226 | 23,375 | 20,396 | 18,464 | |||||||||||||||
| Impairment of goodwill |
95,641 | 92,350 | — | — | — | |||||||||||||||
|
|
|
|
|
|
|
|
|
|
|
|||||||||||
| Total operating expenses |
148,620 | 142,329 | 58,500 | 61,941 | 54,888 | |||||||||||||||
| Operating (loss) income |
(107,978 | ) | (88,819 | ) | 28,502 | 49,089 | 39,217 | |||||||||||||
| Interest income |
115 | 115 | 134 | 169 | 97 | |||||||||||||||
| Interest expense |
(3,825 | ) | (5,200 | ) | (4,462 | ) | (4,213 | ) | (3,977 | ) | ||||||||||
| Other income (expense), net |
1,493 | (69 | ) | (42 | ) | 56 | 1,523 | |||||||||||||
|
|
|
|
|
|
|
|
|
|
|
|||||||||||
| Interest and other expense, net |
(2,217 | ) | (5,154 | ) | (4,370 | ) | (3,988 | ) | (2,357 | ) | ||||||||||
| (Loss) income before income taxes |
(110,195 | ) | (93,973 | ) | 24,132 | 45,101 | 36,860 | |||||||||||||
| (Provision for) benefit from taxes |
(36,209 | ) | 26,601 | (11,131 | ) | (17,887 | ) | (16,276 | ) | |||||||||||
|
|
|
|
|
|
|
|
|
|
|
|||||||||||
| Net (loss) income |
$ | (146,404 | ) | $ | (67,372 | ) | $ | 13,001 | $ | 27,214 | $ | 20,584 | ||||||||
|
|
|
|
|
|
|
|
|
|
|
|||||||||||
| Less: 8% non-cumulative dividends on convertible preferred stock |
$ | — | $ | — | $ | — | $ | — | $ | (2,018 | ) | |||||||||
| Less: Undistributed earnings allocated to convertible preferred stock |
$ | — | $ | — | $ | — | $ | — | $ | (5,784 | ) | |||||||||
|
|
|
|
|
|
|
|
|
|
|
|||||||||||
| Net (loss) income attributable to common stockholders — Basic |
$ | (146,404 | ) | $ | (67,372 | ) | $ | 13,001 | $ | 27,214 | $ | 12,782 | ||||||||
|
|
|
|
|
|
|
|
|
|
|
|||||||||||
| Undistributed earnings re-allocated to common stock |
$ | — | $ | — | $ | — | $ | — | $ | 419 | ||||||||||
|
|
|
|
|
|
|
|
|
|
|
|||||||||||
| Net (loss) income attributable to common stockholders — Diluted |
$ | (146,404 | ) | $ | (67,372 | ) | $ | 13,001 | $ | 27,214 | $ | 13,201 | ||||||||
|
|
|
|
|
|
|
|
|
|
|
|||||||||||
| Net (loss) income per share attributable to common stockholders: (2) |
||||||||||||||||||||
| Basic |
$ | (3.36 | ) | $ | (1.57 | ) | $ | 0.28 | $ | 0.59 | $ | 0.50 | ||||||||
|
|
|
|
|
|
|
|
|
|
|
|||||||||||
| Diluted |
$ | (3.36 | ) | $ | (1.57 | ) | $ | 0.28 | $ | 0.55 | $ | 0.46 | ||||||||
|
|
|
|
|
|
|
|
|
|
|
|||||||||||
| Weighted average shares used in computing net (loss) income per share attributable to common stockholders: |
||||||||||||||||||||
| Basic |
43,528 | 42,816 | 45,846 | 46,222 | 25,616 | |||||||||||||||
| Diluted |
43,528 | 42,816 | 46,859 | 49,130 | 28,429 | |||||||||||||||
33
Table of Contents
Index to Financial Statements
| (1) | Cost of revenue and operating expenses include stock-based compensation expense as follows: |
| Cost of revenue |
$ | 2,767 | $ | 3,930 | $ | 4,293 | $ | 4,506 | $ | 3,111 | ||||||||||
| Product development |
2,429 | 2,765 | 2,570 | 2,705 | 2,176 | |||||||||||||||
| Sales and marketing |
2,937 | 3,264 | 3,096 | 3,747 | 3,463 | |||||||||||||||
| General and administrative |
2,296 | 2,057 | 3,037 | 2,992 | 4,621 |
| (2) | See Note 3, Net (Loss) Income per Share, to our consolidated financial statements for an explanation of the method used to calculate basic and diluted net (loss) income per share of common stock. |
| June 30, | ||||||||||||||||||||
| 2014 | 2013 | 2012 | 2011 | 2010 | ||||||||||||||||
| (In thousands) | ||||||||||||||||||||
| Consolidated Balance Sheets Data: |
||||||||||||||||||||
| Cash and cash equivalents |
$ | 84,177 | $ | 90,117 | $ | 68,531 | $ | 132,290 | $ | 155,770 | ||||||||||
| Working capital |
110,412 | 111,040 | 103,222 | 162,361 | 155,164 | |||||||||||||||
| Total assets |
276,843 | 429,547 | 507,160 | 524,924 | 434,630 | |||||||||||||||
| Total liabilities |
131,692 | 150,652 | 168,803 | 169,535 | 144,608 | |||||||||||||||
| Total debt |
77,263 | 92,677 | 107,596 | 106,048 | 93,608 | |||||||||||||||
| Total stockholders’ equity |
145,151 | 278,895 | 338,357 | 355,389 | 290,022 | |||||||||||||||
| Fiscal Year Ended June 30, | ||||||||||||||||||||
| 2014 | 2013 | 2012 | 2011 | 2010 | ||||||||||||||||
| (In thousands) | ||||||||||||||||||||
| Consolidated Statements of Cash Flows Data: |
||||||||||||||||||||
| Net cash provided by operating activities |
$ | 18,377 | $ | 50,665 | $ | 46,375 | $ | 78,171 | $ | 38,509 | ||||||||||
| Depreciation and amortization |
26,097 | 32,325 | 31,150 | 27,272 | 18,791 | |||||||||||||||
| Capital expenditures |
5,455 | 1,341 | 2,268 | 5,363 | 2,710 | |||||||||||||||
| Fiscal Year Ended June 30, | ||||||||||||||||||||
| 2014 | 2013 | 2012 | 2011 | 2010 | ||||||||||||||||
| (In thousands) | ||||||||||||||||||||
| Other Financial Data: |
||||||||||||||||||||
| Adjusted EBITDA (1) |
$ | 24,189 | $ | 47,872 | $ | 72,648 | $ | 90,311 | $ | 71,379 | ||||||||||
| (1) | We define adjusted EBITDA as net (loss) income less benefit from (provision for) taxes, depreciation expense, amortization expense, stock-based compensation expense, interest and other income (expense), net, impairment of goodwill and other extraordinary or non-recurring expenses. Please see the “adjusted EBITDA” section within “Management’s Discussion and Analysis of Financial Condition and Results of Operations” for more information. |
The following table presents a reconciliation of adjusted EBITDA to net (loss) income calculated in accordance with U.S. generally accepted accounting principles (GAAP), the most comparable GAAP measure, for each of the periods indicated:
| Fiscal Year Ended June 30, | ||||||||||||||||||||
| 2014 | 2013 | 2012 | 2011 | 2010 | ||||||||||||||||
| (In thousands) | ||||||||||||||||||||
| Net (loss) income |
$ | (146,404 | ) | $ | (67,372 | ) | $ | 13,001 | $ | 27,214 | $ | 20,584 | ||||||||
| Interest and other expense, net |
2,217 | 5,154 | 4,370 | 3,988 | 2,357 | |||||||||||||||
| Provision for (benefit from) taxes |
36,209 | (26,601 | ) | 11,131 | 17,887 | 16,276 | ||||||||||||||
| Depreciation and amortization |
26,097 | 32,325 | 31,150 | 27,272 | 18,791 | |||||||||||||||
| Stock-based compensation expense |
10,429 | 12,016 | 12,996 | 13,950 | 13,371 | |||||||||||||||
| Impairment of goodwill |
95,641 | 92,350 | — | — | — | |||||||||||||||
|
|
|
|
|
|
|
|
|
|
|
|||||||||||
| Adjusted EBITDA |
$ | 24,189 | $ | 47,872 | $ | 72,648 | $ | 90,311 | $ | 71,379 | ||||||||||
|
|
|
|
|
|
|
|
|
|
|
|||||||||||
34
Table of Contents
Index to Financial Statements
Item 7. Management’s Discussion and Analysis of Financial Condition and Results of Operations
You should read the following discussion of our financial condition and results of operations in conjunction with the consolidated financial statements and the notes thereto included elsewhere in this report. The following discussion contains forward-looking statements that reflect our plans, estimates and beliefs. Our actual results could differ materially from those discussed in the forward-looking statements. Factors that could cause or contribute to these differences include those discussed below and elsewhere in this report, particularly in the sections titled “Special Note Regarding Forward-Looking Statements” and “Risk Factors”.
Management Overview
QuinStreet is a leader in performance marketing online. We have built a strong set of capabilities to engage Internet visitors with targeted media and to connect our marketing clients with their potential customers online. We focus on serving clients in large, information-intensive industry verticals where relevant, targeted media and offerings help visitors make informed choices, find the products that match their needs, and thus become qualified customer prospects for our clients.
We deliver cost-effective marketing results to our clients most typically in the form of a qualified lead or inquiry, in the form of a qualified click, or call. Leads, clicks or calls can then convert into a customer or sale for clients at a rate that results in an acceptable marketing cost to them. We are typically paid by clients when we deliver qualified leads, clicks, calls or customers as defined by our agreements with them. References to the delivery of customers means the sale of completed customer transactions (e.g., bound insurance policies or customer appointments with clients). Because we bear the costs of media, our programs must deliver value to our clients and provide for a media yield, or generation of an acceptable margin on our media costs, that provides a sound financial outcome for us. To deliver leads, clicks, calls, and customers to our clients, generally we:
| • | own or access targeted media; |
| • | run advertisements or other forms of marketing messages and programs in that media to create visitor responses in the form most typically of leads (visitor generated contact information and requests), clicks (to further qualification or matching steps, or to online client applications or offerings), or calls (to our owned and operated call centers or that of our clients or their agents); |
| • | match these leads, clicks, calls, or customers to client offerings or brands that we believe can meet visitor interests or needs, converting visitors into qualified leads, clicks, calls, or customers for our clients; and |
| • | optimize client matches and media yield such that we achieve desired results for clients and a sound financial outcome for us. |
Our primary financial objective has been and remains creating revenue growth from sustainable sources, at target levels of profitability. Our primary financial objective is not to maximize profits, but rather to achieve target levels of profitability while investing in various growth initiatives, as we continue to believe we are in the early stages of a large, long-term market.
Our Direct Marketing Services (“DMS”), business accounted for substantially all of our net revenue in fiscal years 2014, 2013 and 2012. Our DMS business derives its net revenue from fees earned through the delivery of qualified leads, clicks, calls or customers and, to a lesser extent, display advertisements, or impressions. Through a vertical focus, targeted media presence and our technology platform, we are able to deliver targeted, measurable marketing results to our clients.
Our two largest client verticals within our DMS business are education and financial services. Our education client vertical represented 43%, 44% and 42% of net revenue in fiscal years 2014, 2013 and 2012. Our financial services client vertical represented 39%, 40% and 42% of net revenue in fiscal years 2014, 2013 and 2012. Other DMS client verticals, consisting primarily of business-to-business technology, home services and medical, represented 18%, 16% and 16% of net revenue in fiscal years 2014, 2013 and 2012.
35
Table of Contents
Index to Financial Statements
We generated substantially all of our revenue from sales to clients in the United States.
Trends Affecting our Business
Client Verticals
To date, our education and financial services client verticals have generated the majority of our revenue. We expect that a majority of our revenue in fiscal year 2015 will also be generated from clients in these client verticals.
Our education client vertical has been significantly affected by regulations and enforcement activity affecting for-profit educational institutions over the past several years. These activities have affected and are expected to continue to affect our clients’ businesses and marketing practices, including an overall decrease in our clients’ external marketing expenditures. The effect of these activities may continue to result in fluctuations in the volume and mix of our business with these clients. To offset the impact these activities have had on the for-profit educational clients, we have broadened our product set from our traditional lead business with the addition of clicks and calls to our product mix. We are also broadening our markets in education to include not-for-profit schools as well as expanding internationally in Brazil and India.
Our financial services client vertical continued to be negatively affected due to the limited availability of high quality media at acceptable margins caused by changes in search engine algorithms, acquisition of media sources by competitors and increased competition for quality media. These effects may continue to impact our business in the near future. To offset this impact, we have broadened our product set with the launch of enhanced click, lead and policy products, where better monetization will provide greater access to high quality media sources.
Acquisitions
Acquisitions in Fiscal Year 2014
In December 2013, we acquired the operations of an online publishing business for $0.9 million in cash paid upon closing of the acquisition.
Acquisitions in Fiscal Year 2013
We did not complete any acquisitions during fiscal year 2013.
Acquisitions in Fiscal Year 2012
In February 2012, we acquired certain assets of Ziff Davis Enterprise from Enterprise Media Group, Inc., a New York-based online media and marketing company in the business-to-business technology market, in exchange for $17.3 million in cash, to broaden our registered user database and brand name in the business-to-business technology market. In August 2011, we acquired 100% of the outstanding equity interests of NarrowCast Group, LLC, or IT BusinessEdge, a Kentucky-based Internet media company in the business-to-business technology market, in exchange for $24.0 million in cash, to broaden our registered user database and media access in the business-to-business technology market. During fiscal year 2012, in addition to certain assets of Ziff Davis Enterprise and all of the equity interests of IT BusinessEdge, we acquired eleven other online publishing businesses.
Development, Acquisition and Retention of Targeted Media
One of the primary challenges of our business is acquiring or creating media that is high quality and targeted enough to attract prospects for our clients at costs that work for our business model. In order to grow our
36
Table of Contents
Index to Financial Statements
business, we must be able to develop or acquire and retain quality targeted media on a cost-effective basis. Changes in search engine algorithms, and retain high quality targeted media and increased competition on available media has, during some periods, limited and may continue to limit our ability to generate revenue.
Seasonality
Our results are subject to significant fluctuation as a result of seasonality. In particular, our quarters ending December 31 (our second fiscal quarter) are typically characterized by seasonal weakness. In our second fiscal quarters, there is lower availability of lead supply from some forms of media during the holiday period on a cost effective basis and some of our clients have lower budgets. In our quarters ending March 31 (our third fiscal quarter), this trend generally reverses with better lead availability and often new budgets at the beginning of the year for our clients with fiscal years ending December 31.
Regulations
Our revenue has fluctuated as a result of recently adopted or amended regulations and the increased enforcement of existing regulations. Our business is affected directly because we operate websites and conduct telemarketing and email marketing, and indirectly as clients adjust their operations as a result of regulatory changes and enforcement activity that affect their industries.
One example of a recent regulatory change that may affect our business is the Telephone Consumer Protection Act (the “TCPA”), which the Federal Communications Commission amended to, among other things, impose heightened consent and opt-out requirements that companies conducting telemarketing must follow. Certain provisions of the regulations became effective in July 2012, and additional regulations requiring prior express written consent for telemarketing calls to wireless numbers became effective in October 2013. Our efforts to comply with the TCPA has not had a material impact on traffic conversion rates. Our clients may make business decisions based on their own experiences with the TCPA regardless of our products, and the changes we implemented to comply with the new regulations. Those decisions may negatively affect our revenue or profitability.
In addition, our education client vertical has been significantly affected by the adoption of regulations affecting for-profit educational institutions over the past several years, and a higher level of governmental scrutiny is expected to continue. Clients in our financial services vertical have increasingly been affected by laws and regulations as a result of the adoption of new regulations under The Dodd–Frank Wall Street Reform and Consumer Protection Act and the increased enforcement of new and pre-existing laws and regulations. The effect of these regulations, or any future regulations, may continue to result in fluctuations in the volume and mix of our business with these clients.
Basis of Presentation
General
We operate in one reportable segment: DMS. The remainder of our business is classified as “all other”. See Note 14, Segment Information, to our consolidated financial statements for further discussion and financial information regarding our reporting segment.
Net Revenue
Our DMS business generates revenue from fees earned through the delivery of qualified leads, clicks, calls, customers and, to a lesser extent, display advertisements, or impressions. We deliver targeted and measurable results through a vertical focus that we classify into the following client verticals: education, financial services and “other” (which includes business-to-business technology, home services and medical). All other revenue
37
Table of Contents
Index to Financial Statements
generated is less than 1% of net revenue in fiscal years 2014, 2013 and 2012. We expect all other revenue to continue to represent an immaterial portion of our business.
Cost of Revenue
Cost of revenue consists primarily of media costs, personnel costs, amortization of intangible assets, depreciation expense and amortization of internal software development costs related to revenue-producing technologies. Media costs consist primarily of fees paid to third-party publishers that are directly related to a revenue-generating event and pay-per-click (PPC) ad purchases from Internet search companies. We pay these third-party publishers and Internet search companies on a revenue-share, a cost-per-lead (CPL) cost-per-click, (CPC), or cost-per-thousand-impressions (CPM) basis. Personnel costs include salaries, stock-based compensation expense, bonuses and employee benefit costs. Personnel costs are primarily related to individuals associated with maintaining our servers and websites, our editorial staff, client management, creative team, content, compliance group and media purchasing analysts. Costs associated with software incurred in the development phase or obtained for internal use are capitalized and amortized in cost of revenue over the software’s estimated useful life. We anticipate that our cost of revenue will increase more than our revenue for the near term as we invest in opportunities we see in the financial services client vertical.
Operating Expenses
We classify our operating expenses into three categories: product development, sales and marketing, and general and administrative. Our operating expenses consist primarily of personnel costs and, to a lesser extent, professional services fees, rent and other costs. Personnel costs for each category of operating expenses generally include salaries, stock-based compensation expense, bonuses, commissions and employee benefit costs.
Product Development. Product development expenses consist primarily of personnel costs and professional services fees associated with the development and maintenance of our technology platforms, development and launching of our websites, product-based quality assurance and testing. In the current period of business challenges, we are constraining expenses generally to the extent practicable. However, we expect product and development expenses to continue to increase in absolute dollars in the future as we believe that continuous investment in technology is critical to attaining our strategic objectives.
Sales and Marketing. Sales and marketing expenses consist primarily of personnel costs, advertising, professional services fees, and travel costs. We expect sales and marketing expenses to continue to increase in absolute dollars as we increase advertising spend and hire additional personnel in sales and marketing to support our offerings.
General and Administrative. General and administrative expenses consist primarily of personnel costs of our executive, finance, legal, employee benefits and compliance, technical support and other administrative personnel, as well as accounting and legal professional services fees, and insurance. In the current period of business challenges, we are constraining expenses generally to the extent practicable. However, we expect general and administrative expenses to increase in absolute dollars in future periods as we continue to invest in corporate infrastructure.
Interest and Other Income (Expense), Net
Interest and other expense, net, consists primarily of interest expense, other income and expense, net and interest income. Interest expense is related to our credit facility, including the related interest rate swap and promissory notes issued in connection with our acquisitions, and includes imputed interest on non-interest bearing notes. Borrowings under our credit facility, the aggregate principal amount of outstanding promissory notes and related interest expense could increase if, among other things, we make additional acquisitions through debt financing. Interest income represents interest earned on our cash, cash equivalents and marketable securities, which may increase or decrease depending on market interest rates and the amounts invested.
38
Table of Contents
Index to Financial Statements
Other income (expense), net, includes foreign currency exchange gains and losses and other non-operating items.
Income Tax (Provision for) Benefit from
We are subject to tax in the United States as well as other tax jurisdictions or countries in which we conduct business. Earnings from our limited non-U.S. activities are subject to local country income tax and may be subject to U.S. income tax.
Results of Operations
The following table sets forth our consolidated statement of operations for the periods indicated:
| Fiscal Year Ended | ||||||||||||||||||||||||
| 2014 | 2013 | 2012 | ||||||||||||||||||||||
| (In thousands) | ||||||||||||||||||||||||
| Net revenue |
$ | 282,549 | 100.0 | % | $ | 305,101 | 100.0 | % | $ | 370,468 | 100.0 | % | ||||||||||||
| Cost of revenue (1) |
241,907 | 85.6 | 251,591 | 82.5 | 283,466 | 76.5 | ||||||||||||||||||
|
|
|
|
|
|
|
|
|
|
|
|
|
|||||||||||||
| Gross profit |
40,642 | 14.4 | 53,510 | 17.5 | 87,002 | 23.5 | ||||||||||||||||||
| Operating expenses: (1) |
||||||||||||||||||||||||
| Product development |
19,548 | 6.9 | 19,048 | 6.2 | 21,051 | 5.7 | ||||||||||||||||||
| Sales and marketing |
16,385 | 5.8 | 14,705 | 4.8 | 14,074 | 3.8 | ||||||||||||||||||
| General and administrative |
17,046 | 6.0 | 16,226 | 5.3 | 23,375 | 6.3 | ||||||||||||||||||
| Impairment of goodwill |
95,641 | 33.8 | 92,350 | 30.3 | — | 0.0 | ||||||||||||||||||
|
|
|
|
|
|
|
|
|
|
|
|
|
|||||||||||||
| Operating (loss) income |
(107,978 | ) | (38.1 | ) | (88,819 | ) | (29.1 | ) | 28,502 | 7.7 | ||||||||||||||
| Interest income |
115 | 0.0 | 115 | 0.0 | 134 | 0.0 | ||||||||||||||||||
| Interest expense |
(3,825 | ) | (1.4 | ) | (5,200 | ) | (1.7 | ) | (4,462 | ) | (1.2 | ) | ||||||||||||
| Other income (expense), net |
1,493 | 0.5 | (69 | ) | (0.0 | ) | (42 | ) | (0.0 | ) | ||||||||||||||
|
|
|
|
|
|
|
|
|
|
|
|
|
|||||||||||||
| (Loss) income before income taxes |
(110,195 | ) | (39.0 | ) | (93,973 | ) | (30.8 | ) | 24,132 | 6.5 | ||||||||||||||
| (Provision for) benefit from taxes |
(36,209 | ) | (12.8 | ) | 26,601 | 8.7 | (11,131 | ) | (3.0 | ) | ||||||||||||||
|
|
|
|
|
|
|
|
|
|
|
|
|
|||||||||||||
| Net (loss) income |
$ | (146,404 | ) | (51.8 | )% | $ | (67,372 | ) | (22.1 | )% | $ | 13,001 | 3.5 | % | ||||||||||
|
|
|
|
|
|
|
|
|
|
|
|
|
|||||||||||||
| (1) | Cost of revenue and operating expenses include stock-based compensation expense as follows: |
| Cost of revenue |
$ | 2,767 | 1.0 | % | $ | 3,930 | 1.3 | % | $ | 4,293 | 1.2 | % | ||||||||||||
| Product development |
2,429 | 0.9 | 2,765 | 0.9 | 2,570 | 0.7 | ||||||||||||||||||
| Sales and marketing |
2,937 | 1.0 | 3,264 | 1.1 | 3,096 | 0.8 | ||||||||||||||||||
| General and administrative |
2,296 | 0.8 | 2,057 | 0.7 | 3,037 | 0.8 |
Net Revenue
| Fiscal Year Ended June 30, | 2014 - 2013 % Change |
2013 - 2012 % Change |
||||||||||||||||||
| 2014 | 2013 | 2012 | ||||||||||||||||||
| (In thousands) | ||||||||||||||||||||
| Net revenue |
$ | 282,549 | $ | 305,101 | $ | 370,468 | (7 | %) | (18 | %) | ||||||||||
| Cost of revenue |
241,907 | 251,591 | 283,466 | (4 | %) | (11 | %) | |||||||||||||
|
|
|
|
|
|
|
|||||||||||||||
| Gross profit |
$ | 40,642 | $ | 53,510 | $ | 87,002 | (24 | %) | (38 | %) | ||||||||||
|
|
|
|
|
|
|
|||||||||||||||
Net revenue decreased $22.6 million, or 7%, in fiscal year 2014 compared to fiscal year 2013. Our education client vertical revenue decreased $15.0 million, or 11%, primarily as a result of our education clients’
39
Table of Contents
Index to Financial Statements
lower budgets, largely due to uncertainty surrounding regulations and enforcement activity affecting for-profit educational institutions and their operational adjustment to this activity. Our financial services client vertical revenue decreased $8.2 million, or 7%, primarily due to our inability to cost effectively access sufficient high quality media during the first three quarters of the year, as well as due to a reduction in mortgage inquiry traffic caused by an increase in interest rates. Revenue from other client verticals increased $0.6 million, or 1%, primarily due to increased client demand in our business-to-business and home services client verticals partially offset by decreased client demand in our medical client vertical.
Net revenue decreased $65.4 million, or 18%, in fiscal year 2013 compared to fiscal year 2012. Our financial services client vertical revenue decreased $35.4 million, or 23%, primarily due to reduced availability of quality publisher media as a result of search engine algorithm changes, acquisitions of media sources by competitors and increased competition for quality media. Our education client vertical revenue decreased $19.6 million, or 13%, primarily as a result of our education clients’ lower budgets, largely due to uncertainty surrounding regulations affecting for-profit educational institutions and their operational adjustment to those regulation changes. Revenue from other client verticals decreased $10.3 million, or 17%, primarily due to decreased client demand in our home services and business-to-business technology client verticals.
Cost of Revenue
Cost of revenue decreased $9.7 million, or 4%, in fiscal year 2014 compared to fiscal year 2013, driven by decreased media costs of $6.7 million, decreased amortization of intangible assets and depreciation of $6.4 million, and decreased stock based compensation expense of $1.2 million, partially offset by increased personnel costs of $2.6 million and other increases of $2.0 million. The decreased media costs were primarily attributable to lower revenue levels offset by a lower mix of traffic from owned and operated websites. The decreased amortization of intangible assets was attributable to an amortization charge associated with certain licensed patents in fiscal year 2013, assets from historical acquisitions becoming fully amortized and a reduced number of acquisitions in recent periods. The increased personnel costs were attributable to an increase in average headcount. Gross margin was 14% in fiscal year 2014 compared to 18% in fiscal year 2013.
Cost of revenue decreased $31.9 million, or 11%, in fiscal year 2013 compared to fiscal year 2012, driven by decreased media costs of $26.1 million due to lower lead and click volumes, decreased personnel costs of $4.9 million and other decreases of $1.7 million, partially offset by increased amortization of intangible assets and depreciation of $1.2 million. The decreased personnel costs were attributable to a reduction in average headcount. Gross margin was 18% in fiscal year 2013 compared to 23% in fiscal year 2012.
Operating Expenses
| Fiscal Year Ended June 30, | 2014 - 2013 % Change |
2013 - 2012 % Change |
||||||||||||||||||
| 2014 | 2013 | 2012 | ||||||||||||||||||
| (In thousands) | ||||||||||||||||||||
| Product development |
$ | 19,548 | $ | 19,048 | $ | 21,051 | 3 | % | (10 | %) | ||||||||||
| Sales and marketing |
16,385 | 14,705 | 14,074 | 11 | % | 4 | % | |||||||||||||
| General and administrative |
17,046 | 16,226 | 23,375 | 5 | % | (31 | %) | |||||||||||||
| Impairment of goodwill |
95,641 | 92,350 | — | 4 | % | 100 | % | |||||||||||||
|
|
|
|
|
|
|
|||||||||||||||
| Operating expenses |
$ | 148,620 | $ | 142,329 | $ | 58,500 | 4 | % | 143 | % | ||||||||||
|
|
|
|
|
|
|
|||||||||||||||
Product Development Expenses
Product development expenses increased $0.5 million, or 3%, in fiscal year 2014 compared to fiscal year 2013, primarily due to increased personnel costs of $0.8 million due to an increase in average headcount, offset by a decrease in stock-based compensation expense of $0.3 million.
40
Table of Contents
Index to Financial Statements
Product development expenses decreased $2.0 million, or 10%, in fiscal year 2013 compared to fiscal year 2012, primarily due to decreased personnel costs of $1.5 million resulting from a reduction in average headcount and other decreases in various product development expenses.
Sales and Marketing Expenses
Sales and marketing expenses increased $1.7 million, or 11%, in fiscal year 2014 compared to fiscal year 2013, primarily due to increased advertising expenses for our current product offerings of $1.0 million and increased personnel costs of $0.6 million.
Sales and marketing expenses increased $0.6 million, or 4%, in fiscal year 2013 compared to fiscal year 2012, primarily due to increased personnel costs of $0.8 million and increased stock-based compensation expense of $0.2 million, partially offset by decreased advertising cost of $0.2 million.
General and Administrative Expenses
General and administrative expenses increased $0.8 million, or 5%, in fiscal year 2014 compared to fiscal year 2013. This was primarily due to an additional business tax assessment of $0.8 million, an increase in software license fees and maintenance contracts of $0.4 million due to increased company-wide headcount, an increase in bad debt expense of $0.3 million and an increase in stock-based compensation expense of $0.2 million due to incremental stock grants offset by a decrease in personnel costs of $1.0 million.
General and administrative expenses decreased $7.1 million, or 31%, in fiscal year 2013 compared to fiscal year 2012. This was due to a $2.5 million payment to the attorneys general of multiple states in connection with a settlement related to online marketing for education companies in the prior year and additional decreased legal costs of $1.9 million related primarily to litigation expense, decreased bad debt expense of $1.4 million resulting from the insolvency of an advertising agency of record of one of our clients in the prior year, and decreased stock-based compensation expense of $1.0 million related to the departure of one of our directors and reduction in average headcount.
Impairment of Goodwill
As discussed under “Critical Accounting Policies and Estimates” we recorded a goodwill impairment charge of $95.6 million for the year ended June 30, 2014 compared to $92.4 million for the year ended June 30, 2013.
Interest and Other Expense, Net
| Fiscal Year Ended June 30, | 2014 - 2013 % Change |
2013 - 2012 % Change |
||||||||||||||||||
| 2014 | 2013 | 2012 | ||||||||||||||||||
| (In thousands) | ||||||||||||||||||||
| Interest income |
$ | 115 | $ | 115 | $ | 134 | 0 | % | (14 | %) | ||||||||||
| Interest expense |
(3,825 | ) | (5,200 | ) | (4,462 | ) | (26 | %) | 17 | % | ||||||||||
| Other income (expense), net |
1,493 | (69 | ) | (42 | ) | 2264 | % | 64 | % | |||||||||||
|
|
|
|
|
|
|
|||||||||||||||
| Interest and other expense, net |
$ | (2,217 | ) | $ | (5,154 | ) | $ | (4,370 | ) | (57 | %) | 18 | % | |||||||
|
|
|
|
|
|
|
|||||||||||||||
Interest and other expense, net decreased by $2.9 million, or 57%, in fiscal year 2014 compared to fiscal year 2013, primarily due to increased other income (expense), net related to the gain of $0.9 million on the sale of our shares of preferred stock in DemandBase and the sale of certain domain names for a gain of $0.5 million and due to decreased interest expense related to accelerated amortization of approximately $0.7 million of unamortized deferred upfront costs incurred in connection with the amendment of our credit facility in fiscal year 2013 and decreased debt obligations.
41
Table of Contents
Index to Financial Statements
Interest and other (expense), net increased by $0.8 million, or 18%, in fiscal year 2013 compared to fiscal year 2012, primarily due to increased interest expense related to accelerated amortization of approximately $0.7 million of unamortized deferred upfront costs incurred in connection with the amendment of our credit facility during the third quarter of fiscal 2013. See Note 9, Debt, to our consolidated financial statements for more information about our credit facility.
Benefit from (Provision for) Taxes
| Fiscal Year Ended June 30, | ||||||||||||
| 2014 | 2013 | 2012 | ||||||||||
| (In thousands) | ||||||||||||
| (Provision for) benefit from taxes |
$ | (36,209 | ) | $ | 26,601 | $ | (11,131 | ) | ||||
| Effective tax rate |
(32.8 | )% | 28.3 | % | 46.1 | % | ||||||
The decrease in our effective tax rate for the fiscal year 2014 compared to fiscal year 2013 was primarily due to a one-time, non-cash charge to establish a valuation allowance for a specific portion of our deferred tax assets.
The decrease in our effective tax rate for fiscal year 2013 compared to fiscal year 2012, was primarily due to a goodwill impairment charge of $92.4 million for fiscal year 2013. The goodwill impairment charge had an associated tax benefit of $28.7 million due to the impairment of goodwill that is deductible for tax purposes.
As of June 30, 2014, we had net deferred tax assets of $1.9 million. Our net deferred tax assets consist primarily of historic taxable income available to carryback projected future losses. See Note 8, Income Taxes, to our consolidated financial statements for more information about our deferred tax assets.
Selected Quarterly Financial Data
The following table sets forth our unaudited quarterly consolidated statements of operations data for the eight quarters ended June 30, 2014. We have prepared the statements of operations for each of these quarters on the same basis as the audited consolidated financial statements included elsewhere in this report and, in the opinion of management, each statement of operations includes all adjustments, consisting solely of normal recurring adjustments, necessary for the fair statement of the results of operations for these periods. This information should be read in conjunction with the audited consolidated financial statements and related notes included elsewhere in this report. These quarterly operating results are not necessarily indicative of our operating results for any future period.
| Three Months Ended | ||||||||||||||||||||||||||||||||
| June 30, 2014 |
Mar 31, 2014 |
Dec 31, 2013 |
Sept 30, 2013 |
June 30, 2013 |
Mar 31, 2013 |
Dec 31, 2012 |
Sept 30, 2012 |
|||||||||||||||||||||||||
| (In thousands, except per share data) | ||||||||||||||||||||||||||||||||
| Net revenue |
$ | 67,555 | $ | 71,888 | $ | 66,145 | $ | 76,961 | $ | 75,707 | $ | 79,017 | $ | 71,751 | $ | 78,626 | ||||||||||||||||
| Costs of revenue |
60,553 | 61,646 | 56,116 | 63,592 | 60,826 | 63,863 | 61,712 | 65,190 | ||||||||||||||||||||||||
|
|
|
|
|
|
|
|
|
|
|
|
|
|
|
|
|
|||||||||||||||||
| Gross profit |
7,002 | 10,242 | 10,029 | 13,369 | 14,881 | 15,154 | 10,039 | 13,436 | ||||||||||||||||||||||||
| Operating expenses: |
||||||||||||||||||||||||||||||||
| Product development |
4,754 | 4,859 | 4,776 | 5,159 | 4,760 | 4,891 | 4,504 | 4,893 | ||||||||||||||||||||||||
| Sales and marketing |
4,689 | 3,881 | 3,659 | 4,156 | 3,835 | 3,683 | 3,496 | 3,691 | ||||||||||||||||||||||||
| General and administrative |
4,217 | 4,284 | 4,411 | 4,134 | 3,887 | 4,394 | 4,019 | 3,926 | ||||||||||||||||||||||||
| Impairment of goodwill |
95,641 | — | — | — | — | — | 92,350 | — | ||||||||||||||||||||||||
|
|
|
|
|
|
|
|
|
|
|
|
|
|
|
|
|
|||||||||||||||||
| Operating (loss) income |
(102,299 | ) | (2,782 | ) | (2,817 | ) | (80 | ) | 2,399 | 2,186 | (94,330 | ) | 926 | |||||||||||||||||||
| Interest income |
31 | 30 | 27 | 27 | 31 | 28 | 28 | 28 | ||||||||||||||||||||||||
42
Table of Contents
Index to Financial Statements
| Three Months Ended | ||||||||||||||||||||||||||||||||
| June 30, 2014 |
Mar 31, 2014 |
Dec 31, 2013 |
Sept 30, 2013 |
June 30, 2013 |
Mar 31, 2013 |
Dec 31, 2012 |
Sept 30, 2012 |
|||||||||||||||||||||||||
| (In thousands, except per share data) | ||||||||||||||||||||||||||||||||
| Interest expense |
(912 | ) | (911 | ) | (976 | ) | (1,026 | ) | (1,024 | ) | (1,810 | ) | (1,354 | ) | (1,012 | ) | ||||||||||||||||
| Other (expense) income, net |
1,544 | (3 | ) | (29 | ) | (19 | ) | (72 | ) | (39 | ) | (4 | ) | 46 | ||||||||||||||||||
|
|
|
|
|
|
|
|
|
|
|
|
|
|
|
|
|
|||||||||||||||||
| (Loss) income before income taxes |
(101,636 | ) | (3,666 | ) | (3,795 | ) | (1,098 | ) | 1,334 | 365 | (95,660 | ) | (12 | ) | ||||||||||||||||||
| Benefit from (provision for) taxes |
2,873 | 993 | (40,234 | ) | 159 | (2,916 | ) | (2,527 | ) | 32,169 | (125 | ) | ||||||||||||||||||||
|
|
|
|
|
|
|
|
|
|
|
|
|
|
|
|
|
|||||||||||||||||
| Net loss |
$ | (98,763 | ) | $ | (2,673 | ) | $ | (44,029 | ) | $ | (939 | ) | $ | (1,582 | ) | $ | (2,162 | ) | $ | (63,491 | ) | $ | (137 | ) | ||||||||
|
|
|
|
|
|
|
|
|
|
|
|
|
|
|
|
|
|||||||||||||||||
| Net loss per share: (1) |
||||||||||||||||||||||||||||||||
| Basic |
$ | (2.25 | ) | $ | (0.06 | ) | $ | (1.01 | ) | $ | (0.02 | ) | $ | (1.57 | ) | $ | (0.05 | ) | $ | (1.48 | ) | $ | (0.00 | ) | ||||||||
|
|
|
|
|
|
|
|
|
|
|
|
|
|
|
|
|
|||||||||||||||||
| Diluted |
$ | (2.25 | ) | $ | (0.06 | ) | $ | (1.01 | ) | $ | (0.02 | ) | $ | (1.57 | ) | $ | (0.05 | ) | $ | (1.48 | ) | $ | (0.00 | ) | ||||||||
|
|
|
|
|
|
|
|
|
|
|
|
|
|
|
|
|
|||||||||||||||||
| Other Financial Data: |
||||||||||||||||||||||||||||||||
| Adjusted EBITDA |
$ | 1,802 | $ | 6,279 | $ | 6,477 | $ | 9,631 | $ | 12,261 | $ | 12,407 | $ | 11,228 | $ | 11,975 | ||||||||||||||||
|
|
|
|
|
|
|
|
|
|
|
|
|
|
|
|
|
|||||||||||||||||
| (1) | Net loss per share for the four quarters of each fiscal year may not sum to the total for the fiscal year because of the different number of shares outstanding during each period. |
Adjusted EBITDA
Our use of adjusted EBITDA. We include adjusted EBITDA in this report because (i) we seek to manage our business to a level of adjusted EBITDA as a percentage of net revenue, (ii) it is a key basis upon which our management assesses our operating performance, (iii) it is one of the primary metrics investors use in evaluating Internet marketing companies, (iv) it is a factor in the evaluation of the performance of our management in determining compensation, and (v) it is an element of certain financial covenants under our credit facility. We define adjusted EBITDA as net (loss) income less benefit from (provision for) taxes, depreciation expense, amortization expense, stock-based compensation expense, interest, other income (expense), net, impairment of goodwill, and other extraordinary or non-recurring expenses.
We use adjusted EBITDA as a key performance measure because we believe it facilitates operating performance comparisons from period to period by excluding potential differences caused by variations in capital structures (affecting interest expense), tax positions (such as the impact on periods or companies of changes in effective tax rates or fluctuations in permanent differences or discrete quarterly items) and the non-cash impact of depreciation, amortization, stock-based compensation expense, and impairment of goodwill. Since adjusted EBITDA facilitates internal comparisons of our historical operating performance on a more consistent basis, we also use adjusted EBITDA for business planning purposes, to incentivize and compensate our management personnel and in evaluating acquisition opportunities.
In addition, we believe adjusted EBITDA and similar measures are widely used by investors, securities analysts, ratings agencies and other interested parties in our industry as a measure of financial performance and debt-service capabilities. Our use of adjusted EBITDA has limitations as an analytical tool, and it should not be considered in isolation or as a substitute for analysis of our results as reported under GAAP. Some of these limitations are:
| • | adjusted EBITDA does not reflect our cash expenditures for capital equipment or other contractual commitments; |
| • | although depreciation and amortization are non-cash charges, the assets being depreciated and amortized may have to be replaced in the future, and adjusted EBITDA does not reflect cash capital expenditure requirements for such replacements; |
43
Table of Contents
Index to Financial Statements
| • | adjusted EBITDA does not reflect changes in, or cash requirements for, our working capital needs; |
| • | adjusted EBITDA does not consider the potentially dilutive impact of issuing stock-based compensation to our management team and employees; |
| • | adjusted EBITDA does not reflect the interest expense or the cash requirements necessary to service interest or principal payments on our indebtedness; |
| • | adjusted EBITDA does not reflect certain tax payments that may represent a reduction in cash available to us; and |
| • | other companies, including companies in our industry, may calculate adjusted EBITDA measures differently, which reduces their usefulness as a comparative measure. |
Due to these limitations, adjusted EBITDA should not be considered as a measure of discretionary cash available to us to invest in the growth of our business. When evaluating our performance, adjusted EBITDA should be considered alongside other financial performance measures, including various cash flow metrics, net (loss) income and our other GAAP results.
The following table presents a reconciliation of adjusted EBITDA to net (loss) income, the most comparable GAAP measure, for each of the periods indicated:
| Three Months Ended | ||||||||||||||||||||||||||||||||
| June 30, 2014 |
Mar 31, 2014 |
Dec 31, 2013 |
Sept 30, 2013 |
June 30, 2013 |
Mar 31, 2013 |
Dec 31, 2012 |
Sept 30, 2012 |
|||||||||||||||||||||||||
| (In thousands) | ||||||||||||||||||||||||||||||||
| Net loss |
$ | (98,763 | ) | $ | (2,673 | ) | $ | (44,029 | ) | $ | (939 | ) | $ | (1,582 | ) | $ | (2,162 | ) | $ | (63,491 | ) | $ | (137 | ) | ||||||||
| Interest and other (expense) income, net |
(663 | ) | 884 | 978 | 1,018 | 1,065 | 1,821 | 1,330 | 938 | |||||||||||||||||||||||
| (Benefit from) provision for taxes |
(2,873 | ) | (993 | ) | 40,234 | (159 | ) | 2,916 | 2,527 | (32,169 | ) | 125 | ||||||||||||||||||||
| Depreciation and amortization |
6,142 | 6,611 | 6,668 | 6,676 | 6,659 | 7,208 | 10,179 | 8,279 | ||||||||||||||||||||||||
| Stock-based compensation expense |
2,318 | 2,450 | 2,626 | 3,035 | 3,203 | 3,013 | 3,029 | 2,770 | ||||||||||||||||||||||||
| Impairment of goodwill |
95,641 | — | — | — | — | — | 92,350 | — | ||||||||||||||||||||||||
|
|
|
|
|
|
|
|
|
|
|
|
|
|
|
|
|
|||||||||||||||||
| Adjusted EBITDA |
$ | 1,802 | $ | 6,279 | $ | 6,477 | $ | 9,631 | $ | 12,261 | $ | 12,407 | $ | 11,228 | $ | 11,975 | ||||||||||||||||
|
|
|
|
|
|
|
|
|
|
|
|
|
|
|
|
|
|||||||||||||||||
| . | . | |||||||||||||||||||||||||||||||
| Adjusted EBITDA as a percentage of net revenue |
3 | % | 9 | % | 10 | % | 13 | % | 16 | % | 16 | % | 16 | % | 15 | % | ||||||||||||||||
Adjusted EBITDA quarterly trends. We seek to manage our business to a level of adjusted EBITDA as a percentage of net revenue. We do so on a fiscal year basis by varying our operations to balance revenue growth and costs throughout the fiscal year. We do not seek to manage our business to a level of adjusted EBITDA on a quarterly basis and we expect our adjusted EBITDA margins to vary from quarter to quarter.
Liquidity and Capital Resources
As of June 30, 2014, our principal sources of liquidity consisted of cash and cash equivalents of $84.2 million, short-term marketable securities of $38.6 million, cash we expect to generate from operations, and our $50.0 million revolving credit line, which is committed until November 2016, a portion of which is available to be drawn subject to compliance with applicable covenants. Our cash and cash equivalents are maintained in highly liquid investments with remaining maturities of 90 days or less at the time of purchase. We believe our cash equivalents are liquid and accessible.
44
Table of Contents
Index to Financial Statements
Our short-term and long-term liquidity requirements primarily arise from our working capital requirements, debt service on our $77.5 million term loan balance at June 30, 2014, and acquisitions from time to time. Our primary operating cash requirements include the payment of media costs, personnel costs, costs of information technology systems and office facilities. Our ability to fund these requirements will depend on our future cash flows, which are determined, in part, by future operating performance and are, therefore, subject to prevailing global macroeconomic conditions and financial, business and other factors, some of which are beyond our control, and also our ability to access our credit facility. Even though we may not need additional funds, we may still elect to obtain additional debt or equity securities or draw down on or increase our borrowing capacity under our current credit facility for other reasons.
We believe that our existing cash, cash equivalents, short-term marketable securities, cash generated from operations and our available borrowings under the credit facility will be sufficient to satisfy our currently anticipated cash requirements through at least the next 12 months.
| Fiscal Year Ended June 30, | ||||||||||||
| 2014 | 2013 | 2012 | ||||||||||
| (In thousands) | ||||||||||||
| Cash flows from operating activities |
$ | 18,377 | $ | 50,665 | $ | 46,375 | ||||||
| Cash flows used in investing activities |
(10,731 | ) | (7,469 | ) | (66,554 | ) | ||||||
| Cash flows used in financing activities |
(13,539 | ) | (21,616 | ) | (43,447 | ) | ||||||
Net Cash Provided by Operating Activities
Cash flows from operating activities are primarily the result of our net (loss) income adjusted for depreciation and amortization, stock-based compensation expense, impairment of goodwill and changes in working capital components.
Cash flows provided by operating activities were $18.4 million for fiscal year 2014 compared to $50.7 million for fiscal year 2013 and $46.4 million for fiscal year 2012.
Cash flows provided by operating activities in fiscal year 2014 consisted of primarily non-cash adjustments of $130.4 million and changes in working capital of $34.4 million, partially offset by net loss of $146.4 million. The changes in working capital accounts was primarily due to a decrease in net deferred taxes of $45.1 million and an increase in accounts payable and accrued liabilities of $0.4 million partially offset by an increase in accounts receivable of $3.5 million, an increase in prepaid expenses and other current assets of $6.3 million, and a decrease in deferred revenue and other noncurrent liabilities of $1.3 million. The decrease in deferred taxes is due to a one-time charge to establish a valuation allowance. The increase in accounts receivable is due to timing of collections. The non-cash charges primarily consisted of impairment of goodwill of $95.6 million, depreciation and amortization of $26.1 million, and stock-based compensation expense net of tax benefits of $9.9 million, offset by other adjustments, net of $1.1 million.
Cash flows provided by operating activities in fiscal year 2013 consisted of primarily non-cash adjustments of $136.6 million, partially offset by net loss of $67.4 million and an increase in working capital of $18.5 million. The non-cash adjustments consisted primarily of impairment of goodwill of $92.4 million, depreciation and amortization of $32.3 million and stock-based compensation expense net of tax benefits of $11.9 million. The contribution to working capital accounts was primarily due to an increase in deferred taxes of $30.8 million resulting from tax deductible goodwill write-off, a decrease in accounts receivable of $15.3 million, net decrease in accounts payable and accrued liabilities of $6.0 million, and a decrease in prepaid expenses and other assets of $3.2 million. The decrease in accounts receivable are primarily due to better collections. The net decrease in accounts payable and accrued and prepaid expenses and other assets are primarily due to timing of payments.
45
Table of Contents
Index to Financial Statements
Cash flows provided by operating activities in fiscal year 2012 consisted of primarily non-cash adjustments of $44.6 million and net income of $13.0 million, partially offset by contributions to working capital of $11.3 million. The non-cash adjustments primarily consisted of depreciation and amortization of $31.2 million and stock-based compensation expense net of tax benefits of $12.8 million. The contribution to working capital accounts was primarily due to a decrease in accounts payable and accrued liabilities of $7.8 million and a decrease in deferred taxes of $2.8 million, partially offset by an increase in prepaid expenses and other assets of $2.7 million, and an increase in accounts receivable of $2.0 million. The decrease in accounts payable and accrued liabilities is due to timing of payments and decreased cost of revenue associated with decreased revenue. The decrease in deferred taxes is due to larger temporary differences between the financial statement carrying amount and the tax basis of certain existing assets and liabilities. The increase in prepaid expenses and other assets is primarily due to timing of payments. The increase in accounts receivable is attributable to timing of receipts.
Net Cash Used in Investing Activities
Cash flows from investing activities include acquisitions of media websites and businesses; purchases, sales and maturities of marketable securities; capital expenditures; and capitalized internal development costs.
Cash flows used by investing activities were $10.7 million for fiscal year 2014 compared to $7.5 million for fiscal year 2013 and $66.6 million for fiscal year 2012.
Cash used in investing activities in fiscal year 2014 was primarily due to capital expenditures and internal software development costs of $7.9 million, licenses to intangible assets of $2.8 million and acquisition costs of $0.9 million offset by proceeds from sale of investment of $1.4 million and other investing activities of $0.5 million. Net investments in marketable securities totaled $1.0 million.
Cash used in investing activities in fiscal year 2013 was primarily due to net investments in marketable securities of $1.1 million and licenses of intangible assets of $2.5 million. Capital expenditures and internal software development costs totaled $3.9 million in fiscal year 2013.
Cash used in investing activities in fiscal year 2012 was primarily due to our acquisition of IT Business Edge for a cash payment of $24.0 million, acquisition of certain assets of Ziff Davis Enterprise of $17.3 million and the purchases of the operations of eleven other online publishing businesses for an aggregate of $14.6 million in cash payments, as well as net investments in marketable securities of $1.8 million. Capital expenditures and internal software development costs totaled $4.6 million in fiscal year 2012.
Net Cash Used in Financing Activities
Cash flows from financing activities include proceeds from exercise of stock options, withholding taxes related to restricted stock net of share settlement, excess tax benefits from stock-based compensation, and principal payments on bank debt and acquisition-related notes payable.
Cash flows used by financing activities were $13.5 million for fiscal year 2014 compared to $21.6 million for fiscal year 2013 and $43.4 million for fiscal year 2012.
Cash used in financing activities in fiscal year 2014 was primarily due to principal payments on acquisition-related notes payable and our term loan and related fees of $15.5 million and withholding taxes related to restricted stock net of share settlement of $1.9 million offset by proceeds received from exercises of stock options of $3.3 million and excess tax benefits from exercises of stock options of $0.5 million.
Cash used in financing activities in fiscal year 2013 was primarily due to principal payments on acquisition-related notes payable and our term loan and related fees of $15.8 million and repurchases of our common stock
46
Table of Contents
Index to Financial Statements
of $6.2 million under our stock repurchase program partially offset by proceeds received from exercises of stock options of $0.5 million.
Cash used in financing activities in fiscal year 2012 was primarily due to repurchases of our common stock of $43.9 million under our stock repurchase program and principal payments on acquisition-related notes payable and our term loan and related fees of $9.9 million, partially offset by proceeds from bank debt of $5.9 million and exercises of stock options of $4.7 million.
Off-Balance Sheet Arrangements
During the periods presented, we did not have any relationships with unconsolidated entities or financial partnerships, such as entities often referred to as structured finance or special purpose entities, which would have been established for the purpose of facilitating off-balance sheet arrangements or other contractually narrow or limited purposes.
Contractual Obligations
Our contractual obligations relate primarily to borrowings under our credit facility, acquisition-related notes payable, and operating leases.
The following table sets forth payments due under our contractual obligations as of June 30, 2014:
| Payment Due by Period | ||||||||||||||||||||
| Total | Less than 1 Year |
1-3 Years | 3-5 Years | More than 5 Years |
||||||||||||||||
| (In thousands) | ||||||||||||||||||||
| Second Loan Agreement |
$ | 77,500 | $ | 17,500 | $ | 60,000 | $ | — | $ | — | ||||||||||
| Operating Leases |
14,409 | 3,541 | 6,707 | 4,161 | — | |||||||||||||||
| Promissory Notes |
610 | 560 | 50 | — | — | |||||||||||||||
|
|
|
|
|
|
|
|
|
|
|
|||||||||||
| Total |
$ | 92,519 | $ | 21,601 | $ | 66,757 | $ | 4,161 | $ | — | ||||||||||
|
|
|
|
|
|
|
|
|
|
|
|||||||||||
The above table does not include approximately $3.1 million of long-term income tax liabilities for uncertainty in income taxes due to the fact that we are unable to reasonably estimate the timing of these potential future payments.
Credit Facility
In November 2011, we entered into the Second Amended and Restated Revolving Credit and Term Loan Agreement (“Second Loan Agreement”) with Comerica Bank (the “Bank”), the administrative agent and lead arranger. The Second Loan Agreement consists of a $100.0 million five-year term loan, with annual principal amortization of 5%, 10%, 15%, 20% and 50%, and a $200.0 million five-year revolving credit line. On February 15, 2013, we entered into the First Amendment to Credit Agreement and Amendment to Guaranty (“First Amendment”) with the Bank to, among other things: (1) amend the definition of EBITDA, effective as of December 31, 2012, to exclude extraordinary or non-recurring non-cash expenses or losses including, without limitation, goodwill impairments, and any extraordinary or non-recurring cash expenses in an aggregate amount not to exceed $5.0 million for the life of the Second Loan Agreement; and (2) reduce the $200.0 million five-year revolving credit line portion of the facility to $100.0 million, effective as of February 15, 2013. On July 17, 2014, we entered into the Second Amendment to Credit Agreement (“Second Amendment”) with the Bank to, among other things, amend the financial covenants and reduce the revolving loan facility from $100.0 million to $50.0 million, each effective as of June 30, 2014.
47
Table of Contents
Index to Financial Statements
Borrowings under the Second Loan Agreement are secured by substantially all of our assets. Interest is payable at a rate computed using either Base rate or Eurodollar rate plus an applicable margin, at our option. Base rate is defined as an applicable margin plus the greatest of (a) the Prime Rate for such day, (b) the Federal Funds Effective Rate in effect on such day, plus 1% and (c) the Daily Adjusting LIBOR Rate plus 1%. Base rate borrowings bear interest at a Base rate plus an applicable margin which varies from (1) 0.625% to 1.375% for revolving loans and (2) 1.00% to 1.75% for term loans, depending on our funded debt to EBITDA ratio. Eurodollar rate borrowings bear interest at the Eurodollar rate plus an applicable margin which varies from (1) 1.625% to 2.375% for revolving loans and (2) 2.00% to 2.75% for term loans, depending on our funded debt to EBITDA ratio. Pursuant to the Second Amendment, for the period beginning on the effective date of the Second Amendment until the delivery of financial statements for the fiscal quarter ending December 31, 2015, (1) the applicable margin for Base rate borrowings is set at (a) 1.375% for revolving loans or (b) 1.75% for term loans, and (2) the applicable margin for Eurodollar rate borrowings is set at (a) 2.375% for revolving loans or (b) 2.75% for term loans. Thereafter, the applicable margin varies depending on our funded debt to EBITDA ratio, as described above.
EBITDA is defined as net (loss) income less (provision for) benefit from taxes, depreciation expense, amortization expense, stock-based compensation expense, interest and other income (expense), acquisition costs for business combinations, extraordinary or non-recurring non-cash expenses or losses including, without limitation, goodwill impairments, and any extraordinary or non-recurring cash expenses in an aggregate amount not to exceed $5 million for the life of this Second Loan Agreement. The revolving loan facility requires an annual facility fee of 0.375% of the revolving credit line capacity. The Second Loan Agreement expires in November 2016. The Second Loan Agreement, as amended, restricts our ability to raise additional debt financing and pay dividends, and also requires us to comply with other nonfinancial covenants. In addition, we are required to maintain financial covenants as follows:
1. A minimum fixed charge coverage ratio as of the end of each fiscal quarter of not less than:
(a) 1.00:1:00 for the period between September 30, 2015 and June 30, 2016; and
(b) 1.15:1:00 for the period beginning July 1, 2016 and thereafter.
The fixed charge coverage ratio is not tested until the fiscal quarter ending September 30, 2015.
2. Minimum EBITDA as of the end of each fiscal quarter of not less than:
(a) $1 for the period between April 1, 2014 and June 30, 2015;
(b) $3,400,000 for the period between July 1, 2015 and September 30, 2015;
(c) $3,200,000 for the period between October 1, 2015 and December 31, 2015.
EBITDA is not tested after the fiscal quarter ending December 31, 2015.
3. Minimum liquidity as of the end of each month of not less than $20,000,000.
We were in compliance with the covenants of our Second Loan Agreement, as amended, as of June 30, 2014 and 2013.
Upfront arrangement fees incurred in connection with the Second Amendment totaled $0.3 million and will be deferred and amortized over the remaining term of the arrangement.
Upfront arrangement fees incurred in connection with the First Amendment totaled $0.2 million and were deferred and will be amortized over the remaining term of the arrangement. In connection with the reduction of the revolving credit line capacity, during the third quarter of fiscal year 2013 we accelerated amortization of approximately $0.7 million of unamortized deferred upfront costs.
48
Table of Contents
Index to Financial Statements
Interest Rate Swap
In February 2012, we entered into an interest rate swap to reduce our exposure to the financial impact of changing interest rates under our term loan. We do not speculate using derivative instruments. The swap encompasses the principal balances outstanding as of January 1, 2014 and scheduled to be outstanding thereafter, such principal and notional amount totaling $85 million in January 2014 and amortizing to $35 million in November 2016. The effective date of the swap was April 9, 2012 with a maturity date of November 4, 2016. At June 30, 2014, we had approximately $77.5 million of notional amount outstanding in the swap agreement that exchanges a variable interest rate base (Eurodollar rate) for a fixed interest rate of 0.97% over the term of the agreement. This interest rate swap is designated as a cash flow hedge of the interest rate risk attributable to forecasted variable interest payments. The effective portion of the fair value gains or losses on this swap are included as a component of accumulated other comprehensive loss.
At June 30, 2014, our interest rate swap qualified as a cash flow hedge. For this qualifying hedge, the effective portion of the change in fair value will be recognized through earnings when the underlying transaction being hedged affects earnings, thereby allowing the swap’s gains and losses to offset interest expense from the term loan in the consolidated statements of operations. Any hedge ineffectiveness is recognized in earnings in the current period.
Headquarters Lease
We entered into a lease agreement in February 2010 for approximately 63,998 square feet of office space located at 950 Tower Lane, Foster City, California. The term of the lease began on November 1, 2010 and expires on October 31, 2018. The monthly base rent was abated for the first 12 calendar months under the lease, and remained at $0.1 million through the 24th calendar month of the term of the lease. After this 24 month period, monthly base rent increased to $0.2 million for the subsequent 12 months and now increases approximately 3% after each 12-month anniversary during the remaining term, including any extensions under our options to extend. We have two options to extend the term of the lease for one additional year for each option following the expiration date of the lease or renewal term, as applicable.
Critical Accounting Policies and Estimates
We have prepared our consolidated financial statements in conformity with accounting principles generally accepted in the United States of America (“GAAP”). In doing so, we are required to make estimates and assumptions that affect the reported amounts of assets and liabilities, disclosure of contingent assets and liabilities at the date of the financial statements and reported amounts of revenue and expenses during the reporting period.
Some of the estimates and assumptions we are required to make relate to matters that are inherently uncertain as they pertain to future events. We base these estimates and assumptions on historical experience or on various other factors that we believe to be reasonable and appropriate under the circumstances. On an ongoing basis, we reconsider and evaluate our estimates and assumptions. Actual results may differ significantly from these estimates.
We believe that the critical accounting policies listed below involve our more significant judgments, estimates and assumptions and, therefore, could have the greatest potential impact on our consolidated financial statements. In addition, we believe that a discussion of these policies is necessary to understand and evaluate the consolidated financial statements contained in this report.
See Note 2, Summary of Significant Accounting Principles, of our consolidated financial statements for further information on our critical and other significant accounting policies.
49
Table of Contents
Index to Financial Statements
Revenue Recognition
More than 99% of total revenue is derived from the DMS business. DMS revenue is derived primarily from fees which are earned through the delivery of qualified leads, clicks, calls, customers and, to a lesser extent, display advertisements, or impressions. We recognize revenue when persuasive evidence of an arrangement exists, delivery has occurred, the fee is fixed or determinable and collectability is reasonably assured. Delivery is deemed to have occurred at the time a qualified lead or click is delivered to the client provided that no significant obligations remain.
Under our revenue recognition policies, we allocate revenue in an arrangement using the estimated selling price (“ESP”) of deliverables if vendor-specific objective evidence (“VSOE”) of selling price based on historical stand-alone sales or third-party evidence (“TPE”) of selling price does not exist. Due to the unique nature of some of our multiple deliverable revenue arrangements, we may not be able to establish selling prices based on historical stand-alone sales or third-party evidence, therefore we may use our best estimate to establish selling prices for these arrangements under the new standard. We establish best estimates within a range of selling prices considering multiple factors including, but not limited to, factors such as class of client, size of transaction, available media inventory, pricing strategies and market conditions. We believe the use of the best estimate of selling price allows revenue recognition in a manner consistent with the underlying economics of the transaction.
From time to time, we may agree to credit a client for certain leads, clicks, calls or customers if they fail to meet the contractual or other guidelines of a particular client. We have established a sales reserve based on historical experience. To date, such credits have been within our expectations.
For a portion of our revenue, we have agreements with providers of online media or third-party publishers used in the generation of qualified leads, clicks, calls or customers. We receive a fee from our clients and pay a fee to publishers either on a revenue-share, cost-per-lead, cost-per-click or cost-per-thousand-impressions basis. We are the primary obligor in the transaction. As a result, the fees paid by our clients are recognized as revenue and the fees paid to our publishers are included in cost of revenue.
All other revenue is comprised of (i) set-up and professional services fees and (ii) usage fees. Set-up and professional service fees that do not provide stand-alone value to a client are recognized over the contractual term of the agreement or the expected client relationship period, whichever is longer, effective when the application reaches the “go-live” date. We define the “go-live” date as the date when the application enters into a production environment or all essential functionalities have been delivered. Usage fees are recognized on a monthly basis as earned.
Deferred revenue is comprised of contractual billings in excess of recognized revenue and payments received in advance of revenue recognition.
Stock-Based Compensation
We measure and record the expense related to stock-based transactions based on the fair values of the awards as determined on the date of grant. For stock options, we selected and have historically used the Black-Scholes option pricing model to estimate the fair value. In applying the Black-Scholes option pricing model, our determination of fair value is affected by assumptions regarding a number of highly complex and subjective variables. These variables include, but are not limited to, the expected stock price volatility over the term of the stock options and the employees’ actual and projected stock option exercise and pre-vesting employment termination behaviors. We estimate the expected volatility of our common stock based on our historical volatility over the stock option’s expected term. We have no history or expectation of paying dividends on our common stock. The risk-free interest rate is based on the U.S. Treasury yield for a term consistent with the expected term of the stock options. The fair value of restricted stock units is determined based on the closing price of our common stock on the date of grant.
50
Table of Contents
Index to Financial Statements
We recognize stock-based compensation expense over the requisite service period using the straight-line method, based on awards ultimately expected to vest. We estimate future forfeitures at the date of grant and revise the estimates, if necessary, in subsequent periods if actual forfeitures differ from those estimates.
Goodwill
We conduct a test for the impairment of goodwill at the reporting unit level on at least an annual basis and whenever there are events or changes in circumstances that would more likely than not reduce the estimated fair value of a reporting unit below its carrying value. Application of the goodwill impairment test requires judgment, including the identification of reporting units, assigning assets and liabilities to reporting units, assigning goodwill to reporting units, and determining the fair value of each reporting unit. Significant judgments required to estimate the fair value of reporting units include estimating future cash flows and determining appropriate discount rates, growth rates, an appropriate control premium and other assumptions. Changes in these estimates and assumptions could materially affect the determination of fair value for each reporting unit which could trigger impairment.
We have two reporting units for purposes of allocating and testing goodwill, DMS and DSS. We performed our annual goodwill impairment test on April 30, 2014 in our quarter ending June 30, 2014. While we are permitted to conduct a qualitative assessment to determine whether it is necessary to perform a two-step quantitative goodwill impairment test, for our annual goodwill impairment test in the fourth quarter of fiscal 2014, we performed a quantitative test for both of our reporting units.
In the first step of the annual impairment test, we compare the fair value of each reporting unit to its carrying value. We estimated the fair value of the DSS reporting unit using only the income approach as market comparables were not meaningful. We have concluded that the carrying value of the DSS reporting unit exceeded its estimated fair value therefore we performed Step 2 analysis, as required and recorded a goodwill impairment charge of $1.2 million for the entire goodwill of our DSS reporting unit. We estimated the fair value of our DMS reporting unit based on our market capitalization and determined that there were no instances of impairment in our DMS reporting unit.
Our public market capitalization sustained a decline after June 30, 2014 primarily due to our operating results in the fourth quarter of fiscal year 2014, to a value below the net book carrying value of our equity. As a result, we determined that this triggered the necessity to conduct an interim goodwill impairment test as of June 30, 2014. We first tested the long-lived assets related to the DMS reporting unit as of June 30, 2014 and, based on the undiscounted cash flows, determined that these assets were not impaired.
A two-step process was then required to test goodwill impairment. The first step is to determine if there is an indication of impairment by comparing the estimated fair value to its carrying value including goodwill. Goodwill is considered impaired if the carrying value exceeds the estimated fair value. Upon indication of impairment, a second step is performed to determine the amount of the impairment by comparing the implied fair value of the reporting unit’s goodwill with its carrying value.
We estimated the fair value of our DMS reporting unit using a weighting of fair values derived most significantly from the market approach which approximated our market capitalization and to a lesser extent the income approach. Under the market approach, we utilize publicly-traded comparable company information to determine revenue and earnings multiples that are used to value our reporting units adjusted for an estimated control premium. As the DMS reporting unit represents substantially the entire Company, the market approach has been reconciled to our market capitalization. Under the income approach, we estimate the fair value of a reporting unit based on the present value of estimated future cash flows. Cash flow projections are based on management’s estimates of revenue growth rates and operating margins, taking into consideration industry and market conditions. The discount rate used is based on the weighted-average cost of capital adjusted for the relevant risk associated with business-specific characteristics and the uncertainty related to the reporting unit’s ability to execute on the projected cash flows.
51
Table of Contents
Index to Financial Statements
The second step of the goodwill impairment test required us to fair value all assets and liabilities of our DMS reporting unit to determine the implied fair value of goodwill. We compared the implied fair value of the reporting unit’s goodwill to its carrying value. This test resulted in a non-cash goodwill impairment charge in aggregate of $95.6 million for the year ended June 30, 2014. The inputs used to measure the estimated fair value of goodwill are classified as a Level 3 fair value measurement due to the significance of unobservable inputs in income approach using company-specific information.
Long-Lived Assets
We evaluate long-lived assets, such as property and equipment and purchased intangible assets with finite lives, for impairment whenever events or changes in circumstances indicate that the carrying value of an asset may not be recoverable. We apply judgment when estimating the fair value of the assets based on the undiscounted future cash flows the assets are expected to generate and recognize an impairment loss if estimated undiscounted future cash flows expected to result from the use of the asset plus net proceeds expected from disposition of the asset, if any, are less than the carrying value of the asset. We tested our long-lived assets related to the DMS reporting unit as of June 30, 2014 and based on the undiscounted cash flows, determined that these assets were not impaired.
Income Taxes
We account for income taxes using an asset and liability approach to record deferred taxes. Our deferred income tax assets represent temporary differences between the financial statement carrying amount and the tax basis of existing assets and liabilities that will result in deductible amounts in future years, including net operating loss carry forwards. A valuation allowance is recorded against our deferred tax assets which are not expected to be realized. Our judgment regarding future profitability may change due to future market conditions, changes in U.S. or international tax laws and other factors.
Recent Accounting Pronouncements
See Note 2, Summary of Significant Accounting Policies, to our consolidated financial statements for information with respect to recent accounting pronouncements and the impact of these pronouncements on our consolidated financial statements.
Item 7A. Quantitative and Qualitative Disclosures about Market Risk
We are exposed to market risks in the ordinary course of our business. These risks include primarily foreign currency exchange and interest rate risks.
Interest Rate Risk
We invest our cash equivalents and short-term investments primarily in liquid, highly-rated U.S. government or municipal fixed income securities, certificates of deposit with financial institutions and money market funds. Unrestricted cash, cash equivalents and short-term investments are held for working capital purposes and acquisition financing. We do not enter into investments for trading or speculative purposes. We believe that we do not have material exposure to changes in the fair value of these investments as a result of changes in interest rates due to the short-term nature of our investments. Declines in interest rates may reduce future investment income. However, a hypothetical decline of 1% in the interest rate on our investments would not have a material effect on our consolidated financial statements.
As of June 30, 2014, our credit facility had $77.5 million in term loans outstanding, and a borrowing capacity of $50.0 million under our revolving line of credit with no amounts outstanding. Interest on borrowings under the credit facility is payable quarterly at specified margins above either the Eurodollar rate or the Prime
52
Table of Contents
Index to Financial Statements
Rate. Our exposure to interest rate risk under the credit facility will depend on the extent to which we utilize such facility. To reduce our exposure to rising interest rates under the term loan, on February 24, 2012, we entered into an interest rate swap encompassing the principal balances scheduled to be outstanding in January 2014 and thereafter, such principal amount totaling $85.0 million on January 1, 2014 and amortizing to $35.0 million on November 4, 2016. The interest rate swap exchanges a variable interest rate base (Eurodollar rate) for a fixed interest rate of 0.97% over the term of the agreement. This interest rate swap is designated as a cash flow hedge of the interest rate risk attributable to forecasted variable interest payments. A hypothetical change of 1% from prevailing interest rates as of June 30, 2014 would not have an effect on our interest rate expense.
Foreign Currency Exchange Risk
To date, our international client agreements have been predominately denominated in U.S. dollars, and accordingly, we have limited exposure to foreign currency exchange rate fluctuations related to client agreements, and do not currently engage in foreign currency hedging transactions. As the local accounts for some of our foreign operations are maintained in the local currency of the respective country, we are subject to foreign currency exchange rate fluctuations associated with the remeasurement to U.S. dollars. A hypothetical change of 10% in foreign currency exchange rates would not have a material effect on our consolidated financial statements.
53
Table of Contents
Index to Financial Statements
Item 8. Financial Statements and Supplementary Data
QUINSTREET, INC.
INDEX TO CONSOLIDATED FINANCIAL STATEMENTS
| Page | ||||
| Report of PricewaterhouseCoopers LLP, Independent Registered Public Accounting Firm |
55 | |||
| 56 | ||||
| 57 | ||||
| 58 | ||||
| 59 | ||||
| 60 | ||||
| 61 | ||||
54
Table of Contents
Index to Financial Statements
REPORT OF INDEPENDENT REGISTERED PUBLIC ACCOUNTING FIRM
To the Board of Directors and Stockholders of QuinStreet, Inc.
In our opinion, the consolidated financial statements listed in the index appearing under Item 15(a)(1) present fairly, in all material respects, the financial position of QuinStreet, Inc. and its subsidiaries at June 30, 2014 and June 30, 2013, and the results of their operations and their cash flows for each of the three years in the period ended June 30, 2014 in conformity with accounting principles generally accepted in the United States of America. In addition, in our opinion, the financial statement schedule listed in the index appearing under Item 15(a)(2) presents fairly, in all material respects, the information set forth therein when read in conjunction with the related consolidated financial statements. Also in our opinion, the Company maintained, in all material respects, effective internal control over financial reporting as of June 30, 2014, based on criteria established in Internal Control — Integrated Framework (1992) issued by the Committee of Sponsoring Organizations of the Treadway Commission (COSO). The Company’s management is responsible for these financial statements and financial statement schedule, for maintaining effective internal control over financial reporting and for its assessment of the effectiveness of internal control over financial reporting, included in Management’s Report on Internal Control over Financial Reporting appearing under Item 9A. Our responsibility is to express opinions on these financial statements, on the financial statement schedule, and on the Company’s internal control over financial reporting based on our integrated audits. We conducted our audits in accordance with the standards of the Public Company Accounting Oversight Board (United States). Those standards require that we plan and perform the audits to obtain reasonable assurance about whether the financial statements are free of material misstatement and whether effective internal control over financial reporting was maintained in all material respects. Our audits of the financial statements included examining, on a test basis, evidence supporting the amounts and disclosures in the financial statements, assessing the accounting principles used and significant estimates made by management, and evaluating the overall financial statement presentation. Our audit of internal control over financial reporting included obtaining an understanding of internal control over financial reporting, assessing the risk that a material weakness exists, and testing and evaluating the design and operating effectiveness of internal control based on the assessed risk. Our audits also included performing such other procedures as we considered necessary in the circumstances. We believe that our audits provide a reasonable basis for our opinions.
A company’s internal control over financial reporting is a process designed to provide reasonable assurance regarding the reliability of financial reporting and the preparation of financial statements for external purposes in accordance with generally accepted accounting principles. A company’s internal control over financial reporting includes those policies and procedures that (i) pertain to the maintenance of records that, in reasonable detail, accurately and fairly reflect the transactions and dispositions of the assets of the company; (ii) provide reasonable assurance that transactions are recorded as necessary to permit preparation of financial statements in accordance with generally accepted accounting principles, and that receipts and expenditures of the company are being made only in accordance with authorizations of management and directors of the company; and (iii) provide reasonable assurance regarding prevention or timely detection of unauthorized acquisition, use, or disposition of the company’s assets that could have a material effect on the financial statements.
Because of its inherent limitations, internal control over financial reporting may not prevent or detect misstatements. Also, projections of any evaluation of effectiveness to future periods are subject to the risk that controls may become inadequate because of changes in conditions, or that the degree of compliance with the policies or procedures may deteriorate.
/s/ PricewaterhouseCoopers LLP
San Jose, California
September 12, 2014
55
Table of Contents
Index to Financial Statements
QUINSTREET, INC.
(In thousands, except share and per share data)
| June 30, | June 30, | |||||||
| 2014 | 2013 | |||||||
| Assets |
||||||||
| Current assets |
||||||||
| Cash and cash equivalents |
$ | 84,177 | $ | 90,117 | ||||
| Marketable securities |
38,630 | 37,847 | ||||||
| Accounts receivable, net |
41,979 | 38,391 | ||||||
| Deferred tax assets |
223 | 6,753 | ||||||
| Prepaid expenses and other assets |
11,647 | 4,623 | ||||||
|
|
|
|
|
|||||
| Total current assets |
176,656 | 177,731 | ||||||
| Property and equipment, net |
11,126 | 9,707 | ||||||
| Goodwill |
55,451 | 150,456 | ||||||
| Other intangible assets, net |
31,441 | 50,486 | ||||||
| Deferred tax assets, noncurrent |
1,712 | 40,289 | ||||||
| Other assets, noncurrent |
457 | 878 | ||||||
|
|
|
|
|
|||||
| Total assets |
$ | 276,843 | $ | 429,547 | ||||
|
|
|
|
|
|||||
| Liabilities and Stockholders’ Equity |
||||||||
| Current liabilities |
||||||||
| Accounts payable |
$ | 19,517 | $ | 18,722 | ||||
| Accrued liabilities |
27,854 | 30,903 | ||||||
| Deferred revenue |
1,175 | 1,638 | ||||||
| Debt |
17,698 | 15,428 | ||||||
|
|
|
|
|
|||||
| Total current liabilities |
66,244 | 66,691 | ||||||
| Deferred revenue, noncurrent |
— | 239 | ||||||
| Debt, noncurrent |
59,565 | 77,249 | ||||||
| Other liabilities, noncurrent |
5,883 | 6,473 | ||||||
|
|
|
|
|
|||||
| Total liabilities |
131,692 | 150,652 | ||||||
|
|
|
|
|
|||||
| Commitments and contingencies (See Note 10) |
||||||||
| Stockholders’ equity |
||||||||
| Common stock: $0.001 par value; 100,000,000 shares authorized; 44,025,908 and 42,886,884 shares issued and outstanding at June 30, 2014 and June 30, 2013, respectively |
44 | 43 | ||||||
| Additional paid-in capital |
239,558 | 226,857 | ||||||
| Accumulated other comprehensive loss |
(1,054 | ) | (1,012 | ) | ||||
| (Accumulated deficit) retained earnings |
(93,397 | ) | 53,007 | |||||
|
|
|
|
|
|||||
| Total stockholders’ equity |
145,151 | 278,895 | ||||||
|
|
|
|
|
|||||
| Total liabilities and stockholders’ equity |
$ | 276,843 | $ | 429,547 | ||||
|
|
|
|
|
|||||
See notes to condensed consolidated financial statements
56
Table of Contents
Index to Financial Statements
QUINSTREET, INC.
CONSOLIDATED STATEMENTS OF OPERATIONS
(In thousands, except per share data)
| Fiscal Year Ended June 30, | ||||||||||||
| 2014 | 2013 | 2012 | ||||||||||
| Net revenue |
$ | 282,549 | $ | 305,101 | $ | 370,468 | ||||||
| Cost of revenue (1) |
241,907 | 251,591 | 283,466 | |||||||||
|
|
|
|
|
|
|
|||||||
| Gross profit |
40,642 | 53,510 | 87,002 | |||||||||
| Operating expenses: (1) |
||||||||||||
| Product development |
19,548 | 19,048 | 21,051 | |||||||||
| Sales and marketing |
16,385 | 14,705 | 14,074 | |||||||||
| General and administrative |
17,046 | 16,226 | 23,375 | |||||||||
| Impairment of goodwill |
95,641 | 92,350 | — | |||||||||
|
|
|
|
|
|
|
|||||||
| Operating (loss) income |
(107,978 | ) | (88,819 | ) | 28,502 | |||||||
| Interest income |
115 | 115 | 134 | |||||||||
| Interest expense |
(3,825 | ) | (5,200 | ) | (4,462 | ) | ||||||
| Other income (expense), net |
1,493 | (69 | ) | (42 | ) | |||||||
|
|
|
|
|
|
|
|||||||
| (Loss) income before income taxes |
(110,195 | ) | (93,973 | ) | 24,132 | |||||||
| (Provision for) benefit from taxes |
(36,209 | ) | 26,601 | (11,131 | ) | |||||||
|
|
|
|
|
|
|
|||||||
| Net (loss) income |
$ | (146,404 | ) | $ | (67,372 | ) | $ | 13,001 | ||||
|
|
|
|
|
|
|
|||||||
| Net (loss) income per share: |
||||||||||||
| Basic |
$ | (3.36 | ) | $ | (1.57 | ) | $ | 0.28 | ||||
| Diluted |
$ | (3.36 | ) | $ | (1.57 | ) | $ | 0.28 | ||||
| Weighted average shares used in computing net (loss) income |
||||||||||||
| per share |
||||||||||||
| Basic |
43,528 | 42,816 | 45,846 | |||||||||
| Diluted |
43,528 | 42,816 | 46,859 | |||||||||
| (1) | Cost of revenue and operating expenses include stock-based compensation expense as follows: |
| Cost of revenue |
$ | 2,767 | $ | 3,930 | $ | 4,293 | ||||||
| Product development |
2,429 | 2,765 | 2,570 | |||||||||
| Sales and marketing |
2,937 | 3,264 | 3,096 | |||||||||
| General and administrative |
2,296 | 2,057 | 3,037 |
See notes to condensed consolidated financial statements
57
Table of Contents
Index to Financial Statements
QUINSTREET, INC.
CONSOLIDATED STATEMENTS OF COMPREHENSIVE (LOSS) INCOME
(In thousands)
| Fiscal Year Ended June 30, | ||||||||||||
| 2014 | 2013 | 2012 | ||||||||||
| Net (loss) income |
$ | (146,404 | ) | $ | (67,372 | ) | $ | 13,001 | ||||
| Other comprehensive (loss) income |
||||||||||||
| Unrealized loss on investments |
(17 | ) | (16 | ) | (2 | ) | ||||||
| Foreign currency translation adjustment |
(49 | ) | (32 | ) | (358 | ) | ||||||
| Interest rate swap |
||||||||||||
| Change in unrealized gain (loss) |
24 | 483 | (1,138 | ) | ||||||||
| Less: reclassification adjustment for gain included in net (loss) income |
— | (8 | ) | 8 | ||||||||
|
|
|
|
|
|
|
|||||||
| Net change |
24 | 475 | (1,130 | ) | ||||||||
|
|
|
|
|
|
|
|||||||
| Other comprehensive (loss) income |
(42 | ) | 427 | (1,490 | ) | |||||||
|
|
|
|
|
|
|
|||||||
| Comprehensive (loss) income |
$ | (146,446 | ) | $ | (66,945 | ) | $ | 11,511 | ||||
|
|
|
|
|
|
|
|||||||
See notes to condensed consolidated financial statements
58
Table of Contents
Index to Financial Statements
QUINSTREET, INC.
CONSOLIDATED STATEMENTS OF STOCKHOLDERS’ EQUITY
(In thousands, except share data)
| Common Stock | Treasury Stock | Additional Paid-in Capital |
Accumulated Other Comprehensive Income (Loss) |
Retained Earnings (Accumulated Deficit) |
Total Shareholders’ Equity |
|||||||||||||||||||||||||||
| Shares | Amount | Shares | Amount | |||||||||||||||||||||||||||||
| Balance at June 30, 2011 |
49,564,877 | $ | 50 | (2,177,452 | ) | $ | (7,779 | ) | $ | 255,689 | $ | 51 | $ | 107,378 | $ | 355,389 | ||||||||||||||||
|
|
|
|
|
|
|
|
|
|
|
|
|
|
|
|
|
|||||||||||||||||
| Issuance of common stock upon exercise of stock options |
525,995 | 1 | — | — | 4,697 | — | — | 4,698 | ||||||||||||||||||||||||
| Release of RSUs |
62,530 | — | — | — | — | — | — | — | ||||||||||||||||||||||||
| Stock-based compensation |
— | — | — | — | 12,996 | — | — | 12,996 | ||||||||||||||||||||||||
| Withholding taxes on the net settlement of RSUs |
— | — | — | — | (417 | ) | — | — | (417 | ) | ||||||||||||||||||||||
| Excess tax losses from stock-based compensation |
— | — | — | — | (694 | ) | — | — | (694 | ) | ||||||||||||||||||||||
| Repurchase of common stock |
— | — | (4,753,919 | ) | (45,126 | ) | — | — | — | (45,126 | ) | |||||||||||||||||||||
| Retirement of treasury stock |
(6,802,571 | ) | (8 | ) | 6,802,571 | 51,727 | (51,719 | ) | — | — | — | |||||||||||||||||||||
| Comprehensive income: |
||||||||||||||||||||||||||||||||
| Net income |
— | — | — | — | — | — | 13,001 | 13,001 | ||||||||||||||||||||||||
| Unrealized gain (loss) on investments |
— | — | — | — | — | (2 | ) | — | (2 | ) | ||||||||||||||||||||||
| Currency translation adjustments |
— | — | — | — | — | (358 | ) | — | (358 | ) | ||||||||||||||||||||||
| Unrealized (loss) gain on interest rate swap |
— | — | — | — | — | (1,130 | ) | — | (1,130 | ) | ||||||||||||||||||||||
|
|
|
|
|
|
|
|
|
|
|
|
|
|
|
|
|
|||||||||||||||||
| Balance at June 30, 2012 |
43,350,831 | $ | 43 | (128,800 | ) | $ | (1,178 | ) | $ | 220,552 | $ | (1,439 | ) | $ | 120,379 | $ | 338,357 | |||||||||||||||
|
|
|
|
|
|
|
|
|
|
|
|
|
|
|
|
|
|||||||||||||||||
| Issuance of common stock upon exercise of stock options |
120,508 | — | — | — | 457 | — | — | 457 | ||||||||||||||||||||||||
| Release of RSUs |
53,910 | — | — | — | — | — | — | — | ||||||||||||||||||||||||
| Stock-based compensation |
— | — | — | — | 12,109 | — | — | 12,109 | ||||||||||||||||||||||||
| Withholding taxes on the net settlement of RSUs |
— | — | — | — | (244 | ) | — | — | (244 | ) | ||||||||||||||||||||||
| Excess tax benefits from stock-based compensation |
— | — | — | — | 140 | — | — | 140 | ||||||||||||||||||||||||
| Repurchase of common stock |
— | — | (509,565 | ) | (4,979 | ) | — | — | — | (4,979 | ) | |||||||||||||||||||||
| Retirement of treasury stock |
(638,365 | ) | — | 638,365 | 6,157 | (6,157 | ) | — | — | — | ||||||||||||||||||||||
| Comprehensive loss: |
||||||||||||||||||||||||||||||||
| Net loss |
— | — | — | — | — | — | (67,372 | ) | (67,372 | ) | ||||||||||||||||||||||
| Unrealized gain (loss) on investments |
— | — | — | — | — | (16 | ) | — | (16 | ) | ||||||||||||||||||||||
| Currency translation adjustments |
— | — | — | — | — | (32 | ) | — | (32 | ) | ||||||||||||||||||||||
| Unrealized (loss) gain on interest rate swap |
— | — | — | — | — | 475 | — | 475 | ||||||||||||||||||||||||
|
|
|
|
|
|
|
|
|
|
|
|
|
|
|
|
|
|||||||||||||||||
| Balance at June 30, 2013 |
42,886,884 | $ | 43 | — | $ | — | $ | 226,857 | $ | (1,012 | ) | $ | 53,007 | $ | 278,895 | |||||||||||||||||
|
|
|
|
|
|
|
|
|
|
|
|
|
|
|
|
|
|||||||||||||||||
| Issuance of common stock upon exercise of stock options |
731,936 | 1 | — | — | 3,652 | — | — | 3,653 | ||||||||||||||||||||||||
| Release of RSUs |
407,088 | — | — | — | — | — | — | — | ||||||||||||||||||||||||
| Stock-based compensation |
— | — | — | — | 10,562 | — | — | 10,562 | ||||||||||||||||||||||||
| Withholding taxes on the net settlement of RSUs |
— | — | — | — | (1,958 | ) | — | — | (1,958 | ) | ||||||||||||||||||||||
| Excess tax benefits from stock-based compensation |
— | — | — | — | 445 | — | — | 445 | ||||||||||||||||||||||||
| Comprehensive loss: |
— | |||||||||||||||||||||||||||||||
| Net loss |
— | — | — | — | — | — | (146,404 | ) | (146,404 | ) | ||||||||||||||||||||||
| Unrealized gain (loss) on investments |
— | — | — | — | — | (17 | ) | — | (17 | ) | ||||||||||||||||||||||
| Currency translation adjustments |
— | — | — | — | — | (49 | ) | — | (49 | ) | ||||||||||||||||||||||
| Unrealized (loss) gain on interest rate swap |
— | — | — | — | — | 24 | — | 24 | ||||||||||||||||||||||||
|
|
|
|
|
|
|
|
|
|
|
|
|
|
|
|
|
|||||||||||||||||
| Balance at June 30, 2014 |
44,025,908 | $ | 44 | — | $ | — | $ | 239,558 | $ | (1,054 | ) | $ | (93,397 | ) | $ | 145,151 | ||||||||||||||||
|
|
|
|
|
|
|
|
|
|
|
|
|
|
|
|
|
|||||||||||||||||
See notes to consolidated financial statements
59
Table of Contents
Index to Financial Statements
QUINSTREET, INC.
CONSOLIDATED STATEMENTS OF CASH FLOWS
(In thousands)
| Fiscal Year Ended June 30, | ||||||||||||
| 2014 | 2013 | 2012 | ||||||||||
| Cash Flows from Operating Activities |
||||||||||||
| Net (loss) income |
$ | (146,404 | ) | $ | (67,372 | ) | $ | 13,001 | ||||
| Adjustments to reconcile net (loss) income to net cash provided by operating activities: |
||||||||||||
| Depreciation and amortization |
26,097 | 32,325 | 31,150 | |||||||||
| Impairment of goodwill |
95,641 | 92,350 | — | |||||||||
| Write-off of bank loan upfront fees |
— | 680 | — | |||||||||
| Provision for sales returns and doubtful accounts receivable |
(104 | ) | (781 | ) | 84 | |||||||
| Stock-based compensation |
10,429 | 12,016 | 12,996 | |||||||||
| Excess tax benefits from stock-based compensation |
(543 | ) | (156 | ) | (197 | ) | ||||||
| Other adjustments, net |
(1,117 | ) | 146 | 598 | ||||||||
| Changes in assets and liabilities, net of effects of acquisitions: |
||||||||||||
| Accounts receivable |
(3,484 | ) | 15,309 | (1,983 | ) | |||||||
| Prepaid expenses and other assets |
(6,331 | ) | 3,344 | (2,617 | ) | |||||||
| Deferred taxes |
45,075 | (30,758 | ) | 2,782 | ||||||||
| Accounts payable |
539 | (4,582 | ) | (376 | ) | |||||||
| Accrued liabilities |
(161 | ) | (1,382 | ) | (7,405 | ) | ||||||
| Deferred revenue |
(702 | ) | (725 | ) | (242 | ) | ||||||
| Other liabilities, noncurrent |
(558 | ) | 251 | (1,416 | ) | |||||||
|
|
|
|
|
|
|
|||||||
| Net cash provided by operating activities |
18,377 | 50,665 | 46,375 | |||||||||
|
|
|
|
|
|
|
|||||||
| Cash Flows from Investing Activities |
||||||||||||
| Capital expenditures |
(5,455 | ) | (1,341 | ) | (2,268 | ) | ||||||
| Business acquisitions |
(875 | ) | — | (60,075 | ) | |||||||
| Other intangibles |
(2,816 | ) | (2,515 | ) | — | |||||||
| Internal software development costs |
(2,494 | ) | (2,511 | ) | (2,379 | ) | ||||||
| Purchases of marketable securities |
(50,770 | ) | (51,030 | ) | (46,864 | ) | ||||||
| Proceeds from sales and maturities of marketable securities |
49,768 | 49,911 | 45,002 | |||||||||
| Proceeds from sale of investment |
1,437 | — | — | |||||||||
| Other investing activities |
474 | 17 | 30 | |||||||||
|
|
|
|
|
|
|
|||||||
| Net cash used in investing activities |
(10,731 | ) | (7,469 | ) | (66,554 | ) | ||||||
|
|
|
|
|
|
|
|||||||
| Cash Flows from Financing Activities |
||||||||||||
| Proceeds from exercise of common stock options |
3,329 | 457 | 4,698 | |||||||||
| Proceeds from bank debt |
— | — | 5,884 | |||||||||
| Principal payments on bank debt |
(12,500 | ) | (7,500 | ) | (5,125 | ) | ||||||
| Payment of bank loan upfront fees |
— | (200 | ) | (1,370 | ) | |||||||
| Principal payments on acquisition-related notes payable |
(2,953 | ) | (8,128 | ) | (3,366 | ) | ||||||
| Excess tax benefits from stock-based compensation |
543 | 156 | 197 | |||||||||
| Withholding taxes related to restricted stock net share settlement |
(1,958 | ) | (244 | ) | (417 | ) | ||||||
| Repurchases of common stock |
— | (6,157 | ) | (43,948 | ) | |||||||
|
|
|
|
|
|
|
|||||||
| Net cash used in financing activities |
(13,539 | ) | (21,616 | ) | (43,447 | ) | ||||||
|
|
|
|
|
|
|
|||||||
| Effect of exchange rate changes on cash and cash equivalents |
(47 | ) | 6 | (133 | ) | |||||||
| Net (decrease) increase in cash and cash equivalents |
(5,940 | ) | 21,586 | (63,759 | ) | |||||||
| Cash and cash equivalents at beginning of period |
90,117 | 68,531 | 132,290 | |||||||||
|
|
|
|
|
|
|
|||||||
| Cash and cash equivalents at end of period |
$ | 84,177 | $ | 90,117 | $ | 68,531 | ||||||
|
|
|
|
|
|
|
|||||||
| Supplemental Disclosure of Cash Flow Information |
||||||||||||
| Cash paid for interest |
3,762 | 4,333 | 3,786 | |||||||||
| Cash paid for taxes |
1,569 | 2,163 | 13,721 | |||||||||
| Supplemental Disclosure of Noncash Investing and Financing Activities |
||||||||||||
| Notes payable issued in connection with business acquisitions |
— | — | 5,096 | |||||||||
| Retirement of treasury stock |
— | 6,157 | 51,727 | |||||||||
| Short term payables |
— | 2,500 | — | |||||||||
| Purchases of property and equipment |
— | 2,041 | — | |||||||||
See notes to condensed consolidated financial statements
60
Table of Contents
Index to Financial Statements
QUINSTREET, INC.
NOTES TO CONSOLIDATED FINANCIAL STATEMENTS
1. The Company
QuinStreet, Inc. (the “Company”) is a leader in performance marketing online. The Company was incorporated in California on April 16, 1999 and reincorporated in Delaware on December 31, 2009. The Company provides vertically oriented customer acquisition programs for its clients. The corporate headquarters are located in Foster City, California, with additional offices in the United States, Brazil and India.
2. Summary of Significant Accounting Policies
Principles of Consolidation
The consolidated financial statements include the accounts of the Company and its subsidiaries. Intercompany balances and transactions have been eliminated in consolidation.
Use of Estimates
The preparation of financial statements in conformity with accounting principles generally accepted in the United States of America (“GAAP”) requires management to make estimates and assumptions that affect the reported amounts of assets and liabilities, disclosure of contingent assets and liabilities at the date of the financial statements and reported amounts of revenue and expenses during the reporting period. These estimates are based on information available as of the date of the financial statements; therefore, actual results could differ from those estimates.
Revenue Recognition
Direct Marketing Services (“DMS”) revenue, which constituted more than 99% in fiscal year 2014, 2013 and 2012, is derived from fees which are earned through the delivery of qualified leads, clicks, calls, customers and, to a lesser extent, display advertisements (“impressions”). The Company recognizes revenue when persuasive evidence of an arrangement exists, delivery has occurred, the fee is fixed or determinable and collectability is reasonably assured. Delivery is deemed to have occurred at the time a qualified lead, click, call, customer or impression is delivered to the client provided that no significant obligations remain.
The Company allocates revenue in an arrangement using the estimated selling price (“ESP”) of deliverables if it does not have vendor-specific objective evidence (“VSOE”) of selling price based on historical stand-alone sales or third-party evidence (“TPE”) of selling price. Due to the unique nature of some of its multiple deliverable revenue arrangements, the Company may not be able to establish selling prices based on historical stand-alone sales or third-party evidence, therefore the Company may use its best estimate to establish selling prices for these arrangements under the new standard. The Company establishes best estimates within a range of selling prices considering multiple factors including, but not limited to, class of client, size of transaction, available media inventory, pricing strategies and market conditions. The Company believes the use of the best estimate of selling price allows revenue recognition in a manner consistent with the underlying economics of the transaction.
From time to time, the Company may agree to credit a client for certain leads, clicks, calls, customers or impressions if they fail to meet the contractual or other guidelines of a particular client. The Company has established a sales reserve based on historical experience. To date, such credits have been within management’s expectations.
61
Table of Contents
Index to Financial Statements
NOTES TO CONSOLIDATED FINANCIAL STATEMENTS — (Continued)
For a portion of its revenue, the Company has agreements with providers of online media or traffic, publishers, used in the generation of leads, clicks, calls and customers. The Company receives a fee from its clients and pays a fee to publishers as a portion of revenue generated or on a cost per lead, cost per click or cost per thousand impressions basis. The Company is the primary obligor in the transaction. As a result, the fees paid by the Company’s clients are recognized as revenue and the fees paid to its publishers are included in cost of revenue.
All other revenue, which constituted less than 1% in fiscal year 2014, 2013 and 2012, comprises (i) set-up and professional services fees and (ii) usage fees. Set-up and professional service fees that do not provide stand-alone value to a client are recognized over the contractual term of the agreement or the expected client relationship period, whichever is longer, effective when the application reaches the “go-live” date. The Company defines the “go-live” date as the date when the application enters into a production environment or all essential functionalities have been delivered. Usage fees are recognized on a monthly basis as earned.
Deferred revenue is comprised of contractual billings in excess of recognized revenue and payments received in advance of revenue recognition.
Concentrations of Credit Risk
Financial instruments that potentially subject the Company to significant concentrations of credit risk consist principally of cash and cash equivalents, marketable securities and accounts receivable. The Company’s investment portfolio consists of liquid high-quality fixed income US government or municipal securities, certificates of deposit with financial institutions and money market funds. Cash and certificates of deposit are deposited with financial institutions that management believes are creditworthy. To date, the Company has not experienced any losses on its investment portfolio.
The Company’s accounts receivable are derived from clients located principally in the United States. The Company performs ongoing credit evaluation of its clients, does not require collateral, and maintains allowances for potential credit losses on client accounts when deemed necessary. No client accounted for 10% or more of net accounts receivable or net revenue for either fiscal year 2014 or 2013.
Fair Value of Financial Instruments
The Company’s financial instruments consist principally of cash equivalents, marketable securities, accounts receivable, accounts payable, acquisition-related promissory notes, an interest rate swap, short term payables, and a term loan. The fair value of the Company’s cash equivalents is determined based on quoted prices in active markets for identical assets for its money market funds; and quoted prices for similar instruments in active markets for its U.S municipal securities and certificates of deposit that mature within 90 days. The recorded values of the Company’s accounts receivable and accounts payable approximate their current fair values due to the relatively short-term nature of these accounts. The fair value of acquisition-related promissory notes and short term payables approximate their recorded amounts as the interest rates on similar financing arrangements available to the Company at June 30, 2014 approximate the interest rates implied when these acquisition-related promissory notes and short term payables were originally issued and recorded. The fair value of the interest rate swap is based upon fair value quotes from the issuing bank and the Company assesses the quotes for reasonableness by comparing them to the present values of expected cash flows. The present value approach is based on observable market interest rate curves that are commensurate with the terms of the interest rate swaps. The carrying value represents the fair value of the swaps, as adjusted for any non-performance risk associated with the Company at June 30, 2014. The Company believes that the fair value of the term loan approximates its recorded amount at June 30, 2014 as the interest rate on the term loan is variable and is based on market interest rates and after consideration of default and credit risk.
62
Table of Contents
Index to Financial Statements
NOTES TO CONSOLIDATED FINANCIAL STATEMENTS — (Continued)
Cash and Cash Equivalents
All highly liquid investments with maturities of three months or less at the date of purchase are classified as cash equivalents. Cash equivalents consist primarily of money market funds, municipal securities and certificates of deposit with original maturities of three months or less.
Property and Equipment
Property and equipment are stated at cost less accumulated depreciation and amortization, and are depreciated on a straight-line basis over the estimated useful lives of the assets, as follows:
| Computer equipment |
3 years | |
| Software |
3 years | |
| Furniture and fixtures |
3 to 5 years | |
| Leasehold improvements |
the shorter of the lease term or the estimated useful lives of the improvements |
Internal Software Development Costs
The Company incurs costs to develop software for internal use. The Company expenses all costs that relate to the planning and post-implementation phases of development as product development expense. Costs incurred in the development phase are capitalized and amortized over the product’s estimated useful life if the product is expected to have a useful life beyond six months. Costs associated with repair or maintenance of existing sites or the developments of website content are included in cost of revenue in the accompanying statements of operations. The Company’s policy is to amortize capitalized internal software development costs on a product-by-product basis using the straight-line method over the estimated economic life of the application, which is generally two years. The Company capitalized $2.5 million, $2.5 million, and $1.9 million in fiscal years 2014, 2013 and 2012. Amortization of internal software development costs is reflected in cost of revenue.
Goodwill
The Company conducts a test for the impairment of goodwill at the reporting unit level on at least an annual basis and whenever there are events or changes in circumstances that would more likely than not reduce the estimated fair value of a reporting unit below its carrying value. Application of the goodwill impairment test requires judgment, including the identification of reporting units, assigning assets and liabilities to reporting units, assigning goodwill to reporting units, and determining the fair value of each reporting unit. Significant judgments required to estimate the fair value of reporting units include estimating future cash flows and determining appropriate discount rates, growth rates, an appropriate control premium and other assumptions. Changes in these estimates and assumptions could materially affect the determination of fair value for each reporting unit which could trigger impairment.
The Company has two reporting units for purposes of allocating and testing goodwill, DMS and DSS. The Company performed its annual goodwill impairment test on April 30, 2014. While the Company is permitted to conduct a qualitative assessment to determine whether it is necessary to perform a two-step quantitative goodwill impairment test, for its annual goodwill impairment test in the fourth quarter of fiscal 2014, the Company performed a quantitative test for both of its reporting units.
In the first step of the annual impairment test, the Company compared the fair value of each reporting unit to its carrying value. The Company estimated the fair value of the DSS reporting unit using only the income approach as market comparables were not meaningful. The Company concluded that the carrying value of the
63
Table of Contents
Index to Financial Statements
NOTES TO CONSOLIDATED FINANCIAL STATEMENTS — (Continued)
DSS reporting unit exceeded its estimated fair value therefore it performed a Step 2 analysis, as required and recorded a goodwill impairment charge of $1.2 million for the entire goodwill of its DSS reporting unit. The Company estimated the fair value of our DMS reporting unit based on the Company’s market capitalization and determined that there were no instances of impairment in its DMS reporting unit.
The Company’s public market capitalization sustained a decline after June 30, 2014 primarily due to the Company’s operating results in the fourth quarter of fiscal year 2014, to a value below the net book carrying value of the Company’s equity. As a result, the Company determined that this triggered the necessity to conduct an interim goodwill impairment test as of June 30, 2014. The Company first tested the long-lived assets related to the DMS reporting unit as of June 30, 2014 and, based on the undiscounted cash flows, determined that these assets were not impaired.
A two-step process was then required to test goodwill impairment. The first step is to determine if there is an indication of impairment by comparing the estimated fair value to its carrying value including goodwill. Goodwill is considered impaired if the carrying value exceeds the estimated fair value. Upon indication of impairment, a second step is performed to determine the amount of the impairment by comparing the implied fair value of the reporting unit’s goodwill with its carrying value.
The Company estimated the fair value of its DMS reporting unit using a weighting of fair values derived most significantly from the market approach which approximated the Company’s market capitalization and to a lesser extent the income approach. Under the market approach, the Company utilize publicly-traded comparable company information to determine revenue and earnings multiples that are used to value its reporting units adjusted for an estimated control premium. As the DMS reporting unit represents substantially the entire Company, the market approach has been reconciled to the Company’ market capitalization. Under the income approach, the Company estimate the fair value of a reporting unit based on the present value of estimated future cash flows. Cash flow projections are based on management’s estimates of revenue growth rates and operating margins, taking into consideration industry and market conditions. The discount rate used is based on the weighted-average cost of capital adjusted for the relevant risk associated with business-specific characteristics and the uncertainty related to the reporting unit’s ability to execute on the projected cash flows.
The second step of the goodwill impairment test required the Company to fair value all assets and liabilities of its DMS reporting unit to determine the implied fair value of goodwill. The Company compared the implied fair value of the reporting unit’s goodwill to its carrying value. This test resulted in a non-cash goodwill impairment charge in aggregate of $95.6 million for the year ended June 30, 2014. The inputs used to measure the estimated fair value of goodwill are classified as a Level 3 fair value measurement due to the significance of unobservable inputs in income approach using company specific information.
The Company recorded a non-cash goodwill impairment charge in aggregate of $92.4 million for the year ended June 30, 2013.
Long-Lived Assets
The Company evaluates long-lived assets, such as property and equipment and purchased intangible assets with finite lives, for impairment whenever events or changes in circumstances indicate that the carrying value of an asset may not be recoverable. The Company applies judgment when assessing the fair value of the assets based on the undiscounted future cash flows the assets are expected to generate and recognizes an impairment loss if estimated undiscounted future cash flows expected to result from the use of the asset plus net proceeds expected from disposition of the asset, if any, are less than the carrying value of the asset. When the Company identifies an impairment, it reduces the carrying amount of the asset to its estimated fair value based on a
64
Table of Contents
Index to Financial Statements
NOTES TO CONSOLIDATED FINANCIAL STATEMENTS — (Continued)
discounted cash flow approach or, when available and appropriate, to comparable market values. The Company tested its long-lived assets related to the DMS reporting unit as of June 30, 2014 and, based on the undiscounted cash flows, determined that these assets were not impaired.
Advertising Costs
The Company expenses advertising costs the first time the advertising takes place. The Company’s advertising costs were $1.1 million in fiscal 2014. The Company did not incur any advertising costs for fiscal year 2013 and advertising costs were $0.2 million in fiscal year 2012.
Income Taxes
The Company accounts for income taxes using an asset and liability approach to record deferred taxes. The Company’s deferred income tax assets represent temporary differences between the financial statement carrying amount and the tax basis of existing assets and liabilities that will result in deductible amounts in future years. Based on estimates, the carrying value of the Company’s net deferred tax assets assumes that it is more likely than not that the Company will be able to generate sufficient future taxable income in the respective tax jurisdictions. The Company’s judgments regarding future profitability may change due to future market conditions, changes in U.S. or international tax laws and other factors.
Foreign Currency Translation
The Company’s foreign operations are subject to exchange rate fluctuations. The majority of the Company’s sales and expenses are denominated in U.S. dollars. The functional currency for the majority of the Company’s foreign subsidiaries is the U.S. dollar. For these subsidiaries, assets and liabilities denominated in foreign currency are remeasured into U.S. dollars at current exchange rates for monetary assets and liabilities and historical exchange rates for nonmonetary assets and liabilities. Net revenue, cost of revenue and expenses are generally remeasured at average exchange rates in effect during each period. Gains and losses from foreign currency remeasurement are included in other income (expense), net. Certain foreign subsidiaries designate the local currency as their functional currency. For those subsidiaries, the assets and liabilities are translated into U.S. dollars at exchange rates in effect at the balance sheet date. Income and expense items are translated at average exchange rates for the period. The foreign currency translation adjustments are included in accumulated other comprehensive loss as a separate component of stockholders’ equity. Foreign currency transaction gains and losses are recorded in other income (expense), net and were not material for any period presented.
Comprehensive (Loss) Income
Comprehensive (loss) income consists of two components, net (loss) income and other comprehensive loss. Other comprehensive loss refers to revenue, expenses, gains, and losses that under GAAP are recorded as an element of stockholders’ equity but are excluded from net (loss) income. The Company’s comprehensive (loss) income and accumulated other comprehensive loss consists of foreign currency translation adjustments from those subsidiaries not using the U.S. dollar as their functional currency, unrealized gains and losses on marketable securities categorized as available-for-sale and unrealized gains and losses on the interest rate swap. Total accumulated other comprehensive loss is displayed as a separate component of stockholders’ equity.
Derivative Instrument
During the third quarter of fiscal year 2012, the Company entered into an interest rate swap agreement to hedge the interest rate exposure relating to its borrowing under its term loan. The Company does not speculate using derivative instruments. The Company entered into this derivative instrument arrangement solely for the purpose of risk management.
65
Table of Contents
Index to Financial Statements
NOTES TO CONSOLIDATED FINANCIAL STATEMENTS — (Continued)
The current and noncurrent portion of the interest rate swap is recorded in accrued liabilities and other liabilities, noncurrent, respectively, on the consolidated balance sheets at fair value based upon quoted market prices. Changes in the fair value of this interest rate swap are recorded in other comprehensive (loss) income because the Company has designated the swap as a cash flow hedge. Gains or losses on the interest rate swap as reported in other comprehensive (loss) income are classified to interest expense in the period the hedged item affects earnings. If the term loan ceases to exist, any associated amounts reported in other comprehensive (loss) income are reclassified to earnings at that time. Any hedge ineffectiveness is recognized immediately in earnings in the current period. Refer to Note 9, Debt, for additional information regarding the Company’s credit facility and interest rate swap.
Loss Contingencies
The Company is subject to the possibility of various loss contingencies arising in the ordinary course of business. Management considers the likelihood of loss or impairment of an asset or the incurrence of a liability, as well as its ability to reasonably estimate the amount of loss, in determining loss contingencies. An estimated loss contingency is accrued when it is probable that an asset has been impaired or a liability has been incurred and the amount of loss can be reasonably estimated. The Company regularly evaluates current information available to its management to determine whether such accruals should be adjusted and whether new accruals are required.
From time to time, the Company is involved in disputes, litigation and other legal actions. The Company records a charge equal to at least the minimum estimated liability for a loss contingency only when both of the following conditions are met: (i) information available prior to issuance of the financial statements indicates that it is probable that an asset had been impaired or a liability had been incurred at the date of the financial statements, and (ii) the range of loss can be reasonably estimated. The actual liability in any such matters may be materially different from the Company’s estimates, which could result in the need to adjust the liability and record additional expenses.
Stock-Based Compensation
The Company measures and records the expense related to stock-based transactions based on the fair values of stock-based payment awards, as determined on the date of grant. To estimate the fair value of stock options, the Company selected the Black-Scholes option pricing model. In applying the Black-Scholes option pricing model, the Company’s determination of the fair value of the stock option is affected by assumptions regarding a number of highly complex and subjective variables. These variables include, but are not limited to, the Company’s expected stock price volatility over the term of the stock options and the employees’ actual and projected stock option exercise and pre-vesting employment termination behaviors. The fair value of restricted stock units is determined based on the closing price of the Company’s common stock on the date of grant.
For awards with graded vesting the Company recognizes stock-based compensation expense over the requisite service period using the straight-line method, based on awards ultimately expected to vest. The Company estimates future forfeitures at the date of grant and revises the estimates, if necessary, in subsequent periods if actual forfeitures differ from those estimates. Refer to Note 11, Stock Benefit Plans, for additional information regarding stock-based compensation.
401(k) Savings Plan
The Company sponsors a 401(k) defined contribution plan covering all U.S. employees. There were no employer contributions under this plan for fiscal years 2014, 2013 or 2012.
66
Table of Contents
Index to Financial Statements
NOTES TO CONSOLIDATED FINANCIAL STATEMENTS — (Continued)
Recent Accounting Pronouncements
In July 2012, the FASB issued an update to the accounting standard for intangibles. The revised standard update allows entities to use a qualitative approach to test indefinite-lived intangible assets for impairment. It permits an entity to first perform a qualitative assessment to determine whether it is more-likely-than-not that the fair value of an indefinite-lived intangible asset is less than its carrying value. If it is concluded that this is the case, it is necessary to perform the currently prescribed quantitative impairment test by comparing the fair value of the indefinite-lived intangible asset with its carrying value. Otherwise, the quantitative impairment test is not required. The Company’s adoption of this accounting standard update during the fourth quarter of fiscal 2014 did not have a material effect on the Company’s consolidated financial statements.
In February 2013, the FASB issued an update to the accounting standard for accumulated other comprehensive income (loss). The revised standard update requires entities to present information about significant items reclassified out of accumulated other comprehensive income (loss) by component either on the face of the statement where net (loss) income is presented or as a separate disclosure in the notes to the financial statements. The Company’s adoption of this revised standard update in the first quarter of fiscal year 2014 did not have a material impact on its financial position, results of operations or cash flows.
In July 2013, the FASB issued a new accounting standard update on the financial presentation of unrecognized tax benefits. The new guidance provides that a liability related to an unrecognized tax benefit would be presented as reduction of a deferred tax asset for a net operating loss carryforward, a similar tax loss or a tax credit carryforward if such settlement is required or expected in the event the uncertain tax position is disallowed. The new guidance becomes effective July 1, 2015 for the Company and it should be applied prospectively to unrecognized tax benefits that exist at the effective date, although retrospective application is permitted. The Company does not believe that the adoption will have a material effect on the Company’s consolidated financial statements.
In May 2014, the FASB issued a new accounting standard update on revenue from contracts with clients. The new guidance provides that an entity should recognize revenue to depict the transfer of promised goods or services to customers in an amount that reflects the consideration to which the entity expects to be entitled in exchange for those goods or services. The new guidance becomes effective July 1, 2017 for the Company. The Company is currently assessing the impact of this new guidance.
In June 2014, the FASB issued a new accounting standard update on accounting for share-based payments when the terms of an award provide that a performance target could be achieved after the requisite service period, which amends ASC 718, “Compensation — Stock Compensation.” The amendment provides guidance on the treatment of shared-based payment awards with a specific performance target, requiring that a performance target that affects vesting and that could be achieved after the requisite service period be treated as a performance condition. The new guidance becomes effective for fiscal years, and interim periods within those years, beginning after December 15, 2015 with early adoption permitted. The Company is currently evaluating the impact of this guidance.
3. Net (Loss) Income per Share
Basic net (loss) income per share is computed by dividing net (loss) income by the weighted average number of shares of common stock outstanding during the period. Diluted net (loss) income per share is computed by using the weighted-average number of shares of common stock outstanding, including potential dilutive shares of common stock assuming the dilutive effect of outstanding stock options and restricted stock units using the treasury stock method.
67
Table of Contents
Index to Financial Statements
NOTES TO CONSOLIDATED FINANCIAL STATEMENTS — (Continued)
The following table presents the calculation of basic and diluted net (loss) income per share:
| Fiscal Year Ended | ||||||||||||
| 2014 | 2013 | 2012 | ||||||||||
| (In thousands, except per share data) |
||||||||||||
| Numerator: |
||||||||||||
| Basic and Diluted: |
||||||||||||
| Net (loss) income |
$ | (146,404 | ) | $ | (67,372 | ) | $ | 13,001 | ||||
|
|
|
|
|
|
|
|||||||
| Denominator: |
||||||||||||
| Basic and Diluted: |
||||||||||||
| Weighted average shares of common stock used in computing basic and diluted net (loss) income per share |
43,528 | 42,816 | 45,846 | |||||||||
|
|
|
|
|
|
|
|||||||
| Diluted: |
||||||||||||
| Weighted average shares of common stock used in computing basic net (loss) income per share |
43,528 | 42,816 | 45,846 | |||||||||
| Weighted average effect of dilutive securities: |
||||||||||||
| Stock options |
— | — | 1,004 | |||||||||
| Restricted stock units |
— | — | 9 | |||||||||
|
|
|
|
|
|
|
|||||||
| Weighted average shares of common stock used in computing diluted net (loss) income per share |
43,528 | 42,816 | 46,859 | |||||||||
|
|
|
|
|
|
|
|||||||
| Net (loss) income per share: |
||||||||||||
| Basic |
$ | (3.36 | ) | $ | (1.57 | ) | $ | 0.28 | ||||
|
|
|
|
|
|
|
|||||||
| Diluted (1) |
$ | (3.36 | ) | $ | (1.57 | ) | $ | 0.28 | ||||
|
|
|
|
|
|
|
|||||||
| Securities excluded from weighted average shares used in computing diluted net loss per share because the effect would have been anti-dilutive: (2) |
8,843 | 9,417 | 6,749 | |||||||||
| (1) | Diluted EPS does not reflect any potential common stock relating to stock options or restricted stock units due to net loss incurred for the years ended June 30, 2014 and 2013. The assumed issuance of any additional shares would be anti-dilutive. |
| (2) | These weighted shares relate to anti-dilutive stock options and restricted stock units as calculated using the treasury stock method and could be dilutive in the future. |
4. Fair Value Measurements and Marketable Securities
Fair Value Measurements
Fair value is defined as the price that would be received on sale of an asset or paid to transfer a liability (“exit price”) in an orderly transaction between market participants at the measurement date. The FASB has established a fair value hierarchy that distinguishes between (1) market participant assumptions developed based on market data obtained from independent sources (observable inputs) and (2) an entity’s own assumptions about market participant assumptions developed based on the best information available in the circumstances (unobservable inputs). The fair value hierarchy consists of three broad levels, which gives the highest priority to unadjusted quoted prices in active markets for identical assets or liabilities (Level 1) and the lowest priority to unobservable inputs (Level 3).
68
Table of Contents
Index to Financial Statements
NOTES TO CONSOLIDATED FINANCIAL STATEMENTS — (Continued)
The three levels of the fair value hierarchy under the guidance for fair value measurement are described below:
Level 1 — Inputs are unadjusted quoted prices in active markets for identical assets or liabilities. Pricing inputs are based upon quoted prices in active markets for identical assets or liabilities that the reporting entity has the ability to access at the measurement date. The valuations are based on quoted prices of the underlying security that are readily and regularly available in an active market, and accordingly, a significant degree of judgment is not required. As of June 30, 2014 and 2013, the Company used Level 1 assumptions for its money market funds.
Level 2 — Pricing inputs are based upon quoted prices for similar instruments in active markets, quoted prices for identical or similar instruments in markets that are not active, and model-based valuation techniques for which all significant assumptions are observable in the market or can be corroborated by observable market data for substantially the full term of the assets or liabilities. As of June 30, 2014 and 2013, the Company used Level 2 assumptions for its U.S. municipal securities, certificates of deposit, acquisition-related promissory notes, term loan, and interest rate swap.
Level 3 — Pricing inputs are generally unobservable for the assets or liabilities and include situations where there is little, if any, market activity for the investment. The inputs into the determination of fair value require management’s judgment or estimation of assumptions that market participants would use in pricing the assets or liabilities. The fair values are therefore determined using model-based techniques that include option pricing models, discounted cash flow models, and similar techniques. As of June 30, 2014 and 2013, the Company did not have any Level 3 financial assets or liabilities.
The Company’s financial assets and liabilities as of June 30, 2014 and 2013 were categorized as follows in the fair value hierarchy (in thousands):
| Fair Value Measurements as of June 30, 2014 Using | ||||||||||||
| Quoted Prices in Active Markets for Identical Assets (Level 1) |
Significant Other Observable Inputs (Level 2) |
Total | ||||||||||
| Assets: |
||||||||||||
| U.S. municipal securities |
$ | — | $ | 12,816 | $ | 12,816 | ||||||
| Certificates of deposit |
— | 26,293 | 26,293 | |||||||||
| Money market funds |
38,641 | — | 38,641 | |||||||||
|
|
|
|
|
|
|
|||||||
| $ | 38,641 | $ | 39,109 | $ | 77,750 | |||||||
|
|
|
|
|
|
|
|||||||
| Liabilities: |
||||||||||||
| Acquisition-related promissory notes (1) |
$ | — | $ | 603 | $ | 603 | ||||||
| Term loan (1) |
— | 76,660 | 76,660 | |||||||||
| Interest rate swap |
— | 630 | 630 | |||||||||
|
|
|
|
|
|
|
|||||||
| $ | — | $ | 77,893 | $ | 77,893 | |||||||
|
|
|
|
|
|
|
|||||||
69
Table of Contents
Index to Financial Statements
NOTES TO CONSOLIDATED FINANCIAL STATEMENTS — (Continued)
| Fair Value Measurements as of June 30, 2013 Using | ||||||||||||
| Quoted Prices in Active Markets for Identical Assets (Level 1) |
Significant Other Observable Inputs (Level 2) |
Total | ||||||||||
| Assets: |
||||||||||||
| U.S. municipal securities |
$ | — | $ | 25,544 | $ | 25,544 | ||||||
| Certificates of deposit |
— | 16,923 | 16,923 | |||||||||
| Money market funds |
38,465 | — | 38,465 | |||||||||
|
|
|
|
|
|
|
|||||||
| $ | 38,465 | $ | 42,467 | $ | 80,932 | |||||||
|
|
|
|
|
|
|
|||||||
| Liabilities: |
||||||||||||
| Acquisition-related promissory notes (1) |
$ | — | $ | 3,875 | $ | 3,875 | ||||||
| Term loan (1) |
— | 88,802 | 88,802 | |||||||||
| Interest rate swap |
— | 655 | 655 | |||||||||
|
|
|
|
|
|
|
|||||||
| $ | — | $ | 93,332 | $ | 93,332 | |||||||
|
|
|
|
|
|
|
|||||||
| (1) | These liabilities are carried at historical cost on the Company’s consolidated balance sheet. |
Marketable Securities
All liquid investments with maturities of three months or less at the date of purchase are classified as cash equivalents. Investments with maturities greater than three months at the date of purchase are classified as marketable securities. The Company’s marketable securities have been classified and accounted for as available-for-sale. Management determines the appropriate classification of its investments at the time of purchase and reevaluates the available-for-sale designation as of each balance sheet date. Available-for-sale securities are carried at fair value, with unrealized gains and losses, net of tax, reported in accumulated comprehensive loss as a component of stockholders’ equity. These available-for-sale securities are presented as current assets as they are available for current operations.
The following table summarizes unrealized gains and losses related to available-for-sale securities held by the Company as of June 30, 2014 and 2013 (in thousands):
| As of June 30 2014 | ||||||||||||||||
| Gross Amortized Cost |
Gross Unrealized Gains |
Gross Unrealized Losses |
Estimated Fair Value |
|||||||||||||
| U.S. municipal securities |
$ | 12,812 | $ | 4 | $ | — | $ | 12,816 | ||||||||
| Certificates of deposit |
26,330 | — | 37 | 26,293 | ||||||||||||
| Money market funds |
38,641 | — | — | 38,641 | ||||||||||||
|
|
|
|
|
|
|
|
|
|||||||||
| $ | 77,783 | $ | 4 | $ | 37 | $ | 77,750 | |||||||||
|
|
|
|
|
|
|
|
|
|||||||||
| As of June 30, 2013 | ||||||||||||||||
| Gross Amortized Cost |
Gross Unrealized Gains |
Gross Unrealized Losses |
Estimated Fair Value |
|||||||||||||
| U.S. municipal securities |
$ | 25,538 | $ | 6 | $ | — | $ | 25,544 | ||||||||
| Certificates of deposit |
16,945 | — | 22 | 16,923 | ||||||||||||
| Money market funds |
38,465 | — | — | 38,465 | ||||||||||||
|
|
|
|
|
|
|
|
|
|||||||||
| $ | 80,948 | $ | 6 | $ | 22 | $ | 80,932 | |||||||||
|
|
|
|
|
|
|
|
|
|||||||||
70
Table of Contents
Index to Financial Statements
NOTES TO CONSOLIDATED FINANCIAL STATEMENTS — (Continued)
5. Balance Sheet Components
Accounts Receivable, Net
Accounts receivable, net are comprised of the following (in thousands):
| June 30, | ||||||||
| 2014 | 2013 | |||||||
| Accounts receivable |
$ | 43,901 | $ | 40,417 | ||||
| Less: Allowance for doubtful accounts |
(364 | ) | (264 | ) | ||||
| Less: Allowance for sales returns |
(1,558 | ) | (1,762 | ) | ||||
|
|
|
|
|
|||||
| $ | 41,979 | $ | 38,391 | |||||
|
|
|
|
|
|||||
Property and Equipment, Net
Property and equipment, net is comprised of the following (in thousands):
| June 30, | ||||||||
| 2014 | 2013 | |||||||
| Computer equipment |
$ | 15,111 | $ | 12,293 | ||||
| Software |
10,508 | 9,145 | ||||||
| Furniture and fixtures |
3,024 | 2,780 | ||||||
| Leasehold improvements |
1,796 | 1,862 | ||||||
| Internal software development costs |
23,603 | 21,108 | ||||||
|
|
|
|
|
|||||
| 54,042 | 47,188 | |||||||
| Less: Accumulated depreciation and amortization |
(42,916 | ) | (37,481 | ) | ||||
|
|
|
|
|
|||||
| $ | 11,126 | $ | 9,707 | |||||
|
|
|
|
|
|||||
Depreciation expense was $3.9 million, $3.3 million and $3.3 million for fiscal years 2014, 2013 and 2012. Amortization expense related to internal software development costs was $2.6 million, $2.2 million and $1.9 million for fiscal years 2014, 2013 and 2012.
Accrued liabilities
Accrued liabilities are comprised of the following (in thousands):
| June 30, | ||||||||
| 2014 | 2013 | |||||||
| Accrued media costs |
$ | 14,407 | $ | 14,657 | ||||
| Accrued compensation and related expenses and taxes payable |
7,103 | 8,179 | ||||||
| Accrued professional service and other business expenses |
6,344 | 8,067 | ||||||
|
|
|
|
|
|||||
| Total accrued liabilities |
$ | 27,854 | $ | 30,903 | ||||
|
|
|
|
|
|||||
71
Table of Contents
Index to Financial Statements
NOTES TO CONSOLIDATED FINANCIAL STATEMENTS — (Continued)
6. Acquisitions
Acquisitions in Fiscal Year 2014
In December 2013, the Company acquired the operations of an online publishing business in exchange for $0.9 million in cash paid upon closing of the acquisition.
Acquisitions in Fiscal Year 2013
The Company did not complete any acquisitions during fiscal year 2013.
Acquisitions in Fiscal Year 2012
Acquisition of Ziff Davis Enterprise
On February 3, 2012, the Company acquired certain assets of Ziff Davis Enterprise from Enterprise Media Group, Inc., a New York-based online media and marketing company in the business-to-business technology market, for $17.3 million in cash, to broaden its registered user database and brand name in the business-to-business technology market. The results of the acquired assets of Ziff Davis Enterprise have been included in the consolidated financial statements since the acquisition date.
| Amount | ||||
| (in thousands) | ||||
| Cash |
$ | 17,270 | ||
|
|
|
|||
The asset acquisition was accounted for as a purchase business combination. The Company allocated the purchase price to tangible assets acquired, liabilities assumed and identifiable intangible assets acquired based on their estimated fair values. The excess of the purchase price over the aggregate fair value was recorded as goodwill. The goodwill is deductible for tax purposes. The following table summarizes the preliminary allocation of the purchase price and the estimated useful lives of the identifiable intangible assets acquired as of the date of the acquisition (in thousands):
| Estimated Fair Value |
Estimated Useful Life | |||||
| Liabilities assumed |
$ | (255 | ) | |||
| Customer/publisher/advertiser relationships |
4,120 | 5 years | ||||
| Content |
500 | 2 years | ||||
| Website/trade/domain names |
4,630 | 5 years | ||||
| Registered user database |
6,320 | 3 years | ||||
| Goodwill |
1,955 | Indefinite | ||||
|
|
|
|||||
| $ | 17,270 | |||||
|
|
|
|||||
Acquisition of NarrowCast Group, LLC (“IT Business Edge” or “ITBE”)
On August 25, 2011, the Company acquired 100% of the outstanding equity interests of ITBE, in exchange for $24.0 million in cash, to broaden its registered user database and media access in the business-to-business technology market. The results of ITBE’s operations have been included in the consolidated financial statements since the acquisition date.
| Amount | ||||
| (in thousands) | ||||
| Cash |
$ | 23,961 | ||
|
|
|
|||
72
Table of Contents
Index to Financial Statements
NOTES TO CONSOLIDATED FINANCIAL STATEMENTS — (Continued)
The ITBE acquisition was accounted for as a purchase business combination. The Company allocated the purchase price to tangible assets acquired, liabilities assumed and identifiable intangible assets acquired based on their estimated fair values. The excess of the purchase price over the aggregate fair value was recorded as goodwill. The goodwill is deductible for tax purposes. The following table summarizes the preliminary allocation of the purchase price and the estimated useful lives of the identifiable intangible assets acquired as of the date of the acquisition (in thousands):
| Estimated Fair Value |
Estimated Useful Life | |||||
| Tangible assets acquired |
$ | 3,597 | ||||
| Liabilities assumed |
(1,868 | ) | ||||
| Customer/publisher/advertiser relationships |
3,230 | 5 years | ||||
| Content |
420 | 2 years | ||||
| Website/trade/domain names |
2,220 | 5 years | ||||
| Registered user database |
4,220 | 3 years | ||||
| Noncompete agreements |
100 | 3 years | ||||
| Goodwill |
12,042 | Indefinite | ||||
|
|
|
|||||
| $ | 23,961 | |||||
|
|
|
|||||
Other Acquisitions in Fiscal Year 2012
During fiscal year 2012, in addition to the acquisition of certain assets of Ziff Davis Enterprise, and the acquisition of ITBE, the Company also acquired operations from eleven other online publishing businesses in exchange for an aggregate of $14.6 million in cash, $3.1 million in non-interest-bearing, promissory notes payable over a period of two years, secured by the assets acquired in respect to which the notes were issued and $2.1 million in non-interest-bearing, unsecured promissory notes payable over a period of one year. The Company also recorded $4.6 million in earn-out payments related to a prior period acquisition as an addition to goodwill. The aggregate purchase price recorded was as follows (in thousands):
| Amount | ||||
| Cash |
$ | 14,620 | ||
| Fair value of debt (net of $99 of imputed interest) |
9,696 | |||
|
|
|
|||
| $ | 24,316 | |||
|
|
|
|||
The acquisitions were accounted for as purchase business combinations. In each of the acquisitions, the Company allocated the purchase price to identifiable intangible assets acquired based on their estimated fair values. The excess of the purchase price over the aggregate fair value was recorded as goodwill. The goodwill is deductible for tax purposes. The following table summarizes the preliminary allocation of the purchase price and the estimated useful lives of the identifiable intangible assets acquired as of the date of the acquisition (in thousands):
| Estimated Fair Value |
Estimated Useful Life | |||||
| Customer/publisher/advertiser relationships |
$ | 435 | 3-5 years | |||
| Content |
4,540 | 2-5 years | ||||
| Website/trade/domain names |
1,250 | 4-8 years | ||||
| Acquired technology and other |
561 | 4-5 years | ||||
| Noncompete agreements |
87 | 1-3.5 years | ||||
| Goodwill |
17,443 | Indefinite | ||||
|
|
|
|||||
| $ | 24,316 | |||||
|
|
|
|||||
73
Table of Contents
Index to Financial Statements
NOTES TO CONSOLIDATED FINANCIAL STATEMENTS — (Continued)
7. Intangible Assets, Net and Goodwill
Intangible assets, net consisted of the following (in thousands):
| June 30, 2014 | June 30, 2013 | |||||||||||||||||||||||
| Gross Carrying Amount |
Accumulated Amortization |
Net Carrying Amount |
Gross Carrying Amount |
Accumulated Amortization |
Net Carrying Amount |
|||||||||||||||||||
| Customer/publisher/advertiser relationships |
$ | 37,040 | $ | (31,185 | ) | $ | 5,855 | $ | 37,035 | $ | (28,321 | ) | $ | 8,714 | ||||||||||
| Content |
62,196 | (50,348 | ) | 11,848 | 62,028 | (43,054 | ) | 18,974 | ||||||||||||||||
| Website/trade/domain names |
31,652 | (21,482 | ) | 10,170 | 31,597 | (17,403 | ) | 14,194 | ||||||||||||||||
| Acquired technology and others |
36,744 | (33,176 | ) | 3,568 | 36,425 | (27,821 | ) | 8,604 | ||||||||||||||||
|
|
|
|
|
|
|
|
|
|
|
|
|
|||||||||||||
| $ | 167,632 | $ | (136,191 | ) | $ | 31,441 | $ | 167,085 | $ | (116,599 | ) | $ | 50,486 | |||||||||||
|
|
|
|
|
|
|
|
|
|
|
|
|
|||||||||||||
Amortization of intangible assets was $19.6 million, $26.8 million and $26.0 million for fiscal years 2014, 2013 and 2012.
The Company licensed certain patents for $4.9 million during the second quarter of fiscal year 2013, and these patents and related short term payables are recorded in other intangible assets, net and accrued liabilities, respectively, on the condensed consolidated balance sheet. Based on the Company’s analysis, using a relief from royalty method, the Company determined that a portion of the license fee for these patents represents the cumulative cost relating to prior years. As such, the Company recorded $2.4 million as a charge to cost of revenue during the second quarter of fiscal year 2013. The remaining amount will be amortized over the remaining life of the patents.
Amortization expense for the Company’s acquisition-related intangible assets as of June 30, 2014 for each of the next five years and thereafter is as follows (in thousands):
| Year Ending June 30, |
Amortization | |||
| 2015 |
$ | 12,512 | ||
| 2016 |
8,947 | |||
| 2017 |
6,114 | |||
| 2018 |
2,203 | |||
| 2019 |
767 | |||
| Thereafter |
898 | |||
|
|
|
|||
| $ | 31,441 | |||
|
|
|
|||
The changes in the carrying amount of goodwill for fiscal years 2014 and 2013 were as follows (in thousands):
| DMS | DSS | Total | ||||||||||
| Balance at June 30, 2012 |
$ | 241,818 | $ | 1,231 | $ | 243,049 | ||||||
| Additions |
— | — | — | |||||||||
| Other |
(243 | ) | — | (243 | ) | |||||||
| Impairment |
(92,350 | ) | — | (92,350 | ) | |||||||
|
|
|
|
|
|
|
|||||||
| Balance at June 30, 2013 |
$ | 149,225 | $ | 1,231 | $ | 150,456 | ||||||
|
|
|
|
|
|
|
|||||||
| Additions |
636 | — | 636 | |||||||||
| Other |
— | — | — | |||||||||
| Impairment |
(94,410 | ) | (1,231 | ) | (95,641 | ) | ||||||
|
|
|
|
|
|
|
|||||||
| Balance at June 30, 2014 |
$ | 55,451 | $ | — | $ | 55,451 | ||||||
|
|
|
|
|
|
|
|||||||
74
Table of Contents
Index to Financial Statements
NOTES TO CONSOLIDATED FINANCIAL STATEMENTS — (Continued)
The additions to goodwill relate to the Company’s acquisitions as described in Note 6, Acquisitions, and primarily reflect the value of the synergies expected to be generated from combining the Company’s technology and know-how with the acquired businesses’ access to online visitors. Any change in goodwill amounts resulting from foreign currency translation are presented as “Other” in the above table. The impairment charge recorded during fiscal years 2014 and 2013 is described in Note 2, Summary of Significant Accounting Policies.
8. Income Taxes
The components of (loss) income before income taxes are as follows (in thousands):
| Fiscal Year Ended June 30, | ||||||||||||
| 2014 | 2013 | 2012 | ||||||||||
| US |
$ | (109,257 | ) | $ | (89,087 | ) | $ | 23,957 | ||||
| Foreign |
(938 | ) | (4,886 | ) | 175 | |||||||
|
|
|
|
|
|
|
|||||||
| $ | (110,195 | ) | $ | (93,973 | ) | $ | 24,132 | |||||
|
|
|
|
|
|
|
|||||||
The components of the provision for (benefit from) taxes are as follows (in thousands):
| Fiscal Year Ended June 30, | ||||||||||||
| 2014 | 2013 | 2012 | ||||||||||
| Current |
||||||||||||
| Federal |
$ | (8,885 | ) | $ | 3,388 | $ | 10,417 | |||||
| State |
(374 | ) | 577 | 413 | ||||||||
| Foreign |
361 | 365 | 291 | |||||||||
|
|
|
|
|
|
|
|||||||
| Total current provision for income taxes |
(8,898 | ) | 4,330 | 11,121 | ||||||||
| Deferred |
||||||||||||
| Federal |
$ | 42,842 | $ | (29,763 | ) | $ | (719 | ) | ||||
| State |
2,265 | (1,249 | ) | 664 | ||||||||
| Foreign |
— | 81 | 65 | |||||||||
|
|
|
|
|
|
|
|||||||
| Total deferred provision for (benefit from) income taxes |
45,107 | (30,931 | ) | 10 | ||||||||
|
|
|
|
|
|
|
|||||||
| Provision for (benefit from) income taxes |
$ | 36,209 | $ | (26,601 | ) | $ | 11,131 | |||||
|
|
|
|
|
|
|
|||||||
The reconciliation between the statutory federal income tax and the Company’s effective tax rates as a percentage of income before income taxes is as follows:
| Fiscal Year Ended June 30, |
||||||||||||
| 2014 | 2013 | 2012 | ||||||||||
| Federal tax rate |
34.0 | % | 35.0 | % | 35.0 | % | ||||||
| States taxes, net of federal benefit |
2.4 | % | 0.9 | % | 3.7 | % | ||||||
| Foreign rate differential |
(0.6 | )% | (1.1 | )% | — | |||||||
| Stock-based compensation expense |
(3.6 | )% | (1.7 | )% | 8.2 | % | ||||||
| Change in valuation allowance |
(60.5 | )% | (1.0 | )% | — | |||||||
| Impairment of goodwill |
(4.3 | )% | (4.6 | )% | — | |||||||
| Research and development credits |
0.3 | % | — | — | ||||||||
| Other |
(0.7 | )% | 0.8 | % | (0.8 | )% | ||||||
|
|
|
|
|
|
|
|||||||
| Effective income tax rate |
(32.8 | )% | 28.3 | % | 46.1 | % | ||||||
|
|
|
|
|
|
|
|||||||
75
Table of Contents
Index to Financial Statements
NOTES TO CONSOLIDATED FINANCIAL STATEMENTS — (Continued)
The components of the current and long-term deferred tax assets, net are as follows (in thousands):
| Fiscal Year Ended June 30, |
||||||||
| 2014 | 2013 | |||||||
| Current: |
||||||||
| Reserves and accruals |
$ | 2,686 | $ | 2,883 | ||||
| Stock options |
2,035 | 2,647 | ||||||
| Deferred revenue |
— | 95 | ||||||
| Intangible assets |
— | — | ||||||
| Other |
91 | 1,128 | ||||||
| Net operating loss |
— | — | ||||||
|
|
|
|
|
|||||
| Total current deferred tax assets |
4,812 | 6,753 | ||||||
| Valuation allowance - ST |
(4,589 | ) | — | |||||
|
|
|
|
|
|||||
| Current deferred tax assets, net |
$ | 223 | $ | 6,753 | ||||
|
|
|
|
|
|||||
| Noncurrent: |
||||||||
| Reserves and accruals |
$ | 1,309 | $ | 2,067 | ||||
| Stock options |
6,106 | 7,942 | ||||||
| Intangible assets |
57,083 | 32,669 | ||||||
| Net operating loss |
255 | — | ||||||
| Fixed assets |
(1,193 | ) | (1,442 | ) | ||||
| Foreign |
— | — | ||||||
| Tax Credits |
1,568 | — | ||||||
| Other |
167 | — | ||||||
|
|
|
|
|
|||||
| Total noncurrent deferred tax assets |
65,295 | 41,236 | ||||||
| Valuation allowance - LT |
(63,583 | ) | (947 | ) | ||||
|
|
|
|
|
|||||
| Noncurrent deferred tax assets, net |
$ | 1,712 | $ | 40,289 | ||||
|
|
|
|
|
|||||
| Total deferred tax assets, net |
$ | 1,935 | $ | 47,042 | ||||
|
|
|
|
|
|||||
The Company regularly assesses the need for a valuation allowance against its deferred tax assets. Significant judgment is required to determine whether a valuation allowance is necessary and the amount of such valuation allowance, if appropriate. The Company considers all available evidence, both positive and negative to determine, based on the weight of available evidence, whether it is more likely than not that some or all of the deferred tax assets will not be realized. In evaluating the need for a valuation allowance the Company considers, among other things, the nature, frequency and severity of current and cumulative losses, forecasts of future profitability, and the duration of statutory carryforward periods. The Company determined that the significant negative evidence associated with cumulative losses in recent periods and current results outweighed the positive evidence as of December 31, 2013 and accordingly, the near-term realization of certain of these assets was deemed unlikely. The Company recorded a one-time, non-cash charge to income tax expense of $40.2 million to establish a valuation allowance against a significant portion of its deferred tax assets in the second quarter of fiscal 2014. The Company will continue to assess the likelihood that the deferred tax assets will be realizable at each reporting period and the valuation allowance will be adjusted accordingly.
The change in the valuation allowance was $67.2 million primarily related to setting up the valuation allowance and including a valuation of the Company’s deferred tax assets in the United States.
76
Table of Contents
Index to Financial Statements
NOTES TO CONSOLIDATED FINANCIAL STATEMENTS — (Continued)
As of June 30, 2014, the Company had no Federal operating loss carry-forwards. The state operating loss carryforward is approximately $5.2 million. Included in the California and other state NOL carryovers above $0.2 million and $0.2 million, respectively, relate to stock option windfall deductions which, when realized will be credited to equity. The operating loss carryforward in the India jurisdiction is approximately $2.7 million which will begin to expire on June 30, 2020. The Company has Federal and California research and development tax credit carry-forwards of approximately $0.3 million and $2.8 million, respectively, to offset future taxable income. The Federal research and development tax credits, if not used, will begin to expire on June 30, 2034, while the state tax credit carry-forwards do not have an expiration date and may be carried forward indefinitely.
United States federal income taxes have not been provided for the $2.1 million of cumulative undistributed earnings of the Company’s foreign subsidiaries as of June 30, 2014. The Company’s present intention is that such undistributed earnings be permanently reinvested offshore, with the exception of the undistributed earnings of its Canadian subsidiary. The Company would be subject to additional United States taxes if these earnings were repatriated. The amount of the unrecognized deferred income tax liability related to these earnings is not practical to estimate.
A reconciliation of the beginning and ending amounts of unrecognized tax benefits is as follows (in thousands):
| Fiscal Year | ||||||||||||
| 2014 | 2013 | 2012 | ||||||||||
| Balance at the beginning of the year |
$ | 2,692 | $ | 2,436 | $ | 2,312 | ||||||
| Gross increases - current period tax positions |
379 | 389 | 351 | |||||||||
| Gross increases - prior period tax positions |
323 | 132 | — | |||||||||
| Reductions as a result of lapsed statute of limitations |
(317 | ) | (265 | ) | (227 | ) | ||||||
|
|
|
|
|
|
|
|||||||
| Balance at the end of the year |
$ | 3,077 | $ | 2,692 | $ | 2,436 | ||||||
|
|
|
|
|
|
|
|||||||
The Company’s policy is to include interest and penalties related to unrecognized tax benefits within the Company’s (provision for) benefit from income taxes. As of June 30, 2014, the Company has accrued $1.0 million for interest and penalties related to the unrecognized tax benefits. The balance of unrecognized tax benefits and the related interest and penalties is recorded as a noncurrent liability on the Company’s consolidated balance sheet.
As of June 30, 2014, unrecognized tax benefits of $3.1 million, if recognized, would affect the Company’s effective tax rate. The Company does not anticipate that the amount of existing unrecognized tax benefits will significantly increase or decrease within the next 12 months.
The Company is no longer subject to U.S. federal, state and local, or non-U.S., income tax examinations by tax authorities for years before 2009. The Company files income tax returns in the United States, various U.S. states and certain foreign jurisdictions. As of June 30, 2014, the tax years 2011 through 2013 remain open in the U.S., the tax years 2009 through 2013 remain open in the various state jurisdictions, and the tax years 2011 through 2013 remain open in various foreign jurisdictions.
9. Debt
Credit Facility
In November 2011, the Company entered into the Second Amended and Restated Revolving Credit and Term Loan Agreement (“Second Loan Agreement”) with Comerica Bank (the “Bank”), the administrative agent and lead arranger. The Second Loan Agreement consists of a $100.0 million five-year term loan, with annual principal amortization of 5%, 10%, 15%, 20% and 50%, and a $200.0 million five-year revolving credit line.
77
Table of Contents
Index to Financial Statements
NOTES TO CONSOLIDATED FINANCIAL STATEMENTS — (Continued)
On February 15, 2013, the Company entered into the First Amendment to Credit Agreement and Amendment to Guaranty (“First Amendment”) with the Bank to, among other things: (1) amend the definition of EBITDA, effective as of December 31, 2012, to exclude extraordinary or non-recurring non-cash expenses or losses including, without limitation, goodwill impairments, and any extraordinary or non-recurring cash expenses in an aggregate amount not to exceed $5.0 million for the life of the Second Loan Agreement; and (2) reduce the $200.0 million five-year revolving credit line portion of the facility to $100.0 million, effective as of February 15, 2013. On July 17, 2014, the Company entered into the Second Amendment to Credit Agreement (“Second Amendment”) with the Bank to, among other things, amend the financial covenants and reduce the revolving loan facility from $100.0 million to $50.0 million, each effective as of June 30, 2014.
Borrowings under the Second Loan Agreement are secured by substantially all of the Company’s assets. Interest is payable at a rate computed using either Base rate or Eurodollar rate plus an applicable margin, at the Company’s option. Base rate is defined as the applicable margin plus the greatest of (a) the Prime Rate for such day, (b) the Federal Funds Effective Rate in effect on such day, plus 1% and (c) the Daily Adjusting LIBOR Rate plus 1%. Base rate borrowings bear interest at a Base rate plus an applicable margin which varies from (1) 0.625% to 1.375% for revolving loans and (2) 1.00% to 1.75% for term loans, depending on the Company’s funded debt to EBITDA ratio. Eurodollar rate borrowings bear interest at the Eurodollar rate plus an applicable margin which varies from (1) 1.625% to 2.375% for revolving loans and (2) 2.00% to 2.75% for term loans, depending on the Company’s funded debt to EBITDA ratio. Pursuant to the Second Amendment, for the period beginning on the effective date of the Second Amendment until the delivery of financial statements for the fiscal quarter ending December 31, 2015, (1) the applicable margin for Base rate borrowings is set at (a) 1.375% for revolving loans or (b) 1.75% for term loans, and (2) the applicable margin for Eurodollar rate borrowings is set at (a) 2.375% for revolving loans or (b) 2.75% for term loans. Thereafter, the applicable margin varies depending on our funded debt to EBITDA ratio, as described above.
EBITDA is defined as net (loss) income less (provision for) benefit from taxes, depreciation expense, amortization expense, stock-based compensation expense, interest and other income (expense), acquisition costs for business combinations, extraordinary or non-recurring non-cash expenses or losses including, without limitation, goodwill impairments, and any extraordinary or non-recurring cash expenses in an aggregate amount not to exceed $5.0 million for the life of this Second Loan Agreement. The revolving loan facility requires an annual facility fee of 0.375% of the revolving credit line capacity.
The Second Loan Agreement expires in November 2016. The Second Loan Agreement, as amended, restricts the Company’s ability to raise additional debt financing and pay dividends, and also requires the Company to comply with other nonfinancial covenants. In addition, the Company is required to maintain financial covenants as follows:
1. A minimum fixed charge coverage ratio as of the end of each fiscal quarter of not less than:
(a) 1.00:1:00 for the period between September 30, 2015 and June 30, 2016; and
(b) 1.15:1:00 for the period beginning July 1, 2016 and thereafter.
The fixed charge coverage ratio is not tested until the fiscal quarter ending September 30, 2015.
2. Minimum EBITDA as of the end of each fiscal quarter of not less than:
(a) $1 for the period between April 1, 2014 and June 30, 2015;
(b) $3,400,000 for the period between July 1, 2015 and September 30, 2015;
(c) $3,200,000 for the period between October 1, 2015 and December 31, 2015.
EBITDA is not tested after the fiscal quarter ending December 31, 2015.
78
Table of Contents
Index to Financial Statements
NOTES TO CONSOLIDATED FINANCIAL STATEMENTS — (Continued)
3. Minimum liquidity as of the end of each month of not less than $20,000,000.
The Company was in compliance with the covenants of the Second Loan Agreement, as amended, as of June 30, 2014 and 2013.
Upfront arrangement fees incurred in connection with the Second Amendment totaled $0.3 million and will be deferred and amortized over the remaining term of the arrangement.
Upfront arrangement fees incurred in connection with the First Amendment totaled $0.2 million and were deferred and will be amortized over the remaining term of the arrangement. In connection with the reduction of the revolving credit line capacity, during the third quarter of fiscal year 2013 the Company accelerated amortization of approximately $0.7 million of unamortized deferred upfront costs.
As of June 30, 2014 and June 30, 2013, $77.5 million and $90.0 million were outstanding under the term loan. There were no outstanding balances under the revolving credit line as of June 30, 2014 or 2013.
Interest Rate Swap
As discussed in the derivative instrument section in Note 2, Summary of Significant Accounting Policies, the Company entered into an interest rate swap to reduce its exposure to the financial impact of changing interest rates under its term loan. The swap encompasses the principal balances scheduled to be outstanding as of January 1, 2014 and thereafter, such principal amount totaling $85.0 million in January 2014 and amortizing to $35.0 million in November 2016. The effective date of the swap is April 9, 2012 with a maturity date of November 4, 2016. At June 30, 2014, the Company had approximately $77.5 million of notional amount outstanding in the swap agreement that exchanges a variable interest rate base (Eurodollar margin) for a fixed interest rate of 0.97% over the term of the agreement. This interest rate swap is designated as a cash flow hedge of the interest rate risk attributable to forecasted variable interest payments. The effective portion of the fair value gains or losses on this swap are included as a component of accumulated other comprehensive loss.
At June 30, 2014, the fair value of the interest rate swap liability was $0.6 million, of which $0.5 million was classified in current accrued liabilities and $0.1 million was classified as noncurrent other liabilities, and the hedge effective portion of the interest rate swap was $0.6 million.
Promissory Notes
The Company did not issue any promissory notes in fiscal year 2014 and 2013. During fiscal year 2012, the Company issued total promissory notes for the acquisition of businesses of $5.1 million net of imputed interest amount of $0.1 million. All of the promissory notes are non-interest-bearing. For these notes, interest was imputed such that the notes carry an interest rate commensurate with that available to the Company in the market for similar debt instruments. Accretion of promissory notes of $0.1 million, $0.1 million and $0.3 million was recorded as interest expense during fiscal years 2014, 2013 and 2012. Certain of the promissory notes are collateralized by the assets acquired with respect to which the notes were issued.
79
Table of Contents
Index to Financial Statements
NOTES TO CONSOLIDATED FINANCIAL STATEMENTS — (Continued)
Debt Maturities
The maturities of debt as of June 30, 2014 were as follows (in thousands):
| Year Ending June 30, |
Promissory Notes |
Second Loan Agreement |
||||||
| 2015 |
$ | 560 | $ | 17,500 | ||||
| 2016 |
50 | 20,000 | ||||||
| 2017 |
— | 40,000 | ||||||
| 2018 |
— | — | ||||||
| 2019 |
— | — | ||||||
|
|
|
|
|
|||||
| 610 | 77,500 | |||||||
| Less: imputed interest and unamortized discounts |
(7 | ) | (840 | ) | ||||
| Less: current portion |
(556 | ) | (17,142 | ) | ||||
|
|
|
|
|
|||||
| Noncurrent portion of debt |
$ | 47 | $ | 59,518 | ||||
|
|
|
|
|
|||||
Letters of Credit
The Company has a $0.4 million letter of credit agreement with a financial institution that is used as collateral for fidelity bonds placed with an insurance company and a $0.5 million letter of credit agreement with a financial institution that is used as collateral for the Company’s corporate headquarters’ operating lease. The letters of credit automatically renew annually without amendment unless cancelled by the financial institutions within 30 days of the annual expiration date.
10. Commitments and Contingencies
Leases
The Company leases office space and equipment under non-cancelable operating leases with various expiration dates through fiscal year 2019. Rent expense for fiscal years 2014, 2013 and 2012 was $3.6 million, $3.4 million and $3.4 million. The Company recognizes rent expense on a straight-line basis over the lease period and accrues for rent expense incurred but not paid.
Future annual minimum lease payments under all noncancelable operating leases as of June 30, 2014 were as follows (in thousands):
| Year Ending June 30, |
Operating Leases |
|||
| 2015 |
$ | 3,541 | ||
| 2016 |
3,582 | |||
| 2017 |
3,125 | |||
| 2018 |
3,062 | |||
| 2019 |
1,099 | |||
|
|
|
|||
| $ | 14,409 | |||
|
|
|
|||
In February 2010, the Company entered into a lease agreement for its corporate headquarters located at 950 Tower Lane, Foster City, California. The term of the lease began on November 1, 2010 and expires on October 31, 2018. The Company has the option to extend the term of the lease twice by one additional year. The
80
Table of Contents
Index to Financial Statements
NOTES TO CONSOLIDATED FINANCIAL STATEMENTS — (Continued)
monthly base rent was abated for the first 12 calendar months under the lease, and was $0.1 million through the 24th calendar month of the term of the lease. Monthly base rent increased to $0.2 million for the subsequent 12 months and now increases approximately 3% after each 12-month anniversary during the remaining term, including any extensions under options to extend.
Guarantor Arrangements
The Company has agreements whereby it indemnifies its officers and directors for certain events or occurrences while the officer or director is, or was, serving at the Company’s request in such capacity. The term of the indemnification period is for the officer or director’s lifetime. The maximum potential amount of future payments the Company could be required to make under these indemnification agreements is unlimited; however, the Company has a director and officer insurance policy that limits its exposure and enables the Company to recover a portion of any future amounts paid under certain circumstances and subject to deductibles and exclusions. As a result of its insurance policy coverage, the Company believes the estimated fair value of these indemnification agreements is not material. Accordingly, the Company had no liabilities recorded for these agreements as of June 30, 2014 and June 30, 2013.
In the ordinary course of its business, the Company from time to time enters into standard indemnification provisions in its agreements with its clients. Pursuant to these provisions, the Company may be obligated to indemnify its clients for certain losses suffered or incurred, including losses arising from violations of applicable law by the Company or by its third-party publishers, losses arising from actions or omissions of the Company or its third-party publishers, and for third-party claims that a Company product infringed upon a third party’s intellectual property rights. Where practicable, the Company limits its liabilities under such indemnities. Subject to these limitations, the term of such indemnity provisions is generally coterminous with the corresponding agreements but in some cases survives for a short period of time after termination of the agreement.
The potential amount of future payments to defend lawsuits or settle indemnified claims under these indemnification provisions is generally limited and the Company believes the estimated fair value of these indemnity provisions is not material. The payments under such agreements to date have not been significant and accordingly, the Company had no liabilities recorded for these agreements as of June 30, 2014 and 2013.
Litigation
In December 2012, Internet Patents Corporation (“IPC”) filed a patent infringement lawsuit against the Company in the United States District Court for the Northern District of California, alleging that the Company has infringed a patent held by IPC. In September 2013, the court dismissed a related case because it found that the patent is invalid, and on the same date, the court issued IPC an Order to Show Cause that the lawsuit against the Company should not be dismissed. In October 2013, IPC filed a response to the order and the court subsequently dismissed the case against the Company. In January 2014, IPC filed its appeal in the United States Court of Appeals for the Federal Circuit. While the Company denies IPC’s claims and believes that the probability of any loss is remote, there can be no assurance that the Company will prevail in this matter and any adverse ruling or settlement may have a significant impact on its business and operating results. In addition, regardless of the outcome of the matter, the Company may incur significant legal fees defending the action until it is resolved.
11. Stock Benefit Plans
Stock-Based Compensation
In fiscal years 2014, 2013 and 2012, the Company recorded stock-based compensation expense of $10.4 million, $12.0 million, and $13.0 million resulting in the recognition of related excess tax benefits (loss) of $0.5
81
Table of Contents
Index to Financial Statements
NOTES TO CONSOLIDATED FINANCIAL STATEMENTS — (Continued)
million, $0.1 million and $(0.7) million. The Company included as part of cash flows from financing activities a gross benefit of tax deductions of $0.5 million, $0.2 million and $0.2 million in fiscal years 2014, 2013 and 2012 related to stock-based compensation.
Stock Incentive Plans
In November 2009, the Company’s board of directors adopted the 2010 Equity Incentive Plan (the “2010 Incentive Plan”) and the Company’s stockholders approved the 2010 Incentive Plan in January 2010. The 2010 Incentive Plan became effective upon the completion of the IPO of the Company’s common stock in February 2010. Awards granted after January 2008 but before the adoption of the 2010 Incentive Plan continue to be governed by the terms of the 2008 Equity Incentive Plan (the “2008 Plan”). All outstanding stock awards granted before January 2008 continue to be governed by the terms of the Company’s amended and restated 1999 Equity Incentive Plan (the “1999 Plan”).
The 2010 Incentive Plan provides for the grant of incentive stock options (“ISOs”), nonstatutory stock options (“NQSOs”), restricted stock, restricted stock units, stock appreciation rights, performance-based stock awards and other forms of equity compensation, as well as for the grant of performance cash awards. The Company may issue ISOs only to its employees. NQSOs and all other awards may be granted to employees, including officers, nonemployee directors and consultants.
To date, the Company has issued only ISOs, NQSOs and restricted stock units under the 2010 Incentive Plan. ISOs and NQSOs are generally granted to employees with an exercise price equal to the market price of the Company’s common stock at the date of grant. Stock options granted to employees generally have a contractual term of seven years and vest over four years of continuous service, with 25 percent of the stock options vesting on the one-year anniversary of the date of grant and the remaining 75 percent vesting in equal monthly installments over the three year period thereafter. Restricted stock units granted to employees prior to fiscal year 2013 generally vest over five years of continuous service, with 15 percent of the restricted stock units vesting on the one-year anniversary of the date of grant, 60 percent vesting in equal quarterly installments over the following three years and the remaining 25 percent vesting in equal quarterly installments over the last year of the vesting period. Restricted stock units granted to employees starting in fiscal year 2013 generally vest over four years of continuous service, with 25 percent of the restricted stock units vesting on the one-year anniversary of the date of grant and 6.25% vesting quarterly thereafter for the next 12 quarters.
An aggregate of 9,210,527 shares of the Company’s common stock were reserved for issuance under the 2010 Incentive Plan as of June 30, 2014, and this amount will be increased by any outstanding stock awards that expire or terminate for any reason prior to their exercise or settlement. The number of shares of the Company’s common stock reserved for issuance is increased annually through July 1, 2019 by up to five percent of the total number of shares of the Company’s common stock outstanding on the last day of the preceding fiscal year. The maximum number of shares that may be issued under the 2010 Incentive Plan is 30,000,000. There were 7,576,412 shares available for issuance under the 2010 Incentive Plan as of June 30, 2014.
In November 2009, the Company’s board of directors adopted the 2010 Non-Employee Directors’ Stock Award Plan (the “Directors’ Plan”) and the stockholders approved the Directors’ Plan in January 2010. The Directors’ Plan became effective upon the completion of the Company’s IPO. The Directors’ Plan provides for the automatic grant of NQSOs and restricted stock units to non-employee directors and also provides for the discretionary grant of NQSOs and restricted stock units. Stock options granted to new non-employee directors vest in equal monthly installments over four years; annual grants to existing directors vest in equal monthly installments over one year and the initial and annual RSU grants vest quarterly over a period of four years.
82
Table of Contents
Index to Financial Statements
NOTES TO CONSOLIDATED FINANCIAL STATEMENTS — (Continued)
An aggregate of 1,593,162 shares of the Company’s common stock were reserved for issuance under the Directors’ Plan as of June 30, 2014. This amount is increased annually, by the sum of 200,000 shares and the aggregate number of shares of the Company’s common stock subject to awards granted under the Directors’ Plan during the immediately preceding fiscal year. There were 1,187,035 shares available for issuance under the Directors’ Plan as of June 30, 2014.
Valuation Assumptions
The Company estimates the fair value of stock option awards at the date of grant using the Black-Scholes option-pricing model. Options are granted with an exercise price equal to the fair value of the common stock as of the date of grant. The Company calculates the weighted average expected life of options using the simplified method pursuant to the accounting guidance for share-based payments as it does not have sufficient historical exercise experience. The Company estimates the expected volatility of its common stock based on its historical volatility over the stock option’s expected term. The Company has no history or expectation of paying dividends on its common stock. The risk-free interest rate is based on the U.S. Treasury yield for a term consistent with the expected term of the stock options.
The weighted average Black-Scholes model assumptions and the weighted average grant date fair value of employee stock options in fiscal years 2014, 2013 and 2012 were as follows:
| Fiscal Year Ended June 30, | ||||||||||||
| 2014 | 2013 | 2012 | ||||||||||
| Expected term (in years) |
4.6 | 4.6 | 4.6 | |||||||||
| Expected volatility |
48 | % | 54 | % | 55 | % | ||||||
| Expected dividend yield |
0.0 | % | 0.0 | % | 0.0 | % | ||||||
| Risk-free interest rate |
1.4 | % | 0.7 | % | 1.1 | % | ||||||
| Grant date fair value |
$ | 3.67 | $ | 3.82 | $ | 5.31 | ||||||
The fair value of restricted stock units is determined based on the closing price of the Company’s common stock on the grant date.
Compensation expense is amortized net of estimated forfeitures on a straight-line basis over the requisite service period of the stock-based compensation awards.
Stock Option Award Activity
The following table summarizes the stock option award activity under the Plans from June 30, 2012 to June 30, 2014:
| Shares | Weighted Average Exercise Price |
Weighted Average Remaining Contractual Life (in years) |
Aggregate Intrinsic Value (in thousands) |
|||||||||||||
| Outstanding at June 30, 2012 |
9,712,316 | $ | 10.62 | |||||||||||||
| Granted |
1,450,662 | 8.52 | ||||||||||||||
| Exercised |
(120,508 | ) | 3.79 | |||||||||||||
| Forfeited |
(612,138 | ) | 10.87 | |||||||||||||
| Expired |
(390,882 | ) | 12.65 | |||||||||||||
|
|
|
|||||||||||||||
| Outstanding at June 30, 2013 |
10,039,450 | $ | 10.31 | 3.39 | $ | 5,693,691 | ||||||||||
|
|
|
|
|
|
|
|
|
|||||||||
83
Table of Contents
Index to Financial Statements
NOTES TO CONSOLIDATED FINANCIAL STATEMENTS — (Continued)
| Shares | Weighted Average Exercise Price |
Weighted Average Remaining Contractual Life (in years) |
Aggregate Intrinsic Value (in thousands) |
|||||||||||||
| Granted |
1,449,608 | $ | 8.98 | |||||||||||||
| Exercised |
(731,936 | ) | 4.99 | |||||||||||||
| Forfeited |
(790,175 | ) | 10.75 | |||||||||||||
| Expired |
(2,454,355 | ) | 10.93 | |||||||||||||
|
|
|
|||||||||||||||
| Outstanding at June 30, 2014 |
7,512,592 | $ | 10.32 | 3.27 | $ | 225,182 | ||||||||||
|
|
|
|
|
|
|
|
|
|||||||||
| Vested and expected-to-vest at June 30, 2014 (1) |
7,262,396 | $ | 10.37 | 3.18 | $ | 225,182 | ||||||||||
|
|
|
|
|
|
|
|
|
|||||||||
| Vested and exercisable at June 30, 2014 |
5,697,399 | $ | 10.64 | 2.51 | $ | 225,182 | ||||||||||
|
|
|
|
|
|
|
|
|
|||||||||
| (1) | The expected-to-vest options are the result of applying the pre-vesting forfeiture assumption to total outstanding options. |
The following table summarizes additional information regarding outstanding and exercisable stock options at June 30, 2014.
| Options Outstanding | Options Exercisable | |||||||||||||||||||
| Range or Exercise Prices |
Number of Shares | Weighted Average Remaining Contractual Term |
Weighted Average Exercise Price |
Number of Shares | Weighted Average Exercise Price |
|||||||||||||||
| $4.60-$6.90 |
801,563 | 3.67 | $ | 5.76 | 544,039 | $ | 5.63 | |||||||||||||
| $7.01-$9.00 |
254,719 | 3.26 | $ | 8.20 | 180,719 | $ | 8.17 | |||||||||||||
| $9.01-$9.01 |
1,382,452 | 1.68 | $ | 9.01 | 1,382,452 | $ | 9.01 | |||||||||||||
| $9.23-$9.44 |
381,274 | 4.29 | $ | 9.34 | 306,270 | $ | 9.34 | |||||||||||||
| $9.55-$9.55 |
790,750 | 6.07 | $ | 9.55 | — | $ | — | |||||||||||||
| $9.64-$9.91 |
755,205 | 4.72 | $ | 9.67 | 404,420 | $ | 9.70 | |||||||||||||
| $10.28-$10.28 |
955,053 | 0.96 | $ | 10.28 | 955,053 | $ | 10.28 | |||||||||||||
| $10.34-$11.26 |
436,231 | 3.10 | $ | 10.85 | 427,261 | $ | 10.84 | |||||||||||||
| $11.67-$11.67 |
848,350 | 4.09 | $ | 11.67 | 598,256 | $ | 11.67 | |||||||||||||
| $12.43-$19.00 |
906,995 | 3.04 | $ | 17.11 | 898,929 | $ | 17.13 | |||||||||||||
|
|
|
|
|
|||||||||||||||||
| $4.60-$19.00 |
7,512,592 | 3.27 | $ | 10.32 | 5,697,399 | $ | 10.64 | |||||||||||||
|
|
|
|
|
|||||||||||||||||
The following table summarizes the total intrinsic value, the cash received and the actual tax benefit of all options exercised during fiscal years 2014, 2013 and 2012:
| Fiscal Year Ended June 30, | ||||||||||||
| 2014 | 2013 | 2012 | ||||||||||
| Intrinsic value |
$ | 1,875 | $ | 423 | $ | 1,197 | ||||||
| Cash received |
3,652 | 457 | 4,697 | |||||||||
| Tax benefit |
(470 | ) | 113 | 511 | ||||||||
As of June 30, 2014, there was $6.9 million of total unrecognized compensation expense related to unvested stock options which is expected to be recognized over a weighted average period of 2.59 years.
84
Table of Contents
Index to Financial Statements
NOTES TO CONSOLIDATED FINANCIAL STATEMENTS — (Continued)
Restricted Stock Unit Activity
The following table summarizes the restricted stock unit activity under the Plans from June 30, 2012 to June 30, 2014:
| Shares | Weighted Average Grant Date Fair Value |
Weighted Average Remaining Contractual Life (in years) |
Aggregate Intrinsic Value (in thousands) |
|||||||||||||
| Outstanding at June 30, 2012 |
379,555 | $ | 13.76 | 1.95 | $ | 3,515 | ||||||||||
|
|
|
|
|
|
|
|
|
|||||||||
| Granted |
1,658,613 | 8.75 | ||||||||||||||
| Vested |
(87,578 | ) | 6.95 | |||||||||||||
| Forfeited |
(290,381 | ) | 10.41 | |||||||||||||
|
|
|
|||||||||||||||
| Outstanding at June 30, 2013 |
1,660,209 | $ | 9.70 | 1.47 | $ | 14,328 | ||||||||||
|
|
|
|
|
|
|
|
|
|||||||||
| Granted |
1,049,276 | 9.11 | ||||||||||||||
| Vested |
(650,254 | ) | 7.81 | |||||||||||||
| Forfeited |
(411,894 | ) | 9.57 | |||||||||||||
|
|
|
|||||||||||||||
| Outstanding at June 30, 2014 |
1,647,337 | $ | 10.10 | 1.32 | $ | 9,077 | ||||||||||
|
|
|
|
|
|
|
|
|
|||||||||
As of June 30, 2014, there was $12.2 million of total unrecognized compensation expense related to restricted stock units which is expected to be recognized over a weighted average period of 2.72 years.
12. Stockholders’ Equity
Stock Repurchases
During the fiscal year ended 2014, the Company did not repurchase any shares of common stock.
On November 3, 2011, the Board of Directors authorized a stock repurchase program allowing the Company to repurchase up to $50.0 million of its outstanding shares of its common stock. During fiscal year 2012, the Company repurchased 4,753,919 shares of its common stock for a total of $45.0 million. The Company completed its repurchase program during the first quarter of fiscal year 2013, purchasing 509,565 shares of its common stock for $5.0 million. The Company repurchased an aggregate of 5,263,484 shares of its common stock at a weighted average price of $9.50 per share. Repurchases under this program took place in the open market and were made under a Rule 10b5-1 plan.
Retirement of Treasury Stock
During the fiscal year ended 2014, the Company did not retire any shares of treasury stock.
During the fiscal year ended 2013, the Company retired 638,365 shares of treasury stock, with a carrying value of approximately $6.2 million. These retired shares are now included in the Company’s pool of authorized but unissued shares. The retired treasury stock was initially recorded using the cost method. The Company’s accounting policy upon the retirement of treasury stock is to deduct its par value from common stock, reduce additional paid-in capital by the amount recorded in additional paid-in capital when the stock was originally issued and any remaining excess of cost as a deduction (increase) of retained earnings (accumulated deficit).
85
Table of Contents
Index to Financial Statements
NOTES TO CONSOLIDATED FINANCIAL STATEMENTS — (Continued)
13. Related Party Transactions
On April 22, 2013, the Company entered into an agreement (the “Transition Agreement”) with Bronwyn Syiek, the Company’s President, which provides for the transition and conclusion of Ms. Syiek’s employment with the Company. Pursuant to the Transition Agreement, Ms. Syiek continued to work full time as the Company’s President at her existing base salary through September 30, 2013. Ms. Syiek was eligible for, and received, a bonus for fiscal year 2013. On September 18, 2013, the Company entered into an amendment to the Transition Agreement, (the “Amended Transition Agreement”) whereby the amendment replaced the agreement in its entirety. Pursuant to the Amended Transition Agreement Ms. Syiek’s employment with the Company terminated on October 1, 2013, at which point Ms. Syiek entered into a consulting agreement with the Company, in consideration for which her “Continuous Service” (as defined in the Company’s 2010 Equity Incentive Plan) continued for certain of her equity awards. Ms. Syiek received $37,400 in cash compensation under the consulting agreement. The consulting agreement terminated on March 30, 2014.
In connection with its continuing review of non-strategic assets in March 2014, the Company elected to dispose of its equity investment in DemandBase, Inc. (“DemandBase”). In this regard, the Company contacted a number of existing DemandBase investors, including Split Rock Partners II, LP (“Split Rock”). Split Rock is managed by Split Rock Partners II Management, LLC, of which one of the Company’s directors Mr. James Simons is a managing director. In addition, one of the Company’s directors Mr. Gregory Sands is a member of the board of directors of DemandBase and is also a managing partner of Costanoa Venture Capital, which is an investor in DemandBase. The Company conducted an auction process with respect to the sale of the DemandBase shares. Split Rock ultimately prevailed in that process, and the Company’s Audit Committee approved the sale in accordance with the Company’s related person transactions policy. On April 11, 2014 the Company entered into a Stock Purchase Agreement with Split Rock whereby the partnership purchased all 1,436,781 shares of Series D Preferred Stock of DemandBase owned by the Company for a total purchase price of $1,436,781.
14. Segment Information
Operating segments are defined as components of an enterprise about which separate financial information is available that is evaluated regularly by the chief operating decision maker, or decision making group, in deciding how to allocate resources and in assessing performance. The Company’s chief operating decision maker is its chief executive officer. The Company’s chief executive officer reviews financial information presented on a consolidated basis, accompanied by information about operating segments, including net sales and operating income before depreciation, amortization and stock-based compensation expense.
The Company determined its reportable operating segment is DMS, which derives revenue from fees earned through the delivery of qualified leads, clicks, calls, customers and, to a lesser extent, impressions. DSS does not meet the quantitative threshold for an individually reportable segment and is therefore included in the “All other” line in the following table.
The Company evaluates the performance of its operating segment based on operating income before depreciation, amortization and stock-based compensation expense.
The Company does not allocate all of its assets, or its depreciation and amortization expense, stock-based compensation expense, interest income, interest expense and income tax expense by segment. Accordingly, the Company does not report such information.
86
Table of Contents
Index to Financial Statements
NOTES TO CONSOLIDATED FINANCIAL STATEMENTS — (Continued)
Summarized information by segment was as follows (in thousands):
| Fiscal Year Ended June 30, | ||||||||||||
| 2014 | 2013 | 2012 | ||||||||||
| Net revenue by segment: |
||||||||||||
| DMS |
$ | 281,490 | $ | 304,085 | $ | 369,023 | ||||||
| All other |
1,059 | 1,016 | 1,445 | |||||||||
|
|
|
|
|
|
|
|||||||
| Total net revenue |
282,549 | 305,101 | 370,468 | |||||||||
|
|
|
|
|
|
|
|||||||
| Segment operating income before depreciation, amortization, stock-based compensation expense, and goodwill impairment: |
||||||||||||
| DMS |
23,558 | 47,316 | 71,840 | |||||||||
| All other |
631 | 556 | 808 | |||||||||
|
|
|
|
|
|
|
|||||||
| Total segment operating income before depreciation, amortization, stock-based compensation expense, and goodwill impairment |
24,189 | 47,872 | 72,648 | |||||||||
| Depreciation and amortization |
(26,097 | ) | (32,325 | ) | (31,150 | ) | ||||||
| Stock-based compensation expense |
(10,429 | ) | (12,016 | ) | (12,996 | ) | ||||||
| Impairment of goodwill |
(95,641 | ) | (92,350 | ) | — | |||||||
|
|
|
|
|
|
|
|||||||
| Total operating (loss) income |
$ | (107,978 | ) | $ | (88,819 | ) | $ | 28,502 | ||||
|
|
|
|
|
|
|
|||||||
The following tables set forth net revenue and long-lived assets by geographic area (in thousands):
| Fiscal Year Ended June 30, | ||||||||||||
| 2014 | 2013 | 2012 | ||||||||||
| Net revenue: |
||||||||||||
| United States |
$ | 278,791 | $ | 302,178 | $ | 369,081 | ||||||
| International |
3,758 | 2,923 | 1,387 | |||||||||
|
|
|
|
|
|
|
|||||||
| Total net revenue |
$ | 282,549 | $ | 305,101 | $ | 370,468 | ||||||
|
|
|
|
|
|
|
|||||||
| June 30, | June 30, | |||||||
| 2014 | 2013 | |||||||
| Property and equipment, net: |
||||||||
| United States |
$ | 10,878 | $ | 9,502 | ||||
| International |
248 | 205 | ||||||
|
|
|
|
|
|||||
| Total property and equipment, net |
$ | 11,126 | $ | 9,707 | ||||
|
|
|
|
|
|||||
87
Table of Contents
Index to Financial Statements
Item 9. Changes In and Disagreements with Accountants on Accounting and Financial Disclosure
None.
Item 9A. Controls and Procedures
Evaluation of Disclosure Controls and Procedures
Our management, with the participation of our Chief Executive Officer and our Chief Financial Officer, evaluated the effectiveness of our disclosure controls and procedures as of June 30, 2014. The term “disclosure controls and procedures,” as defined in Rules 13a-15(e) and 15d-15(e) under the Securities Exchange Act of 1934, as amended (the “Exchange Act”), means controls and other procedures of a company that are designed to ensure that information required to be disclosed by a company in the reports that it files or submits under the Exchange Act is recorded, processed, summarized and reported, within the time periods specified in the SEC’s rules and forms. Disclosure controls and procedures include, without limitation, controls and procedures designed to ensure that information required to be disclosed by a company in the reports that it files or submits under the Exchange Act is accumulated and communicated to the company’s management, including its principal executive and principal financial officers, as appropriate to allow timely decisions regarding required disclosure. Management recognizes that any controls and procedures, no matter how well designed and operated, can provide only reasonable assurance of achieving their objectives and management necessarily applies its judgment in evaluating the cost-benefit relationship of possible controls and procedures. Based on the evaluation of our disclosure controls and procedures as of June 30, 2014, our Chief Executive Officer and Chief Financial Officer concluded that, as of such date, our disclosure controls and procedures were effective at the reasonable assurance level.
Management’s Report on Internal Control Over Financial Reporting
Our management is responsible for establishing and maintaining adequate internal control over financial reporting as defined in Rules 13a-15(f) and 15d-15(f) under the Exchange Act. Our internal control over financial reporting is designed to provide reasonable assurance regarding the reliability of financial reporting and the preparation of consolidated financial statements for external purposes in accordance with generally accepted accounting principles. Our internal control over financial reporting includes those policies and procedures that:
(i) pertain to the maintenance of records that, in reasonable detail, accurately and fairly reflect the transactions and dispositions of its assets,
(ii) provide reasonable assurance that transactions are recorded as necessary to permit preparation of consolidated financial statements in accordance with generally accepted accounting principles, and that receipts and expenditures are being made only in accordance with authorizations of our management and directors, and
(iii) provide reasonable assurance regarding prevention or timely detection of any unauthorized acquisition, use or disposition of our assets that could have a material effect on the consolidated financial statements.
Because of its inherent limitations, internal control over financial reporting may not prevent or detect misstatements. Also, projections of any evaluation of internal control effectiveness to future periods are subject to the risk that controls may become inadequate because of changes in conditions, or that the degree of compliance with the policies or procedures may deteriorate.
Our management has assessed the effectiveness of the internal control over financial reporting as of June 30, 2014. In making this assessment, our management used the criteria set forth by the Committee of Sponsoring Organizations of the Treadway Commission (“COSO”) in Internal Control — Integrated Framework (1992 Framework). Based on this evaluation, our management has concluded that our internal control over financial reporting was effective as of June 30, 2014.
88
Table of Contents
Index to Financial Statements
The effectiveness of our internal control over financial reporting as of June 30, 2014 has been audited by PricewaterhouseCoopers LLP, an independent registered public accounting firm, as stated in their report which appears in this annual report on Form 10-K.
Changes in Internal Control over Financial Reporting
There was no change in our internal control over financial reporting identified in connection with the evaluation required by Rule 13a-15(d) and 15d-15(d) of the Exchange Act that occurred during the three months ended June 30, 2014 that has materially affected, or is reasonably likely to materially affect, our internal control over financial reporting.
None.
89
Table of Contents
Index to Financial Statements
PART III
Item 10. Directors, Executive Officers and Corporate Governance
The information required by this item concerning directors and executive officers is incorporated herein by reference from the sections to be titled “Election of Class II Directors,” “Board of Directors,” and “Directors and Executive Officers” in our definitive proxy statement to be filed with the Securities and Exchange Commission in connection with our 2014 annual meeting of stockholders (the “Proxy Statement”). The Proxy Statement is expected to be filed no later than 120 days after the end of our fiscal year ended June 30, 2014.
The information required by this item with respect to Section 16(a) of the Exchange Act is incorporated herein by reference from the section to be titled “Section 16(a) Beneficial Ownership Reporting Compliance” in our Proxy Statement.
Code of Ethics
We have adopted a Code of Conduct and Ethics that applies to all of our employees, officers (including our principal executive officer, principal financial officer, principal accounting officer or controller, or persons performing similar functions), agents and representatives, including directors and consultants. We will make any required disclosure of future amendments to our Code of Conduct and Ethics, or waivers of such provisions, applicable to any principal executive officer, principal financial officer, principal accounting officer or controller, or persons performing similar functions or our directors on the investor relations page of our corporate website (www.quinstreet.com).
Item 11. Executive Compensation
The information required by this item will be set forth in the sections to be titled “Report of the Compensation Committee,” “Board of Directors” and “Executive Compensation” in our Proxy Statement and is incorporated herein by reference.
Item 12. Security Ownership of Certain Beneficial Owners and Management and Related Stockholder Matters
The information required by this item will be set forth in the sections to be titled “Executive Compensation” and “Stock Ownership of Certain Beneficial Owners and Management” in our Proxy Statement and is incorporated herein by reference.
Item 13. Certain Relationships and Related Transactions, and Director Independence
The information required by this item will be included in the section to be titled “Stock Ownership of Certain Beneficial Owners and Management” and “Board of Directors” in the Proxy Statement and is incorporated herein by reference.
Item 14. Principal Accountant Fees and Services
The information required by this item will be set forth in the section to be titled “Ratification of the Selection of PricewaterhouseCoopers LLP as our Independent Registered Public Accounting Firm” in our Proxy Statement and is incorporated herein by reference.
90
Table of Contents
Index to Financial Statements
Item 15. Exhibits, Financial Statement Schedules
(a) We have filed the following documents as part of this Annual Report on Form 10-K:
1. Consolidated Financial Statements
| Page | ||||
| 55 | ||||
| 56 | ||||
| 57 | ||||
| 58 | ||||
| 59 | ||||
| 60 | ||||
| 61 | ||||
2. Financial Statement Schedules
The following financial statement schedule is filed as a part of this report:
Schedule II: Valuation and Qualifying Accounts
The activity in the allowance for doubtful accounts receivables, sales returns and the deferred tax asset valuation allowance are as follows (in thousands):
| Balance at the beginning of the year |
Charged to expenses/ against revenue |
Write-offs Net of Recoveries |
Balance at the end of the year |
|||||||||||||
| Accounts receivable and sales returns |
||||||||||||||||
| Fiscal year 2012 |
$ | 2,723 | $ | 2,185 | $ | (2,101 | ) | $ | 2,807 | |||||||
| Fiscal year 2013 |
$ | 2,807 | $ | 97 | $ | (878 | ) | $ | 2,026 | |||||||
| Fiscal year 2014 |
$ | 2,026 | $ | 322 | $ | (426 | ) | $ | 1,922 | |||||||
| Deferred tax asset valuation allowance |
||||||||||||||||
| Fiscal year 2013 |
$ | — | $ | 947 | $ | — | $ | 947 | ||||||||
| Fiscal year 2014 |
$ | 947 | $ | 67,225 | $ | — | $ | 68,172 | ||||||||
Note: Additions to the allowance for doubtful accounts and the valuation allowance are charged to expense. Additions to the allowance for sales credits are charged against revenue.
All other schedules are omitted because they are not required or the required information is shown in the financial statements or notes thereto.
(b) Exhibits
See the exhibit index immediately following the signature page of this Annual Report on Form 10-K.
91
Table of Contents
Index to Financial Statements
Pursuant to the requirements of Section 13 or 15(d) of the Securities Exchange Act of 1934, the Registrant has duly caused this report to be signed on its behalf by the undersigned, thereunto duly authorized, on September 12, 2014.
| QuinStreet, Inc. | ||
| By: | /s/ Douglas Valenti | |
| Douglas Valenti Chairman and Chief Executive Officer | ||
POWER OF ATTORNEY
KNOW ALL PERSONS BY THESE PRESENTS, that each person whose signature appears below constitutes and appoints Douglas Valenti and Gregory Wong, and each of them, as his true and lawful attorneys-in-fact and agents, with full power of substitution and re-substitution, for him in any and all capacities, to sign any and all amendments to this Annual Report on Form 10-K and to file the same, with all exhibits thereto, and other documents in connection therewith, with the Securities and Exchange Commission hereby ratifying and confirming that each of said attorneys-in-fact and agents, or his substitute or substitutes, may lawfully do or cause to be done by virtue hereof.
Pursuant to the requirements of the Securities Exchange Act of 1934, this report has been signed below by the following persons on behalf of the Registrant and in the capacities and on the dates indicated.
| Signature |
Title |
Date | ||
| /s/ Douglas Valenti Douglas Valenti |
Chairman of the Board and Chief Executive Officer (Principal Executive Officer) |
September 12, 2014 | ||
| /s/ Gregory Wong Gregory Wong |
Chief Financial Officer and Senior Vice President (Principal Financial and Accounting Officer) |
September 12, 2014 | ||
| /s/ William Bradley William Bradley |
Director |
September 12, 2014 | ||
| /s/ Robin Josephs Robin Josephs |
Director |
September 12, 2014 | ||
| /s/ John G. McDonald John G. McDonald |
Director |
September 12, 2014 | ||
| /s/ Gregory Sands Gregory Sands |
Director |
September 12, 2014 | ||
| /s/ James Simons James Simons |
Director |
September 12, 2014 | ||
| /s/ Dana Stalder Dana Stalder |
Director |
September 12, 2014 | ||
92
Table of Contents
Index to Financial Statements
EXHIBIT INDEX
| Exhibit No. |
Description of Exhibit | |
| 2.1(8) | Stock Purchase Agreement, dated November 5, 2010, by and among QuinStreet, Inc., Car Insurance.com, Inc., Car Insurance Agency, Inc., Car Insurance Holdings, Inc., CarInsurance.com, Inc., Lloyd Register IV, Lloyd Register III, David Fitzgerald, Timothy Register, Randy Horowitz and Erick Pace. | |
| 3.1(6) | Amended and Restated Certificate of Incorporation. | |
| 3.2(7) | Bylaws. | |
| 4.1(3) | Form of QuinStreet, Inc.’s Common Stock Certificate. | |
| 4.2(1) | Second Amended and Restated Investor Rights Agreement, by and between QuinStreet, Inc., Douglas Valenti and the investors listed on Schedule 1 thereto, dated May 28, 2003. | |
| 10.1(1)+ | QuinStreet, Inc. 2008 Equity Incentive Plan. | |
| 10.2(1)+ | Forms of Option Agreement and Option Grant Notice under 2008 Equity Incentive Plan (for non-executive officer employees). | |
| 10.3(1)+ | Forms of Option Agreement and Option Grant Notice under 2008 Equity Incentive Plan (for executive officers). | |
| 10.4(1)+ | Forms of Option Agreement and Option Grant Notice under 2008 Equity Incentive Plan (for non-employee directors). | |
| 10.5(2)+ | QuinStreet, Inc. 2010 Equity Incentive Plan. | |
| 10.6(19)+ | Forms of Option Agreement and Option Grant Notice under 2010 Equity Incentive Plan (for non-executive officer employees). | |
| 10.7(23)+ | Forms of Option Agreement and Option Grant Notice under 2010 Equity Incentive Plan (for executive officers). | |
| 10.8(17)+ | Forms of Senior Management Restricted Stock Unit (RSU) Grant Notice and Agreement under 2010 Equity Incentive Plan (for executive officers). | |
| 10.9(17)+ | Forms of Restricted Stock Unit (RSU) Grant Notice and Agreement under 2010 Equity Incentive Plan (for non-executive officer employees). | |
| 10.10(24)+ | Form of Restricted Stock Unit Agreement under 2010 Equity Incentive Plan (for non-employee directors) | |
| 10.11(13)+ | QuinStreet, Inc. 2010 Non-Employee Directors’ Stock Award Plan. | |
| 10.12(14)+ | Forms of Option Agreement and Option Grant Notice for Initial Grants under the 2010 Non-Employee Directors’ Stock Award Plan. | |
| 10.13(15)+ | Forms of Option Agreement and Option Grant Notice for Annual Grants under the 2010 Non-Employee Directors’ Stock Award Plan. | |
| 10.14(11)+ | Form of Incremental Bonus Plan. | |
| 10.15(12)+ | Annual Incentive Plan. | |
| 10.16(9) | Second Amended and Restated Revolving Credit and Term Loan Agreement, by and among QuinStreet, Inc., the lenders thereto and Comerica Bank as Administrative Agent Sole Lead Arranger and Sole Bookrunner, Bank of America N.A. as Syndication Agent, and Union Bank, N.A. as Documentation Agent dated as of November 4, 2011. | |
93
Table of Contents
Index to Financial Statements
| Exhibit No. |
Description of Exhibit | |
| 10.17(18) | First Amendment to Credit Agreement and Amendment to Guaranty dated as of February 15, 2013. | |
| 10.18(5) | Office Lease Metro Center, dated as of February 25, 2010, between the registrant and CA-Metro Center Limited Partnership | |
| 10.19(4)+ | Form of Indemnification Agreement made by and between QuinStreet, Inc. and each of its directors and executive officers. | |
| 10.20(10) | Assurance of Voluntary Compliance dated June 26, 2012 by and among QuinStreet, Inc. and the Attorneys General of the States of Alabama, Arizona, Arkansas, Delaware, Florida, Idaho, Illinois, Iowa, Kentucky, Massachusetts, Mississippi, Missouri, Nevada, New York, North Carolina, Ohio, Oregon, South Carolina, Tennessee and West Virginia. | |
| 10.21(26) | License and Investment Agreement by and among QuinStreet, Inc., Bronwyn Syiek and TownB Corporation dated August 23, 2012. | |
| 10.22(16) | Transition Agreement dated April 9, 2013 between the Company and Bronwyn Syiek. | |
| 10.23(20) | Transition Agreement dated September 18, 2013 between the Company and Scott Mackley. | |
| 10.24(21) | Transition Agreement dated September 18, 2013 between the Company and Bronwyn Syiek. | |
| 10.25(22) | Amendment to Consulting Services Agreement dated October 30, 2013 to the Transition Agreement dated September 18, 2013 between the Company and Bronwyn Syiek. | |
| 10.26(25) | Second Amendment to Credit Agreement dated as of July 17, 2014. | |
| 10.27*+ | Forms of Senior Management Performance-Based Restricted Stock Unit (RSU) Grant Notice and Agreement under 2010 Equity Incentive Plan (for executive officers). | |
| 23.1* | Consent of Independent Registered Public Accounting Firm. | |
| 24.1* | Power of Attorney (incorporated by reference to the signature page of this Annual Report on Form 10-K). | |
| 31.1* | Certification of the Chief Executive Officer of QuinStreet, Inc. pursuant to Section 302 of the Sarbanes-Oxley Act. | |
| 31.2* | Certification of the Chief Financial Officer of QuinStreet, Inc. pursuant to Section 302 of the Sarbanes-Oxley Act. | |
| 32.1** | Section 1350 Certifications of Chief Executive Officer and Chief Financial Officer. | |
| 101.INS** | XBRL Instance Document | |
| 101.SCH** | XBRL Taxonomy Extension Schema Document | |
| 101.CAL** | XBRL Taxonomy Extension Calculation Linkbase Document | |
| 101.DEF** | XBRL Taxonomy Extension Definition Linkbase Document | |
| 101.LAB** | XBRL Taxonomy Extension Label Linkbase Document | |
| 101.PRE** | XBRL Taxonomy Extension Presentation Linkbase Document | |
| * | Filed herewith. |
| ** | Furnished herewith. |
| + | Indicates management contract or compensatory plan. |
94
Table of Contents
Index to Financial Statements
| (1) | Incorporated by reference to the same numbered exhibit to QuinStreet, Inc.’s Registration Statement on Form S-1 (SEC File No. 333-163228) filed on November 19, 2009. |
| (2) | Incorporated by reference Exhibit 99.9 to QuinStreet Inc.’s Registration Statement on Form S-8 (SEC File No. 333-165534) filed on March 17, 2010. |
| (3) | Incorporated by reference to the same numbered exhibit to QuinStreet, Inc.’s Amendment No. 2 to Registration Statement on Form S-1 (SEC File No. 333-163228) filed on January 14, 2010. |
| (4) | Incorporated by reference to the same numbered exhibit to QuinStreet, Inc.’s Amendment No. 3 to Registration Statement on Form S-1 (SEC File No. 333-163228) filed on January 26, 2010. |
| (5) | Incorporated by reference to Exhibit 10.1 to QuinStreet, Inc.’s Quarterly Report on Form 10-Q (SEC File No. 001-34628) filed on May 12, 2010. |
| (6) | Incorporated by reference to Exhibit 3.2 to QuinStreet, Inc.’s Amendment No. 1 to Registration Statement on Form S-1 (SEC File No. 333-163228) filed on December 22, 2009. |
| (7) | Incorporated by reference to Exhibit 3.4 to QuinStreet, Inc.’s Amendment No. 1 to Registration Statement on Form S-1 (SEC File No. 333-163228) filed on December 22, 2009. |
| (8) | Incorporated by reference to the same numbered exhibit to QuinStreet, Inc.’s Current Report on Form 8-K (SEC File No. 001-34628) filed on November 8, 2010. |
| (9) | Incorporated by reference to Exhibit 10.1 to QuinStreet, Inc.’s Quarterly Report on Form 10-Q (SEC File No. 001-34628) filed on November 8, 2011. |
| (10) | Incorporated by reference to Exhibit 10.1 to QuinStreet, Inc.’s Current Report on Form 8-K (SEC File No. 001-34628) filed on June 27, 2012. |
| (11) | Incorporated by reference to Exhibit 10.11 to QuinStreet, Inc.’s Annual Report on Form 10-K (SEC File No. 001- 34628) filed on August 30, 2011. |
| (12) | Incorporated by reference to Exhibit 10.12 to QuinStreet, Inc.’s Amendment No. 2 to Registration Statement on Form S-1 (SEC File No. 333- 163228) filed on January 14, 2010. |
| (13) | Incorporated by reference to Exhibit 99.12 to QuinStreet Inc.’s Registration Statement on Form S-8 (SEC File No. 333-165534) filed on March 17, 2010. |
| (14) | Incorporated by reference to Exhibit 99.13 to QuinStreet Inc.’s Registration Statement on Form S-8 (SEC File No. 333-165534) filed on March 17, 2010. |
| (15) | Incorporated by reference to Exhibit 99.14 to QuinStreet Inc.’s Registration Statement on Form S-8 (SEC File No. 333-165534) filed on March 17, 2010. |
| (16) | Incorporated by reference to Exhibit 10.1 to QuinStreet, Inc.’s Current Report on Form 8-K (SEC File No. 001-34628) filed on April 23, 2013. |
| (17) | Incorporated by reference to the same numbered exhibit to QuinStreet, Inc.’s Annual Report on Form 10-K (SEC File No. 001-34628) filed on August 23, 2012. |
| (18) | Incorporated by reference to Exhibit 10.1 to QuinStreet, Inc.’s Quarterly Report on Form 10-Q (SEC File No. 001-34628) filed on February 15, 2013. |
| (19) | Incorporated by reference to Exhibit 99.10 to QuinStreet Inc.’s Registration Statement on Form S-8 (SEC File No. 333-165534) filed on March 17, 2010. |
| (20) | Incorporated by reference to Exhibit 10.1 to QuinStreet, Inc.’s Current Report on Form 8-K (SEC File No. 001-34628) filed on September 19, 2013. |
| (21) | Incorporated by reference to Exhibit 10.2 to QuinStreet Inc.’s Current Report on Form 8-K (SEC File No. 001-34628) filed on September 19, 2013. |
95
Table of Contents
Index to Financial Statements
| (22) | Incorporated by reference to Exhibit 10.3 to QuinStreet, Inc.’s Quarterly Report on Form 10-Q (SEC File No. 001-34628) filed on November 6, 2013. |
| (23) | Incorporated by reference to Exhibit 99.11 to QuinStreet Inc.’s Registration Statement on Form S-8 (SEC File No. 333-165534) filed on March 17, 2010. |
| (24) | Incorporated by reference to the same numbered exhibit to QuinStreet Inc.’s Annual Report on Form 10-K (SEC File No. 001-34628) filed on August 20, 2013. |
| (25) | Incorporated by reference to Exhibit 10.1 to QuinStreet, Inc.’s Current Report on Form 8-K (SEC File No. 001-34628) filed on July 22, 2014. |
| (26) | Incorporated by reference to Exhibit 10.19 to QuinStreet, Inc.’s Annual Report on Form 10-K (SEC File No. 001-34628) filed on August 23, 2012. |
96