Attached files
| file | filename |
|---|---|
| EXCEL - IDEA: XBRL DOCUMENT - VERSAR INC | Financial_Report.xls |
| EX-21 - EXHIBIT 21 - VERSAR INC | v388278_ex21.htm |
| EX-23 - EXHIBIT 23 - VERSAR INC | v388278_ex23.htm |
| EX-3.1 - EXHIBIT 3.1 - VERSAR INC | v388278_ex3-1.htm |
| EX-31.1 - EXHIBIT 31.1 - VERSAR INC | v388278_ex31-1.htm |
| EX-32.2 - EXHIBIT 32.2 - VERSAR INC | v388278_ex32-2.htm |
| EX-31.2 - EXHIBIT 31.2 - VERSAR INC | v388278_ex31-2.htm |
| EX-32.1 - EXHIBIT 32.1 - VERSAR INC | v388278_ex32-1.htm |
UNITED STATES
SECURITIES AND EXCHANGE COMMISSION
WASHINGTON, D.C. 20549
FORM 10-K
ANNUAL REPORT PURSUANT TO SECTION 13 OR 15(d) OF
THE SECURITIES EXCHANGE ACT OF 1934
| For the fiscal year ended | Commission File |
| June 27, 2014 | No. 1-9309 |

(Exact name of registrant as specified in its charter)
| DELAWARE | 54-0852979 |
| (State or other jurisdiction of Incorporation or organization) | (I.R.S. employer identification no.) |
| 6850 Versar Center, Springfield, Virginia | 22151 |
| (Address of principal executive offices) | (Zip code) |
(703) 750-3000
(Registrant’s telephone number, including area code)
Securities registered pursuant to Section 12(b) of the Act:
Common Stock, $.01 par value
(Title of Class)
NYSE MKT
(Name of each exchange on which registered)
Securities registered pursuant to Section 12(g) of Act: NONE
Indicate by check mark if the registrant is a well-known seasoned issuer, as defined in Rule 405 of the Securities Act.
Yes ¨ No þ
Indicate by check mark if the registrant is not required to file reports pursuant to Section 13 or Section 15(d) of the Act.
Yes ¨ No þ
Indicate by check mark whether the registrant (1) has filed all reports required to be filed by Section 13 or 15(d) of the Securities Exchange Act of 1934 during the preceding 12 months (or for such shorter period that the registrant was required to file such reports), and (2) has been subject to such filing requirements for the past 90 days.
Yes þ No ¨
Indicate by check mark whether the registrant has submitted electronically and posted on its corporate web site, if any, every Interactive Data File required to be submitted and posted pursuant to Rule 405 of Regulation S-T during the preceding 12 months (or for such shorter period that the registrant was required to submit and post such files).
Yes þ No ¨
Indicate by check mark if disclosure of delinquent filers pursuant to Item 405 of Regulation S-K is not contained herein, and will not be contained, to the best of registrant’s knowledge, in definitive proxy or information statements incorporated by reference in Part III of this Form 10-K or any amendment to this Form 10-K. ¨
Indicate by check mark whether the registrant is a large accelerated filer, an accelerated filer, or a non-accelerated filer (as defined in Rule 12b-2 of the Exchange Act).
| Large accelerated filer ¨ | Accelerated filer ¨ | |
| Non-accelerated filer ¨ (Do not check if a smaller reporting company) | Smaller reporting company þ |
Indicate by check mark whether the registrant is a shell company (as defined in Rule 12b-2 of the Exchange Act).
Yes ¨ No þ
The aggregate market value of the voting stock held by non-affiliates of the registrant as of December 27, 2013 was approximately $34,331,460 The number of shares of Common Stock outstanding as of September 2, 2014 was 9,715,844.
DOCUMENTS INCORPORATED BY REFERENCE
Portions of the registrant’s Proxy Statement to be filed with the Securities and Exchange Commission with respect to the 2014 Annual Meeting of Stockholders are incorporated by reference into Part III hereof.
PART I
Item 1. Business
Unless this report indicates otherwise the terms ”Versar,” the “Company,” “we,” “us,” and “our” refer to Versar, Inc. and its consolidated subsidiaries. Versar’s fiscal year end is based upon a 52 or 53 week year ending on the last Friday of the fiscal period and therefore does not close on a calendar month end. The Company’s fiscal years 2014 and 2012 included 52 weeks, while fiscal 2013 included 53 weeks.
Cautionary Statement Regarding Forward-Looking Statements
This report contains certain forward-looking statements that are based on current expectations. Actual results may differ materially. The forward-looking statements include, without limitation, those regarding the continued award of future work or task orders from government and private clients, cost controls and reductions, the expected resolution of delays in billing of certain projects, and the possible impact of current and future claims against the Company based upon negligence and other theories of liability. Forward-looking statements involve numerous risks and uncertainties that could cause actual results to differ materially, including, but not limited to, the possibility that the demand for the Company's services may decline as a result of possible changes in general and industry specific economic conditions and the effects of competitive services and pricing; the possibility that the Company will not be able to perform work within budget or contractual limitations; one or more current or future claims made against the Company may result in substantial liabilities; the possibility that the Company will not be able to attract and retain key professional employees; failure to recover at-risk contract costs; changes to or failure of the Federal, State, or local governments to fund certain programs in which the Company participates; changes in customer procurement policies and practices; delays in project funding; effects of U.S Government conflict of interest policies; loss of anticipated new contract vehicles either due to funding changes or competitive factors, and such other risks and uncertainties set forth in this report and in other reports and other documents filed by the Company from time to time with the Securities and Exchange Commission.
Business Overview
Versar, Inc. is a Delaware corporation incorporated in 1969. We are a global project management company providing sustainable value oriented solutions to government and commercial clients. We also provide tailored and secure engineering solutions in extreme environments and offer specialized abilities in staff augmentation, performance based remediation, and hazardous material management.
Fiscal year 2014 proved to be a challenging year for Versar. Although we saw an increase in revenue and successfully completed the acquisition and integration of Geo-Marine, Inc. (“GMI”) we experienced a decline in net income compared to fiscal year 2013. GMI was a strategic acquisition for Versar as its design, construction, and environmental expertise and customer base will allow the Company to expand its reach in terms of clients, technical capabilities, and geography in the near term. In addition, our balance sheet remains strong and is a reflection of our ability to continue to improve liquidity and manage working capital. Ongoing macro-economic issues, such as delays in finalizing the federal budget during calendar year 2013, resulted in slower and fewer contract awards across the federal government. However, this has caused an increased focus by our customers on the value of services provided. Both the commercial and government sectors are adjusting their needs to the new economic environment of constrained budgets and staffing and as a result are demanding greater productivity and value-oriented solutions from service providers.
Selling into this new economic environment has required increased emphasis on managing customer risk, whether that risk is related to construction oversight, as is the case with our work in Afghanistan and Iraq, or sustainability risk, as is the case with our commercial and U.S.-based government work. This economic environment has also driven significant investment in business development activities designed to provide customized responses to a customer’s value solution and sustainability needs. We have invested in new technologies to streamline processes and increase productivity and have realized economic and performance benefits from continued cost reduction efforts directed at our fixed and controllable expenses.
As a service-based company, our revenue is primarily derived through the provision of labor-based services, rather than capital-intensive product offerings. Our revenue opportunities are driven by our ability to retain existing clients as well as attract new ones, providing quality and responsive value-oriented project management at competitive rates, and identifying and retaining a qualified team of employees.
| 2 |
Business Segments
The company is aligned into three reportable segments: Engineering and Construction Management, Environmental Services, and Professional Services, all of which are described below.
Engineering and Construction Management (“ECM”)
This business segment performs Title I Design Services, Title II Construction Management Services, and Title III Construction Services, all of which are discussed further in the initial bullet below. This business segment also provides other related engineering and construction type services both in the United States and internationally. It provides national security solutions in several markets that have received funding priority and require ongoing services and support. Our services in this segment include the following:
| · | Title I Design Services entails a broad-range of expertise including master planning; land use planning; space utilization studies; requirements definition and scoping; programming; cost estimates; infrastructure and traffic planning; privatization studies, and other feasibility studies. Title II Construction Management Services involve construction oversight, inspection, job site evaluations, and construction documentation among other areas. Other related services include system optimization and commissioning, scheduling, and quality assurance/control. Title III Construction Services are actual construction services. Certain staff members in this business segment hold security clearances enabling Versar to provide services for classified construction efforts. |
| · | This segment consists of federal, state, local, international, and commercial clients. Examples of federal work include construction and construction management services for the U.S. Air Force (“USAF”) and U.S. Army, construction management and personal services including engineering, construction inspection, operations and maintenance and administrative support to the U.S. Army Corps of Engineers (“USACE”) and project and construction management services for the District of Columbia Courts and commercial customers. |
| · | Through ECM we continue to pursue the development of opportunities in energy/green initiatives in conjunction with the Environmental Services business segment. Our acquisition of GMI has expanded our capacity to provide energy related services. |
| Environmental Services (“ESG”) |
This business segment provides full service environmental solutions and includes our remediation and compliance, exposure and risk assessment, natural resources, unexploded ordnance (“UXO”)/military munitions response program (“MMRP”), air, greenhouse gas, energy, and cultural resources services. Clients include a wide-range of federal, state, and commercial agencies. Some examples include the following:
| · | We provide support to USACE, USAF, the U.S. Navy, and many local municipal entities assisting with environmental compliance, remediation, biological assessments, and natural resource management. This work includes performance-based remediation (“PBR”) contracts for United States Air Force Civil Engineer Center (“AFCEC”). |
| · | For more than 30 years, Versar has supported the states of Virginia, Maryland, New York, Pennsylvania and Delaware on a variety of different environmental projects. For example, we have supported the State of Maryland in the assessment of the ecological health and natural resources risk of the Chesapeake Bay. Versar continues to assess how the Delaware River is affected by dredging programs. We assist several counties in Maryland and Virginia with their watershed programs, identifying impaired watersheds and providing cost-effective solutions for their restoration programs. We provide energy feasibility review, measurement and verification to the State of New York. |
| · | ESG provides munitions response services at two of the world’s largest ranges including the National Training Center at Fort Irwin, California and one of the largest U.S. Air Force testing and training ranges. Our services include operational range clearance, operations and maintenance, and range sustainment services at both locations. |
| 3 |
| · | ESG is the prime contractor on three PBR Task Orders under Versar’s 2009 United States Air Force Worldwide Environmental Restoration and Construction (“WERC”) contract for AFCEC. Each of the three contracts provide multi-year environmental remediation programs focused on achieving site-specific performance objectives (outcomes) for numerous project sites on USAF facilities in the Southwest, Midwest and Northeast. We are also a key team member on a fourth PBR program for AFCEC providing similar services at Western USAF facilities. With the acquisition of GMI, this business segment has expanded its portfolio of clients to include the U.S. Navy and increased our Cultural Resources staff by more than five times and doubled our Natural Resources capabilities. |
| · | We have supported the U.S. Environmental Protection Agency for the past 30 years providing a wide-range of regulatory mandated services involving exposure assessment and regulatory review. |
Professional Services (“PSG”)
This business segment provides onsite environmental management, planning and engineering services to the U.S Department of Defense (“DoD”) and to the U.S. Department of Commerce. Versar’s provision of on-site services, or staff augmentation, serves to enhance the mission of the customer with subject matter experts fully dedicated to mission objectives. This segment serves government business by realigning two or more facilities management functions to establish a single entity and by supporting customers in areas where their capabilities and capacities are lacking.
| · | We provide expert services for the U.S. Army’s Net Zero energy, water, and solid waste program for certain U.S. Army installations. Net Zero energy means the installation produces as much energy/water/solid waste onsite as it uses. Our professionals facilitate strategic initiatives, develop implementation plans, conduct outreach, and apply technologies to deliver progress towards site-specific goals and objectives. |
| · | We have fielded installation restoration managers under the Defense Environmental Restoration Program to clean-up landfill and disposal sites throughout the nation. |
| · | Versar serves the DoD Joint Base communities with facility and utilities integration, National Environmental Policy Act considerations, water program management and wildlife program management. |
| · | We manage hazardous materials and waste for large quantity generator sites through application of green procurement philosophies and hazardous material control program concepts. |
| · | We provide staff augmentation ranging from field support of archaeological investigations to senior level advisors. Our archaeological and historic preservation professionals advise government officials regarding the protection of our nation’s cultural resources. |
| · | We provide biological and physical sciences support to the National Oceanic Atmospheric Administration to ensure efficiencies and accuracies in the lab environment. |
Revenue Earned by Geographic Location
Our consolidated gross revenue from continuing operations for fiscal year 2014 was $110.3 million, of which approximately $107.6 million was funded with U.S. currency and approximately $2.7 million of the remainder was derived from our subsidiary in the United Kingdom, Professional Protection Systems, Ltd. (“PPS”), and funded in pounds sterling. Approximately 30% of our fiscal year 2014 business was conducted in international locations.
Our consolidated gross revenue from continuing operations for fiscal year 2013 was $102.6 million, of which approximately $100.0 million was funded with U.S. currency and approximately $2.6 million of the remainder was derived from our PPS subsidiary in the United Kingdom and funded in pounds sterling. Approximately 39% of our fiscal year 2013 business was conducted in international locations.
Our Strategy
For several years, we have noted that ongoing macro issues have resulted in slower and fewer contract awards across the federal government. However, our increased focus and investment in business development and talent acquisition has allowed Versar to significantly increase both new orders and backlog. We continue to strongly believe that the Company’s capabilities and strengths align well with the future needs and demands of our clients. The federal government continues to fund areas that clearly align with Versar’s program management services – environmental remediation, sustainable firing range utilization/management, ongoing investments in military base efficiencies and renovation, and continued embracing of energy and environmental sustainability at US facilities around the world. The same is true at the state and local levels, where we are seeing increased levels of expenditure on infrastructure and environmental remediation. Internationally and commercially, we also see very strong alignment with our capabilities – increased awareness of the environment in lesser developed countries, renewed domestic construction and its associated project issues, increased natural resource extraction infrastructure demands in hazardous regions, as well as the United States’ continued presence in Afghanistan and other parts of the Middle East and South East Asia.
| 4 |
Specifically, the following four elements are driving our strategy:
| · | Pursuit of larger contract opportunities. Our move to large-business status, coincident with development of a stronger internal infrastructure and associated technologies, allows us to focus on pursuing larger prime contract opportunities. Strategic partnering, joint-ventures, and long-lead positioning coupled with Versar branding has the potential to provide increased growth and services. |
| · | Leveraging of our services. This will allow us to work efficiently in the new economic environment, whether through selling sustainable risk management services, utilizing our energy and environmental skill-sets or via effective use of our project and construction management skills in relation to complex project oversight. Expansion of our existing core capabilities in a broader and more comprehensive manner provides us with the understanding and insight necessary to reduce client risk. |
| · | Expanding our international footprint. While we are strong internationally specifically in the construction management business, incorporation of our construction and non-construction services into our overseas offerings should enable the transition of our proven domestic skills into the international market and will help us meet growing overseas client needs. |
| · | Geographic and client expansion through acquisition. We have an active acquisition strategy which is focused on expanding our ability to offer our technical services to both new geographic areas and new clients, such as the U.S. Navy and the U.S. Department of State. |
Competition
We face substantial competition in each line of business in which we operate as these areas become more crowded and price sensitive. Our competitors are often larger and have greater financial resources, requiring Versar to be selective in our marketing and sales efforts and more adept in developing strategic partnerships to enhance our competitive advantage. We also believe that our present size and diversified service offerings relative to the smaller, niche companies with which we also compete provide us with a competitive advantage.
Our business segments, consisting of ECM, ESG, and PSG, reflect a mix of business that we continue to believe will provide stability, while continuing to represent our core capabilities. Additionally, the combination of our core capabilities is an important selling feature as customers look for one source to meet their needs. We believe that we are competitive among the firms that combine environmental health and safety/risk assessment and engineering design and construction capability in one package because we have established relationships with a broad spectrum of teaming partners. Our acquisition of GMI and their technical capabilities has expanded our ability to deliver targeted capabilities in a full range of situations and we believe our recent contract wins demonstrate marketplace recognition of our unique portfolio of solutions. We are actively pursuing customers that require these combined services as we leverage our capabilities into the changing economic environment.
We continue to adjust our pricing structure to ensure that we remain competitive across all business segments, while remaining conscious of the need to drive overall corporate profitability. Similarly, we are concentrating our marketing efforts on maximizing our return on investment through expanding support for existing customers, developing tasks under existing contracts, and collaborating with firms that need our specialized expertise.
| 5 |
Backlog
We report “funded” backlog, which represents orders for goods and services for which we have received firm contractual commitments. Based on past experience, the Company believes that approximately 90% of funded backlog will be performed in the succeeding twelve-month period. However, no assurance can be given that we will ultimately realize our full backlog. Additionally, other companies with similar types of contracts to ours may not calculate backlog in the same manner we do, because their calculations are based on different subjective factors or because they use a different methodology. Therefore, information presented by us regarding funded backlog may not necessarily be comparable to similar presentations by others.
As of June 27, 2014, funded backlog was approximately $114 million, an increase of approximately 5% compared to approximately $108 million of funded backlog at the end of the fiscal year 2013. This increase reflects the award of several large long-term contracts and backlog contributed by GMI, and is indicative of the high quality proposals that were developed as a result of proposal preparation staff training and business development investments over the past several years.
Our proposal pipeline is strong with multiple large long-term contract proposals awaiting award results that hold the possibility for further increasing our backlog. We believe we will be able to further increase our backlog as a result of our continued strong proposal efforts and pipeline.
Employees
At June 27, 2014, we had approximately 450 full-time employees, of which seventy-five percent are engineers, scientists, and other professionals. 71% of our professional employees have a bachelor’s degree, 33% have a master’s degree, and 3% have a doctorate degree.
Item 1A. Risk Factors
Our line of credit contains, and our future debt agreements may contain, covenants that may restrict our ability to engage in activities that may be in our long-term best interest, including financing future operations or capital needs or engaging in other business activities, and that require us to maintain specific financial ratios or levels.
Our line of credit restricts, among other things, our ability and the ability of our subsidiaries to:
| · | incur additional debt; |
| · | pay dividends or distributions on our capital stock; |
| · | purchase, redeem or retire capital stock; |
| · | make acquisitions and investments; |
| · | create liens on our assets; |
| · | enter into certain transactions with affiliates; |
| · | merge or consolidate with another company; or |
| · | transfer or sell assets outside the ordinary course of business. |
In addition, our line of credit requires that we maintain compliance with certain financial ratios and levels, such as a minimum tangible net worth and a minimum current ratio. It is possible that these covenants may adversely impact our ability to finance our future operations or capital needs to pursue available business opportunities. Additionally, a failure to comply with any of these covenants could lead to a default under our line of credit which could result in an acceleration of indebtedness and prevent us from having access to the line of credit for future borrowings to fund our cash and working capital needs.
| 6 |
We are dependent on government contracts for the majority of our revenue, and a reduction or delay in spending by government agencies could adversely affect our business and operating results.
Contracts with agencies of the United States government and various state and local governments represented approximately 95% of our revenue in fiscal year 2014, with 5% of our revenue coming from commercial sources. Therefore, the majority of our revenue and the success of our business are materially dependent on contracts with governmental agencies. Companies engaged in government contracting are subject to certain unique business risks not shared by the general commercial sector. Among these risks are:
| · | a competitive procurement process with no firm schedule or guarantee of contracts being awarded; |
| · | competitive pricing pressure that may require reductions in costs in order to realize revenue under contracts; |
| · | award of work to competitors and not to us due to policy reasons; |
| · | dependence on congressional and state appropriations and administrative allotment of funds; |
| · | policies and regulations that can be changed at any time by governing bodies; |
| · | competing political priorities and changes in the political climate regarding funding and operations of the services; |
| · | shifts in buying practices and policy changes regarding the use of private contractors; |
| · | changes in and delays or cancellations of government programs or requirements; |
| · | government contracts that are usually awarded for relatively short periods of time and are subject to renewal options in favor of the government; and |
| · | many contracts with U.S. government agencies require annual funding and may be terminated at the agency’s discretion. |
The U.S. government contracting laws provide that the U.S. government can do business only with responsible contractors. Accordingly, U.S. government agencies have the authority under certain circumstances to suspend or debar a contractor from bidding on government contracts.
A reduction or shift in spending priorities by U.S. government agencies could limit or eliminate the continued funding of our existing government contracts or awards of new contracts or new task orders under existing contracts. These reductions or shifts in spending, if significant, could have a material adverse effect on our business.
Continued inability of the legislative and executive branches of the federal government to agree on a budget for key agencies or to enact appropriations in a timely manner has in past years delayed, and may in the future delay, the award of contracts. These delays, if significant, could have a material adverse effect on our operating results.
Our government contracts are subject to audit and potential reduction of costs and fees.
Contracts with the U.S. government and many other state and local governmental agencies are subject to audit by governmental agencies, which could result in the disallowance of certain costs and expenses. These audits can result in the disallowance of significant costs and expenses if the auditing agency determines, in its discretion, that certain costs and expenses were not warranted, allowable, or were excessive. Disallowance of costs and expenses, if pervasive or significant, could have a material adverse effect on our business.
As a government contractor, we are subject to a number of procurement laws and regulations; a violation of any such law or regulation could result in sanctions, contract termination, forfeiture of profit, harm to our reputation or loss of our status as an eligible government contractor.
We must comply with, and are affected by, federal, state and local laws and regulations regarding the formation, administration and performance of government contracts. These laws and regulations affect how we transact business with our government clients and, in some instances, impose additional costs on our business operations. Even though we take precautions to prevent and deter fraud, misconduct and non-compliance, we face the risk that our personnel or outside partners may engage in misconduct, fraud or improper activities. Government contract violations could result in the imposition of civil and criminal penalties or sanctions, contract termination, forfeiture of profit and/or suspension of payment, any of which could make us lose our status as an eligible government contractor and could cause our reputation to suffer serious harm. Loss of our status as an eligible government contractor would have a material adverse effect on our operations and financial condition.
| 7 |
Actual or perceived conflicts of interest may prevent us from being able to bid on or perform contracts.
U.S. government agencies have conflict of interest policies that may prevent us from bidding on or performing certain contracts. When dealing with U.S. government agencies that have such policies, we must decide, at times with insufficient information, whether to participate in the procurement process in light of the fact that such performance could preclude us from participating in a related procurement. We have, on occasion, declined to bid on particular projects because of actual or perceived conflicts of interest. We are likely to continue encountering such conflicts of interest in the future. Future conflicts of interest could cause us to be unable to secure key contracts with U.S. government customers.
Robust enforcement of environmental regulations is important to our financial success.
Our business is materially dependent on the continued enforcement by local, state and federal governments of various environmental regulations. From time to time, depending on political pressures, local, state and federal agencies relax environmental clean-up standards to promote economic growth and to discourage industrial businesses from relocating. Any relaxation in environmental and compliance standards could impact our ability to secure additional contracting work with such agencies or with other federal agencies that operate or manage contaminated property. Further, in a period of relaxed environmental standards, private industry may be less willing to allocate funds to consulting services designed to prevent or remediate environmental problems.
Many of our U.S. government customers procure goods and services through indefinite delivery / indefinite quantity (“ID/IQ”), government wide acquisition contract (“GWAC”) or GSA Schedule contracts under which we must compete for post-award orders.
Budgetary pressures and reforms in the procurement process have caused many U.S. government customers to purchase goods and services through ID/IQ, GSA Schedule contracts and other multiple award and/or GWAC contract vehicles. These contract vehicles increase competition and pricing pressure requiring us to make sustained efforts following the initial contract award to obtain ongoing awards and realize revenue. There can be no assurance that we will increase revenue or otherwise sell successfully under these contract vehicles. Our failure to compete effectively in this procurement environment could harm our business, financial condition, operating results and cash flows and our ability to meet our financial obligations.
If we fail to recover at-risk contract costs, we may have reduced fees or losses.
We are at risk for any costs we incur before a contract is executed, modified or renewed. A customer may choose not to pay us for these costs. While such costs are typically associated with specific anticipated contracts and funding modifications, we cannot be certain that our customers will execute these contracts or contract renewals or that they will pay us for all our related at-risk costs. If unrecovered at-risk costs are significant, we may experience a decline in contract margins or experience losses on certain contracts or in certain periods, resulting in reduced profitability.
We could face potential liability for failure to properly design remediation.
A part of our business involves the design and implementation of remediation at environmental clean-up sites. If we fail to properly design and build a remediation system or if someone claims that we did, we could face expensive litigation and potential settlement costs. If we failed to successfully defend against such a lawsuit, it could have a materially adverse effect on our business.
Environmental laws and regulations and our use of hazardous materials may subject us to significant liabilities.
Our operations are subject to U.S. federal, state and local environmental laws and regulations, as well as environmental laws and regulations in the various countries in which we operate. We are also subject to environmental laws and regulations relating to the discharge, storage, treatment, handling, disposal and remediation of regulated substances and waste products, such as radioactive, biochemical or other hazardous materials and explosives. We may incur substantial costs in the future because of: modifications to current laws and regulations; new laws and regulations; new guidance or new interpretation of existing laws or regulations; violations of environmental laws or required operating permits; or discovery of previously unknown contamination.
| 8 |
Our failure to properly manage projects may result in additional costs or claims.
Our engagements regularly involve complex and lengthy projects. The quality of our performance on such projects depends in large part upon our ability to manage the relationship with our clients, and to effectively manage the projects and deploy appropriate resources in a timely manner. If we miscalculate the resources or time required to complete a project with capped or fixed fees our operating results could be adversely affected. Further, any defects or errors, or failures to meet our client’s expectations, could result in claims for damages against us.
Our services expose us to significant risks of liability and it may be difficult to obtain or maintain adequate insurance coverage.
Our services involve significant risks of professional and other liabilities that may exceed the fees we derive from performance. Our business activities could expose us to potential liability under various laws and regulations and under workplace health and safety regulations. In addition, we sometimes may assume liability by contract under indemnification agreements. We are not able to predict the magnitude of any such liabilities.
We obtain insurance from third parties to cover our potential risks and liabilities. However, it is possible that we may not be able to obtain adequate insurance to meet our needs, may have to pay an excessive amount for the insurance coverage we want, or may not be able to acquire any insurance for certain types of business risks.
We are exposed to risks associated with operating internationally.
A large and increasing portion of our business is conducted internationally. Consequently, we are subject to a variety of risks that are specific to international operations, including the following:
| · | export regulations that could erode profit margins or restrict exports; |
| · | compliance with the U.S. Foreign Corrupt Practices Act; |
| · | compliance with the U.K Bribery Act; |
| · | the burden and cost of compliance with foreign laws, treaties and technical standards and changes in those regulations; |
| · | contract award and funding delays; |
| · | potential restrictions on transfers of funds; |
| · | foreign currency fluctuations; |
| · | import and export duties and value added taxes; |
| · | transportation delays and interruptions; |
| · | uncertainties arising from foreign local business practices and cultural considerations; and |
| · | potential military conflicts, civil strife and political risks. |
While we have and will continue to adopt measures to reduce the potential impact of losses resulting from the risks of our foreign business, we cannot ensure that such measures will be adequate.
Political destabilization or insurgency in the regions in which we operate may have a material adverse effect on our operating performance.
Certain regions in which we operate are highly politically unstable. Insurgent activities in the areas in which we operate may cause further destabilization in these regions. There can be no assurance that the regions in which we operate will continue to be stable enough to allow us to operate profitably or at all. During fiscal years 2014, 2013, and 2012, revenue generated from our operations in international locations, which included our reconstruction work in Iraq and Afghanistan, contributed 33%, 39%, and 36% of our revenue, respectively. We have been required to increase compensation to our personnel as an incentive to deploy them to many of these regions. To date, we have been able to recover this added cost under our contracts, but we may not be able to secure increases in contract payments to continue to recover all such costs in the future. To the extent that we are unable to transfer such increased compensation costs to our customers, our operating margins would be adversely impacted, which could adversely affect our operating performance. In addition, increased insurgent activities or destabilization, including civil unrest or a civil war in Iraq or Afghanistan, may lead to a determination by the U.S. government to halt our operations in a particular location, country or region and to perform the services we provide using military personnel.
| 9 |
Shifts in governmental priorities could potentially impact our contracts in certain regions.
In extreme circumstances, the U.S. government may decide to terminate all U.S. government activities, including our operations under U.S. government contracts in a particular location, country or region and to withdraw all military personnel. Any of the foregoing could severely affect our operating performance and may result in additional costs and expenses and loss of revenue.
If our partners fail to perform their contractual obligations on a project, we could be exposed to legal liability, loss of reputation or reduced profits.
From time to time, we enter joint venture agreements and other contractual arrangements with partners to jointly bid on and execute a particular project. The success of these joint projects depends in part on the satisfactory performance of the contractual obligations by our partners. If any of our partners fail to satisfactorily perform their contractual obligations, we may be required to make additional investments and provide additional services to complete projects, increasing our cost on those projects. If we are unable to adequately address a partner’s performance issues, then our client could terminate the joint project, exposing us to legal liability, loss of reputation or reduced profits.
We operate in highly competitive industries.
The markets for many of our services are highly competitive. There are numerous professional architectural, engineering, construction management, and environmental consulting firms, and other organizations that offer many of the same services offered by us. We compete with many companies that have greater resources than us and we cannot provide assurance that such competitors will not substantially increase the resources devoted to their business in a manner competitive with the services provided by us. Competitive factors include reputation, performance, price, geographic location and availability of technically skilled personnel. In addition, we face competition from the use by our clients of in-house environmental, engineering and other staff.
Our growth strategy includes acquisitions of other businesses, which may require us to incur costs and liabilities or have other unexpected consequences which may adversely affect our operating results and financial condition.
In addition to internal or organic growth, our current strategy involves growth through acquisitions of complementary businesses, as well as growth from acquisitions that would diversify our current service offerings. Like other companies with similar growth strategies, we may be unable to successfully implement our growth strategy, as we may not be able to identify suitable acquisition candidates, obtain acceptable financing, or consummate any future acquisitions. We frequently engage in evaluations of potential acquisitions and negotiations for possible acquisitions, certain of which, if consummated, could be significant to us. Although it is our general objective only to acquire those companies which will be accretive to both earnings and cash flow, any potential acquisitions may result in material transaction expenses, increased interest and amortization expense, increased depreciation expense and increased operating expense, any of which could have a material adverse effect on our operating results. Acquisitions may entail integration and management of the acquired businesses to realize economies of scale and control costs. In addition, acquisitions may involve other risks, including diversion of management resources otherwise available for ongoing development of our business and risks associated with entering new markets. Future acquisitions may also result in potentially dilutive issuances of securities. As a result of the consummation of acquisitions of other businesses, we may be subject to the risk of unanticipated business uncertainties or legal liabilities relating to those acquired businesses for which the sellers of the acquired businesses may not indemnify us. We may not realize the full anticipated benefit of any acquired business that has operated as a small business (as determined by the Small Business Administration based upon the North American Industry Classification Systems) if following their acquisition by us certain of their contracts are revoked or not renewed because they fail to continue to maintain small business status.
| 10 |
An economic downturn may have a material adverse effect on our business.
In an economic recession, or under other adverse economic conditions that may arise from natural or man-made events, customers and vendors may be less likely to meet contractual terms and payment or delivery obligations. In particular, if the U.S. government changes its operational priorities in Iraq and/or Afghanistan, reduces the DOD Operations and Maintenance budget, or reduces funding for Department of State initiatives in which we participate, our business, financial condition and results of operations could be severely affected.
Our quarterly and annual revenue, expenses and operating results may fluctuate significantly, which could have a negative effect on the price of our common stock.
Our quarterly and annual revenues, expenses and operating results have and may continue to fluctuate significantly because of a number of factors, including:
| • | the seasonality of the spending cycle of our public sector clients, notably the U.S. government, and the spending patterns of our private sector clients; |
| • | the hiring and utilization rates of employees in the United States and internationally; |
| • | the number and significance of client engagements commenced and completed during the period; |
| • | the delays incurred in connection with an engagement because of weather or other factors; |
| • | the ability to work within foreign countries’ regulations, tax requirements and obligations; |
| • | the business, financial, and security risks related to working in foreign countries; |
| • | the ability of clients to terminate engagements without penalties; |
| • | the creditworthiness and solvency of clients; |
| • | the size and scope of engagements; |
| • | the delay in federal, state and local government procurements; |
| • | the ability to perform contracts within budget or contractual limitations; |
| • | the timing of expenses incurred for corporate initiatives; |
| • | any threatened or pending litigation matters; |
| • | periodic reductions in the prices of services offered by our competitors; |
| • | the likelihood of winning the re-bids of our existing large government contracts; |
| • | the general economic and political conditions; |
| • | the loss of a major contract or the shutdown of a major program; |
| • | the volatility of currencies in foreign countries; and |
| • | the integration of any acquisition or the ability of an acquired business to continue to perform as in the past. |
Variations in any of these factors could cause significant fluctuations in our operating results from quarter to quarter and could result in net losses and have a material adverse effect on our stock price.
We are highly dependent on key personnel and our business could suffer if we fail to continue to attract, train and retain skilled employees.
Our business is managed by a number of key management and operating professional personnel. The loss of key personnel could have a material adverse effect on the Company.
Availability of highly trained and skilled professional, administrative and technical personnel is critical to our future growth and profitability. Even in the current economic climate, competition in our industry for scientists, engineers, technicians, management and professional personnel is intense and competitors aggressively recruit key employees. Competition for experienced personnel, particularly in highly specialized areas, has occasionally made it more difficult for us to timely meet all our staffing needs. We cannot be certain we will be able to continue to attract and retain required staff. Any failure to do so could have a material adverse effect on our business, financial condition, operating results and our ability to meet our financial obligations. Failure to recruit and retain a sufficient number of these employees could adversely affect our ability to maintain or grow our business. Some of our contracts require us to staff a program with personnel the customer considers key to successful performance. If we cannot provide these key personnel or acceptable substitutes, the customer may terminate the contract, and we may not be able to recover our costs.
| 11 |
In order to succeed, we will have to keep up with a variety of rapidly changing technologies. Various factors could affect our ability to keep pace with these changes.
Our success will depend on our ability to keep pace with changing technologies which can occur rapidly in our core business segments. We may incur significant expense in order to update our technologies, which could have a material adverse effect on our margins and results of operations. Even if we keep up with the latest developments and available technology, newer services or technologies could negatively affect our business.
Our employees may engage in misconduct or other improper activities, which could harm our business.
Like all companies, we are exposed to the risk of employee fraud or other misconduct. Employee misconduct could include intentional failures to comply with U.S. government procurement regulations, unauthorized activities, attempts to obtain reimbursement for improper expenses, or submission of falsified time records. Employee misconduct could also involve improper use of our customers’ sensitive or classified information, which could result in regulatory sanctions against us. Negative press reports regarding employee misconduct could harm our reputation with the government agencies with which we work. If our reputation with these agencies is negatively affected, or if we are suspended or debarred from contracting with government agencies for any reason, our future revenues and growth prospects would be adversely affected. It is not always possible to deter employee misconduct, and the precautions we take to prevent and detect this activity may not be effective in controlling unknown or unmanaged risks or losses, which could harm our business, financial condition, operating results and our ability to meet our financial obligations.
Internal system or service failures could disrupt our business and impair our ability to effectively provide our services and products to our customers, which could damage our reputation and adversely affect our revenue, profitability and operating results.
Our information technology systems are subject to systems failures, including network, software or hardware failures, whether caused by us, third-party service providers, intruders or hackers, computer viruses, natural disasters, power shortages or terrorist attacks. Any such failures could cause loss of data and interruptions or delays in our business, cause us to incur remediation costs, subject us to claims and damage our reputation. Failure or disruption of our communications or utilities could cause us to interrupt or suspend our operations or otherwise adversely affect our business. Any system or service disruptions if not anticipated and appropriately mitigated could have a material adverse effect on our business including, among other things, an adverse effect on our ability to bill our customers for work performed on our contracts, collect the amounts that have been billed and produce accurate financial statements in a timely manner. Our property and business interruption insurance may be inadequate to compensate us for all losses that may occur as a result of any system or operational failure or disruption and, as a result, our results of operations could be materially and adversely affected. Versar is investing in systems that will allow it to achieve and remain in compliance with the regulations governing its business; however, there can be no assurance that such systems will be effective at achieving and maintaining compliance or that we will not incur additional costs in order to make such systems effective.
Item 2. Properties
Our corporate executive office is located in Springfield, Virginia, which is a suburb of Washington, D.C. Versar currently leases 40,507 square feet from Springfield Realty Investors, LLC. The rent is subject to two percent escalation per year through December 31, 2021.
As of June 27, 2014, we had under lease an aggregate of approximately 175,000 square feet of office and manufacturing space in the following locations (parenthetical reference of business segments using space): Dulles (ECM), Springfield (all segments), Hampton (ESG) and Virginia Beach (PSG), VA; Chandler, AZ (ESG); Sacramento, CA (ESG); Westminster, CO (all segments); Aiea, HI (ECM); Louisville, KY (ESG); Columbia (ESG), and Germantown, MD (ESG); Charleston, SC (ESG); Knoxville, TN (ECM), Plano. San Antonio (ESG) and El Paso, TX (ESG); Clark Air Force Base (ECM), Makati City (ECM), the Republic of Philippines; Milton Keynes, U.K. (ECM and ESG); and Abu Dhabi (ECM and ESG), United Arab Emirates. The lease terms primarily range from two to six years.
| 12 |
Item 3. Legal Proceedings
Versar and its subsidiaries are parties from time to time to various legal actions arising in the normal course of business. We believe that any ultimate unfavorable resolution of any current ongoing legal actions will not have a material adverse effect on its consolidated financial condition and results of operations.
EXECUTIVE OFFICERS OF THE REGISTRANT
The current executive officers of Versar, their ages as of August 29, 2014, their current offices or positions and their business experience for at least the past five years are set forth below.
| NAME | AGE | POSITION(S) WITH THE COMPANY | ||
| Anthony L. Otten | 58 | Chief Executive Officer | ||
| Jeffrey A. Wagonhurst | 66 | President and Chief Operating Officer | ||
| Cynthia A. Downes | 53 | Executive Vice President, Chief Financial Officer, Treasurer and Principal Accounting Officer | ||
| James D. Villa | 51 | Senior Vice President, General Counsel, Secretary and Corporate Compliance Officer | ||
| Linda McKnight | 65 | Senior Vice President of Business Development | ||
| Jeffrey M. Moran | 51 | Senior Vice President, Environmental Services Group | ||
| Rob Biedermann | 53 | Senior Vice President of Engineering and Construction Management | ||
| Wendell Newton | 56 | Senior Vice President of Professional Services |
Anthony L. Otten, BS, MPP, joined Versar as Chief Executive Officer (“CEO”) in February of 2010. Prior to becoming CEO, he had served on Versar's Board of Directors for two years as an independent board member. Mr. Otten served as Managing Member of Stillwater, LLC from July 2009 to February 2011, as an Operating Partner of New Stream Asset Funding, LLC from 2007 to June 2009 and Managing Member of Stillwater, LLC from 2004 to 2007. Mr. Otten has a Bachelor of Science degree from the Massachusetts Institute of Technology and a Masters in Public Policy from Harvard’s Kennedy School of Government.
Jeffrey A. Wagonhurst, MBC, MBA, joined Versar in February 1999 as an Army Program Manager. In 2001, he was elected Vice President of Human Resources and Facilities. In September 2006, he was elected Senior Vice President to lead our former Program Management business unit (now ECM). In May 2009, Mr. Wagonhurst was promoted to Executive Vice President, Program Management Group. In February 2010, Mr. Wagonhurst was promoted to President and Chief Operating Officer of Versar. Mr. Wagonhurst concluded his 30 year career with the U.S. Army and retired in May 1997 as a Colonel. He commanded a Combat Engineer Brigade and Battalion during his service as well as previously serving as a Deputy District Commander of the Mobile District, U.S. Army Corps of Engineers.
Cynthia A. Downes, BS, MBA, CPA, joined Versar in April 2011 as Executive Vice President, Chief Financial Officer, Treasurer, and Principal Accounting Officer. From April 2009 to April 2011 Ms. Downes was Vice President and Chief Financial Officer of Environmental Design International, an engineering firm, based in Chicago, specializing in environmental and civil engineering. From January 2007 to April 2009, she was Vice President of Finance of GDI Advanced Protection Solutions and from 2005 to 2007, she was a consultant at Huron Consulting Group, Inc. Ms. Downes also spent 15 years at Tetra Tech, ultimately serving as Vice-President and Chief Financial Officer of Tetra Tech, EM Inc.
| 13 |
James D. Villa, B.A. J.D., joined Versar in March 2014 as Senior Vice President, General Counsel, Secretary, and Corporate Compliance Officer. From 2011 to 2014, he served as Vice President and General Counsel of Colonial Parking, Inc. From 2006 to 2010, he served as Vice President and Chief Counsel of AOL, Inc., where he had responsibility for litigation and regulatory matters. Prior to joining AOL, Mr. Villa was a Trial Attorney in the Antitrust Division of the United States Department of Justice and also served as a Special Assistant United States Attorney in the Eastern District of Virginia. Mr. Villa was in private practice with several different law firms in Washington, D.C. prior to joining the Department of Justice. Mr. Villa served as a Captain in the United States Army Reserve and served in Saudi Arabia and Kuwait in support of Operations Desert Shield and Desert Storm. He has a Bachelor of Arts degree from the University of Michigan and a Juris Doctor degree from the University of Michigan Law School.
Linda M. McKnight, AA, joined Versar in April 2013 as Director of Business Development. In May of 2013, she was elected as Senior Vice President in charge of business development and strategy. Ms. McKnight has more than 29 years' of experience in sales and marketing for environmental, engineering, construction, and logistics services in both domestic and international markets. She has held senior management sales positions with Tetra Tech and Kellogg Brown & Root (KBR) over the past 24 years. From 2010 to 2013, she provided business development consulting to firms focused on enhancing internal sales processes to grow environmental and engineering services to federal clients. Ms. McKnight is a Fellow and active member in the Society of American Military Engineers and serves on the Board of the Society's Academy of Fellows. She is the Immediate Past President of Women in Defense, Capital Chapter.
Jeffrey M. Moran, BS, PE, joined Versar in May 2009 as a Senior Vice President for Versar’s Environmental Services Group (previously Compliance and Environmental Programs business segment). Mr. Moran brings more than 25 years of experience to Versar that includes management and technical positions as an engineering consultant. He is a Civil Engineer registered in the states of Maryland and Virginia and the District of Columbia. Mr. Moran is also active in the Society of American Military Engineers where he has held various executive posts with the Northern Virginia Chapter and the Mid-Atlantic Region. He also completed a management program at Harvard Business School in 2012.
Rob A. Biedermann, BS, MS, joined Versar in May of 2010 serving as the Afghanistan In-Country Program Manager. In July 2011, he was assigned as the Program Manager for Versar’s Tooele Chemical Demilitarization Project completing the project and demobilization in June 2012. In July 2012, Mr. Biedermann was appointed Vice President and assumed responsibility for Domestic Operations of the Engineering and Construction Management Group. Mr. Biedermann was elected to Senior Vice President in August 2013. He served in the US Army for 12 years departing in 1997 as a Corps of Engineers Major having served in Operations Desert Shield and Storm while assigned to the 249th Engineer Combat Battalion (Heavy), the 101st Airborne Division (Air Assault), the 555th Combat Engineer Group and Mobile District, US Army Corps of Engineers. He served as the Construction Operations Manager and General Manager for JB Rodgers | Kinetics from June of 1997 to March of 2003 managing revenues up to $210 million. From 2003 to 2010, Mr. Biedermann served as the Chief Operating Officer and President of JB Henderson Construction, Inc. of Albuquerque, NM managing operations with revenues of up to $100 million. From October 1998 to March 2010, he was a Labor Arbitrator for the Sheet Metal and Air Conditioning Contractor’s National Association and elected as an Executive Board Member in October, 2008.
Wendell Newton, BS, joined Versar in July 2014 as Senior Vice President of the Professional Services Group. From February 1999 to July 2014, Mr. Newton was the Executive Vice President, Chief Operating Officer and one of the three shareholders of J.M. Waller Associates, Inc. Mr. Newton brings more than twenty-five years of experience in leadership and management in the areas of contracts, operations, finance, project management, human resources, and business development. During his 15 year tenure with J.M. Waller, Mr. Newton was responsible for the executive leadership of the national environmental, facilities and logistics consulting and management groups. He served as senior-level management and provided oversight of environmental and compliance projects as well as projects involving development of facility requirements, master plans, land use and infrastructure plans. He developed and executed capital resource management plans including division and group annual budgets and the management of the technical services support staff. Mr. Newton also served as Vice President for J.M. Waller's Operations Division managing the company's professional services resources world-wide and providing oversight to nearly 300 engineering, scientific, management and professional support staff who serve J. M. Waller's federal client base.
| 14 |
PART II
Item 5. Market for Registrant’s Common Equity, Related Stockholder Matters and Issuer Purchases of Equity Securities
Common Stock
Our common stock is traded on the NYSE MKT (formerly NYSE Amex) under the symbol VSR. At August 18, 2014, the Company had 889 stockholders of record, excluding stockholders whose shares were held in nominee name. The quarterly high and low sales prices as reported on the NYSE MKT during fiscal years 2014 and 2013 are presented below.
| Fiscal Year 2014 | High | Low | ||||||
| 4th Quarter | 4.08 | 3.13 | ||||||
| 3rd Quarter | 5.10 | 3.60 | ||||||
| 2nd Quarter | 5.17 | 4.08 | ||||||
| 1st Quarter | 5.65 | 4.03 | ||||||
| Fiscal Year 2013 | High | Low | ||||||
| 4th Quarter | $ | 4.64 | $ | 4.06 | ||||
| 3rd Quarter | 4.77 | 3.85 | ||||||
| 2nd Quarter | 4.24 | 3.38 | ||||||
| 1st Quarter | 3.64 | 2.95 |
No cash dividends have been paid by Versar since it began public trading of its stock in 1986. The Board of Directors intends to retain any future earnings for use in our business and does not anticipate paying cash dividends in the foreseeable future. Under the terms of our revolving line of credit, approval would be required from our primary bank for the payment of any dividends. We have established equity compensation plans to attract, motivate and reward good performance of high caliber employees, directors and service providers serving Versar and its affiliates. Currently, there are four stock option plans under which options remain outstanding, which were previously approved by the stockholders: the 2010 Stock Incentive Plan, the 2005 Stock Incentive Plan, the 2002 Stock Incentive Plan and the 1996 Stock Option Plan. We do not maintain any equity compensation plans not approved by our stockholders.
Equity Compensation Plan Information
| Plan Category | Number of Securities to be issued upon exercise of outstanding options, warrants and rights (a) | Weighted-average exercise price of outstanding options, warrants and rights (b) | Number of securities remaining available for future issuance under equity compensation plans, excluding securities reflected in column (a) (c) | |||||||||
| Equity compensation plans approved by security holders | 22,000 | $ | 4.20 | 619,115 | ||||||||
| 15 |
The graph below matches Versar, Inc.'s cumulative 5-Year total shareholder return on common stock with the cumulative total returns of (i) the S&P 500 index and (ii) a customized peer group of five companies comprised of Aecom Technology Corp., Arcadis, NV, Ecology & Environment Inc., TRC Companies Inc. and URS Corp. The graph tracks the performance of a $100 investment in our common stock, in each of the peer groups, and the index (with the reinvestment of all dividends) from 6/30/2009 to 6/30/2014.
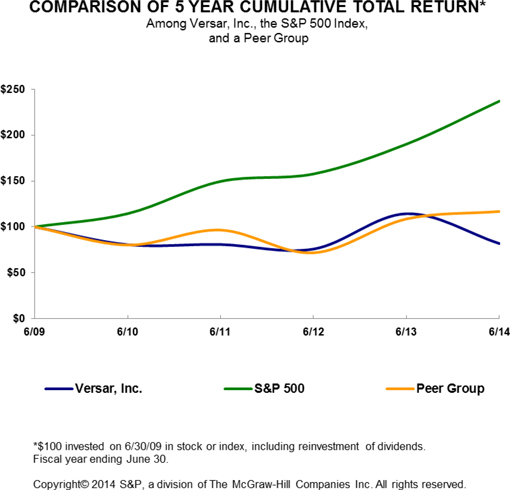
The stock price performance included in this graph is not necessarily indicative of future stock price performance.
| 16 |
Item 7. Management’s Discussion and Analysis of Financial Condition and Results of Operations
The following discussion and analysis of our financial condition and results of operations is provided to enhance the understanding of, and should be read together with, our consolidated financial statements and the notes to those statements that appear elsewhere in this Annual Report on Form 10-K. This discussion contains forward-looking statements that involve risks and uncertainties. Unless otherwise specifically noted, all years refer to our fiscal years which ended on June 27, 2014, June 28, 2013 and June 29, 2012.
Financial Trends
On October 1, 2013, the beginning of our second quarter of fiscal year 2014, non-essential functions of the U.S. Government temporarily shut down because Congress failed to pass legislation providing appropriations authority for the government to continue to operate for the U.S. Government’s fiscal year 2014. Between October 1 and October 16, 2013, there was no funding of federal agencies or programs, either by discretionary funding through annual appropriations acts or interim continuing resolutions (CRs). Subsequently, on October 16, 2013, Congress passed a CR funding measure to finance all U.S. Government activities through January 15, 2014 and raised the debt ceiling through February 7, 2014. Under this continuing resolution, partial-year funding was available at prior year levels, subject to certain restrictions, but new spending initiatives were not authorized.
On December 10, 2013, the U.S. Government reached a two-year budget agreement known as the Bipartisan Budget Agreement of 2013 (“BBA”). The BBA provides budget guidance through the U.S. Government’s fiscal year 2015, restores certain projected reductions, and eliminates sequestration for two years. The BBA does not address core fiscal issues, long-term debt issues, or deficit issues, and it does not appropriate funds. It appears that the U.S. Government will continue to face substantial fiscal and economic challenges that affect funding for certain projects, and as a result, we expect the U.S. government services market will continue to contract from historic annual levels.
Despite the appropriations resolution resulting from the BBA, the Company has not yet seen the expected increase in project funding, although we do expect more money will be provided by the end of September. During fiscal year 2014, we continued to enhance our positioning to identify and win more contracts, through the combination of leveraging the capabilities that GMI has brought the Company and improving our contract bidding strategies. However, although GMI contributed significant revenue during the fiscal year, it was not enough to counter the influence that delayed funding has had on contract activity in other parts of our business. The contribution from GMI and other company efforts have resulted in enhanced backlog and a healthy pipeline. We have managed costs to counter some of the margin pressure associated with the slowdown, such as shutting down the Company’s office in Knoxville, TN. While we have been very proactive in managing costs in the business, there is a level of costs, much of it fixed, that must be maintained and that will be covered as revenues increase with an improved funding environment.
Our business performance is affected by the overall level of U.S. Government spending and the alignment of our offerings and capabilities with the budget priorities of the U.S. Government. The U.S. Government budget deficit and the national U.S. debt have created pressure to examine and reduce spending across all federal agencies. Baseline spending for the DoD for the next 10 years has been reduced and there may be further reductions. Adverse changes in fiscal and economic conditions, such as the manner in which spending reductions are implemented, including sequestration, future government shutdowns, and issues related to the nation’s debt ceiling, could materially impact our business.
In this challenging economic environment, we focus on those opportunities where the U.S. Government continues funding and which clearly align with Versar’s customers, such as sustainable range management, UXO, PBR, and construction contract management. We also continue to focus on areas that we believe offer attractive enough returns to our clients that they will continue to fund efforts, such as construction type services both in the U. S. and internationally, improvements in energy efficiency, and facility upgrades.
| 17 |
Specifically, we see the following four elements driving our strategy going forward:
| · | Pursuit of larger contract opportunities. Our move to a large business, coincident with continued development of a strong internal infrastructure and associated technologies, allows us to focus on pursuing larger prime contracts and expand our pool of opportunities. We continue to strengthen our relationships with other contractors to create teaming arrangements that better serve our clients. Where we have seen a shift in focus to contracts for qualified small businesses, we are strengthening and developing relationships with such businesses so we can enhance our opportunity to capture some of this work. |
| · | Leveraging of our services. The combination of our multiple skill sets and broad service offerings will allow us to work efficiently in the new economic environment whether selling sustainable risk management services utilizing our energy and environmental skill-sets, or via effective use of our project and construction management skills in relation to complex project oversight. |
| · | Expanding our international footprint. While the Company is strong internationally in the construction management business, incorporation of our non-construction services into our overseas client base will allow for replication of our proven domestic skills into the international market and will help us meet growing overseas client needs. |
| · | Geographic and client expansion through acquisition. We have an active acquisition strategy and are focused on expanding our ability to offer our technical services to both new geographic areas and new clients, such as the U.S. Navy and the U.S. Department of State, through the acquisition of complementary businesses. |
We believe that Versar’s business segments have the expertise to identify and respond to the challenges raised by the global economic issues we face and that we are positioned in the coming year to address these concerns. However, we expect to continue to sub-contract a greater percentage of our services to expand our ability to offer a broader set of capabilities to the market. As a result, we anticipate that we will continue to experience a compression of our gross margins due to sub-contracting costs over the near term.
On July 1, 2014, we announced our acquisition of J.M. Waller Associates, Inc, (“JMWA”), a Service Disabled Veteran Owned Small Business (SDVOSB) with more than $30 million in annual revenues. The acquisition price of $13 million will be satisfied with cash and a seller note. JMWA, which is expected to be accretive to earnings in year one and adds contracted backlog of over $25 million, represents another step in our efforts to expand our growth opportunities and complement of service offerings. Key long-term clients include the U.S. Army Corps of Engineers, U.S. Air Force, U.S. Navy, Environmental Protection Agency, and the General Services Administration.
Our business operates through the following three business segments: ECM, ESG, and PSG. These segments are segregated based on the nature of the work, business processes, customer bases and the business environment in which each of the segments operates.
There are risk factors or uncertainties that could significantly impact our future financial performance. A sample of these risks is listed below. For a complete discussion of these risk factors and uncertainties refer to Item 1A. Risk Factors, herein.
| • | We operate in highly competitive industries; |
| • | A reduction or delay in pending awards by government agencies could adversely affect us; |
| • | Our inability to win or renew government contracts could adversely affect us; |
| • | We are exposed to risks associated with operating internationally; |
| • | Our failure to properly manage projects may result in additional costs or claims; |
| • | An economic downturn may adversely affect our business; |
| • | In order to succeed we need to keep up with a variety of rapidly changing technologies; |
| • | We are highly dependent on key personnel; |
| • | Future acquisitions may not go as expected and may have unexpected costs and consequences; and |
| • | The government may adopt new contract laws or regulations at any time. |
| 18 |
Consolidated Results of Operations
The table below sets forth our consolidated results of continuing operations for the fiscal years ended June 27, 2014, June 28, 2013, and June 29, 2012.
| For the Fiscal Year Ended | ||||||||||||
| June 27, 2014 | June 28, 2013 | June 29, 2012 | ||||||||||
| (dollars in thousands) | ||||||||||||
| GROSS REVENUE | $ | 110,280 | $ | 102,622 | $ | 114,970 | ||||||
| Purchased services and materials, at cost | 55,108 | 44,070 | 51,531 | |||||||||
| Direct costs of services and overhead | 48,438 | 44,865 | 46,988 | |||||||||
| GROSS PROFIT | $ | 6,734 | $ | 13,687 | $ | 16,451 | ||||||
| Gross Profit percentage | 6 | % | 13 | % | 14 | % | ||||||
| Selling general and administrative expenses | 8,390 | 7,603 | 8,083 | |||||||||
| Other operating income | (1,596 | ) | (182 | ) | 199 | |||||||
| Goodwill Impairment | 1,381 | - | - | |||||||||
| OPERATING (LOSS) INCOME, FROM CONTINUING OPERATIONS | (1,441 | ) | 6,266 | 8,169 | ||||||||
| OTHER (INCOME) EXPENSE | ||||||||||||
| Write-offs of uncollectible financing receivable | - | - | 694 | |||||||||
| Interest income | (15 | ) | (28 | ) | (70 | ) | ||||||
| Interest expense | 133 | 86 | 182 | |||||||||
| (LOSS) INCOME BEFORE INCOME TAXES, FROM CONTINUING OPERATIONS | $ | (1,559 | ) | $ | 6,208 | $ | 7,363 | |||||
| Income (Loss) from discontinued operations before income taxes | 317 | (2,751 | ) | (463 | ) | |||||||
| (LOSS) INCOME BEFORE INCOME TAXES | $ | (1,242 | ) | $ | 3,457 | $ | 6,900 | |||||
Fiscal Year 2014 Compared to Fiscal Year 2013
Gross revenue for fiscal year 2014 was $110.3 million, an increase of 7% compared to $102.6 million during the 2013 fiscal year. Additional revenue of $13.5 million contributed by GMI was partially off-set by decreases in revenue associated with our Title II work in Afghanistan and the completion of several programs within PSG. We have seen a decline in our contract positions within PSG largely due to the continued shift to more contract solicitations being targeted at businesses that qualify for small business programs. As a result, we continue to seek new ways to develop our relationships with firms qualified for these programs to increase our ability to capture more of this work and maintain current projects. Additionally, while JMWA acquired on July 1, 2014 will contribute revenue to all three of our reporting segments, we expect it to significantly contribute to the revenues of the PSG segment.
Purchased services and materials for fiscal year 2014 was $55.1 million, an increase of 25% compared to $44.0 million during the 2013 fiscal year. We continue to sub-contract a greater percentage of our services to expand our ability to offer a broader set of capabilities to market.
| 19 |
Direct costs of services and overhead for fiscal year 2014 were $48.4 million, an increase of 8% compared to $44.9 million during the 2013 fiscal year. This increase was primarily due to additional costs associated with GMI.
Gross profit from continuing operations for fiscal year 2014 was $6.7 million, a decrease of 51% compared to $13.7 million during the 2013 fiscal year. The majority of this decrease was due to the reduction in gross profit related to our Title II work in Afghanistan, which is anticipated to terminate during fiscal year 2015. In addition, purchased services, as a percentage of contract revenue, increased to 50%, compared to 43% during fiscal year 2013. As we continue to sub-contract a greater percentage of our services to expand our ability to offer a broader set of capabilities to market, we continue to see a compression of our gross margins. In the current business environment we expect a continued need to market a broader set of services, and thus expect to continue to experience compressed gross margins in the near term.
Selling, general and administrative expenses for fiscal year 2014 were $8.4 million, an increase of 10% compared to $7.6 million during the 2013 fiscal year. This increase was due to approximately $0.1 million related to integration costs associated with the acquisition of GMI, $0.4 million in reserves related to the shutdown of our Knoxville office, $0.3 million expense as a result of a change in California’s workers compensation classification code, an additional $0.1 million in fourth quarter reserves for doubtful accounts, and $0.1 million related to the acquisition of JMWA shortly after the end of the fiscal year. These increases were partially offset by $0.2 million from management’s continued efforts to control costs, such as rent reductions, updating paid time off policies, and temporary furloughs during fiscal 2014.
Other operating income for fiscal year 2014 was $1.6 million, compared to $0.2 million during the 2013 fiscal year. Fiscal year 2014 other operating income resulted from the reversal of certain liabilities that were previously recorded relating to the two contingent notes payable as additional consideration for the GMI acquisition. In accordance with ASC 805 Business Combinations, as we continued to examine the historical and forecasted revenues and operations attributable to GMI during the fourth quarter, we concluded that there was a less than probable likelihood that GMI would, within the measurement period, win the proposal that was a condition to earn the first of the two contingent notes and a less than probable likelihood that operations would achieve the revenue targets required to earn the second of the two contingent notes.
For the year ended June 27, 2014, we recorded a goodwill impairment charge of $1.4 million due to a decline in the estimated fair value in the ECM reporting unit, attributable to goodwill acquired from acquisitions prior to 2011. (For additional information on these goodwill impairments, see “—Critical Accounting Policies—Goodwill” and Note E to our Consolidated Financial Statements included herein).
Operating loss from continuing operations for fiscal year 2014 was $1.4 million compared to operating income of $6.3 million during the 2013 fiscal year. The operating loss was the result of a longer than expected integration of GMI operations that was not accretive in the fiscal year, as well as the factors discussed above. However, the Company had income of $0.3 million from certain operations that were discontinued in fiscal year 2013 as the result of continued collection efforts for past due accounts. This resulted in a net loss of $0.2 million for fiscal year 2014.
Fiscal Year 2013 Compared to Fiscal Year 2012
Gross revenue for fiscal year 2013 was $102.6 million, a decrease of 11% compared to $115.0 million during the 2012 fiscal year. This decrease was primarily a result of a decrease in ECM segment domestic revenue of approximately $15.4 million related to the completion in fiscal year 2012 of the Tooele Chemical Demilitarization project and decreased revenue in fiscal year of 2013 from domestic construction. Decreases in revenue were partially offset by increased ESG segment revenue attributable to PBRs and UXO projects, while the PSG segment revenue remained flat.
Purchased services and materials for fiscal year 2013 were $44.0 million, a decrease of 14% compared to $51.5 million during the 2012 fiscal year. This decrease was largely due to a decrease in the ECM segment as a result of the completion of the Tooele project and reduced domestic construction.
| 20 |
Direct costs of services and overhead for fiscal year 2013 were $44.9 million, a decrease of 5% compared to $47.0 million during the 2012 fiscal year. The decrease was attributable to reduced activity related to the close out of the Tooele Chemical Demilitarization project, partially offset by increased work in our ECM business segment from the Title II Construction Management and Personal Services projects.
Gross profit for fiscal year 2013 was $13.7 million, a decrease of 17% compared to $16.5 million during the 2012 fiscal year. The gross profit percentage declined slightly by 1% to 13% from 14% in fiscal year 2012.
Selling, general and administrative expenses for fiscal year 2013 were $7.6 million a decrease of 6% compared to $8.1 million during the 2012 fiscal year. This decrease was primarily attributable to a reduction in rent expense as we reduced the size of our leased space at the Springfield, VA location. In addition, cost reductions continued as we focused on controlling indirect labor and travel as the Company maintained its focus on cost saving initiatives.
Other operating income for fiscal year 2013 was $0.2 million, compared to other operating expense of $0.2 million during the 2012 fiscal year. During 2013, this line item includes $0.2 million of income related to the change in the contingent earn out consideration from our acquisition of Charron Consulting, Inc. (“Charron”) and during 2012 included costs associated with acquisitions.
Operating income for fiscal year 2013 was $6.3 million, a decrease of 23% compared to $8.2 million during the 2012 fiscal year. Declines in gross profit were partially offset by a corresponding reduction is general and administrative expenses.
The 2012 “write-off of uncollectible financing receivable” line item above is comprised of the write-off of approximately $0.7 million that resulted from the determination during fiscal year 2012 that a financing receivable was uncollectible.
Income from continuing operations, before income taxes, during fiscal year 2013 was $6.2 million, a decrease of 16% compared to $7.4 million during the 2012 fiscal year.
Results of Operations by Business Segment
The tables below set forth the operating results for our three business segments for the fiscal years ended June 27, 2014, June 28, 2013, and June 29, 2012, not including discontinued operations.
ECM
| For the Fiscal Year Ended | ||||||||||||
| June 27, 2014 | June 28, 2013 | June 29, 2012 | ||||||||||
| GROSS REVENUE | $ | 52,012 | $ | 49,270 | $ | 69,173 | ||||||
| Purchased services and materials, at cost | 32,991 | 24,580 | 39,074 | |||||||||
| Direct costs of services and overhead | 14,213 | 13,172 | 13,276 | |||||||||
| GROSS PROFIT, from continuing operations | 4,808 | 11,518 | 16,823 | |||||||||
| Income (Loss) from discontinued operations | 317 | (2,751 | ) | (463 | ) | |||||||
| GROSS PROFIT | $ | 5,125 | $ | 8,767 | $ | 16,360 | ||||||
| Gross profit percentage from continuing operations | 10 | % | 23 | % | 24 | % | ||||||
Fiscal Year 2014 Compared to Fiscal Year 2013
Gross revenue for fiscal year 2014 was $52.0 million, an increase of 6% compared to $49.3 million during the 2013 fiscal year. An additional $8.2 million in revenue attributable to GMI was partially off-set by an approximate $3 million decrease in revenue from our Title II work in Afghanistan as this program nears completion in fiscal year 2015 and a moderate decrease in revenue from our UK-based subsidiary PPS, which had experienced higher revenue in fiscal 2013 attributable to work related to the 2012 Olympic games.
| 21 |
Gross profit from continuing operations for fiscal year 2014 was $4.8 million, a decrease of 58% compared to $11.5 million during the 2013 fiscal year. The majority of this decrease was due to the reduction in gross profit related to our Title II work in Afghanistan, which is anticipated to terminate in fiscal year 2015. In addition, purchased services, as a percentage of contract revenue, increased to 63%, compared to 50% during the last fiscal year. As we continue to sub-contract a greater percentage of our services to expand our ability to offer a broader set of capabilities to market, we continue to see a compression of our gross margins. In the current business environment we expect a continued need to market a broader set of services, and thus expect to continue to experience compressed gross margins in the near term. Gross profit contributed from our products component in the United Kingdom, PPS, declined as the result of management realignment and associated severance costs, and is expected to return to its previous level after these changes have been fully implemented.
Fiscal Year 2013 Compared to Fiscal Year 2012
Gross revenue for fiscal year 2013 was $49.3 million, a decrease of $19.9 million or 29% compared to $69.2 million for fiscal year 2012. This decrease was primarily a result of reductions in government spending for international reconstruction operations both in Iraq for electrical inspection services and in Afghanistan for Air Force Civil Engineer Center (AFCEC) Title II Construction Management Services. This slowdown was coupled with reduced domestic revenue of approximately $15.4 million related to the completion of the Tooele Chemical Demilitarization project during fiscal year 2012 and reduced revenue from domestic construction of approximately $5.5 million.
Gross profit for fiscal year 2013 was $11.5 million, a decrease of $5.3 million or 32% compared to $16.8 million for fiscal year 2012. This decrease was directly related to the completion of the Tooele Chemical Demilitarization Project during fiscal year 2012 and the completion of the Iraq electrical inspection program. Combined, the Company’s discontinued operations from the Lab, Telecom, and Product components contributed an approximate $1.9 million additional decrease in gross profit.
ESG
| For the Fiscal Year Ended | ||||||||||||
| June 27, 2014 | June 28, 2013 | June 29, 2012 | ||||||||||
| GROSS REVENUE | $ | 46,848 | $ | 38,919 | $ | 30,906 | ||||||
| Purchased services and materials, at cost | 21,438 | 16,970 | 8,913 | |||||||||
| Direct costs of services and overhead | 24,537 | 20,792 | 23,757 | |||||||||
| GROSS PROFIT (LOSS) | $ | 873 | $ | 1,157 | $ | (1,764 | ) | |||||
| Gross profit (loss) percentage | 2 | % | 3 | % | -6 | % | ||||||
Fiscal Year 2014 Compared to Fiscal Year 2013
Gross revenue for fiscal year 2014 was $46.8 million, an increase of 20% compared to $38.9 million during the 2013 fiscal year. This increase was partially attributable to our work on the Great Lakes, New England, and Tinker PBR programs; all in conjunction with our PBR contracts with AFCEC. Additionally, GMI contributed approximately $5.3 million to this increase.
| 22 |
Gross profit for fiscal year 2014 was $0.9 million, a decrease of 25% compared to $1.2 million during the 2013 fiscal year. This decline in profitability was due to the decrease in direct labor utilization related to GMI as we finalized our integration during the year, as well as the increase, as a percentage of contract revenue, in direct costs of services and overhead during the fiscal year. We incurred an approximate $0.3 million one-time loss associated with a project in Joliet, IL, as well as additional costs associated with one of our client’s inability to pay their outstanding receivables. With a continued focus on controlling indirect costs, we anticipate margins to stabilize as GMI is fully integrated.
Fiscal Year 2013 Compared to Fiscal Year 2012
Gross revenue for fiscal year 2013 was $38.9 million, an increase of $8.0 million or 26% compared to $30.9 million for fiscal year 2012. This increase is primarily attributable to a $9.5 million increase in work being performed on PBRs for the U.S. Air Force reflecting both the transition from planning phases to site-work phases, and the startup of PBR activities at additional bases. Revenue increases were also associated with our UXO projects at Nellis AFB and Fort Irwin, CA. We also experienced an increase in municipal storm water contract awards reflecting growth in our natural resource services.
Gross profit for fiscal year 2013 was $1.2 million, an increase of $2.9 million or 166% compared to a loss of $1.8 million for fiscal year 2012. Gross profit margin improvement compared to fiscal year 2012 primarily reflects the $0.3 million project profit attributable to the UXO project at Fort Irwin, CA. During fiscal year 2013, the segment continued to see an increase in profitability as a result of an increase in direct labor it provides on the PBRs and UXO projects.
PSG
| For the Fiscal Year Ended | ||||||||||||
| June 27, 2014 | June 28, 2013 | June 29, 2012 | ||||||||||
| GROSS REVENUE | $ | 11,420 | $ | 14,433 | $ | 14,891 | ||||||
| Purchased services and materials, at cost | 679 | 2,520 | 3,544 | |||||||||
| Direct costs of services and overhead | 9,688 | 10,901 | 9,955 | |||||||||
| GROSS PROFIT | $ | 1,053 | $ | 1,012 | $ | 1,392 | ||||||
| Gross profit percentage | 9 | % | 7 | % | 9 | % | ||||||
Fiscal Year 2014 Compared to Fiscal Year 2013
Gross revenue for fiscal year 2014 was $11.4 million, a decrease of 21% compared to $14.4 million during the 2013 fiscal year. This decrease was due to the completion of contracts at numerous sites, most significantly within the Mobile District and at the Fort Lee site. We continue to see a decline in our contract positions largely due to the continued shift to more contract solicitations being targeted at businesses that qualify for small business programs. As a result, we continue to seek new ways to develop our relationships with firms qualified for these programs to increase our ability to capture more of this work and maintain current projects. In addition, we expect JMWA, acquired on July 1, 2014, to significantly contribute to the revenues of this segment.
Gross profit for fiscal year 2014 was $1.1 million, an increase of 10% compared to $1.0 million during the 2013 fiscal year. This increase was the direct result of headcount realignment associated with our projects at certain joint bases. Additionally, there was a significant decrease in purchased services related to our Fort Bragg program that ended in fiscal 2013.
Fiscal Year 2013 Compared to Fiscal Year 2012
Gross revenue for fiscal year 2013 was $14.4 million, a decrease of $0.5 million or 3% compared to $14.9 million for fiscal year 2012. This decrease was primarily due to a decrease in project awards resulting from Versar’s loss of small business entity status. In addition, contract capacity was reached on one of our U.S Army Corp of Engineers contracts.
| 23 |
Gross profit for fiscal year 2013 was $1.0 million, a decrease of $0.4 million or 27% compared to $1.4 million for fiscal year 2012. This decrease was primarily driven by a significant write-off of an uncollected accounts receivables of approximately $0.4 million during fiscal year 2013, partially off-set by an increase in overhead expenses for staff salaries (and corresponding increase in revenue) to compensate for certain stop work orders, and other contract award delays. Additionally, due to delays in certain contract awards a greater portion of direct labor was absorbed as indirect expense.
Gross Revenue by Client Base
Our business segments provide services to various industries, serving government and commercial clients. A summary of gross revenue from continuing operations generated from our client base is as follows:
| Years Ended | ||||||||||||||||||||||||
| June 27, 2014 | June 28, 2013 | June 29, 2012 | ||||||||||||||||||||||
| (in thousands) | ||||||||||||||||||||||||
| Government | ||||||||||||||||||||||||
| DoD | 86,039 | 78 | % | 85,836 | 84 | % | 93,560 | 81 | % | |||||||||||||||
| State and Local | 9,272 | 8 | % | 8,573 | 8 | % | 7,236 | 6 | % | |||||||||||||||
| EPA | 1,593 | 1 | % | 1,808 | 2 | % | 2,391 | 2 | % | |||||||||||||||
| Other | 6,313 | 6 | % | 3,081 | 3 | % | 7,481 | 7 | % | |||||||||||||||
| Commercial | 7,063 | 6 | % | 3,324 | 3 | % | 4,302 | 4 | % | |||||||||||||||
| Gross Revenue | 110,280 | 100 | % | 102,622 | 100 | % | 114,970 | 100 | % | |||||||||||||||
Liquidity and Capital Resources
Our working capital as of June 27, 2014 was approximately $24.1 million, a decrease of $2.9 million compared to the prior fiscal year. Our current ratio at June 27, 2014 was 2.29 compared to 2.54 from the prior fiscal year.
As discussed in Note M – Debt and Note S– Subsequent Event, of the Notes to the Consolidated Financial Statements included elsewhere in this report on Form 10-K, we have a line of credit facility with United Bank. We did not draw on the line of credit during fiscal year 2014 or 2013.
We financed a portion of our fiscal year 2013 acquisition of GMI through seller notes totaling $1.3 million and a portion of our fiscal year 2012 acquisition of Charron through seller notes totaling $1.0 million. At June 27, 2014 the outstanding aggregate principal balance of the notes was $1.1 million.
We believe that in light of our cash balance of $9.7 million at the end of fiscal year 2014, along with anticipated cash flows from operations and availability under our line of credit, our working capital will be sufficient to meet our liquidity needs within the next fiscal year. Capital requirements for fiscal year 2014 were approximately $0.6 million, used primarily for annual hardware and software purchases to maintain our existing information technology systems, equipment related to our Military Munitions Response Programs, and upgrades to our personal protective equipment manufacturing in our PPS component. We anticipate our capital requirements for fiscal year 2015 will be approximately $1.0 million.
Our current growth strategy involves growth through acquisitions of complementary businesses as well as businesses that would diversify our current service offerings. In order to fund future acquisitions, we may need to supplement our existing working capital and borrowing capacity under our line of credit with additional financing in the form of debt or equity. There can be no assurance that additional funding will be available in a timely manner on terms acceptable to us or at all when acquisition opportunities arise.
On September 3, 2013, we announced our acquisition of GMI, a business with more than $20 million in annual revenues. The purchase price was paid in a combination of cash and seller notes in the principal amount of up to $6.5 million. GMI which is headquartered in Plano, Texas, provides engineering design, construction management, environmental planning and programming, and other services in support of a wide range of government, industry, and commercial clients. Key long-term clients that transitioned with the acquisition include the U.S. Navy, the U.S. Air Force, and the U.S. Army Corps of Engineers.
| 24 |
As noted above, on July 1, 2014, we acquired JMWA. The acquisition price of $13 million was paid in cash and with a seller note in the principal amount of $6 million.
Contractual Obligations
At June 27, 2014, we had total contractual obligations of approximately $14.6 million, including short-term obligations of approximately $2.5 million. The short-term obligations will become due over the next twelve months (fiscal year 2015). Our contractual obligations are primarily related to lease commitments. Additionally, we have principal and interest obligations related to the notes payable from our acquisitions of Charron and GMI. The table below specifies the total contractual payment obligations as of June 27, 2014.
| Contractual Obligations | Total | Within 1 Year | 2-3 Years | 4-5 Years | After 5 Years | |||||||||||||||
| Lease obligations | $ | 13,406,858 | 2,792,566 | 4,341,323 | 3,448,722 | 2,824,427 | ||||||||||||||
| Notes Payable to sellers | $ | 1,114,583 | 958,333 | 156,250 | - | - | ||||||||||||||
| Estimated interest obligations | $ | 39,724 | 37,754 | 1,969 | - | - | ||||||||||||||
| Total contractual obligations | $ | 14,561,164 | 3,788,653 | 4,499,542 | 3,448,722 | 2,824,247 | ||||||||||||||
Critical Accounting Policies and Related Estimates That Could Have a Material Effect on Our Consolidated Financial Statements
Critical Accounting Policies and Estimates
Below is a discussion of the accounting policies and related estimates that we believe are the most critical to understanding our consolidated financial position and results of operations which require management judgments and estimates, or involve uncertainties. Information regarding our other accounting policies is included in the notes to our consolidated financial statements included elsewhere in this report on Form 10-K.
Revenue recognition: On cost-plus fee contracts, revenue is recognized to the extent of costs incurred plus a proportionate amount of fee earned, and on time-and-material contracts, revenue is recognized to the extent of billable rates times hours delivered plus material and other reimbursable costs incurred. We record income from fixed-price contracts, extending over more than one accounting period, using the percentage-of-completion method. During the performance of such contracts, estimated final contract prices and costs are periodically reviewed and revisions are made as required. Fixed price contracts can be significantly impacted by changes in contract performance, contract delays, liquidated damages and penalty provisions, and contract change orders, which may affect the revenue recognition on a project. Revisions to such estimates are made when they become known. Detailed quarterly project reviews are conducted with project managers to review all project progress accruals and revenue recognition. There is the possibility that there will be future and currently unforeseeable adjustments to our estimated contract revenues, costs and margins for fixed price contracts, particularly in the later stages of these contracts. Such adjustments are common in the construction industry given the nature of the contracts. These adjustments could either positively or negatively impact our estimates due to the circumstances surrounding the negotiations of change orders, the impact of schedule slippage, subcontractor claims and contract disputes which are normally resolved at the end of the contract.
| 25 |
Allowance for doubtful accounts: Disputes arise in the normal course of our business on projects where we are contesting with customers for collection of funds because of events such as delays, changes in contract specifications and questions of cost allowability and collectability. Such disputes, whether claims or unapproved change orders in process of negotiation, are recorded at the lesser of their estimated net realizable value or actual costs incurred and only when realization is probable and can be reliably estimated. Management reviews outstanding receivables on a quarterly basis and assesses the need for reserves, taking into consideration past collection history and other events that bear on the collectability of such receivables. All receivables over 60 days old are reviewed as part of this process.
Share-based compensation: Share-based compensation is measured at the grant date, based on the fair value of the award. The majority of the Company's equity awards granted in fiscal years 2014, 2013, and 2012 were restricted stock unit awards. Share-based compensation cost for restricted stock unit awards is based on the fair market value of the Company’s stock on the date of grant. Stock-based compensation cost for stock options is calculated on the date of grant using the fair value of stock options, as calculated using the Black-Scholes pricing model.
Net deferred tax asset: We have approximately $2.8 million in net deferred tax assets as of June 27, 2014, for continuing operations. These deferred tax assets are comprised of tax benefits associated with accrued expenses, reserves and employee benefits and are offset against deferred tax liabilities related to depreciation and amortization. We expect these net deferred tax assets to be fully utilized except for net operating loss carry-forwards from our Philippine branch in the amount of $106,000. We maintain a valuation allowance of approximately $0.6 million.
Long-lived assets: We review long-lived assets for impairment whenever events or changes in circumstances indicate that the carrying value of an asset might not be recoverable. An impairment loss is recognized if the carrying value exceeds the fair value. We review the cash flows of the operating units to ensure the carrying values do not exceed the cash flows that they support. Any write-downs are treated as permanent reductions. We believe the carrying value of our long-lived assets as of June 27, 2014 are fully recoverable.
Goodwill: The carrying value of goodwill at June 27, 2014 and June 28, 2013 was $8.1 million and $7.5 million, respectively. The goodwill balances were principally generated from our acquisition of GMI during the 2014 fiscal year, the fiscal year 2012 acquisition of Charron, and our fiscal year 2010 acquisitions of PPS and Advent Environmental, Inc. To conduct the annual goodwill impairment analysis, management engaged an external valuation firm to perform a valuation using a market-based valuation approach. We have elected to perform the annual goodwill impairment assessment on the last day of each fiscal year. As part of the impairment assessment, public companies and discounted cash flow analyses were performed to prepare a market-based valuation.
The first step of the goodwill impairment analysis identifies potential impairment and the second step measures the amount of impairment loss to be recognized, if any. Step 2 is only performed if Step 1 indicates potential impairment. Potential impairment is identified by comparing the fair value of the reporting unit with its carrying amount, including goodwill. The carrying amount of a reporting unit equals assets (including goodwill) less liabilities assigned to that reporting unit. The fair value of a reporting unit is the price that would be received if the reporting unit was sold. Value is based on the assumptions of market participants. Market participants may be strategic acquirers, financial buyers, or both. The assumptions of market participants do not include assumed synergies which are unique to the parent company. Our external valuation firm has estimated the fair value of each reporting unit using the Guideline Public Company (GPC) method under the market approach. Each of the GPC’s is assumed to be a market participant. The valuation includes an estimate of the weighted average cost of capital (WACC) and an assumed long-term growth rate. In the estimate of WACC, the cost of equity is estimated using the capital asset pricing model (CAPM). The weights assigned to the costs of equity and debt are based on ratios observed for market participants. The estimated long-term growth rate takes into account yields on long-term U.S. Treasuries as well as estimates by the Congressional Budget Office of expected growth rates in real GDP.
For the year ended June 27, 2014, we recorded a goodwill impairment charge of $1.4 million due to a decline in the estimated fair value in the ECM reporting unit, as a result of a decline in profitability related to PPS, our products line based in the United Kingdom. For additional information on these goodwill impairments, see “—Significant Accounting Policies—Goodwill” and Note E to our Consolidated Financial Statements.
| 26 |
Intangible assets: The net carrying value of our intangible assets at June 27, 2014 and June 28, 2013 was $2.9 million and $1.8 million, respectively. The intangible assets include customer related assets, marketing related assets, and technology-based assets. These intangible assets are amortized over a 5 - 15 year useful life. We review our intangible assets for impairment whenever events or changes in circumstances indicate that the carrying value of the asset might not be recoverable. An impairment loss is recognized if the carrying value exceeds the fair value. Any impairments of the asset are treated as permanent reductions. We believe that our intangible assets were not impaired during fiscal years 2014 or 2013.
Impact of Inflation
We protect ourselves from the effects of inflation. The majority of contracts we perform are for a period of a year or less and are firm fixed price contracts. Multi-year contracts provide for projected increases in labor and other costs.
Business Segments
We have the following three business segments: ECM, ESG, and PSG. Additional details regarding these segments are contained in Note B - Business Segments, of the Notes to the Consolidated Financial Statements included elsewhere in this report on Form 10-K.
Item 7A. Quantitative and Qualitative Disclosures about Market Risk
We have not entered into any transactions using derivative financial instruments or derivative commodity instruments and believe that our exposure to interest rate risk and other relevant market risk is not material.
| 27 |
Item 8. Financial Statements and Supplementary Data
Report of Independent Registered Public Accounting Firm
Board of Directors and Stockholders
Versar, Inc.
We have audited the accompanying consolidated balance sheets of Versar, Inc. (a Delaware corporation) and subsidiaries (the “Company”) as of June 27, 2014 and June 28, 2013, and the related consolidated statements of operations, comprehensive (loss) income, changes in stockholders’ equity, and cash flows for each of the three years in the period ended June 27, 2014. Our audits of the basic consolidated financial statements included the financial statement schedule listed in the index appearing under 15(2)(a). These financial statements and financial statement schedule are the responsibility of the Company’s management. Our responsibility is to express an opinion on these financial statements and financial statement schedule based on our audits.
We conducted our audits in accordance with the standards of the Public Company Accounting Oversight Board (United States). Those standards require that we plan and perform the audit to obtain reasonable assurance about whether the financial statements are free of material misstatement. We were not engaged to perform an audit of the Company’s internal control over financial reporting. Our audits included consideration of internal control over financial reporting as a basis for designing audit procedures that are appropriate in the circumstances, but not for the purpose of expressing an opinion on the effectiveness of the Company’s internal control over financial reporting. Accordingly, we express no such opinion. An audit also includes examining, on a test basis, evidence supporting the amounts and disclosures in the financial statements, assessing the accounting principles used and significant estimates made by management, as well as evaluating the overall financial statement presentation. We believe that our audits provide a reasonable basis for our opinion.
In our opinion, the consolidated financial statements referred to above present fairly, in all material respects, the financial position of Versar, Inc. and subsidiaries as of June 27, 2014 and June 28, 2013, and the results of their operations and their cash flows for each of the three years in the period ended June 27, 2014 in conformity with accounting principles generally accepted in the United States of America. Also in our opinion, the related financial statement schedule, when considered in relation to the basic consolidated financial statements taken as a whole, presents fairly, in all material respects, the information set forth therein.
/s/ GRANT THORNTON LLP
McLean, Virginia
September 10, 2014
| 28 |
VERSAR, INC. AND SUBSIDIARIES
Consolidated Balance Sheets
(In thousands, except share amounts)
| As of | ||||||||
| June 27, 2014 | June 28, 2013 | |||||||
| ASSETS | ||||||||
| Current assets | ||||||||
| Cash and cash equivalents | $ | 9,674 | $ | 8,728 | ||||
| Accounts receivable, net | 25,983 | 29,342 | ||||||
| Inventory, net | 1,294 | 1,225 | ||||||
| Prepaid expenses and other current assets | 1,303 | 1,074 | ||||||
| Deferred income taxes | 2,254 | 2,314 | ||||||
| Income tax receivable | 2,325 | 1,764 | ||||||
| Total current assets | 42,833 | 44,447 | ||||||
| Property and equipment, net | 2,389 | 2,108 | ||||||
| Deferred income taxes, non-current | 533 | 622 | ||||||
| Goodwill | 8,073 | 7,515 | ||||||
| Intangible assets, net | 2,930 | 1,798 | ||||||
| Other assets | 1,003 | 887 | ||||||
| Total assets | $ | 57,761 | $ | 57,377 | ||||
| LIABILITIES AND STOCKHOLDERS' EQUITY | ||||||||
| Current liabilities | ||||||||
| Accounts payable | $ | 11,272 | $ | 10,788 | ||||
| Accrued salaries and vacation | 2,912 | 3,042 | ||||||
| Other current liabilities | 3,568 | 3,304 | ||||||
| Income tax payable | - | - | ||||||
| Notes payable, current | 958 | 333 | ||||||
| Total current liabilities | 18,710 | 17,467 | ||||||
| Notes payable, non-current | 156 | 333 | ||||||
| Deferred income taxes | - | 849 | ||||||
| Other long-term liabilities | 1,110 | 1,104 | ||||||
| Total liabilities | 19,976 | 19,753 | ||||||
| Commitments and contingencies | - | - | ||||||
| Stockholders' equity | ||||||||
| Common stock $.01 par value; 30,000,000 shares authorized; 9,849,773 shares issued and 9,708,107 shares outstanding as of June 27, 2014, 9,849,773 shares issued and 9,579,753 shares outstanding as of June 28, 2013 | 100 | 99 | ||||||
| Capital in excess of par value | 30,393 | 29,758 | ||||||
| Retained earnings | 9,032 | 9,366 | ||||||
| Treasury stock, at cost | (1,396 | ) | (1,224 | ) | ||||
| Accumulated other comprehensive loss; foreign currency translation | (344 | ) | (375 | ) | ||||
| Total stockholders' equity | 37,785 | 37,624 | ||||||
| Total liabilities and stockholders' equity | $ | 57,761 | $ | 57,377 | ||||
The accompanying notes are an integral part of these consolidated financial statements.
| 29 |
VERSAR, INC. AND SUBSIDIARIES
Consolidated Statements of Operations
(In thousands, except per share amounts)
| For the Fiscal Year Ended | ||||||||||||
| June 27, 2014 | June 28, 2013 | June 29, 2012 | ||||||||||
| GROSS REVENUE | $ | 110,280 | $ | 102,622 | $ | 114,970 | ||||||
| Purchased services and materials, at cost | 55,108 | 44,070 | 51,531 | |||||||||
| Direct costs of services and overhead | 48,438 | 44,865 | 46,988 | |||||||||
| GROSS PROFIT | 6,734 | 13,687 | 16,451 | |||||||||
| Selling, general and administrative expenses | 8,390 | 7,603 | 8,083 | |||||||||
| Other operating income | (1,596 | ) | (182 | ) | 199 | |||||||
| Goodwill impairment | 1,381 | - | - | |||||||||
| OPERATING (LOSS) INCOME | (1,441 | ) | 6,266 | 8,169 | ||||||||
| OTHER (INCOME) EXPENSE | ||||||||||||
| Write-off of uncollectible financing receivable | - | - | 694 | |||||||||
| Interest income | (15 | ) | (28 | ) | (70 | ) | ||||||
| Interest expense | 133 | 86 | 182 | |||||||||
| (LOSS) INCOME BEFORE INCOME TAXES, FROM CONTINUING OPERATIONS | (1,559 | ) | 6,208 | 7,363 | ||||||||
| Income tax (benefit) expense | (1,043 | ) | 2,079 | 2,881 | ||||||||
| NET (LOSS) INCOME FROM CONTINUING OPERATIONS | (516 | ) | 4,129 | 4,482 | ||||||||
| Income (Loss) from discontinued operations, net of tax | 182 | (1,726 | ) | (287 | ) | |||||||
| NET (LOSS) INCOME | $ | (334 | ) | $ | 2,403 | $ | 4,195 | |||||
| NET (LOSS) INCOME PER SHARE-BASIC and DILUTED | ||||||||||||
| Continuing operations | $ | (0.05 | ) | 0.43 | $ | 0.48 | ||||||
| Discontinued operations | 0.02 | (0.18 | ) | (0.03 | ) | |||||||
| NET (LOSS) INCOME PER SHARE-BASIC and DILUTED | $ | (0.03 | ) | $ | 0.25 | $ | 0.45 | |||||
| WEIGHTED AVERAGE NUMBER OF SHARES OUTSTANDING-BASIC | 9,663 | 9,500 | 9,366 | |||||||||
| WEIGHTED AVERAGE NUMBER OF SHARES OUTSTANDING-DILUTED | 9,663 | 9,510 | 9,381 | |||||||||
The accompanying notes are an integral part of these consolidated financial statements.
| 30 |
VERSAR, INC. AND SUBSIDIARIES
Consolidated Statements of Comprehensive (Loss) Income
(In thousands)
| For the Fiscal Year Ended | ||||||||||||
| June 27, 2014 | June 28, 2013 | June 29, 2012 | ||||||||||
| COMPREHENSIVE (LOSS) INCOME | ||||||||||||
| Net (loss) income | $ | (334 | ) | $ | 2,403 | $ | 4,195 | |||||
| Foreign currency translation adjustments | 31 | 182 | (256 | ) | ||||||||
| TOTAL COMPREHENSIVE (LOSS) INCOME | $ | (303 | ) | $ | 2,585 | $ | 3,939 | |||||
The accompanying notes are an integral part of these consolidated financial statements.
| 31 |
VERSAR, INC. AND SUBSIDIARIES
Consolidated Statements of Changes in Stockholders’ Equity
Fiscal Years Ended June 29, 2014, June 28, 2013, and June 29, 2012
(in thousands)
| Capital | ||||||||||||||||||||||||||||||||
| Common Stock | in Excess of | Retained | Treasury | Total | ||||||||||||||||||||||||||||
| Shares | Amount | Par Value | Earnings | Shares | Amount | COL | SE | |||||||||||||||||||||||||
| Balance at June 29,2012 | 9,645 | $ | 96 | $ | 29,047 | $ | 6,963 | (254 | ) | $ | (1,166 | ) | $ | (557 | ) | $ | 34,383 | |||||||||||||||
| Exercise of stock options | 112 | 2 | 287 | - | - | - | - | 289 | ||||||||||||||||||||||||
| Restricted stock units | 93 | 1 | 100 | - | - | - | - | 101 | ||||||||||||||||||||||||
| Treasury stock | - | - | - | - | (16 | ) | (58 | ) | - | (58 | ) | |||||||||||||||||||||
| Share-based compensation | - | - | 312 | - | - | - | - | 312 | ||||||||||||||||||||||||
| Tax shortfall in exercise of stock options | - | - | 12 | - | - | - | - | 12 | ||||||||||||||||||||||||
| Comprehensive income: | ||||||||||||||||||||||||||||||||
| Net income | - | - | - | 2,403 | - | - | - | 2,403 | ||||||||||||||||||||||||
| Other comprehensive income: | ||||||||||||||||||||||||||||||||
| Foreign CTA | - | - | - | - | - | - | 183 | 183 | ||||||||||||||||||||||||
| Total comprehensive income | - | - | - | - | - | - | - | 2,586 | ||||||||||||||||||||||||
| Balance at June 28, 2013 | 9,850 | 99 | 29,758 | 9,366 | (270 | ) | (1,224 | ) | (375 | ) | 37,625 | |||||||||||||||||||||
| Exercise of stock options | 31 | - | 99 | - | - | - | - | 99 | ||||||||||||||||||||||||
| Restricted stock units | 132 | 1 | 502 | - | - | - | - | 503 | ||||||||||||||||||||||||
| Treasury stock | - | - | - | - | (35 | ) | (172 | ) | - | (172 | ) | |||||||||||||||||||||
| Tax shortfall in exercise of stock options | - | - | 34 | - | - | - | - | 34 | ||||||||||||||||||||||||
| Comprehensive income: | ||||||||||||||||||||||||||||||||
| Net loss | - | - | - | (334 | ) | - | - | - | (334 | ) | ||||||||||||||||||||||
| Other comprehensive income: | ||||||||||||||||||||||||||||||||
| Foreign CTA | - | - | - | - | - | - | 31 | 31 | ||||||||||||||||||||||||
| Total comprehensive income | - | - | - | - | - | - | (303 | ) | ||||||||||||||||||||||||
| Balance at June 27, 2014 | 10,013 | $ | 100 | $ | 30,393 | $ | 9,032 | (305 | ) | $ | (1,396 | ) | $ | (344 | ) | $ | 37,785 | |||||||||||||||
The accompanying notes are an integral part of these consolidated financial statements.
| 32 |
VERSAR, INC. AND SUBSIDIARIES
Consolidated Statements of Cash Flows
(In thousands)
| For the Fiscal Year Ended | ||||||||||||
| June 27, 2014 | June 28, 2013 | June 29, 2012 | ||||||||||
| Cash flows from operating activities: | ||||||||||||
| Net (loss) income | $ | (334 | ) | $ | 2,403 | $ | 4,195 | |||||
| Adjustments to reconcile net (loss) income to net cash provided by operating activities: | ||||||||||||
| Depreciation and amortization | 1,973 | 1,741 | 1,674 | |||||||||
| Loss on sale of property and equipment | 34 | 263 | 47 | |||||||||
| Write-off of financing receivable | - | - | 694 | |||||||||
| Change in contingent notes | (1,590 | ) | - | - | ||||||||
| (Recovery) provision for doubtful accounts receivable | (886 | ) | 61 | 1,019 | ||||||||
| (Loss) gain on life insurance policy cash surrender value | (63 | ) | (39 | ) | 33 | |||||||
| Deferred income taxes | (913 | ) | 79 | (944 | ) | |||||||
| Share based compensation | 502 | 424 | 261 | |||||||||
| Goodwill impairment | 1,381 | - | - | |||||||||
| Changes in assets and liabilities: | ||||||||||||
| Decrease (increase) in accounts receivable | 10,682 | (3,805 | ) | 3,621 | ||||||||
| (Increase) decrease in income tax receivables | - | (2,441 | ) | 1,101 | ||||||||
| Decrease (increase) in prepaid and other assets | 356 | 861 | (427 | ) | ||||||||
| Decrease (increase) in inventories | 64 | 206 | (42 | ) | ||||||||
| (Decrease) increase in accounts payable | (2,190 | ) | 5,373 | (4,625 | ) | |||||||
| Decrease in accrued salaries and vacation | (130 | ) | (81 | ) | (196 | ) | ||||||
| Decrease in income tax payable | (141 | ) | - | - | ||||||||
| (Increase) decrease in other assets and liabilities | (1,998 | ) | (3,563 | ) | 304 | |||||||
| Net cash provided by operating activities | 6,747 | 1,482 | 6,715 | |||||||||
| Cash flows from investing activities: | ||||||||||||
| Purchase of property and equipment | (971 | ) | (357 | ) | (897 | ) | ||||||
| Payment for GMI acquisition, net of cash acquired | (2,788 | ) | - | - | ||||||||
| Payment for Charron acquisition, net of cash acquired | - | (298 | ) | (1,610 | ) | |||||||
| Premiums paid on life insurance policies | (23 | ) | (42 | ) | (25 | ) | ||||||
| Proceeds from notes receivable | - | - | 346 | |||||||||
| Proceeds from sale of property and equipment | - | 102 | - | |||||||||
| Net cash used in investing activities | (3,782 | ) | (595 | ) | (2,186 | ) | ||||||
| Cash flows from financing activities: | ||||||||||||
| Earn-out obligation payments for PPS and Advent | - | (250 | ) | (1,261 | ) | |||||||
| Borrowings on line of credit | - | - | 13,586 | |||||||||
| Repayments on line of credit | - | - | (13,586 | ) | ||||||||
| Proceeds from exercise of stock options | 99 | 289 | - | |||||||||
| Repayments of notes payable | (2,045 | ) | (334 | ) | (1,417 | ) | ||||||
| Purchase of treasury stock | (171 | ) | (58 | ) | (24 | ) | ||||||
| Net cash used in financing activities | (2,117 | ) | (353 | ) | (2,702 | ) | ||||||
| Effect of exchange rate changes on cash and cash equivalents | 98 | 182 | 168 | |||||||||
| Net increase in cash and cash equivalents | 946 | 716 | 1,995 | |||||||||
| Cash and cash equivalents at the beginning of the period | 8,728 | 8,012 | 6,017 | |||||||||
| Cash and cash equivalents at the end of the period | $ | 9,674 | $ | 8,728 | $ | 8,012 | ||||||
| Supplemental disclosure of cash and non-cash activities: | ||||||||||||
| Promissory notes-payable issued in connection with GMI acquisition | $ | 1,250 | $ | - | $ | - | ||||||
| Promissory notes-payable issued in connection with Charron acquisition | $ | - | $ | - | $ | 1,000 | ||||||
| Cash paid for interest | $ | 133 | $ | 86 | $ | 53 | ||||||
Cash paid for income taxes | $ | 254 | $ | 1,964 | $ | 2,576 | ||||||
The accompanying notes are an integral part of these consolidated financial statements.
| 33 |
VERSAR, INC. AND SUBSIDIARIES
NOTES TO CONSOLIDATED FINANCIAL STATEMENTS
NOTE A - SIGNIFICANT ACCOUNTING POLICIES
Significant Accounting Policies
Principles of consolidation and business operations: Versar, Inc., a Delaware corporation organized in 1969 (the “Company” or “Versar”), is a global project management firm that provides sustainable value oriented solutions to government and commercial clients. We also provide tailored and secure solutions in extreme environments and offer specialized abilities in staff augmentation, performance based remediation, and hazardous material management. The accompanying consolidated financial statements include the accounts of Versar, Inc. and its wholly-owned subsidiaries (“Versar” or the “Company”). All intercompany balances and transactions have been eliminated in consolidation. The Company operates within three business segments as follows: (1) Engineering and Construction Management (“ECM”), (2) Environmental Services (“ESG”), and (3) Professional Services (“PSG”). Refer to Note C - Business Segments for additional information. Our fiscal year end is based upon 52 or 53 weeks per year ending on the last Friday of the fiscal period and therefore does not close on a calendar month end. The Company’s fiscal years 2014 and 2012 included 52 weeks and its fiscal year 2013 included 53 weeks.
Accounting estimates: The financial statements have been prepared in conformity with accounting principles generally accepted in the United States of America (“GAAP”), which require management to make estimates and assumptions that affect the reported amounts of assets and liabilities and disclosure of contingent assets and liabilities at the date of the financial statements and the reported amounts of revenues and expenses during the reporting period. Actual results may differ from those estimates.
Contract accounting and revenue recognition: Contracts in process are stated at the lower of actual cost incurred plus accrued profits or incurred costs reduced by progress billings. The Company records income from major fixed-price contracts, extending over more than one accounting period, using the percentage-of-completion method. During performance of such contracts, estimated final contract prices and costs are periodically reviewed and revisions are made as required. The effects of these revisions are included in the periods in which the revisions are made. On cost-plus-fee type contracts, revenue is recognized to the extent of costs incurred plus a proportionate amount of fee earned, and on time-and-material contracts, revenue is recognized to the extent of billable rates times hours delivered plus material and other reimbursable costs incurred. Losses on contracts are recognized when they become known.
Direct costs of services and overhead: These expenses represent the cost to Versar of direct and overhead staff, including recoverable overhead costs and unallowable costs that are directly attributable to contracts performed by the Company.
Pre-contract costs: Costs incurred by the Company prior to the execution of a contract, including bid and proposal costs, are expensed when incurred regardless of whether the bid is successful.
Depreciation and amortization: Property and equipment are carried at cost net of accumulated depreciation and amortization. Depreciation and amortization are computed on a straight-line basis over the estimated useful lives of the assets. Repairs and maintenance that do not add significant value or significantly lengthen an asset’s useful life are charged to current operations.
Allowance for doubtful accounts receivable: Disputes arise in the normal course of our business on projects where we are contesting with customers for collection of funds because of events such as delays, changes in contract specifications and questions of cost allowability and collectability. Such disputes, whether claims or unapproved change orders in process of negotiation, are recorded at the lesser of their estimated net realizable value or actual costs incurred and only when realization is probable and can be reliably estimated. Management reviews outstanding receivables on a quarterly basis and assesses the need for reserves, taking into consideration past collection history and other events that bear on the collectability of such receivables. All receivables over 60 days old are reviewed as part of this process.
| 34 |
Share-based compensation: Share-based compensation expense is measured at the grant date, based on the fair value of the award. The Company's recent equity awards have been restricted stock unit awards. Share-based compensation cost for restricted stock unit awards is based on the fair market value of the Company’s stock on the date of grant. Share-based compensation cost for stock options is calculated on the date of grant using the Black-Scholes pricing model to determine the fair value of stock options. Compensation expense is then recognized ratably over the requisite service period of the grants.
Net (loss) income per share: Basic net (loss) income per common share is computed by dividing net income from continuing operations and discontinued operations by the weighted average number of common shares outstanding during the period. Diluted net income per common share also includes common equivalent shares outstanding during the period, if dilutive. The Company’s common equivalent shares consist of shares to be issued under outstanding stock options and shares to be issued upon vesting of unvested restricted stock units.
The following is a reconciliation of weighted average outstanding shares for purposes of calculating basic net (loss) income per share compared to diluted net (loss) income per share:
| For the Fiscal Year End | ||||||||||||
| June 27, 2014 | June 28, 2013 | June 29,2012 | ||||||||||
| (in thousands) | ||||||||||||
| Weighted average common shares outstanding-basic | 9,663 | 9,500 | 9,366 | |||||||||
| Effect of assumed exercise of options and vesting of restricted stock unit awards, using the treasury stock method | - | 10 | 15 | |||||||||
| Weighted average common shares outstanding-diluted | 9,663 | 9,510 | 9,381 | |||||||||
For fiscal years 2014, 2013, and 2012, options to purchase approximately 43,000, 10,000, and 27,000 shares of common stock, respectively, were not included in the computation of diluted net (loss) income per share because the effect would be anti-dilutive.
Cash and cash equivalents: All investments with an original maturity of three months or less when purchased are considered to be cash equivalents. Cash and cash equivalents are maintained at financial institutions and, at times, balances may exceed federally insured limits. The Company has never experienced any losses related to these balances.
Inventory: The Company’s inventory is valued at the lower of cost or market and is accounted for on a first-in first-out basis.
Long-lived assets: The Company is required to review long-lived assets and certain identifiable intangibles for impairment whenever events or changes in circumstances indicate that the carrying value of an asset might not be recoverable. An impairment loss is recognized if the carrying value exceeds the fair value. Any write-downs are treated as permanent reductions. The Company believes its long-lived assets as of June 27, 2014 are fully recoverable.
Income taxes: The Company recognizes deferred tax liabilities and assets for the expected future tax consequences of temporary differences between the carrying amounts and the tax bases of certain assets and liabilities. A valuation allowance is established, as necessary, to reduce deferred income tax assets to the amount expected to be realized in future periods.
Goodwill: The goodwill balances were principally generated from our acquisition of Geo-Marine, Inc. (“GMI”) during the 2014 fiscal year, the fiscal year 2012 acquisition of Charron Consulting, Inc. (“Charron”), and our fiscal year 2010 acquisitions of Professional Protection Systems, Ltd. (“PPS”) and Advent Environmental, Inc. (“ADVENT”). To conduct the annual goodwill impairment analysis, management engaged an external valuation firm to perform a market-based valuation approach. The Company has elected to perform the annual goodwill impairment assessment on the last day of each fiscal year. An analysis was performed on public companies and discounted cash flows to prepare a market-based valuation (see Note E for results).
| 35 |
Other intangible assets: The net carrying value of intangible assets at June 27, 2014 and June 28, 2013 was $2.9 and $1.8 million, respectively. The intangible assets accumulated from acquisitions include customer related assets, marketing related assets, and technology-based assets. These intangible assets are amortized over a 5 - 8 year useful life. The Company is required to review its amortized intangible assets for impairment whenever events or changes in circumstances indicate that the carrying value of the asset might not be recoverable. An impairment loss is recognized if the carrying value exceeds the fair value. Any impairment of the assets would be treated as permanent reductions. We concluded that our intangible assets were not impaired during fiscal years 2014 and 2013.
Treasury stock: The Company accounts for treasury stock using the cost method. There were 304,778 and 270,020 shares of treasury stock at historical cost of approximately $1.4 million and $1.2 million at June 27, 2014 and June 28, 2013, respectively.
Foreign Currency Translation and Transactions: The financial position and results of operations of the Company’s foreign affiliates are translated using the local currency as the functional currency. Assets and liabilities of the affiliates are translated at the exchange rate in effect at year-end. Statement of Operations accounts are translated at the average rate of exchange prevailing during the year. Translation adjustments arising from the use of differing exchange rates from period to period are included in Accumulated Other Comprehensive (Loss) Income within the Company’s Consolidated Statements of Changes in Stockholders’ Equity. Gains and losses resulting from foreign currency transactions are included in operations and are not material for the fiscal years presented. At June 27, 2014 and June 28, 2013, the Company had cash held in foreign banks of approximately $0.8 million and $0.9 million, respectively. At June 27, 2014 and June 28, 2013, the Company had net assets held in the United Kingdom of approximately $0.3 million and $0.4 million, respectively.
Fair value Measurements: The fair values of our cash and cash equivalents, accounts receivable, accounts payable, and accrued liabilities approximate their carrying values because of the short-term nature of those instruments. The carrying value of the Company’s debt approximates its fair value based upon the quoted market price offered to the Company for debt of the same maturity and quality. Certain non-financial assets and liabilities are measured at fair value on a recurring and a non-recurring basis. These non-financial assets and liabilities are written down to their fair value when they are determined to be impaired.
Commitments and Contingencies: Liabilities for loss contingencies arising from claims, assessments, litigation, fines, and penalties and other sources are recorded when it is probable that a liability has been incurred and the amount of the assessment and/or remediation can be reasonably estimated.
Recent Accounting Pronouncements
On May 28, 2014, the Financial Accounting Standards Board (“FASB”) and the International Accounting Standards Board (“IASB”) issued their final standard on revenue from contracts with customers. The standard, issued as Accounting Standards Update (“ASU”) 2014-09 by the FASB, outlines a single comprehensive model for entities to use in accounting for revenue arising from contracts with customers and supersedes most current revenue recognition guidance. The core principle of the revenue model is that an entity recognizes revenue to depict the transfer of promised goods or services to customers in an amount that reflects the consideration to which the entity expects to be entitled in exchange for those goods or services. The ASU applies to all contracts with customers except those that are within the scope of other topics in the FASB Accounting Standards Codification. Compared with current U.S. GAAP, the ASU also requires significantly expanded disclosures about revenue recognition. The ASU is effective for interim and annual reporting periods that begin after December 15, 2016 and early adoption is prohibited. The Company is currently evaluating the impact of adopting this standard.
| 36 |
NOTE B – DISCONTINUED OPERATIONS
Our consolidated financial statements and related footnote disclosures reflect the fiscal year 2013 discontinuation of the Lab, Telecom, and Domestic Products business components in our ECM segment. Income and losses associated with these components, net of applicable income taxes, is shown as income or loss from discontinued operations for all periods presented (excluding quarterly financial data in Note R). For the year ended June 27, 2014, the Company had income of $0.3 million from operations that were discontinued in fiscal year 2013 as the result of continued collection efforts for past due accounts.
Operating results for the discontinued operations for the years ended June 27, 2014, June 28, 2013, and June 29, 2012, were as follows;
| For the Fiscal Years Ended | ||||||||||||
| June 27, 2014 | June 28, 2013 | June 29, 2012 | ||||||||||
| (in thousands) | ||||||||||||
| Gross Revenues | $ | - | $ | 2,638 | $ | 4,070 | ||||||
| Income (Loss) from discontinued operations | 317 | (2,751 | ) | (463 | ) | |||||||
| Provision for income taxes | (135 | ) | 1,025 | 176 | ||||||||
| Income (Loss) from discontinued operations, net of taxes | $ | 182 | $ | (1,726 | ) | $ | (287 | ) | ||||
NOTE C - BUSINESS SEGMENTS
The Company’s ECM business segment manages large complex construction projects. The Environmental Services (“ESG”) business segment provides full service environmental consulting including regulatory, risk assessments, Unexploded Ordnance clean-up/Military Munitions Response Programs, natural and cultural resources, and remediation support to several federal government and municipal agencies. The Professional Services (“PSG”) business segment provides outsourced personnel to various government agencies providing the Company’s clients with cost-effective onsite resources.
Summary financial information for the Company’s business segments from continuing operations is as follows:
| For the Fiscal Year Ended | ||||||||||||
| June 27, 2014 | June 28, 2013 | June 29, 2012 | ||||||||||
| (in thousands) | ||||||||||||
| GROSS REVENUE | ||||||||||||
| ECM | $ | 52,012 | $ | 49,270 | $ | 69,173 | ||||||
| ESG | 46,848 | 38,919 | 30,906 | |||||||||
| PSG | 11,420 | 14,433 | 14,891 | |||||||||
| $ | 110,280 | $ | 102,622 | $ | 114,970 | |||||||
| GROSS PROFIT (LOSS) (a) | ||||||||||||
| ECM | $ | 4,808 | $ | 11,518 | $ | 16,823 | ||||||
| ESG | 873 | 1,157 | (1,764 | ) | ||||||||
| PSG | 1,053 | 1,012 | 1,392 | |||||||||
| $ | 6,734 | $ | 13,687 | $ | 16,451 | |||||||
| Selling, general and administrative expenses | 8,390 | 7,603 | 8,083 | |||||||||
| Other operating income | (1,596 | ) | (182 | ) | 199 | |||||||
| Goodwill Impairment | 1,381 | - | - | |||||||||
| OPERATING (LOSS) INCOME, FROM CONTINUING OPERATIONS | $ | (1,441 | ) | $ | 6,266 | $ | 8,169 | |||||
| 37 |
(a) - Gross profit is defined as gross revenues less purchased services and materials, at cost, less direct costs of services and overhead allocated on a proportional basis.
| As of | ||||||||
| June 27, 2014 | June 28, 2013 | |||||||
| (in thousands) | ||||||||
| ASSETS | ||||||||
| ECM | $ | 43,699 | $ | 43,408 | ||||
| ESG | 13,178 | 13,090 | ||||||
| PSG | 885 | 879 | ||||||
| Total Assets | $ | 57,761 | $ | 57,377 | ||||
NOTE D - ACQUISITIONS
On September 3, 2013, Versar purchased all of the issued and outstanding shares of GMI for an aggregate price at closing of up to $6.5 million. Headquartered in Plano, Texas, GMI provides design and construction services, natural and cultural resources planning, programming and implementation, as well as other services in support of a wide range of government, industry, and commercial clients. GMI’s culture and capabilities complement Versar’s. In particular, GMI’s environmental expertise and customer-base will allow Versar to expand its reach technically and geographically.
At closing, the Company paid a cash purchase price of $3.1 million and issued a promissory note with an aggregate principal amount of $1.25 million, a two-year term, and interest accruing at 5% per year. In addition, the Company may be required to issue two additional contingent promissory notes with an aggregate principal amount of up to $2.15 million under certain contingent consideration provisions of the purchase agreement. Issuance of these two additional contingent notes is based on contract awards to GMI occurring within one year of the acquisition under two proposals identified by GMI, with payment in part contingent on achievement of certain revenue targets (see Note F for a further discussion). The Company has determined that it is improbable that GMI will achieve the contingent requirements and has therefore reversed the liability it had accrued for the contingent payments.
GMI has contributed approximately $13.6 million in revenue and $14.9 million in expenses through June 27, 2014. Additionally, the Company has incurred approximately $0.4 million of transaction and integration costs through June 27, 2014, recorded in selling, general, and administrative expenses.
The purchase price allocation in the table below reflects the Company’s estimate of the fair value of the assets acquired and liabilities assumed on the September 3, 2013 acquisition date. The Company recorded approximately $1.7 million of customer related intangible assets that are being amortized over a 15 year period. At June 27, 2014, the net book value of these intangible assets was approximately $1.5 million. Goodwill is allocated between our ECM and ESG segments based on a percentage of direct labor dollars, consistent with the Company’s overhead cost allocation methodology. Goodwill represents the value in excess of fair market value that the Company paid to acquire GMI.
| 38 |
| Amount | ||||
| Description | (in thousands) | |||
| Cash | $ | 313 | ||
| Accounts receivable | 6,376 | |||
| Property and equipment | 699 | |||
| Other assets | 835 | |||
| Goodwill | 1,940 | |||
| Intangible assets | 1,663 | |||
| Total assets acquired | 11,826 | |||
| Accounts payable | 2,457 | |||
| Deferred Revenue | 2,367 | |||
| Accrued expenses | 987 | |||
| Other current liabilities | 75 | |||
| Total liabilities assumed | 5,886 | |||
| Acquisition purchase price | $ | 5,940 | ||
NOTE E - GOODWILL AND INTANGIBLE ASSETS
Goodwill
The carrying value of goodwill at June 27, 2014 and June 28, 2013 was $8.1 million and $7.5 million, respectively. The goodwill balances were principally generated from our acquisition of GMI during fiscal year 2014, the fiscal year 2012 acquisition of Charron, and our fiscal year 2010 acquisitions of PPS and ADVENT. We had three reporting units at June 27, 2014. The aggregate balance of goodwill declined by $1.4 million and $0.1 million at June 27, 2014 and June 28, 2013, respectively. In connection with the preparation of our fiscal year 2014 financial statements, we conducted a test of our goodwill as of June 27, 2014. The June 27, 2014 decline was due to an impairment charge of $1.4 million as a result of a decline in the estimated fair value of our ECM reporting unit. The June 27, 2014 impairment is attributable to goodwill acquired from acquisitions prior to 2011 and the June 28, 2013 decline was due to a purchase price adjustment related to the Charron acquisition. A roll-forward of the carrying value of the Company’s goodwill balance, by business segment, for fiscal years 2014 and 2013 is as follows (in thousands):
| Goodwill Balances | ||||||||||||
| ECM | ESG | Total | ||||||||||
| Balance, June 28, 2013 | $ | 5,547 | $ | 1,968 | $ | 7,515 | ||||||
| GMI Acquisition | 1,136 | 803 | 1,939 | |||||||||
| Impairment | (1,381 | ) | - | (1,381 | ) | |||||||
| Balance, June 27, 2014 | $ | 5,302 | $ | 2,771 | $ | 8,073 | ||||||
| 39 |
We record goodwill in connection with the acquisition of businesses when the purchase price exceeds the fair values of the assets acquired and liabilities assumed. Generally, the most significant intangible assets from the businesses that we acquire are the assembled workforces, which includes the human capital of the management, administrative, marketing and business development, engineering and technical employees of the acquired businesses. Since intangible assets for assembled workforces are part of goodwill in accordance with the accounting standards for business combinations, the substantial majority of the intangible assets for our business acquisitions are recognized as goodwill.
We review goodwill for impairment annually as of the last day of our fiscal year and whenever events or changes in circumstances indicate that the carrying amount may not be recoverable using a two-step process for each reporting unit.
We engage a third party external valuation firm to perform the impairment analysis. The first step identifies potential impairment and the second step measures the amount of impairment loss to be recognized, if any. Step 2 is only performed if Step 1 indicates potential impairment. Potential impairment is identified by comparing the fair value of the reporting unit with its carrying amount, including goodwill. The carrying amount of a reporting unit equals assets (including goodwill) less liabilities assigned to that reporting unit. The fair value of a reporting unit is the price that would be received if the reporting unit was sold. Value is based on the assumptions of market participants. Market participants may be strategic acquirers, financial buyers, or both. The assumptions of market participants do not include assumed synergies which are unique to the parent company. Our external valuation firm has estimated the fair value of each reporting unit using the Guideline Public Company (GPC) method under the market approach. Each of the GPC’s is assumed to be a market participant. The valuation includes an estimate of the weighted average cost of capital (WACC) and an assumed long-term growth rate. In the estimate of WACC, the cost of equity is estimated using the capital asset pricing model (CAPM). The weights assigned to the costs of equity and debt are based on ratios observed for market participants. The estimated long-term growth rate takes into account yields on long-term U.S. Treasuries as well as estimates by the Congressional Budget Office of expected growth rates in real GDP.
Intangible Assets
In connection with the acquisitions of GMI, Charron, PPS, and ADVENT, the Company identified certain intangible assets. These intangible assets were customer-related, marketing-related and technology-related. A summary of the Company’s intangible asset balances as of June 27, 2014 and June 28, 2013, as well as their respective amortization periods, is as follows (in thousands):
| Gross Carrying Amount | Accumulated Amortization | Net Carrying Amount | Amortization Period | |||||||||||||
| As of June 27, 2014 | ||||||||||||||||
| Customer-related | $ | 3,568 | $ | (1,027 | ) | $ | 2,541 | 5-15 yrs | ||||||||
| Marketing-related | 372 | (296 | ) | 76 | 5-7 yrs | |||||||||||
| Technology-related | 841 | (528 | ) | 313 | 7 yrs | |||||||||||
| Total | 4,781 | (1,851 | ) | 2,930 | ||||||||||||
| 40 |
| Gross Carrying Amount | Accumulated Amortization | Net Carrying Amount | Amortization Period | |||||||||||||
| As of June 28, 2013 | ||||||||||||||||
| Customer-related | $ | 1,857 | $ | (622 | ) | $ | 1,235 | 5-15 yrs | ||||||||
| Marketing-related | 372 | (160 | ) | 212 | 5-7 yrs | |||||||||||
| Technology-related | 841 | (490 | ) | 351 | 7 yrs | |||||||||||
| Total | 3,070 | (1,272 | ) | 1,798 | ||||||||||||
Amortization expense for intangible assets was approximately $579,000, $485,000, and $337,000 for fiscal years 2014, 2013, and 2012, respectively. No intangible asset impairment charges were recorded during the 2014, 2013, and 2012 fiscal years.
Expected future amortization expense in the fiscal years subsequent to June 27, 2014 is as follows:
| Year | Amounts | |||
| (in thousands) | ||||
| 2015 | $ | 527 | ||
| 2016 | 425 | |||
| 2017 | 332 | |||
| 2018 | 238 | |||
| 2019 | 238 | |||
| Thereafter | 1,187 | |||
| Total | $ | 2,947 | ||
NOTE F - FAIR VALUE MEASUREMENT
Versar applies ASC 820 – Fair Value Measurements and Disclosures in determining the fair value to be disclosed for financial and nonfinancial assets and liabilities.
ASC 820 defines fair value as the price that would be received to sell an asset or paid to transfer a liability (an exit price) in an orderly transaction between market participants at the measurement date. It establishes a fair value hierarchy and a framework which requires categorizing assets and liabilities into one of three levels based on the assumptions (inputs) used in valuing the asset or liability. Level 1 provides the most reliable measure of fair value, while Level 3 generally requires significant management judgment.
Level 1 inputs are unadjusted, quoted market prices in active markets for identical assets or liabilities.
Level 2 inputs are observable inputs other than quoted prices included in Level 1, such as quoted prices for similar assets or liabilities in active markets or quoted prices for identical assets or liabilities in inactive markets.
Level 3 inputs include unobservable inputs that are supported by little, infrequent, or no market activity and reflect management’s own assumptions about inputs used in pricing the asset or liability.
As part of the purchase price of GMI, the Company could have been required to issue two additional contingent promissory notes upon satisfaction of certain conditions with a fair value at the date of acquisition of approximately $1.6 million. The first of these Level 3 liabilities was based on a proposal identified by GMI that would have resulted in contract awards to GMI and the second Level 3 liability was based on achievement of certain revenue targets.
In accordance with ASC 805 Business Combinations, the Company recorded $1.1 million of other operating income in relation to the first of the two contingent promissory notes discussed above and recorded $0.5 million of other income in relation to the second of the two contingent promissory notes discussed above.
| 41 |
At the end of the third quarter of fiscal year 2014, the Company recorded $0.3 million of other operating income in relation to the second of the two contingent promissory notes, resulting in a remaining earn out liability of $1.3 million at March 28, 2014. Based on the facts and circumstances at that time, management believed that the first contingent earn out would be earned within the measurement period and there was an approximate 30% probability of achieving the revenue target within the measurement period (based on probability derived from the valuation report prepared for Versar by an external valuation firm).
During the fourth quarter, management determined it was unlikely that the first contingent earn out would be earned within the prescribed contractual measurement period and, as such, reversed the liability and recorded $1.1 million in other operating income for the first of the two contingent promissory notes.
Additionally, during the fourth quarter, management concluded that it was unlikely that the revenue target for the second contingent earn out would be achieved in fiscal year 2014 and, therefore, reversed the remaining liability and recorded $0.2 million in other operating income for the second of the two contingent promissory notes.
The following table presents a summary of changes in fair value of the Company’s Level 3 assets and liabilities.
| Level 3 Inputs | ||||
| Liabilities | ||||
| Balance at June 28, 2013 | $ | - | ||
| New level 3 liability (contingent consideration liability associated with GMI acquisition) | 1,590 | |||
| Change in fair value of contingent consideration liability, included in other income, Q3 | (327 | ) | ||
| Change in fair value of contingent consideration liability, included in other income, Q4 | (1,263 | ) | ||
| Balance at June 27, 2014 | $ | - | ||
NOTE G - INVENTORY
The Company’s inventory balance includes the following:
| As of | ||||||||
| June 27, 2014 | June 28, 2013 | |||||||
| (in thousands) | ||||||||
| Raw Materials | $ | 908 | $ | 759 | ||||
| Finished Goods | 276 | 390 | ||||||
| Work-in-process | 152 | 150 | ||||||
| Reserve | (42 | ) | (74 | ) | ||||
| Total | $ | 1,294 | $ | 1,225 | ||||
NOTE H - CUSTOMER INFORMATION
A substantial portion of the Company’s revenue from continuing operations is derived from contracts with the U.S. Government as follows:
| 42 |
| As of | ||||||||||||
| June 27, 2014 | June 28, 2013 | June 29, 2012 | ||||||||||
| (in thousands) | ||||||||||||
| DoD | $ | 86,039 | $ | 85,836 | $ | 93,560 | ||||||
| U.S. EPA | 1,593 | 1,808 | 2,391 | |||||||||
| Other US Govt agencies | 6,314 | 3,081 | 7,481 | |||||||||
| Total US Government | $ | 93,946 | $ | 90,725 | $ | 103,432 | ||||||
A majority of the DOD work is to support the reconstruction of Iraq and Afghanistan with the U.S. Air Force and U.S. Army. Revenue of approximately $33 million for the fiscal year 2014 and $40 million for the fiscal years 2013 and 2012, was derived from the Company’s international work for the U.S. Government.
NOTE I - PREPAID EXPENSES AND OTHER CURRENT ASSETS
Prepaid expenses and other current assets include the following:
| As of | ||||||||
| June 27, 2014 | June 28, 2013 | |||||||
| (in thousands) | ||||||||
| Prepaid insurance | $ | 76 | $ | 80 | ||||
| Prepaid rent | 183 | 159 | ||||||
| Other prepaid expenses | 483 | 689 | ||||||
| Miscellaneous receivables | 561 | 146 | ||||||
| Total | $ | 1,303 | $ | 1,074 | ||||
Other prepaid expenses include maintenance agreements, licensing, subscriptions, and miscellaneous receivables from employees and a service provider.
NOTE J - OTHER CURRENT LIABILITIES
Other current liabilities include the following:
| As of | ||||||||
| June 27, 2014 | June 28, 2013 | |||||||
| Project related reserves | $ | 693 | $ | 737 | ||||
| Non-project related reserves | 642 | - | ||||||
| Payroll related | 483 | 762 | ||||||
| Asset retirement obligation | - | 647 | ||||||
| Deferred rent | 716 | 467 | ||||||
| Severance accrual | 69 | 51 | ||||||
| Acquired capital lease liability | 263 | - | ||||||
| Other | 702 | 640 | ||||||
| Total | $ | 3,568 | $ | 3,304 | ||||
| 43 |
Other accrued and miscellaneous liabilities include accrued legal, audit, VAT tax liability, foreign entity obligations, and other miscellaneous items.
NOTE K - ACCOUNTS RECEIVABLE
| As of | ||||||||
| June 27, 2014 | June 28, 2013 | |||||||
| (in thousands) | ||||||||
| Billed receivables | ||||||||
| U.S. Government | $ | 8,373 | $ | 12,692 | ||||
| Commercial | 3,484 | 3,329 | ||||||
| Unbilled receivables | ||||||||
| U.S. Government | 14,295 | 13,365 | ||||||
| Commercial | 474 | 1,485 | ||||||
| Total receivables | 26,626 | 30,871 | ||||||
| Allowance for doubtful accounts | (643 | ) | (1,529 | ) | ||||
| Accounts receivable, net | $ | 25,983 | $ | 29,342 | ||||
Unbilled receivables represent amounts earned which have not yet been billed and other amounts which can be invoiced upon completion of fixed-price contract milestones, attainment of certain contract objectives, or completion of federal and state governments’ incurred cost audits. Management anticipates that such unbilled receivables will be substantially billed and collected in fiscal year 2014; therefore, they have been presented as current assets in accordance with industry practice. As part of concentration risk, management continues to assess the impact of having the performance based remediation (“PBR”) contracts within the ESG segment represent over 60% of the outstanding receivable balance.
NOTE L - PROPERTY AND EQUIPMENT
| As of | ||||||||||
| Description | Useful life | June 27, 2014 | June 28, 2013 | |||||||
| (in thousands) | ||||||||||
| Furniture and fixtures | 10 | $ | 1,538 | $ | 1,379 | |||||
| Equipment | 3 to 10 | 6,692 | 7,898 | |||||||
| Capital leases | Life of lease | 588 | 234 | |||||||
| Leasehold improvements | (a) | 2,624 | 2,430 | |||||||
| Property and equipment, gross | $ | 11,442 | $ | 11,941 | ||||||
| Accumulated depreciation | (9,053 | ) | (9,833 | ) | ||||||
| Property and equipment, net | $ | 2,389 | $ | 2,108 | ||||||
| (a) | The useful life is the shorter of lease term or the life of the asset. |
Depreciation of property and equipment was approximately $1.4 million, $1.2 million, and $1.3 million for the fiscal years 2014, 2013, and 2012, respectively.
Maintenance and repair expense approximated $143,000, $176,000, and $140,000 for the fiscal years 2014, 2013, and 2012, respectively.
| 44 |
NOTE M - DEBT
Line of Credit
On June 27, 2014, in connection with our July 1, 2014 acquisition of JMWA, the Company’s $15 million line of credit facility with United Bank (the “Bank”) was amended and restated to extend its maturity date to September 25, 2015 and to make certain other changes to the terms and conditions governing the line of credit, including an increase in the line of credit commitment fee from 17 basis points to 25 basis points. The line of credit as amended is subject to certain covenants related to the maintenance of financial ratios. These covenants require a minimum tangible net worth of $18.0 million; a maximum total liabilities to tangible net worth ratio not to exceed 2.25 to 1; and a minimum current ratio of at least 1.25 to 1. As amended, borrowings under the line of credit bear interest at prime less 0.5% with an interest rate floor of 3.5%. The Company was in compliance with all financial ratio covenants under the facility as of June 27, 2014. Failure to meet the financial ratio covenant requirements gives the Bank the right to demand outstanding amounts due under the line of credit, which may impact the Company’s ability to finance its working capital requirements. The line of credit facility is collateralized by substantially all assets of the Company. The Company had no borrowings under the line of credit at June 27, 2014 and June 28, 2013.
Notes Payable
As part of the acquisition of GMI in September 2013, the Company issued notes payable with principal amounts totaling $1.3 million, which are payable quarterly over a two-year period with interest accruing at a rate of 5% per annum. At June 27, 2014, the outstanding principal balance of the GMI notes payable was $0.8 million. Interest expense for the GMI note payable for fiscal year 2014 was approximately $41,000.
As part of the acquisition of Charron in May 2012, the Company issued notes payable with principal amounts totaling $1.0 million, which are payable quarterly over a three-year period with interest accruing at a rate of 5% per annum. The outstanding principal balance of the Charron notes payable was $0.3 million and $0.7 million at June 27, 2014 and June 28, 2013, respectively. Interest expense for the Charron note payable was approximately $27,000, $31,000, and $5,000 for fiscal 2014, 2013, and 2012, respectively
The table below specifies the total contractual payment obligations as of June 27, 2014.
| Total | Within 1 Year | 2-3 Years | ||||||||||
| Notes Payable to sellers | 1,114,583 | 958,333 | 156,250 | |||||||||
NOTE N – SHARE-BASED COMPENSATION
During fiscal year 2014, the Company awarded 113,258 shares of restricted stock units from the 2010 plan to employees, executive officers and board members, which generally vest over a period of one to two years following the date of the grant. Shared based compensation expense relating to the vesting of stock options and restricted stock unit awards totaled approximately $0.5 million, $0.4 million, and $0.3 million for fiscal years 2014, 2013, and 2012 respectively.
| 45 |
| Weighted | ||||||||||||
| Average Option | ||||||||||||
| Option Shares | Price Per Share | Total | ||||||||||
| (in thousands, except share price) | ||||||||||||
| Outstanding at July 1, 2011 | 176 | $ | 3.63 | $ | 639 | |||||||
| Exercised | - | |||||||||||
| Cancelled | (55 | ) | 3.92 | (217 | ) | |||||||
| Outstanding at June 29, 2012 | 121 | $ | 3.49 | $ | 422 | |||||||
| Exercised | (47 | ) | 2.81 | (132 | ) | |||||||
| Cancelled | (27 | ) | 4.09 | (110 | ) | |||||||
| Outstanding at June 28, 2013 | 47 | $ | 3.83 | $ | 180 | |||||||
| Exercised | (20 | ) | 3.66 | (73 | ) | |||||||
| Cancelled | (13 | ) | 3.86 | (50 | ) | |||||||
| Outstanding at June 27, 2014 | 14 | $ | 3.99 | $ | 57 | |||||||
20,000 stock options were exercised during fiscal year 2014, with an intrinsic value of $30,000. The intrinsic value for incentive stock options exercised for fiscal years 2013 and 2012 was approximately $54,000 and $57,000, respectively.
Details of total exercisable incentive stock options outstanding at June 27, 2014 are as follows:
| Weighted | Weighted | |||||||||||||||||
| Range of | Average | Average | Number of Shares | |||||||||||||||
| Number of Shares | Option | Option | Remaining | Underlying | ||||||||||||||
| Underlying Options | Price | Price | Life | Exercisable Options | ||||||||||||||
| 4 | 3.40 - 3.82 | $ | 3.61 | 0.5 | 4 | |||||||||||||
| 10 | 4.00 - 4.45 | $ | 4.14 | 0.3 | 10 | |||||||||||||
| 14 | 14 | |||||||||||||||||
Total non-qualified stock options granted under the Company’s 2010 Plan and prior stock incentive plans are as follows:
| 46 |
| Weighted | ||||||||||||
| -Average | ||||||||||||
| Option | ||||||||||||
| Price Per | ||||||||||||
| Option Shares | Share | Total | ||||||||||
| (in thousands, except share price) | ||||||||||||
| Outstanding at July 1, 2011 | 73 | $ | 2.51 | $ | 183 | |||||||
| Cancelled | (8 | ) | 3.65 | (29 | ) | |||||||
| Outstanding at June 29, 2012 | 65 | $ | 2.38 | $ | 156 | |||||||
| Exercised | (46 | ) | 1.82 | (84 | ) | |||||||
| Outstanding at June 28, 2013 | 19 | 3.7 | 72 | |||||||||
| Exercised | (11 | ) | $ | 3.10 | $ | (35 | ) | |||||
| Outstanding at June 27, 2014 | 8 | $ | 4.58 | $ | 37 | |||||||
NOTE O - INCOME TAXES
Pretax (loss) income is comprised of the following:
| For the Fiscal Year Ended | ||||||||||||
| June 27, 2014 | June 28, 2013 | June 29, 2012 | ||||||||||
| (in thousands) | ||||||||||||
| US Entities | $ | 150 | $ | 7,688 | $ | 8,328 | ||||||
| Foreign Entities | (1,711 | ) | (1,480 | ) | (965 | ) | ||||||
| Total continuing operations | (1,561 | ) | 6,208 | 7,363 | ||||||||
| Discontinued operations | 317 | (2,751 | ) | (462 | ) | |||||||
| Total pretax (loss) income | $ | (1,244 | ) | $ | 3,457 | $ | 6,901 | |||||
Pretax (loss) income from the U.S. and foreign entities is currently taxable in the U.S.; accordingly, the Company has no unremitted foreign income.
| 47 |
Income tax (benefit) expense for continuing operations is as follows:
| For the Fiscal | ||||||||||||
| Year Ended | ||||||||||||
| June 27, 2014 | June 28, 2013 | June 29, 2012 | ||||||||||
| (in thousands) | ||||||||||||
| Current | ||||||||||||
| Federal | $ | (130 | ) | $ | 1,753 | $ | 1,608 | |||||
| State | (86 | ) | 356 | 726 | ||||||||
| Foreign | 1 | (530 | ) | 1,422 | ||||||||
| Deferred | ||||||||||||
| Federal | (819 | ) | 359 | (708 | ) | |||||||
| State | (9 | ) | 32 | (167 | ) | |||||||
| Foreign | (429 | ) | - | - | ||||||||
| Change in Valuation allowance | 429 | 109 | - | |||||||||
| Income tax (benefit) expenses, continued operations | $ | (1,043 | ) | $ | 2,079 | $ | 2,881 | |||||
| Income tax benefit, current from discontinued operations | (189 | ) | (617 | ) | (110 | ) | ||||||
| Income tax benefit, deferred from discontinued operations | 324 | (408 | ) | (66 | ) | |||||||
| Income tax (benefit) expenses | $ | (908 | ) | $ | 1,054 | $ | 2,705 | |||||
Deferred tax assets are comprised of the following as of the dates indicated below:
| For the Fiscal Year Ended | ||||||||
| June 27, 2014 | June 28, 2013 | |||||||
| (in thousands) | ||||||||
| Deferred Tax Assets | ||||||||
| Employee benefits | $ | 589 | $ | 513 | ||||
| Bad debt reserves | 240 | 575 | ||||||
| All other reserves | 492 | 591 | ||||||
| Net operating losses and tax credit | 1,199 | 106 | ||||||
| Capital loss carryforward | 108 | 109 | ||||||
| Accrued expenses | 977 | 733 | ||||||
| Depreciation and amortization | 619 | 381 | ||||||
| Other | 167 | 89 | ||||||
| Total deferred tax assets | $ | 4,391 | $ | 3,097 | ||||
| Valuation Allowance | $ | (595 | ) | $ | (167 | ) | ||
| Deferred Tax Liabilities | ||||||||
| Goodwill and intangibles | $ | (860 | ) | $ | (623 | ) | ||
| Depreciation and amortization | - | - | ||||||
| Other | (149 | ) | (224 | ) | ||||
| Net deferred tax assets | $ | 2,787 | $ | 2,083 | ||||
The Company regularly reviews the recoverability of its deferred tax assets and establishes a valuation allowance as deemed appropriate. As of the end of fiscal year 2014, the Company had $595,000 in valuation allowance related to the deferred tax assets from the Philippine branch operations, the U.K. branch operations and to the temporarily disallowed U.S. capital loss carry forwards, $59,000, $427,000 and $109,000, respectively. As of the end of fiscal year 2013 the Company had a valuation allowance of approximately $167,000 related to deferred tax assets in the Philippine branch operations and U.S. capital loss carry forward. The Company established a valuation allowance on its Philippine branch operations in the past and current year as it is not more likely than not that the deferred tax assets will be realized for these operations in future periods as current projections indicate forecasts of additional pre-tax losses. The Company also has a valuation allowance on the capital loss carry forward as it is not more likely than not that it will be utilized before the end of the carry forward period. In the fiscal year 2014, the Company established a valuation allowance on its U.K. branch operations as it is not more likely than not that the deferred tax asset will be realized for these operations.
| 48 |
At June 27, 2014, the Company has net operating loss carry-forwards in the Philippines branch of approximately $57,000 ($193,000 gross), the U.K. branch $557,000 ($2,700,000 gross) and $608,000 ($1,787,000 gross) from the acquired subsidiary (Geo-Marine, Inc.) which will expire in FY2014 and after. In addition, they have $76,000 of R&D credits carry forward and $32,000 of foreign tax credit.
In accordance with FASB’s guidance regarding uncertain tax positions, the Company recognizes income tax benefits in its financial statements only when it is more likely than not that the tax positions creating those benefits will be sustained by the taxing authorities based on the technical merits of those tax positions. At June 27, 2014 the Company did not have any uncertain tax positions. The Company’s 2013, 2012, 2011, 2010, and 2009 tax years remain open to audit in most jurisdictions.
The Company’s policy is to recognize interest expense and penalties as a component of general and administrative expense.
A reconciliation of the Company’s income tax expense from the federal statutory rate to income tax (benefit) expense of continuing operations is as follows:
| For the Fiscal Year Ended | ||||||||||||
| June | June | |||||||||||
| June 27, 2014 | 28, 2013 | 29, 2012 | ||||||||||
| (in thousands) | ||||||||||||
| Expected provision at federal statutory rate | $ | (530 | ) | $ | 2,111 | $ | 2,504 | |||||
| State income tax expense | (49 | ) | 218 | 305 | ||||||||
| Permanent items | (340 | ) | 7 | 48 | ||||||||
| Change in tax rates | 21 | 28 | (26 | ) | ||||||||
| Tax Credits | (28 | ) | (330 | ) | - | |||||||
| Change in valuation allowance | (1 | ) | 109 | - | ||||||||
| Other | (115 | ) | (64 | ) | 50 | |||||||
| Income tax (benefit) expense from continuing operations | $ | (1,043 | ) | $ | 2,079 | $ | 2,881 | |||||
| Income tax benefit, current discontinued operations | (189 | ) | (617 | ) | - | |||||||
| Income tax benefit, deferred discontinued operations | 324 | (408 | ) | - | ||||||||
| Total income tax (benefit) expense | $ | (908 | ) | $ | 1,054 | $ | 2,881 | |||||
NOTE P - EMPLOYEE SAVINGS AND STOCK OWNERSHIP PLAN
The Company continues to maintain the Versar, Inc. 401(k) Plan (“401(k) Plan”), which permits voluntary participation upon employment. The 401(k) Plan was adopted in accordance with Section 401(k) of the Internal Revenue Code.
| 49 |
Under the 401(k) Plan, participants may elect to defer up to 50% of their salary through contributions to the plan, which are invested in selected mutual funds or used to buy insurance. The Company matches 100% of the first 3% and 50% of the next 2% of the employee-qualified contributions for a total match of 4%. The employer contribution may be made in the Company’s stock or cash. In fiscal years 2014, 2013, and 2012, the Company made cash contributions of $1.0 million, $1.0 million, and $1.0 million, respectively. All contributions to the 401(k) Plan vest immediately.
In January 2005, the Company established an Employee Stock Purchase Plan (“ESPP”) under Section 423 of the United States Internal Revenue Code. The ESPP allows eligible employees of the Company and its designated affiliates to purchase, through payroll deductions, shares of common stock of the Company from the open market. The Company will not reserve shares of authorized but unissued common stock for issuance under the ESPP. Instead, a designated broker will purchase shares for participants on the open market. Eligible employees may purchase the shares at a discounted rate equal to 95% of the closing price of the Company’s shares on the NYSE MKT on the purchase date.
NOTE Q – COMMITMENTS AND CONTINGENCIES
Lease Obligations
The Company leases approximately 152,000 square feet of office space, as well as data processing and other equipment under agreements expiring through 2021. Minimum future obligations under operating and capital leases are as follows:
| Fiscal Year Ended | Total Amount | |||
| 2015 | 2,792,566 | |||
| 2016 | 2,237,789 | |||
| 2017 | 2,103,534 | |||
| 2018 | 1,826,226 | |||
| 2019 | 1,622,496 | |||
| Thereafter | 2,824,247 | |||
| 13,406,858 | ||||
Certain of the lease payments are subject to adjustment for increases in utility costs and real estate taxes. Total office rental expense approximated $2.6 million, $3.5 million, and $3.0 million, for fiscal years 2014, 2013, and 2012, respectively. Lease concessions and other tenant allowances are amortized over the life of the lease on a straight line basis. For leases with fixed rent escalations, the total lease costs including the fixed rent escalations are totaled and the total rent cost is recognized on a straight line basis over the life of the lease.
Disallowed Costs
Versar has a substantial number of U.S. Government contracts, and certain of these contracts are cost reimbursable. Costs incurred on these contracts are subject to audit by the Defense Contract Audit Agency (“DCAA”). All fiscal years through 2007 have been audited and closed. Management believes that the effect of disallowed costs, if any, for the periods not yet audited and settled with DCAA will not have a material adverse effect on the Company’s Consolidated Balance Sheets or Consolidated Statements of Operations. The Company accrues a liability from the DCAA audits if needed. As of June 27, 2014, the accrued liability for such matters was immaterial.
| 50 |
Legal Proceedings
Versar and its subsidiaries are parties from time to time to various legal actions arising in the normal course of business. The Company believes that any ultimate unfavorable resolution of any currently ongoing legal actions will not have a material adverse effect on its consolidated financial condition and results of operations.
NOTE R - QUARTERLY FINANCIAL INFORMATION (UNAUDITED)
Quarterly financial information for fiscal years 2014 and 2013 is as follows (in thousands, except share and per share amounts):
| Fiscal Year 2014 | Fiscal Year 2013 | |||||||||||||||||||||||||||||||||||||||
| 27-Jun | 28-Mar | 27-Dec | 27-Sep | Total | 28-Jun | 29-Mar | 28-Dec | 28-Sep | Total | |||||||||||||||||||||||||||||||
| Gross Revenue | 24,898 | 28,225 | 28,037 | 29,120 | 110,280 | 25,396 | 31,600 | 24,715 | 23,551 | 105,262 | ||||||||||||||||||||||||||||||
| Gross Revenue from continuing operations | 24,898 | 28,225 | 28,037 | 29,120 | 110,280 | 25,124 | 31,091 | 24,110 | 22,298 | 102,624 | ||||||||||||||||||||||||||||||
| Gross Revenue from discontinued operations | - | - | - | - | - | 272 | 509 | 605 | 1,253 | 2,638 | ||||||||||||||||||||||||||||||
| Gross Profit | 318 | 1,133 | 2,331 | 2,952 | 6,734 | 639 | 3,217 | 3,768 | 3,313 | 10,937 | ||||||||||||||||||||||||||||||
| Gross Profit from continuing operations | 318 | 1,133 | 2,331 | 2,952 | 6,734 | 4,041 | 3,150 | 3,571 | 2,926 | 13,688 | ||||||||||||||||||||||||||||||
| Gross Profit from discontinued operations | - | - | - | - | - | (3,403 | ) | 67 | 197 | 387 | (2,752 | ) | ||||||||||||||||||||||||||||
| Operating (loss) income | (1,953 | ) | (486 | ) | (84 | ) | 1,082 | (1,441 | ) | (733 | ) | 1,340 | 3,768 | 1,388 | 5,763 | |||||||||||||||||||||||||
| Net (loss) income | (962 | ) | (131 | ) | 100 | 659 | (334 | ) | (409 | ) | 1,042 | 925 | 845 | 2,403 | ||||||||||||||||||||||||||
| Net (loss) income per share - diluted | $ | (0.10 | ) | $ | (0.01 | ) | $ | 0.01 | $ | 0.07 | $ | (0.03 | ) | $ | (0.04 | ) | $ | 0.11 | $ | 0.10 | $ | 0.09 | 0.26 | |||||||||||||||||
| Weighted average number of shares outstanding - diluted | 9,663 | 9,702 | 9,789 | 9,694 | 9,510 | 9,575 | 9,372 | 9,424 | ||||||||||||||||||||||||||||||||
Note: The sum of the four quarterly earnings per share amounts may not equal the annual total due to fluctuations in common shares outstanding.
NOTE S – SUBSEQUENT EVENT
On July 1, 2014, Versar acquired all of the issued and outstanding capital stock of J.M. Waller Associates, Inc. (“JMWA”), a Virginia corporation. JMWA is a Service Disabled Veteran Owned Small Business providing architectural, design, planning, construction management environmental, facilities, and logistical consulting services to federal, state, municipal and commercial clients. The outstanding capital stock of JMWA was acquired by Versar pursuant to a Stock Purchase Agreement by and among Versar, JMWA, and the stockholders of JMWA, entered into on June 30, 2014 (the “Stock Purchase Agreement”). The aggregate purchase price for the outstanding capital stock of JMWA is $13,000,000, which is comprised of: (i) cash in the amount of $7,000,000 paid pro rata in accordance with each stockholder’s ownership interest in JMWA at closing; and (ii) three seller notes with an aggregate principal amount of $6,000,000 issued by Versar to the stockholders, pro rata in accordance with each stockholders’ ownership interest in JMWA at closing. The seller notes bear interest of 5.00% per annum and mature on the third business day of January 2019. The purchase price is subject to a post-closing adjustment based on an agreed target net working capital of JMWA as of the date of closing. The Stock Purchase Agreement contains customary representations and warranties and requires the JMWA stockholders to indemnify Versar for certain liabilities arising under the agreement, subject to certain limitations and conditions.
| 51 |
Item 9. Changes in and Disagreements with Accountants on Accounting and Financial Disclosure
None.
Item 9A. Controls and Procedures
Disclosure Controls and Procedures
Evaluation of the effectiveness of the design and operation of the Company’s “disclosure controls and procedures” (as defined in Rule 13a-15(e) under the Securities Exchange Act of 1934, as amended (the “Exchange Act”)) was carried out as of June 27, 2014, the last day of the fiscal period covered by this report. This evaluation was made by the Company’s Chief Executive Officer and Chief Financial Officer. Based upon this evaluation, the Company’s Chief Executive Officer and Chief Financial Officer have concluded that the Company’s disclosure controls and procedures (a) are effective to ensure that information required to be disclosed by the Company in reports filed or submitted under the Exchange Act is timely recorded, processed, summarized and reported and (b) include, without limitation, controls and procedures designed to ensure that information required to be disclosed by the Company in reports filed or submitted under the Exchange Act is accumulated and communicated to the Company’s management, including its Chief Executive Officer and Chief Financial Officer, as appropriate to allow timely decisions regarding required disclosure.
Management’s Annual Report on Internal Control over Financial Reporting
Management is responsible for establishing and maintaining adequate internal control over financial reporting for the Company. Internal control over financial reporting is defined in Rule 13a-15(f) and 15d-15(f) promulgated under the Exchange Act as a process designed by, or under the supervision of, the Company’s principal executive and principal financial officers and effected by the Company’s board of directors, management and other personnel, to provide reasonable assurance regarding the reliability of financial reporting and the preparation of financial statements for external purposes in accordance with generally accepted accounting principles and includes those policies and procedures that:
• Pertain to the maintenance of records that in reasonable detail accurately and fairly reflect the transactions and dispositions of the assets of the Company;
• Provide reasonable assurance that transactions are recorded as necessary to permit preparation of financial statements in accordance with generally accepted accounting principles, and that receipts and expenditures of the Company are being made only in accordance with authorizations of management and directors of the Company; and
• Provide reasonable assurance regarding prevention or timely detection of unauthorized acquisition, use or disposition of the Company’s assets that could have a material effect on the financial statements.
Because of its inherent limitations, internal control over financial reporting may not prevent or detect misstatements. Projections of any evaluation of effectiveness to future periods are subject to the risk that controls may become inadequate because of changes in conditions, or that the degree of compliance with the policies or procedures may deteriorate.
Internal control over financial reporting cannot provide absolute assurance of achieving financial reporting objectives because of its inherent limitations. Internal control over financial reporting is a process that involves human diligence and compliance and is subject to lapses in judgment and breakdowns resulting from human failure. Internal control over financial reporting can also be circumvented by collusion or improper management override. Because of such limitations, there is a risk that material misstatements may not be prevented or detected on a timely basis by internal control over financial reporting. However, these inherent limitations are known features of the financial reporting process. Therefore, it is possible to design into the process safeguards to reduce, though not eliminate, this risk.
The Company’s management, including the Chief Executive Officer and Chief Financial Officer, assessed the effectiveness of the Company’s internal control over financial reporting as of June 27, 2014. In making this assessment, the Company’s management used the criteria set forth by the Committee of Sponsoring Organizations of the Treadway Commission’s Internal Control-Integrated Framework, issued in 1992.
| 52 |
Based on our assessment, management has concluded that, as of June 27, 2014, the Company’s internal control over financial reporting was effective based on those criteria.
Attestation Report of the Independent Registered Public Accounting Firm
This Annual Report does not include an attestation report of the Company’s independent registered public accounting firm regarding internal control over financial reporting. Internal control over financial reporting was not subject to attestation by the Company’s independent registered public accounting firm pursuant to a permanent exemption granted under Section 989G of the Dodd-Frank Wall Street Reform and Consumer Protection Act for smaller reporting companies that permits the Company to provide only management’s report in this Annual Report.
Changes in Internal Control over Financial Reporting
There were no changes in the Company’s internal control over financial reporting identified in connection with the evaluation of such internal control that occurred during the Company’s fourth quarter of fiscal year 2014 that have materially affected, or are reasonably likely to materially affect, the Company’s internal control over financial reporting.
Item 9B. Other Information
None.
PART III
Item 10. Directors, Executive Officers and Corporate Governance
Information required by this item with respect to executive officers of the Company is included in Part I of this report and is incorporated herein by reference. Other information required by this item will be contained in the Company’s Proxy Statement for its 2014 Annual Meeting of Stockholders, which is expected to be filed with the Securities and Exchange Commission not later than 120 days after the Company’s 2014 fiscal year end and is incorporated herein by reference.
For the purpose of calculating the aggregate market value of the voting stock of Versar held by non-affiliates as shown on the cover page of this report, it has been assumed that the directors and executive officers of the Company and the Company’s 401(k) Plan are the only affiliates of the Company. However, this is not an admission that all such persons are, in fact, affiliates of the Company.
Item 11. Executive Compensation
Information required by this item is incorporated herein by reference to the Company’s Proxy Statement for its 2014 Annual Meeting of Stockholders, which is expected to be filed with the Commission not later than 120 days after the end of the Company’s 2014 fiscal year.
Item 12. Security Ownership of Certain Beneficial Owners and Management and Related Stockholder Matters
Information required by this item is incorporated herein by reference to the Company’s Proxy Statement for its 2014 Annual Meeting of Stockholders, which is expected to be filed with the Commission not later than 120 days after the end of the Company’s 2014 fiscal year.
| 53 |
Item 13. Certain Relationships and Related Transactions, and Director Independence
Information required by this item is incorporated herein by reference to the Company’s Proxy Statement for its 2014 Annual Meeting of Stockholders, which is expected to be filed with the Commission not later than 120 days after the end of the Company’s 2014 fiscal year.
Item 14. Principal Accountant Fees and Services
Information required by this item is incorporated herein by reference to the Company’s Proxy Statement for its 2014 Annual Meeting of Stockholders, which is expected to be filed with the Commission not later than 120 days after the end of the Company’s 2014 fiscal year.
PART IV
Item 15. Exhibits and Financial Statement Schedules
| (1) | Financial Statements: |
The following consolidated financial statements of Versar, Inc. and Subsidiaries are included as part of this report on Form 10-K in Item 8. Financial Statements and Supplementary Data.
| a) | Report of Independent Registered Public Accounting Firm |
| b) | Consolidated Balance Sheets as of June 27, 2014 and June 28, 2013 |
| c) | Consolidated Statements of Operations for the Years Ended June 27, 2014, June 28, 2013, and June 29, 2012. |
| d) | Consolidated Statements of Comprehensive Income (Loss) for the Years Ended June 27, 2014, June 28, 2013, and June 29, 2012. |
| e) | Consolidated Statements of Changes in Stockholders’ Equity for the Years Ended June 27, 2014, June 28, 2013, and June 29, 2012. |
| f) | Consolidated Statements of Cash Flows for the Years Ended June 27, 2014, June 28, 2013, and June 29, 2012. |
| g) | Notes to Consolidated Financial Statements |
| (2) | Financial Statement Schedules: |
| a) | Schedule II - Valuation and Qualifying Accounts for the Years Ended June 27, 2014, June 28, 2013, and June 29, 2012 |
All other schedules, except those listed above, are omitted because they are not applicable or the required information is shown in the consolidated financial statements or notes thereto.
| (3) | Exhibits: |
The exhibits to this Form 10-K are set forth in a separate Exhibit Index which is included on pages 55 through 58 of this report.
| 54 |
Exhibit Index
| Item No | Description | Reference | ||
| 3.1 | Restated Certificate of Incorporation of Versar, Inc. filed on September 25, 1986 | |||
| 3.2 |
Certificate of Amendment of Restated Certificate of Incorporation of Versar, Inc. filed on December 24, 1996 |
(B) | ||
| 3.3 | Certificate of Amendment of Restated Certificate of Incorporation of Versar, Inc. filed on January 26, 1999 | (C) | ||
| 3.4 | Second Amended and Restated By-laws of Versar, Inc. | (D) | ||
| 4 | Specimen of Certificate of Common Stock of Versar, Inc. | (A) | ||
| 4.1 | Versar, Inc. Restated Employee 401(k) Plan | (E) | ||
| 4.2 | Amendment to the Versar, Inc. Restated Employee 401(k) Plan implementing automatic enrollment unless the participant makes a contrary election | (E) | ||
| 4.3. | Amendment merging the Advent 401(k) Profit Sharing Plan and Trust to the Versar, Inc. Restated Employee 401(k) Plan | (E) | ||
| 4.4 | Amendment to the Versar, Inc. Restated Employee 401(k) Plan implementing 1% automatic annual increase of deferral amount to all participants under 6% deferral rate effective January 1, 2013 until it reached the maximum cap of 6% | (E) | ||
| 4.5 | Amendment to the Versar, Inc. Restated Employee 401(k) Plan excluding employees who are already eligible to participate in the Charron Construction Consulting, Inc. 401(k) Plan | (E) | ||
| 4.6 | Amendment to the Versar, Inc. Restated Employee 401(k) Plan adding Roth Deferrals in the Contribution types and merging the Charron Construction Consulting, Inc. 401(k) Plan with and into the Plan | (E) | ||
| 10.1 | Executive Tax and Investment Counseling Program | (A) | ||
| 10.2 | Form of Stock Option Agreement* | (I) | ||
| 10.3 | 2005 Stock Incentive Plan* | (G) | ||
| 10.4 | Form of Change in Control Severance Agreement dated March17, 2008 between Versar, Inc. and each of Michael Abram and Jeffrey A. Wagonhurst, Sr. (In reliance on instruction 2 to Item 601 of Regulation S-K, the Registrant has filed the form of Change of Control of Severance Agreement entered into with each of the individuals listed above)* | (P) | ||
| 10.5 | Form of Indemnification Agreement* | (K) | ||
| 10.6 | Share Purchase Agreement dated as of January 5, 2011 by and among Versar, Inc., GEOI I, Ltd., Professional Protection Systems, Ltd., Stephen Nobbs, Mark Whicher, Stephen Kimbell, Peter Holden, Timothy Clark, Jonathan Hambleton, Richard Brown, Simon Cuthbertson, Oliver Wright, Ingrid Sladden and the executors of the estate of Neil Bruce Cobb | (L) |
| 55 |
| 10.7 | Stock Purchase Agreement dated as of March 17, 2010 by and among Versar, Inc., ADVENT Environmental, Inc., Jeffrey C. Smoak, Kenna E. Sellers, the Mark A. Sellers Revocable Life Insurance Trust, through Margaret Mitchum Spicher, Trustree and the Mark A. Sellers Revocable Life Insurance Trust, through Kenna A. Sellers, Trustee | (K) | ||
| 10.8 | Separation and General Release Agreement between Theodore M. Prociv, PhD and Versar, Inc. effective March 25, 2010 | (M) | ||
| 10.9 | Change in Control Severance Agreement between Anthony L. Otten and Versar, Inc. effective as of May 24, 2011* | (H) | ||
| 10.10 | 2010 Stock Incentive Plan* | (N) | ||
| 10.10.1 | Form of Restricted Share Award Agreement* | (N) | ||
| 10.10.2 | Form of Performance Stock Award Agreement* | (N) | ||
| 10.10.3 | Form of Deferral Election Agreement for Deferred Share Units* | (N) | ||
| 10.10.4 | Form of Stock Option Award Agreement* | (N) | ||
| 10.10.5 | Form of Stock Appreciation Right Award Agreement* | (N) | ||
| 10.10.6 | Form of Restricted Stock Unit Award Agreement* | (N) | ||
| 10.11 | Change in Control Severance Agreement between Cynthia A. Downes and Versar, Inc. effective as of September 8, 2011* | (O) | ||
| 10.12 | Amendment to Change in Control Severance Agreement dated February 10, 2012 between Versar, Inc. and each of Michael Abram, Cynthia Downes, J. Joseph Tyler and Jeffrey A. Wagonhurst, Sr. (In reliance on instruction 2 to Item 601 of Regulation S-K, the Registrant has filed the form of Amendment to Change in Control Severance Agreement entered into with each of the individuals listed above)* | (F) | ||
| 10.13 | Amendment to Change in Control Severance Agreement dated March 9, 2012 between Versar, Inc. and Anthony L. Otten* | (F) | ||
| 10.14 | Versar, Inc. 2012 Long-Term Incentive Compensation Program* | (P) | ||
| 10.15 | Amended and Restated Loan and Security Agreement date September 14, 2012 between the Registrant, certain of the Registrant’s subsidiaries and United Bank | (F) | ||
| 10.16 | Amended and Restated Revolving Commercial Note dated September 14, 2012 | (F) | ||
| 10.17 | Change in Control Severance Agreement between Versar, Inc. and Anthony L. Otten | (Q) | ||
| 10.18 | Change in Control Severance Agreement between Versar, Inc. and Jeffrey A. Wagonhurst | (Q) | ||
| 10.19 | Change in Control Severance Agreement between Versar, Inc. and Cynthia A. Downes | (Q) |
| 56 |
| 10.20 | Change in Control Severance Agreement between Versar, Inc. and Joshua J. Izenberg | (Q) | ||
| 10.21 | Change in Control Severance Agreement between Versar, Inc. and J. Joseph Tyler | (Q) | ||
| 10.22 | Change in Control Severance Agreement between Versar, Inc. and Linda M. McKnight | (Q) | ||
| 10.23 | Change in Control Severance Agreement between Versar, Inc. and James D. Villa | (R) | ||
| 21 | Subsidiaries of the Registrant | |||
| 23 | Consent of Independent Registered Public Accounting Firm, Grant Thornton LLP | |||
| 31.1 | Certifications by Anthony L. Otten, Chief Executive Officer Pursuant to Securities Exchange Rule 13a-14 | |||
| 31.2 | Certifications by Cynthia A. Downes, Exec. Vice President, Chief Financial Officer and Treasurer pursuant to Securities Exchange Rule 13a-14 | |||
| 32.1 | Certifications Pursuant to 18 U.S.C. Section 1350, as adopted pursuant to Section 906 Of the Sarbanes-Oxley Act of 2002, for the period ending June 27, 2014 by Anthony L. Otten, Chief Executive Officer | |||
| 32.2 | Certifications Pursuant to 18 U.S.C. Section 1350, as adopted pursuant to Section 906 Of the Sarbanes-Oxley Act of 2002, for the period ending June 27, 2014 by Cynthina A. Downes, Exec. Vice President, Chief Financial Officer and Treasurer | |||
| 101+ | The following materials from Versar Inc.’s Annual Report on Form 10-K for the fiscal year ended June 27, 2014, formatted in XBRL (Extensible Business Reporting Language): (i) Consolidated Balance Sheets as of June 27, 2014, June 29, 2014; (ii) Consolidated Statements of Operations for the years ended June 29, 2012; (iii) Consolidated Statements of Comprehensive Income (Loss) for the years ended June 28, 2013 and June 29, 2012; (iv) Consolidated Statements of Changes in Stockholders’ Equity for the years ended June 28, 2013 and June 29, 2012; (v) Consolidated Statements of Cash Flows for the years ended June 27, 2014, June 29, 2012,; (vi) Schedule II — Valuation and Qualifying Accounts; and (vi) Notes to Consolidated Financial Statements, tagged as blocks of text |
* Indicates management contract or compensatory plan or arrangement.
| (A) | Incorporated by reference to the similarly numbered exhibit to the Registrant’s Form S-1 Registration Statement effective November 20, 1986. |
| (B) | Incorporated by reference to the document included within the Registrant’s Proxy Statement filed with the Commission on October 24, 1996. |
| (C) | Incorporated by reference to the document included within the Registrant’s Proxy Statement filed with the Commission on February 7, 1997. |
| 57 |
| (D) | Incorporated by reference to the exhibit to the Registrant’s Form 8-K filed with the Commission on February 17, 2010. |
| (E) | Incorporated by reference to exhibits 4.1 through 4.6 to the Registrant’s Form S-8 Registration Statement filed with the Commission on March 22, 2013. |
| (F) | Incorporated by reference to the corresponding exhibit number to the Registrant’s Form 10-K Annual Report for the fiscal year ended June 28, 2013 filed with the Commission on September 18, 2012. |
| (G) | Incorporated by reference to exhibits 10.117 and 10.118 to the Registrant’s Form 10-K Annual Report for Fiscal Year Ended June 30, 2006 filed with the Commission on September 19, 2006. |
| (H) | Incorporated by reference to exhibits 10.1 and 10.2 to the Registrant’s Form 10-Q filed with the Commission on November 8, 2010. |
| (I) | Incorporated by reference to exhibit 10.115 to the Registrant’s Form 10-K Annual Report for Fiscal Year Ended June 29, 2005 filed with the Commission on September 26, 2005. |
| (J) | Incorporated by reference to exhibit 10.1 to the Registrant’s Form 8-K filed with the Commission on April 7, 2008. |
| (K) | Incorporated by reference to exhibit 10.1 to the Registrant’s Form 8-K filed with the Commission on May 11, 2009. |
| (L) | Incorporated by reference to exhibit 10.1 to the Registrant’s Form 8-K filed with the Commission on January 8, 2010. |
| (M) | Incorporated by reference to exhibit 10.1 to the Registrant’s Form 8-K filed with the Commission on April 1, 2010. |
| (N) | Incorporated by reference to exhibits 4.1 through 4.7 to the Registrant’s Form S-8 filed with the Commission on February 15, 2011. |
| (O) | Incorporated by reference to exhibit 10.1 to the Registrant’s Form 8-K filed with the Commission on September 13, 2011. |
| (P) | Incorporated by reference to exhibit 10.1 to the Registrant’s Form 8-K filed with the Commission on May 9, 2012. |
| (Q) | Incorporated by reference to exhibits 10.35 through 10.40 to the Registrant’s Form 8-K filed with the Commission on September 18, 2013. |
| (R) | Incorporated by reference to exhibit 10.1 to the Registrant’s Form 8-K filed with the Commission on May 14, 2014. |
| 58 |
SIGNATURES
Pursuant to the requirements of Section 13 or 15(d) of the Securities Exchange Act of 1934, the registrant has duly caused this report to be signed on its behalf by the undersigned, thereunto duly authorized.
| VERSAR, INC. | ||
| (Registrant) | ||
| Date: September 10, 2014 | /S/ Paul J. Hoeper | |
| Paul J. Hoeper | ||
| Chairman and Director |
| 59 |
Pursuant to the requirements of the Securities Exchange Act of 1934, this report has been signed below by the following persons on behalf of the registrant in the capacities and on the dates indicated.
| SIGNATURES | TITLE | DATE | ||
| /S/ Paul J. Hoeper | Chairman and Director | September 10, 2014 | ||
| Paul J. Hoeper | ||||
| /S/ Anthony L. Otten | Chief Executive Officer and Director | September 10, 2014 | ||
| Anthony L. Otten | ||||
| /S/ Cynthia A. Downes | Executive Vice President, | September 10, 2014 | ||
| Cynthia A. Downes | Chief Financial Officer, Treasurer, | |||
| and Principal Accounting Officer | ||||
| /S/ Ruth I. Dreessen | Director | September 10, 2014 | ||
| Ruth I. Dreessen | ||||
| /S/ Robert L. Durfee | Director | September 10, 2014 | ||
| Robert L. Durfee | ||||
| /S/ James L. Gallagher | Director | September 10, 2014 | ||
| James L. Gallagher | ||||
| /S/ Amoretta M. Hoeber | Director | September 10, 2014 | ||
| Amoretta M. Hoeber | ||||
| /S/ Amir A. Metry | Director | September 10, 2014 | ||
| Amir A. Metry | ||||
| /S/ Jeffrey A. Wagonhurst | Director | September 10, 2014 | ||
| Jeffrey A. Wagonhurst, Sr. |
| 60 |
Schedule II
VERSAR, INC. AND SUBSIDIARIES
Valuation and Qualifying Accounts
| ADDITIONS | ||||||||||||||||
| CHARGED | ||||||||||||||||
| BALANCE AT | TO COSTS | |||||||||||||||
| BEGINNING | AND | CHARGE | BALANCE AT | |||||||||||||
| OF YEAR | EXPENSES | OFFS | END OF YEAR | |||||||||||||
| Allowance for Doubtful Accounts: | ||||||||||||||||
| 2014 | $ | 1,529,000 | $ | 340,000 | $ | (1,226,000 | ) | $ | 643,000 | |||||||
| 2013 | $ | 1,468,000 | $ | 584,000 | $ | (523,000 | ) | $ | 1,529,000 | |||||||
2012 | $ | 840,000 | $ | 1,019,000 | $ | (391,000 | ) | $ | 1,468,000 | |||||||
| Deferred Tax Valuation Allowance: | ||||||||||||||||
| 2014 | $ | 167,000 | $ | 428,000 | $ | — | $ | 595,000 | ||||||||
| 2013 | $ | 58,000 | $ | 109,000 | $ | — | $ | 167,000 | ||||||||
| 2012 | $ | 55,000 | $ | 3000 | $ | — | $ | 58,000 | ||||||||
| 61 |