Attached files
| file | filename |
|---|---|
| 8-K - 8-K - CubeSmart | a14-20716_18k.htm |
Exhibit 99.1
|
|
Investor Presentation September 2014 |

|
|
Safe Harbor Statement 2 The forward-looking statements contained in this presentation are subject to various risks and uncertainties. Although the Company believes the expectations reflected in such forward-looking statements are based on reasonable assumptions, there can be no assurance that its expectations will be achieved. You should not rely on our forward-looking statements because the matters they describe are subject to known and unknown risks and uncertainties that could cause the Company’s future results, performance, or achievements to differ significantly from the results, performance, or achievements expressed or implied by such statements. Such risks are set forth under the captions “Item 1A. Risk Factors” and “Forward-Looking Statements” in our annual report on Form 10-K and under the caption “Item 2. Management’s Discussion and Analysis of Financial Condition and Results of Operations” (or similar captions) in our quarterly reports on Form 10-Q, and described from time to time in the Company’s filings with the SEC. Forward-looking statements are not guarantees of performance. For forward-looking statements herein, the Company claims the protection of the safe harbor for forward-looking statements contained in the Private Securities Litigation Reform Act of 1995. The Company assumes no obligation to update or supplement forward-looking statements that become untrue because of subsequent events. |
|
|
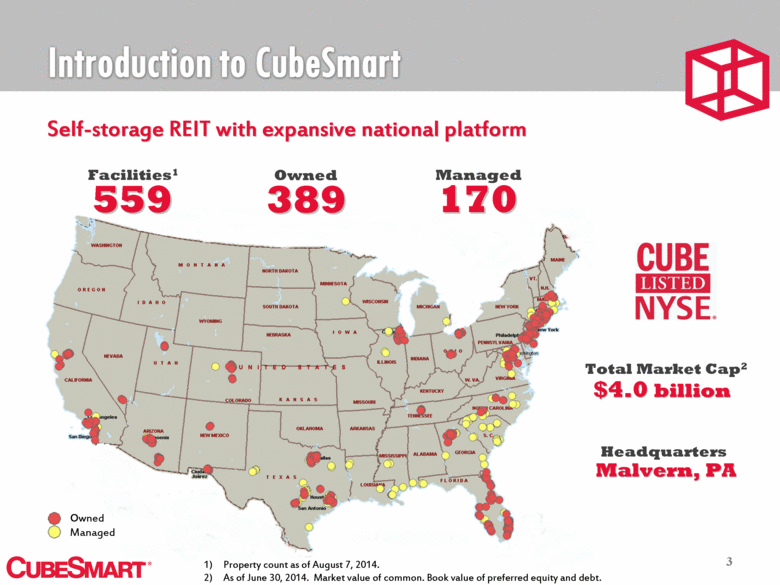
Introduction to CubeSmart Malvern, PA 3 Self-storage REIT with expansive national platform Property count as of August 7, 2014. As of June 30, 2014. Market value of common. Book value of preferred equity and debt. 389 559 170 Facilities1 Owned Managed Headquarters $4.0 billion Total Market Cap2 Owned Managed |
|
|
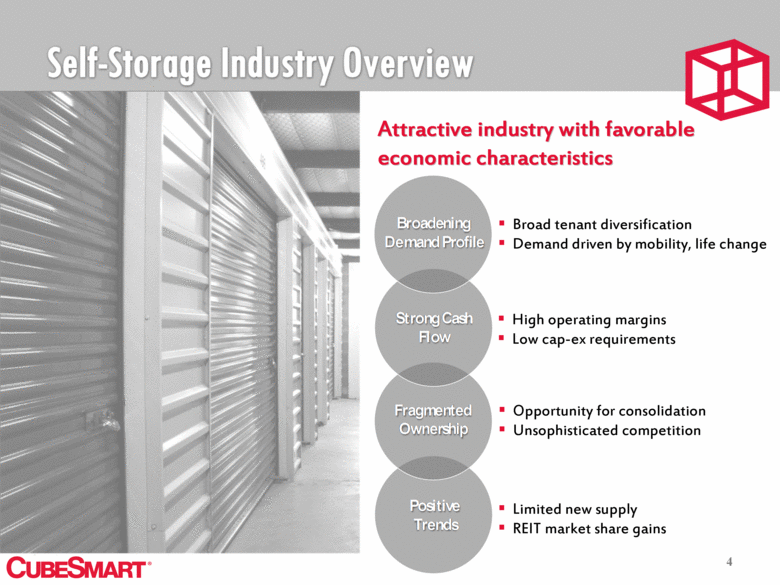
Self-Storage Industry Overview 4 Broad tenant diversification Demand driven by mobility, life change Opportunity for consolidation Unsophisticated competition High operating margins Low cap-ex requirements Attractive industry with favorable economic characteristics Limited new supply REIT market share gains Positive Trends Strong Cash Flow Fragmented Ownership |
|
|
Long-Term Vision for Value Creation 5 A balanced and disciplined approach External Growth Financial Strength Internal Growth Maximize portfolio value through continued focus on customer service and operational advancement Continue to prudently build a portfolio of high-quality assets, with a focus on targeted markets Objective of obtaining Baa2/BBB investment grade balance sheet that affords broad access to the full array of capital sources |

|
|
2014 Year-to-Date Highlights 6 Executing on strategic objectives Same-Store Results (YTD1): NOI3 +9.4% Revenue +7.3% Expenses +3.2% NOI Margin 68% (+120 bps) FFO/Share Growth4 +21% $247 million in acquisitions2 Amended agreement on $100 million term loan to improve pricing & extend term 20 new third-party management contracts2 $42 million in new development openings2 $126 million in “at-the-market” equity offering proceeds1 Investment grade balance sheet: Baa3/BBB- Financial data from January 1, 2014 through June 30, 2014. Financial data from January 1, 2014 through the Company’s second quarter Earnings Release August 7, 2014. Net operating income, or revenues less property operating expenses. Please refer to CubeSmart’s public filings for a detailed explanation of NOI and how it reconciles to a GAAP measure. Funds from operations, as adjusted. Please refer to CubeSmart’s public filings for a detailed explanation of FFO and how it reconciles to a GAAP measure. External Growth Financial Strength Internal Growth |

|
|
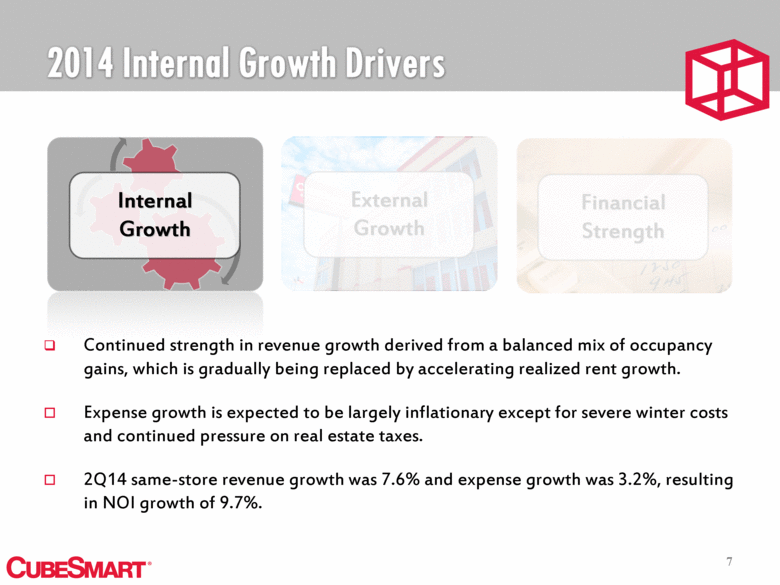
2014 Internal Growth Drivers 7 External Growth Financial Strength Internal Growth Continued strength in revenue growth derived from a balanced mix of occupancy gains, which is gradually being replaced by accelerating realized rent growth. Expense growth is expected to be largely inflationary except for severe winter costs and continued pressure on real estate taxes. 2Q14 same-store revenue growth was 7.6% and expense growth was 3.2%, resulting in NOI growth of 9.7%. |
|
|
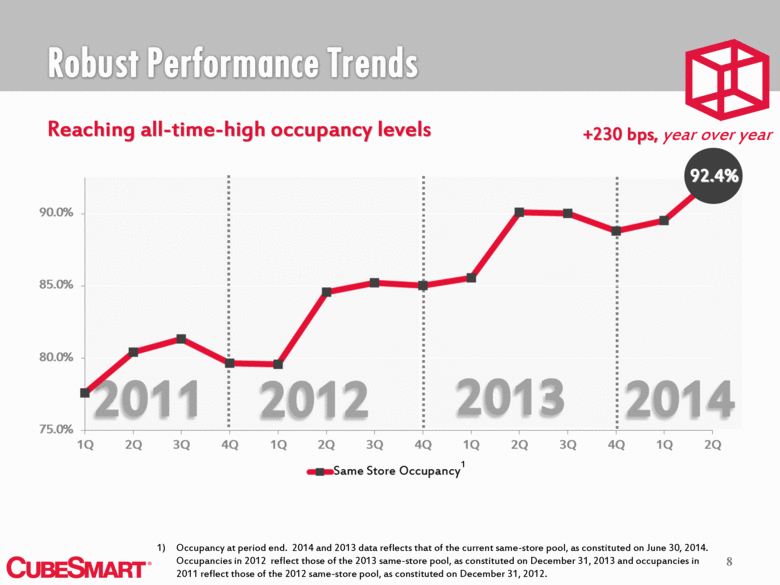
Robust Performance Trends Occupancy at period end. 2014 and 2013 data reflects that of the current same-store pool, as constituted on June 30, 2014. Occupancies in 2012 reflect those of the 2013 same-store pool, as constituted on December 31, 2013 and occupancies in 2011 reflect those of the 2012 same-store pool, as constituted on December 31, 2012. Reaching all-time-high occupancy levels 8 1 +230 bps, year over year 92.4% |
|
|
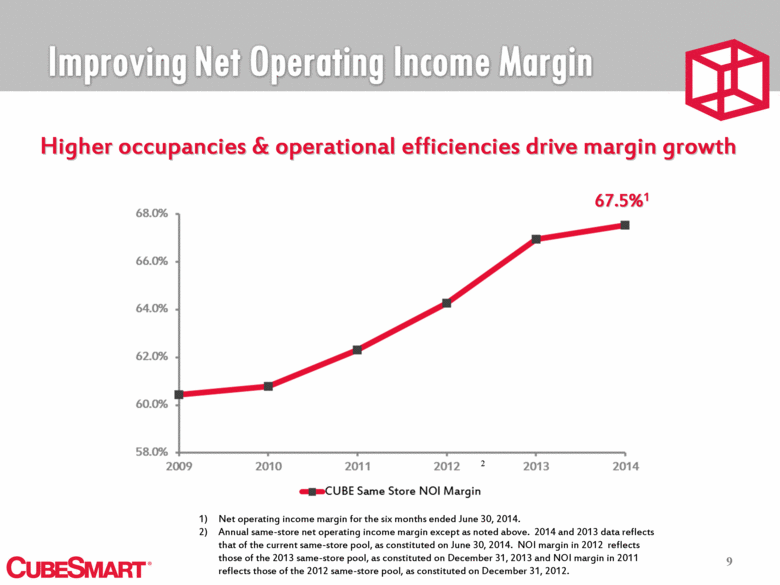
Improving Net Operating Income Margin Higher occupancies & operational efficiencies drive margin growth 9 67.5%1 Net operating income margin for the six months ended June 30, 2014. Annual same-store net operating income margin except as noted above. 2014 and 2013 data reflects that of the current same-store pool, as constituted on June 30, 2014. NOI margin in 2012 reflects those of the 2013 same-store pool, as constituted on December 31, 2013 and NOI margin in 2011 reflects those of the 2012 same-store pool, as constituted on December 31, 2012. 2 |
|
|
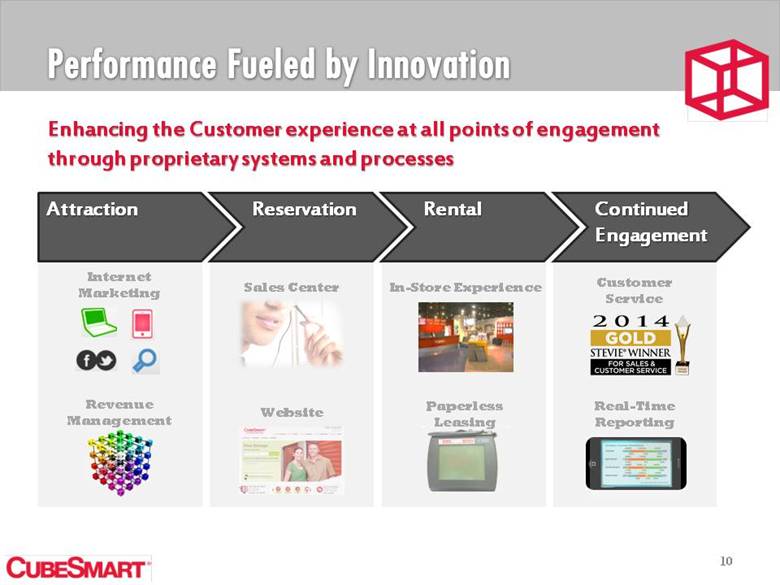
Performance Fueled by Innovation 10 Enhancing the Customer experience at all points of engagement through proprietary systems and processes Reservation Attraction Rental Continued Engagement Sales Center Real-Time Reporting Paperless Leasing In-Store Experience Internet Marketing Revenue Management Website Customer Service |
|
|
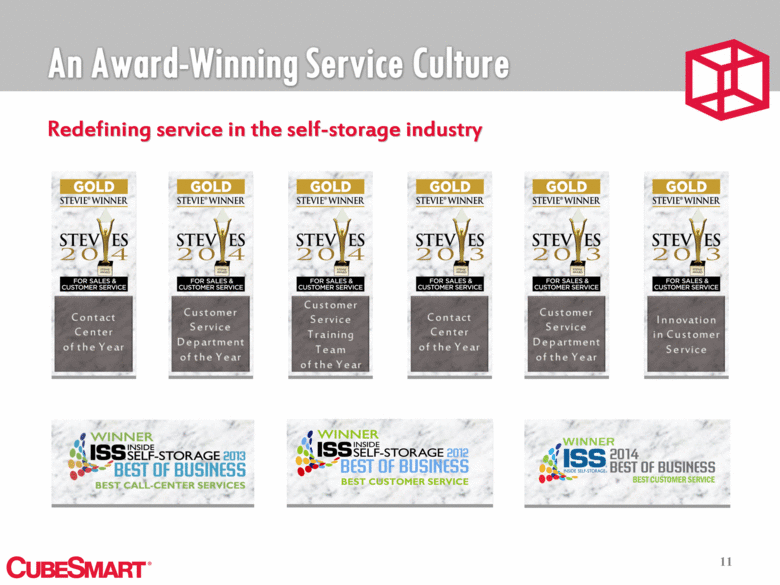
An Award-Winning Service Culture 11 Redefining service in the self-storage industry |
|
|
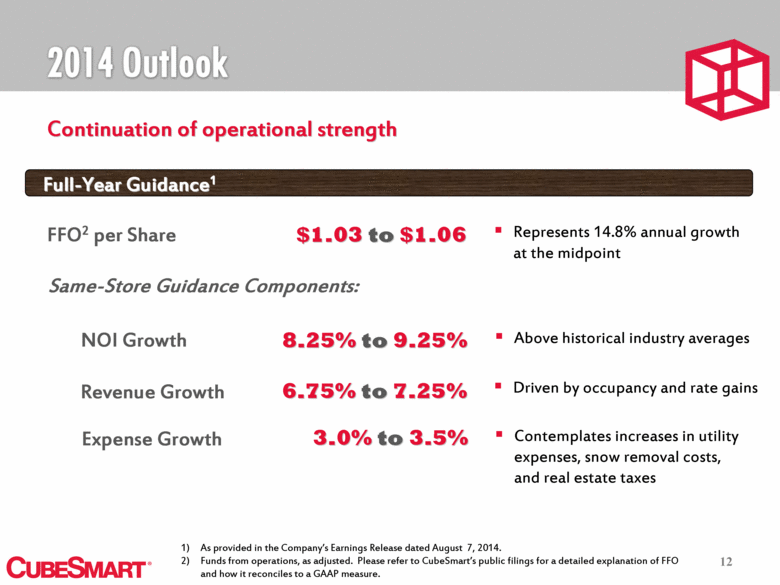
2014 Outlook Continuation of operational strength Full-Year Guidance1 $1.03 to $1.06 FFO2 per Share 8.25% to 9.25% NOI Growth 6.75% to 7.25% Revenue Growth 3.0% to 3.5% Expense Growth Same-Store Guidance Components: Represents 14.8% annual growth at the midpoint Driven by occupancy and rate gains Contemplates increases in utility expenses, snow removal costs, and real estate taxes Above historical industry averages As provided in the Company’s Earnings Release dated August 7, 2014. Funds from operations, as adjusted. Please refer to CubeSmart’s public filings for a detailed explanation of FFO and how it reconciles to a GAAP measure. 12 |
|
|
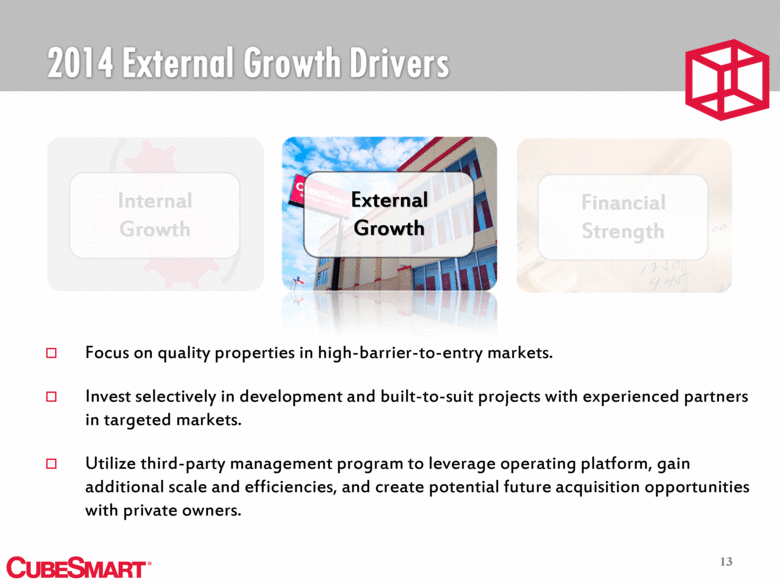
2014 External Growth Drivers 13 External Growth Financial Strength Internal Growth Focus on quality properties in high-barrier-to-entry markets. Invest selectively in development and built-to-suit projects with experienced partners in targeted markets. Utilize third-party management program to leverage operating platform, gain additional scale and efficiencies, and create potential future acquisition opportunities with private owners. |
|
|
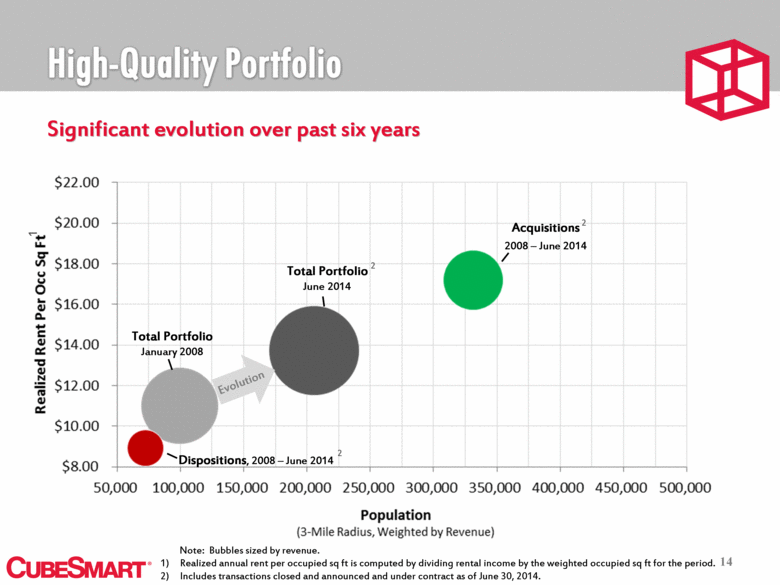
High-Quality Portfolio Evolution 14 Significant evolution over past six years Note: Bubbles sized by revenue. Realized annual rent per occupied sq ft is computed by dividing rental income by the weighted occupied sq ft for the period. Includes transactions closed and announced and under contract as of June 30, 2014. Total Portfolio January 2008 Total Portfolio June 2014 Acquisitions 2008 – June 2014 Dispositions, 2008 – June 2014 1 2 2 2 Realized Rent Per Occ Sq Ft1 Population (3 Mile Radius, Weighted by Revenue) |
|
|
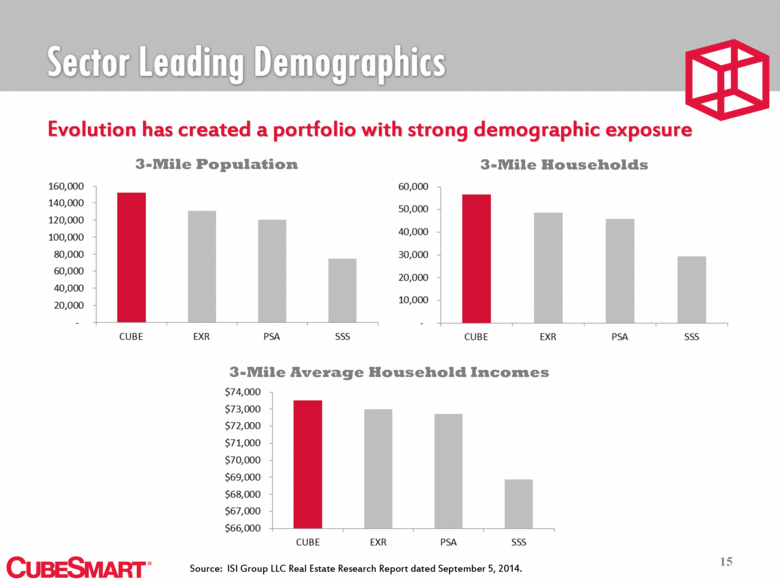
Sector leading Demographics 15 Evolution has created a portfolio with strong demographic exposure 3-Mile Population 3-Mile Households 3-Mile Average Household Incomes Source: ISI Group LLC Real Estate Research Report dated September 5, 2014. |
|
|
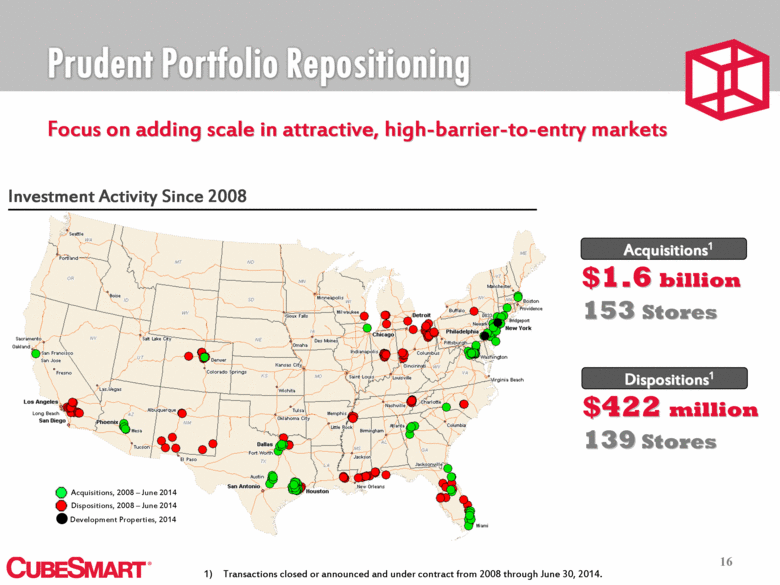
Prudent Portfolio Repositioning Acquisitions 1 16 Focus on adding scale in attractive, high-barrier-to-entry markets Investment Activity Since 2008 $1.6 billion 153 Stores Transactions closed or announced and under contract from 2008 through June 30, 2014. Dispositions1 $422 million 139 Stores Acquisitions, 2008 – June 2014 Dispositions, 2008 – June 2014 Development Properties, 2014 |
|
|
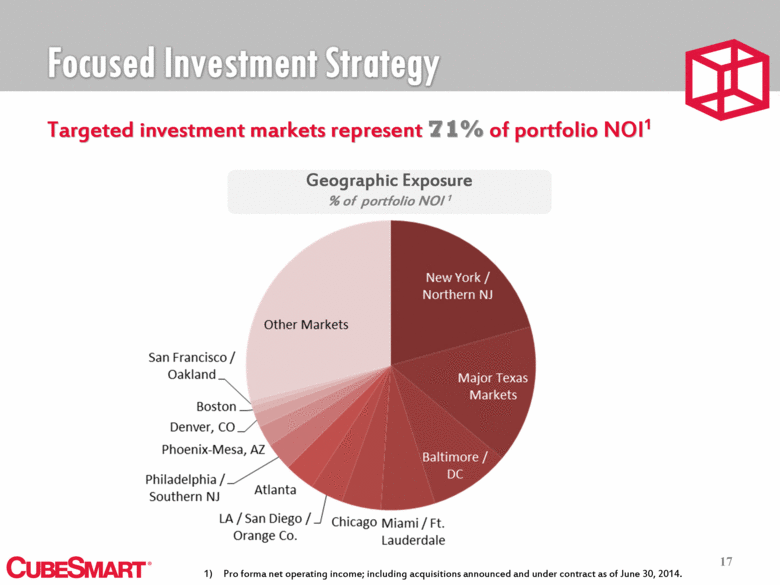
Focused Investment Strategy Geographic Exposure % of portfolio NOI 1 Pro forma net operating income; including acquisitions announced and under contract as of June 30, 2014. 17 Targeted investment markets represent 71% of portfolio NOI1 |
|
|
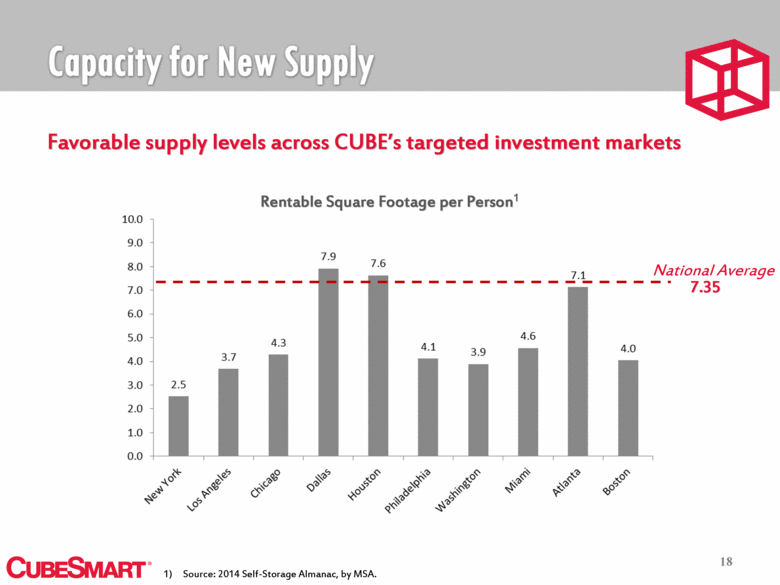
Capacity for New Supply Favorable supply levels across CUBE’s targeted investment markets 18 Source: 2014 Self-Storage Almanac, by MSA. National Average Rentable Square Footage per Person1 7.35 |
|
|
Value Creation Pipeline Opportunistic development in high-barrier-to-entry markets Note: all dollar amounts are in thousands Represents 100% of estimated CubeSmart investment. These facilities are expected to be purchased upon completion and are subject to due diligence and other customary closing conditions. No assurance can be provided that these acquisitions will be completed on the terms described, or at all. 19 2 1 Facility Acquisitions at C/O Expected Opening Contract Price Long Island City, NY Q3 2014 38,000 $ Dallas, TX Q2 2015 15,800 Brooklyn, NY Q2 2015 48,500 Total 102,300 $ New JV Development Facilities Expected Opening CUBE's Investment to-date CUBE's Anticipated Total Investment Arlington, VA Q1 2015 7,682 $ 18,062 $ Brooklyn, NY Q1 2015 3,794 10,712 Queens, NY Q2 2015 4,966 19,011 Queens, NY Q3 2015 7,065 32,100 23,507 $ 79,885 $ As of June 30, 2014 |

|
|
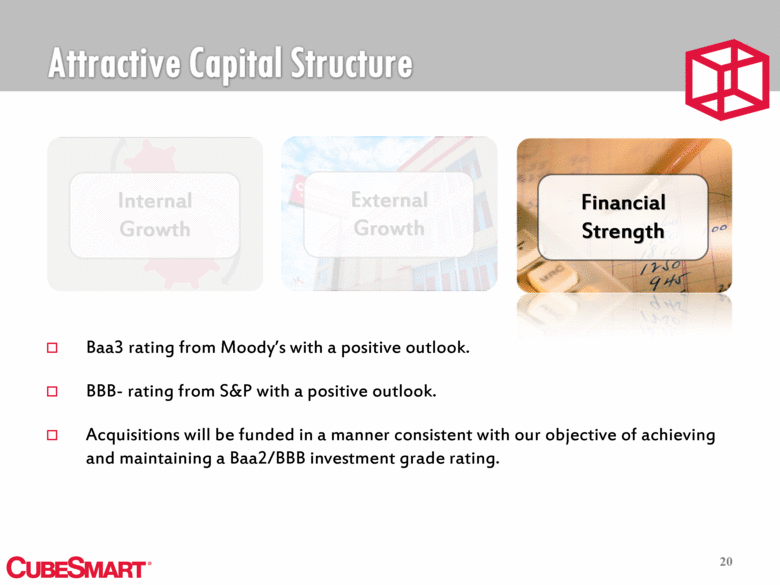
Attractive Capital Structure 20 External Growth Financial Strength Internal Growth Baa3 rating from Moody’s with a positive outlook. BBB- rating from S&P with a positive outlook. Acquisitions will be funded in a manner consistent with our objective of achieving and maintaining a Baa2/BBB investment grade rating. |
|
|
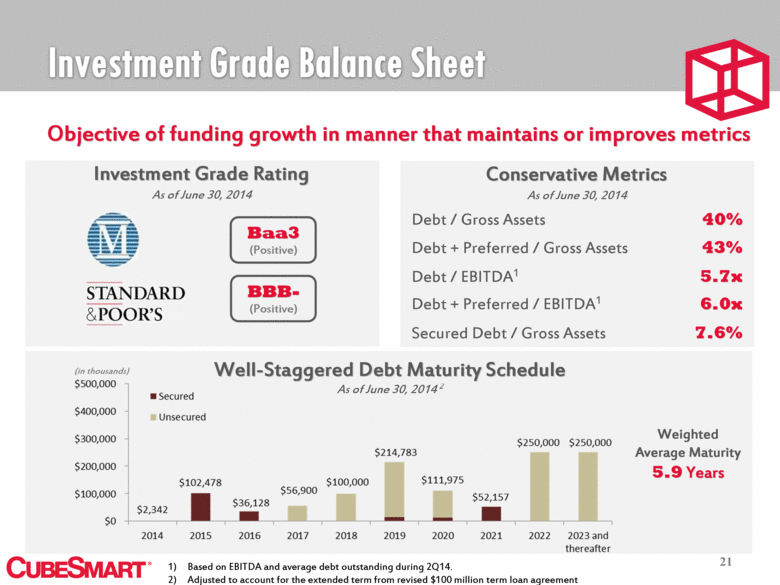
Investment Grade Balance Sheet 21 Objective of funding growth in manner that maintains or improves metrics Investment Grade Rating As of June 30, 2014 Conservative Metrics 40% Debt / Gross Assets 43% Debt + Preferred / Gross Assets 5.7x Debt / EBITDA1 6.0x Debt + Preferred / EBITDA1 7.6% Secured Debt / Gross Assets As of June 30, 2014 BBB- (Positive) Baa3 (Positive) Well-Staggered Debt Maturity Schedule As of June 30, 2014 2 Weighted Average Maturity 5.9 Years (in thousands) Based on EBITDA and average debt outstanding during 2Q14. Adjusted to account for the extended term from revised $100 million term loan agreement |
|
|
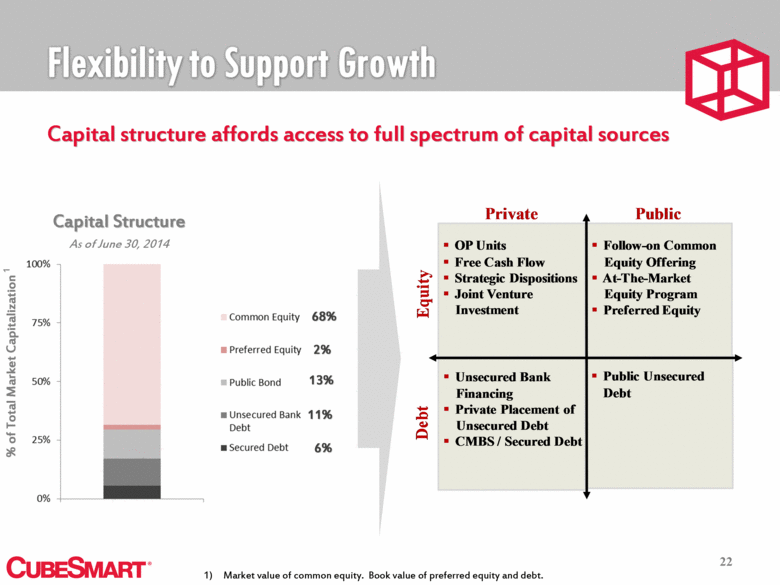
Flexibility to Support Growth 22 Capital structure affords access to full spectrum of capital sources Capital Structure As of June 30, 2014 68% 2% 11% 6% 13% % of Total Market Capitalization 1 Market value of common equity. Book value of preferred equity and debt. Free Cash Flow Private Public Equity Debt § OP Units § Free Cash Flow § Strategic Dispositions § Joint Venture Investment § Unsecured Bank Financing § Private Placement of Unsecured Debt § CMBS / Secured Debt § Follow - on Common Equity Offering § At - The - Market Equity Program § Preferred Equity § Public Unsecured Debt |
|
|
Summary Limited new supply, a widening competitive divide between large and small operators, and continuing industry consolidation Robust organic growth fueled by a focus on customer service and continued enhancement of operational infrastructure Meaningful external growth through a disciplined investment process and a competitive and expanding third party management platform Strategic growth objectives are supported by a healthy, investment grade balance sheet and access to a broad array of capital sources 23 |
|
|
Date Investor Relations Contact Charles Place Director, Investor Relations 5 Old Lancaster Rd. Malvern, PA 19355 610.535.5700 cplace@cubesmart.com |
