Attached files
| file | filename |
|---|---|
| 8-K - FORM 8-K - US BANCORP \DE\ | d784793d8k.htm |
Exhibit 99.1
| Barclays 2014 Global Financial Services Conference September 9, 2014 Richard K. Davis Chairman, President and Chief Executive Officer |
| Forward-looking Statements and Additional Information The following information appears in accordance with the Private Securities Litigation Reform Act of 1995: This presentation contains forward-looking statements about U.S. Bancorp. Statements that are not historical or current facts, including statements about beliefs and expectations, are forward-looking statements and are based on the information available to, and assumptions and estimates made by, management as of the date made. These forward-looking statements cover, among other things, anticipated future revenue and expenses and the future plans and prospects of U.S. Bancorp. Forward-looking statements involve inherent risks and uncertainties, and important factors could cause actual results to differ materially from those anticipated. A reversal or slowing of the current moderate economic recovery or another severe contraction could adversely affect U.S. Bancorp's revenues and the values of its assets and liabilities. Global financial markets could experience a recurrence of significant turbulence, which could reduce the availability of funding to certain financial institutions and lead to a tightening of credit, a reduction of business activity, and increased market volatility. Continued stress in the commercial real estate markets, as well as a delay or failure of recovery in the residential real estate markets, could cause additional credit losses and deterioration in asset values. In addition, U.S. Bancorp's business and financial performance is likely to be negatively impacted by recently enacted and future legislation and regulation. U.S. Bancorp's results could also be adversely affected by deterioration in general business and economic conditions; changes in interest rates; deterioration in the credit quality of its loan portfolios or in the value of the collateral securing those loans; deterioration in the value of securities held in its investment securities portfolio; legal and regulatory developments; increased competition from both banks and non-banks; changes in customer behavior and preferences; effects of mergers and acquisitions and related integration; effects of critical accounting policies and judgments; and management's ability to effectively manage credit risk, residual value risk, market risk, operational risk, compliance risk, strategic risk, interest rate risk, liquidity risk and reputational risk. For discussion of these and other risks that may cause actual results to differ from expectations, refer to U.S. Bancorp's Annual Report on Form 10-K for the year ended December 31, 2013, on file with the Securities and Exchange Commission, including the sections entitled "Risk Factors" and "Corporate Risk Profile" contained in Exhibit 13, and all subsequent filings with the Securities and Exchange Commission under Sections 13(a), 13(c), 14 or 15(d) of the Securities Exchange Act of 1934. Forward-looking statements speak only as of the date they are made, and U.S. Bancorp undertakes no obligation to update them in light of new information or future events. This presentation includes non-GAAP financial measures to describe U.S. Bancorp's performance. The calculations of those measures are provided in the appendix of the presentation. These disclosures should not be viewed as a substitute for operating results determined in accordance with GAAP, nor are they necessarily comparable to non-GAAP performance measures that may be presented by other companies. |
| Agenda Overview Financial Management Capital Management 3Q14 Update Long-term Goals |
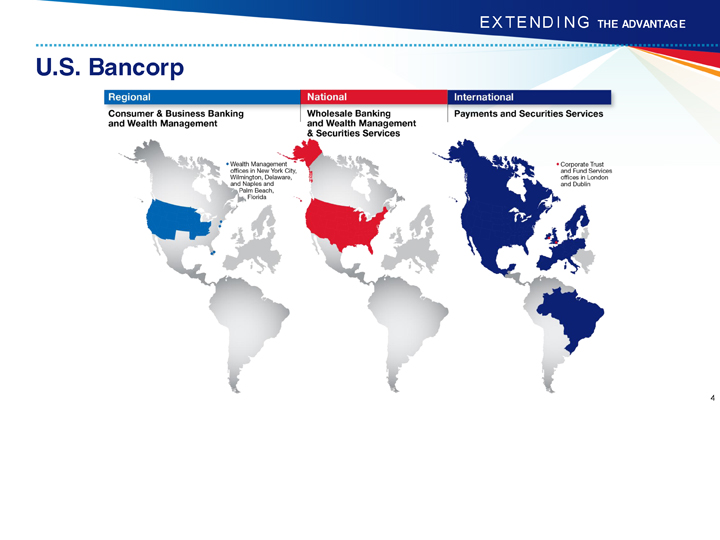
| U.S. Bancorp |
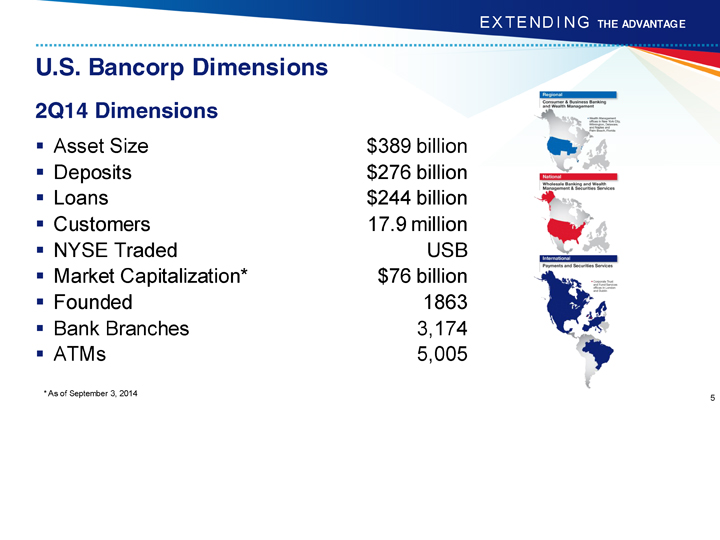
| U.S. Bancorp Dimensions 2Q14 Dimensions Asset Size $389 billion Deposits $276 billion Loans $244 billion Customers 17.9 million NYSE Traded USB Market Capitalization* $76 billion Founded 1863 Bank Branches 3,174 ATMs 5,005 * As of September 3, 2014 |
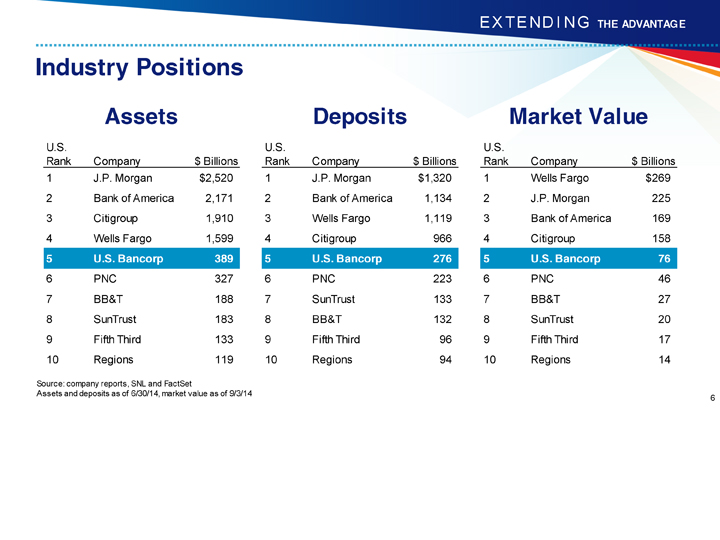
| Industry Positions Source: company reports, SNL and FactSet Assets and deposits as of 6/30/14, market value as of 9/3/14 |
| Agenda Overview Financial Management Capital Management 3Q14 Update Long-term Goals |
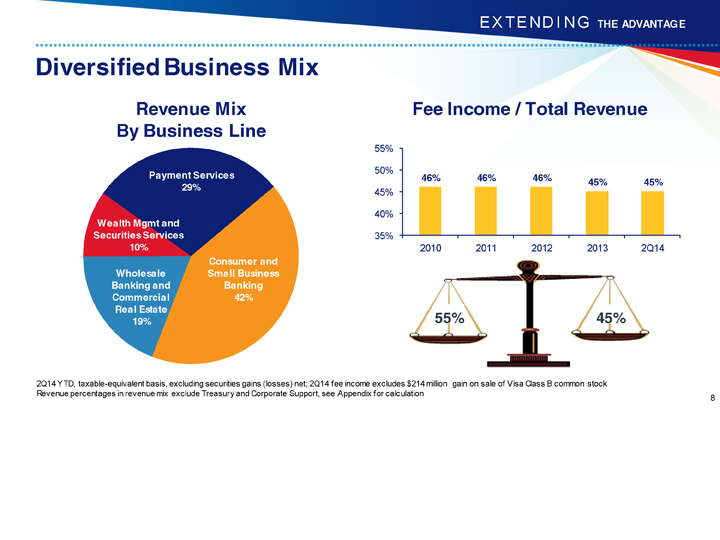
| Diversified Business Mix 2Q14 YTD, taxable-equivalent basis, excluding securities gains (losses) net; 2Q14 fee income excludes $214 million gain on sale of Visa Class B common stock Revenue percentages in revenue mix exclude Treasury and Corporate Support, see Appendix for calculation Revenue Mix By Business Line (CHART) Consumer and Small Business Banking 42% Payment Services 29% Wealth Mgmt and Securities Services 10% Wholesale Banking and Commercial Real Estate 19% Fee Income / Total Revenue (CHART) 55% 45% |
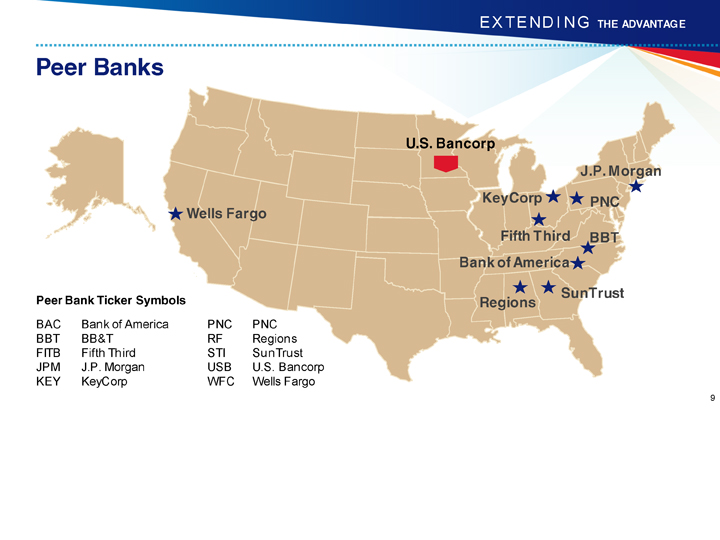
| Peer Banks Peer Bank Ticker Symbols BAC Bank of America PNC PNC BBT BB&T RF Regions FITB Fifth Third STI SunTrust JPM J.P. Morgan USB U.S. Bancorp KEY KeyCorp WFC Wells Fargo Bank of America SunTrust Wells Fargo KeyCorp BBT Fifth Third Regions PNC J.P. Morgan U.S. Bancorp |
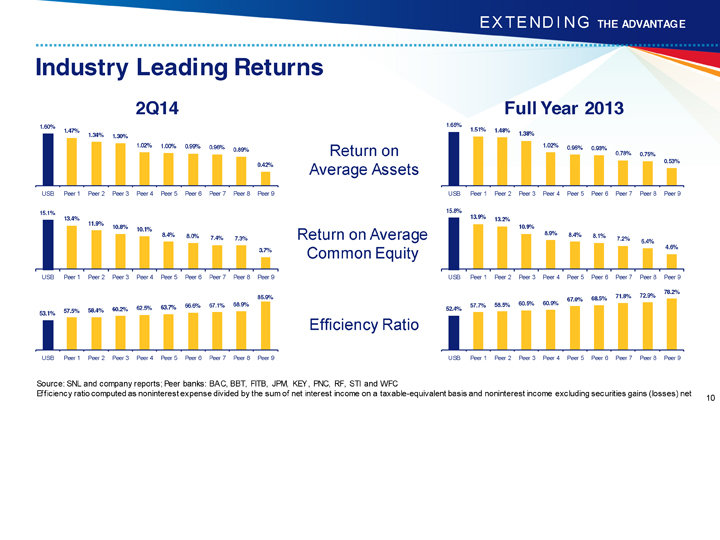
| Industry Leading Returns 2Q14 Full Year 2013 Source: SNL and company reports; Peer banks: BAC, BBT, FITB, JPM, KEY, PNC, RF, STI and WFC Efficiency ratio computed as noninterest expense divided by the sum of net interest income on a taxable-equivalent basis and noninterest income excluding securities gains (losses) net Return on Average Assets Return on Average Common Equity Efficiency Ratio (CHART) (CHART) (CHART) (CHART) (CHART) (CHART) |
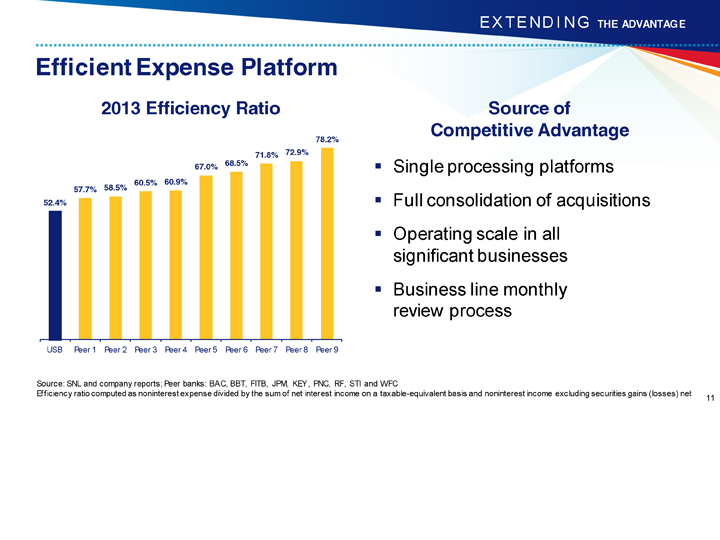
| Efficient Expense Platform 2013 Efficiency Ratio Source of Competitive Advantage Single processing platforms Full consolidation of acquisitions Operating scale in all significant businesses Business line monthly review process Source: SNL and company reports; Peer banks: BAC, BBT, FITB, JPM, KEY, PNC, RF, STI and WFC Efficiency ratio computed as noninterest expense divided by the sum of net interest income on a taxable-equivalent basis and noninterest income excluding securities gains (losses) net (CHART) |
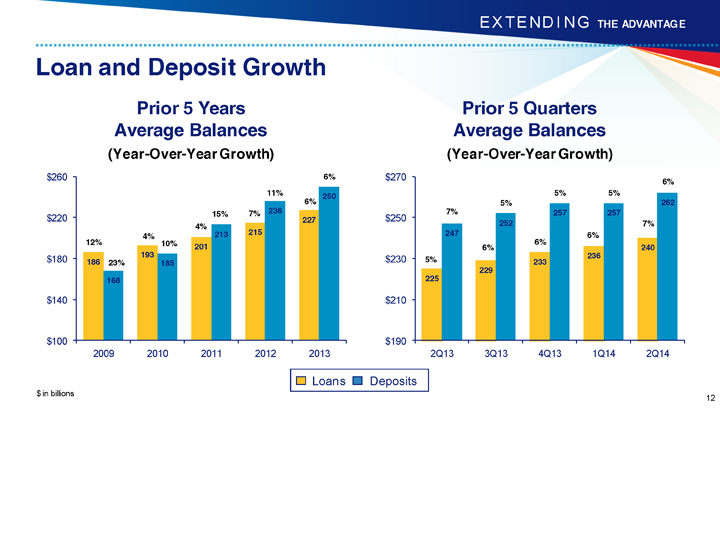
| Loan and Deposit Growth Prior 5 Years Average Balances (Year-Over-Year Growth) Prior 5 Quarters Average Balances (Year-Over-Year Growth) $ in billions Loans Deposits (CHART) (CHART) 7% 7% 6% 6% 5% 5% 5% 5% 6% 4% 7% 6% 12% 4% 15% 11% 6% 23% 10% 6% |
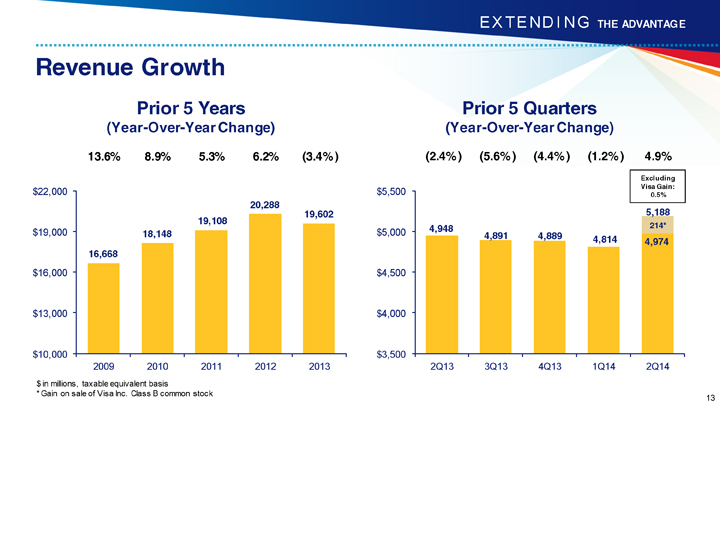
| (CHART) Prior 5 Years (Year-Over-Year Change) Prior 5 Quarters (Year-Over-Year Change) $ in millions, taxable equivalent basis * Gain on sale of Visa Inc. Class B common stock (CHART) (2.4%) (5.6%) (4.4%) (1.2%) 4.9% 13.6% 8.9% 5.3% 6.2% (3.4%) Excluding Visa Gain: 0.5% Revenue Growth 4,974 |
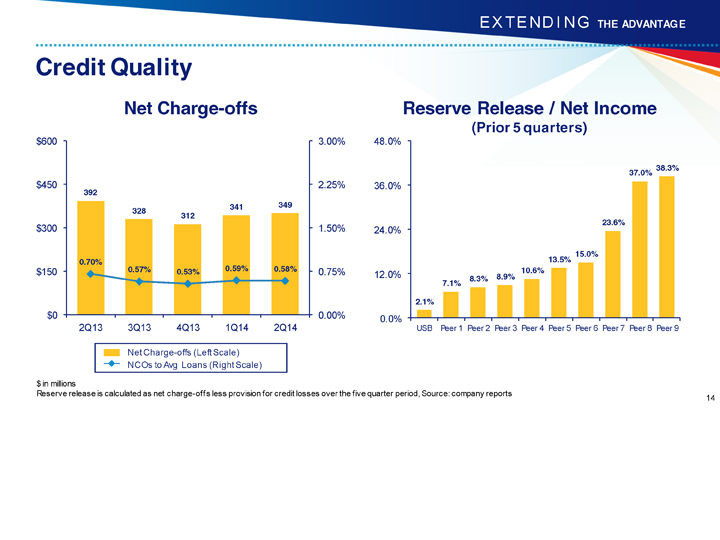
| Credit Quality Net Charge-offs Reserve Release / Net Income (Prior 5 quarters) $ in millions Reserve release is calculated as net charge-offs less provision for credit losses over the five quarter period, Source: company reports Net Charge-offs (Left Scale) NCOs to Avg Loans (Right Scale) (CHART) (CHART) |
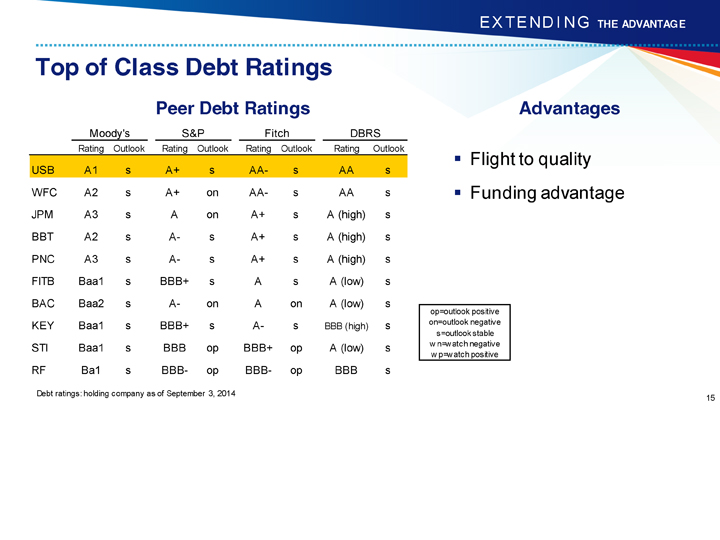
| Top of Class Debt Ratings Peer Debt Ratings Advantages Flight to quality Funding advantage Debt ratings: holding company as of September 3, 2014 op=outlook positive on=outlook negative s=outlook stable wn=watch negative wp=watch positive |
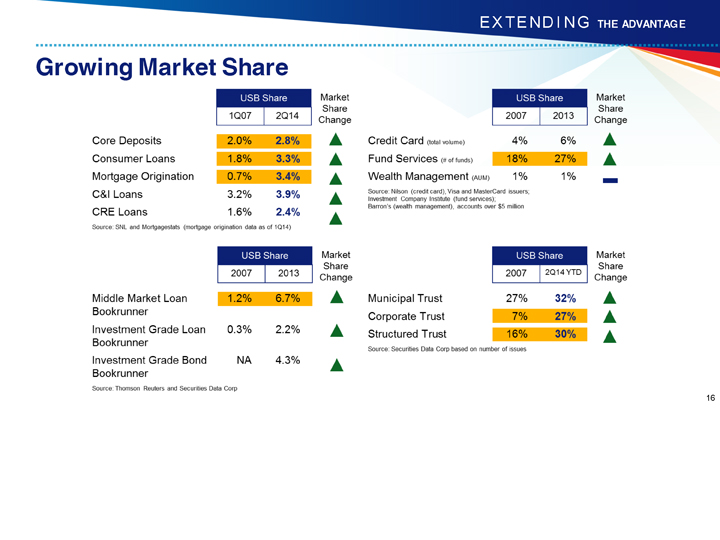
| Growing Market Share |
| Agenda Overview Financial Management Capital Management 3Q14 Update Long-term Goals |
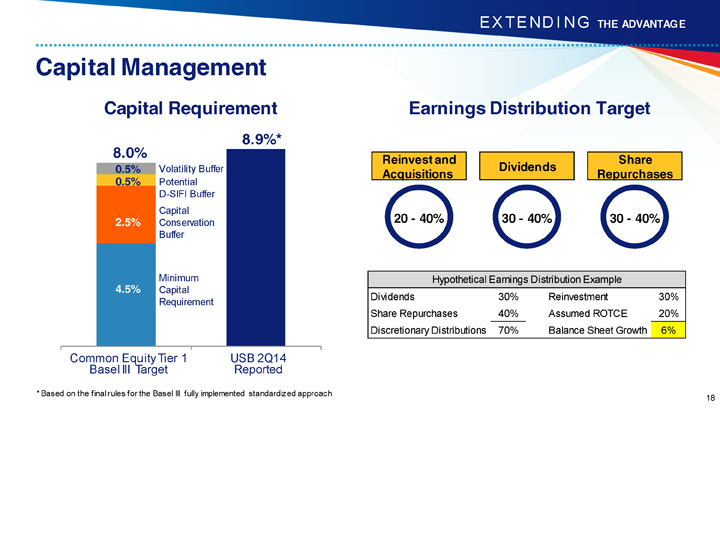
| Capital Management Capital Requirement Earnings Distribution Target * Based on the final rules for the Basel III fully implemented standardized approach 0.5% Potential D-SIFI Buffer 2.5% Capital Conservation Buffer 4.5% Minimum Capital Requirement 8.9%* Common Equity Tier 1 Basel III Target USB 2Q14 Reported Reinvest and Acquisitions Dividends Share Repurchases 20 - 40% 30 - 40% 30 - 40% |
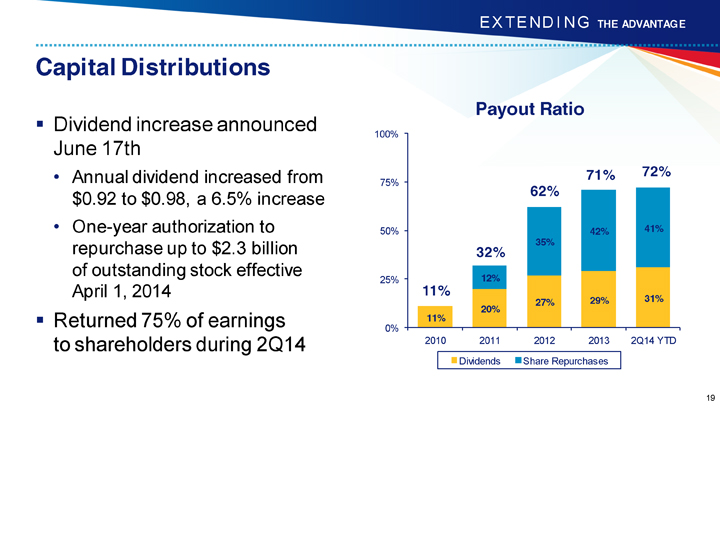
| Capital Distributions Dividend increase announced June 17th Annual dividend increased from $0.92 to $0.98, a 6.5% increase One-year authorization to repurchase up to $2.3 billion of outstanding stock effective April 1, 2014 Returned 75% of earnings to shareholders during 2Q14 (CHART) 62% 11% 32% Payout Ratio 71% 72% |
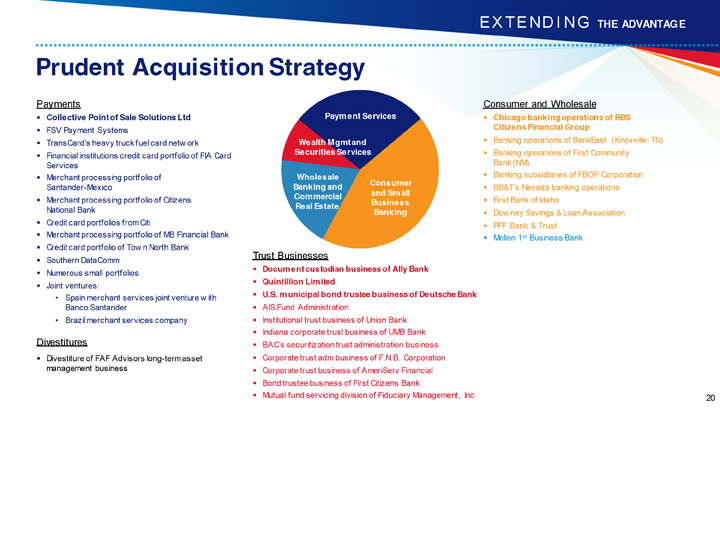
| Prudent Acquisition Strategy (CHART) Payments Collective Point of Sale Solutions Ltd FSV Payment Systems TransCard's heavy truck fuel card network Financial institutions credit card portfolio of FIA Card Services Merchant processing portfolio of Santander-Mexico Merchant processing portfolio of Citizens National Bank Credit card portfolios from Citi Merchant processing portfolio of MB Financial Bank Credit card portfolio of Town North Bank Southern DataComm Numerous small portfolios Joint ventures: Spain merchant services joint venture with Banco Santander Brazil merchant services company Consumer and Wholesale Chicago banking operations of RBS Citizens Financial Group Banking operations of BankEast (Knoxville, TN) Banking operations of First Community Bank (NM) Banking subsidiaries of FBOP Corporation BB&T's Nevada banking operations First Bank of Idaho Downey Savings & Loan Association PFF Bank & Trust Mellon 1st Business Bank Trust Businesses Document custodian business of Ally Bank Quintillion Limited U.S. municipal bond trustee business of Deutsche Bank AIS Fund Administration Institutional trust business of Union Bank Indiana corporate trust business of UMB Bank BAC's securitization trust administration business Corporate trust adm business of F.N.B. Corporation Corporate trust business of AmeriServ Financial Bond trustee business of First Citizens Bank Mutual fund servicing division of Fiduciary Management, Inc Divestitures Divestiture of FAF Advisors long-term asset management business Consumer and Small Business Banking Payment Services Wealth Mgmt and Securities Services Wholesale Banking and Commercial Real Estate |
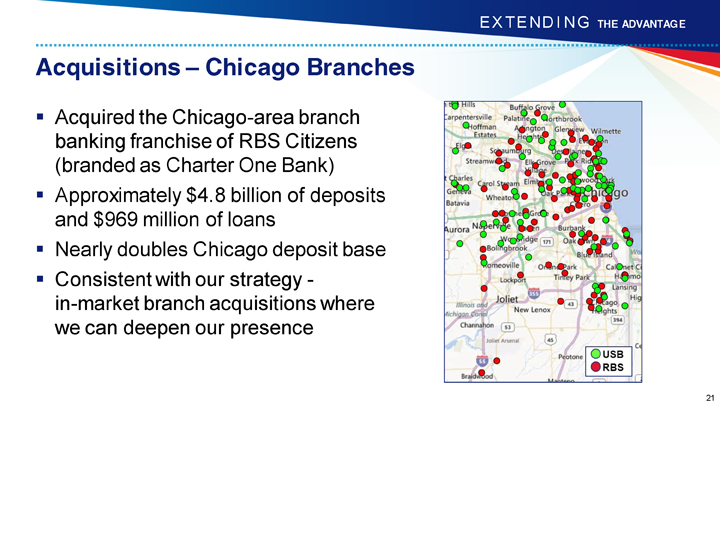
| Acquisitions - Chicago Branches Acquired the Chicago-area branch banking franchise of RBS Citizens (branded as Charter One Bank) Approximately $4.8 billion of deposits and $969 million of loans Nearly doubles Chicago deposit base Consistent with our strategy - in-market branch acquisitions where we can deepen our presence |
| Agenda Overview Financial Management Capital Management 3Q14 Update Long-term Goals |
| 3Q14 Update Business Climate Loan Growth Net Interest Margin Credit Quality Mortgage Activity Noninterest Income / Expense Liquidity Coverage Ratio |
| Agenda Overview Financial Management Capital Management 3Q14 Update Long-term Goals |
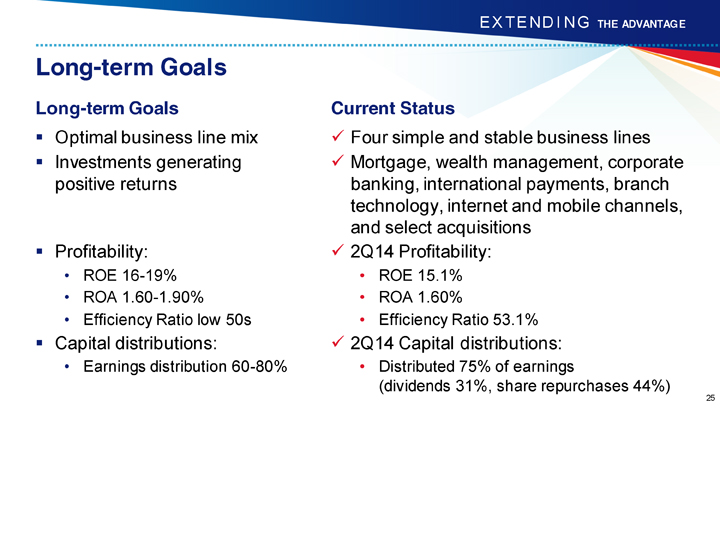
| Long-term Goals Long-term Goals Optimal business line mix Investments generating positive returns Profitability: ROE 16-19% ROA 1.60-1.90% Efficiency Ratio low 50s Capital distributions: Earnings distribution 60-80% Current Status Four simple and stable business lines Mortgage, wealth management, corporate banking, international payments, branch technology, internet and mobile channels, and select acquisitions 2Q14 Profitability: ROE 15.1% ROA 1.60% Efficiency Ratio 53.1% 2Q14 Capital distributions: Distributed 75% of earnings (dividends 31%, share repurchases 44%) |
| Appendix Barclays 2014 Global Financial Services Conference |
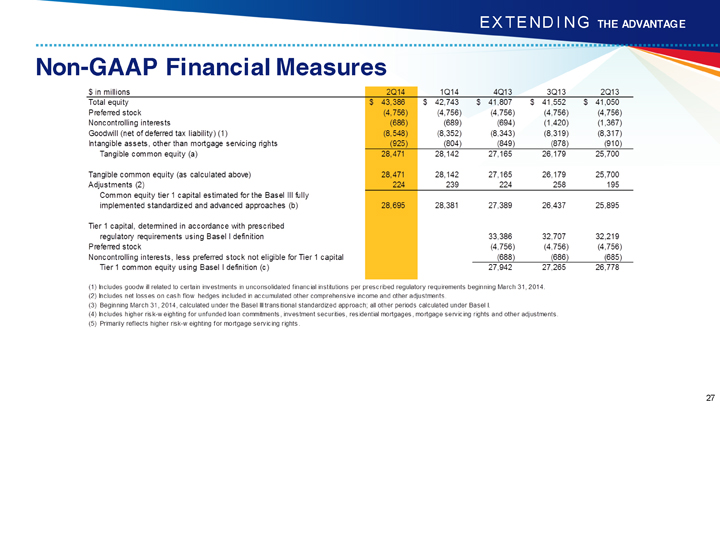
| Non-GAAP Financial Measures |
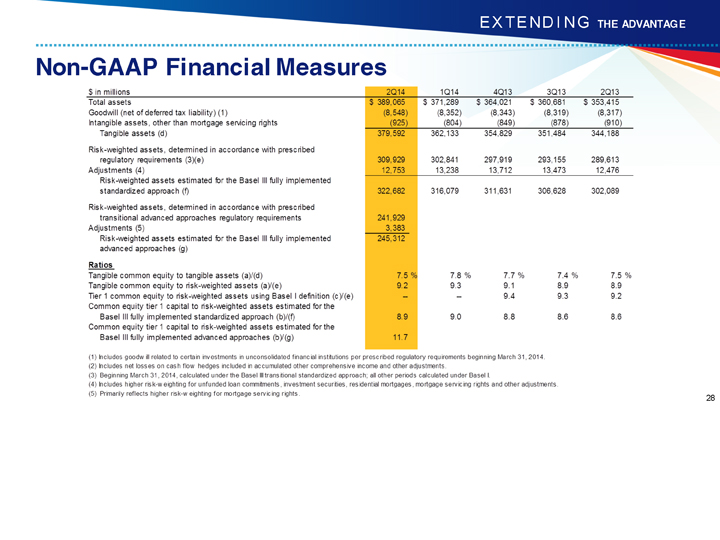
| Non-GAAP Financial Measures |
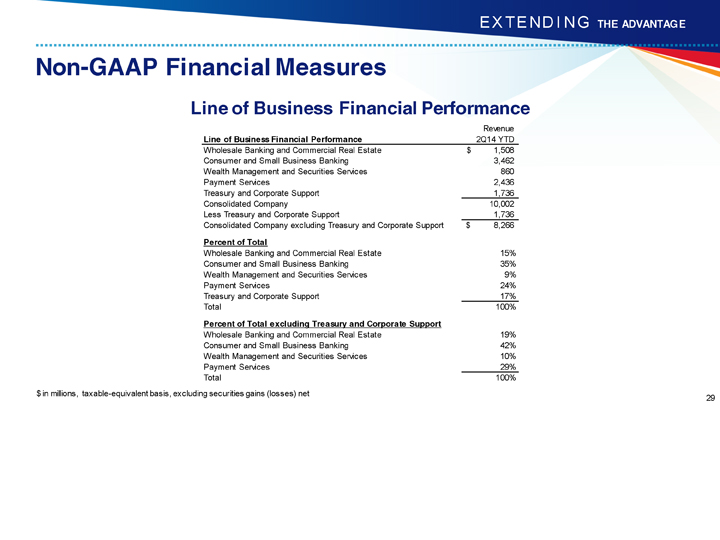
| Non-GAAP Financial Measures Line of Business Financial Performance $ in millions, taxable-equivalent basis, excluding securities gains (losses) net |

| Barclays 2014 Global Financial Services Conference |