Attached files
| file | filename |
|---|---|
| 8-K - 8-K - Ally Financial Inc. | a8-k.htm |
1 Ally Financial Inc. Michael Carpenter, Chief Executive Officer Jeff Brown, President and CEO, Dealer Financial Services Barclays Global Financial Services Conference September 9, 2014 Contact Ally Investor Relations at (866) 710-4623 or investor.relations@ally.com
2 Forward-Looking Statements and Additional Information The following should be read in conjunction with the financial statements, notes and other information contained in the Company’s Annual Reports on Form 10-K, Quarterly Reports on Form 10-Q, and Current Reports on Form 8-K. In the presentation that follows and related comments by Ally Financial Inc. (“Ally”) management, the use of the words “expect,” “anticipate,” “estimate,” “forecast,” “initiative,” “objective,” “plan,” “goal,” “project,” “outlook,” “priorities,” “target,” “explore,” “positions,” “intend,” “evaluate,” “pursue,” “seek,” “may,” “would, ” “could, ” “should, ” “believe, ” “potential, ” “continue,” or the negative of these words, or similar expressions is intended to identify forward-looking statements. All statements herein and in related management comments, other than statements of historical fact, including without limitation, statements about future events and financial performance, are forward-looking statements that involve certain risks and uncertainties. While these statements represent our current judgment on what the future may hold, and we believe these judgments are reasonable, these statements are not guarantees of any events or financial results, and Ally’s actual results may differ materially due to numerous important factors that are described in the most recent reports on SEC Forms 10-K and 10-Q for Ally, each of which may be revised or supplemented in subsequent reports filed with the SEC. Such factors include, among others, the following: maintaining the mutually beneficial relationship between Ally and General Motors (“GM”), and Ally and Chrysler Group LLC (“Chrysler”); our ability to maintain relationships with automotive dealers; our ability to realize the anticipated benefits associated with being a financial holding company, and the significant regulation and restrictions that we are now subject to; the potential for deterioration in the residual value of off-lease vehicles; disruptions in the market in which we fund our operations, with resulting negative impact on our liquidity; changes in our accounting assumptions that may require or that result from changes in the accounting rules or their application, which could result in an impact on earnings; changes in the credit ratings of Ally, Chrysler, or GM; changes in economic conditions, currency exchange rates or political stability in the markets in which we operate; and changes in the existing or the adoption of new laws, regulations, policies or other activities of governments, agencies and similar organizations (including as a result of the Dodd-Frank Act and Basel III). Investors are cautioned not to place undue reliance on forward-looking statements. Ally undertakes no obligation to update publicly or otherwise revise any forward-looking statements, whether as a result of new information, future events or other such factors that affect the subject of these statements, except where expressly required by law. Reconciliation of non-GAAP financial measures included within this presentation are provided in this presentation. Use of the term “loans” describes products associated with direct and indirect lending activities of Ally’s operations. The specific products include retail installment sales contracts, lines of credit, leases or other financing products. The term “originate” refers to Ally’s purchase, acquisition or direct origination of various “loan” products.
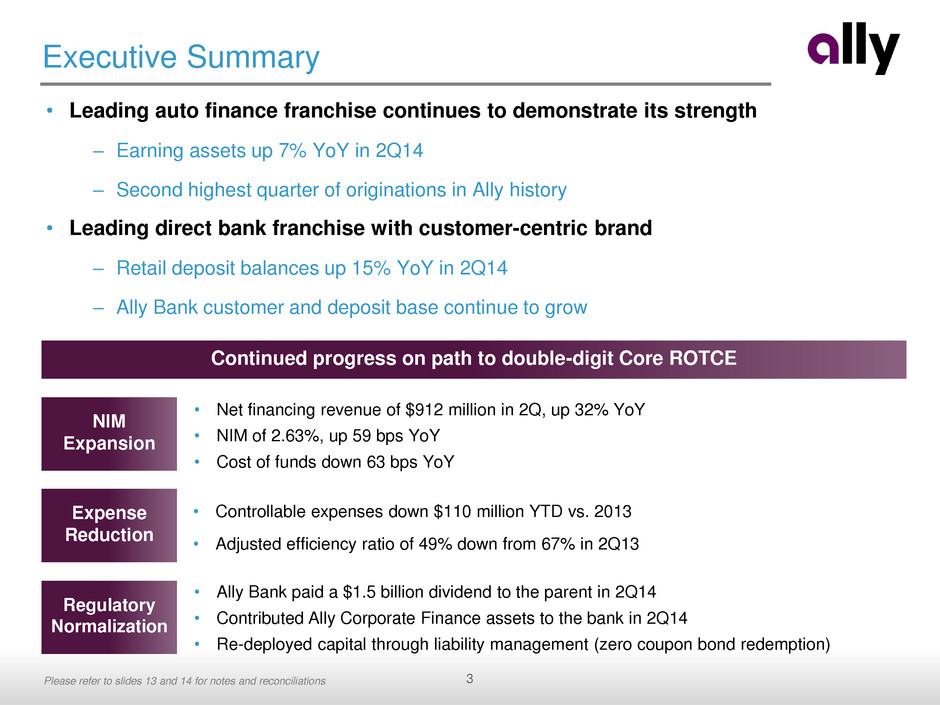
3 Executive Summary • Leading auto finance franchise continues to demonstrate its strength – Earning assets up 7% YoY in 2Q14 – Second highest quarter of originations in Ally history • Leading direct bank franchise with customer-centric brand – Retail deposit balances up 15% YoY in 2Q14 – Ally Bank customer and deposit base continue to grow NIM Expansion Expense Reduction Regulatory Normalization • Net financing revenue of $912 million in 2Q, up 32% YoY • NIM of 2.63%, up 59 bps YoY • Cost of funds down 63 bps YoY • Controllable expenses down $110 million YTD vs. 2013 • Adjusted efficiency ratio of 49% down from 67% in 2Q13 • Ally Bank paid a $1.5 billion dividend to the parent in 2Q14 • Contributed Ally Corporate Finance assets to the bank in 2Q14 • Re-deployed capital through liability management (zero coupon bond redemption) Continued progress on path to double-digit Core ROTCE Please refer to slides 13 and 14 for notes and reconciliations
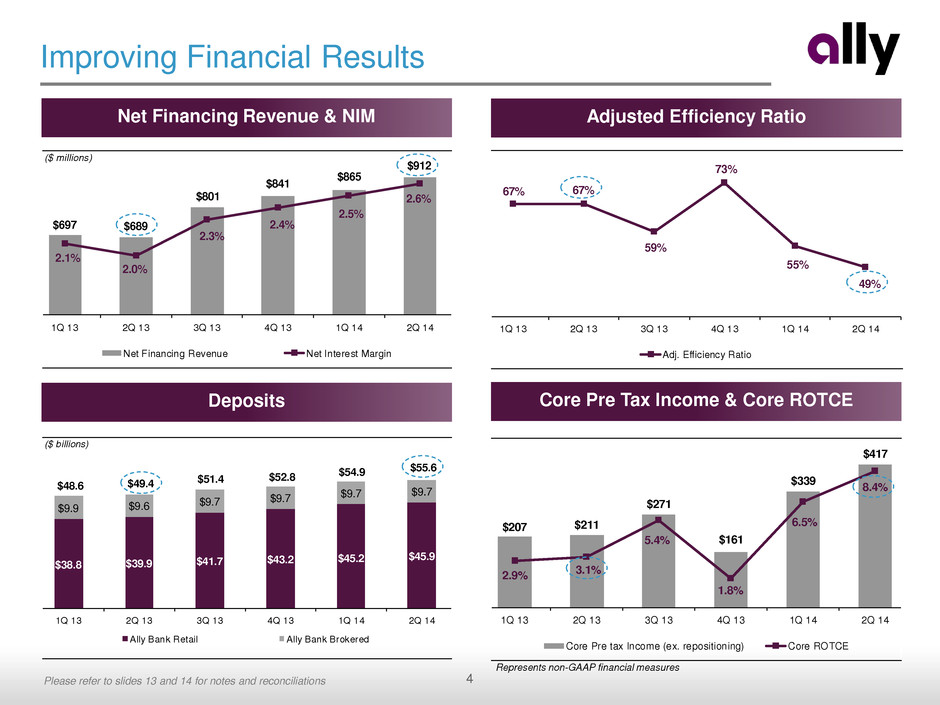
4 2.9% 3.1% 5.4% 1.8% 6.5% 8.4% $207 $211 $271 $161 $339 $417 1Q 13 2Q 13 3Q 13 4Q 13 1Q 14 2Q 14 Core Pre tax Income (ex. repositioning) Core ROTCE Improving Financial Results Adjusted Efficiency Ratio Net Financing Revenue & NIM Core Pre Tax Income & Core ROTCE Deposits ($ millions) $697 $689 $801 $841 $865 $912 2.1% 2.0% 2.3% 2.4% 2.5% 2.6% 1Q 13 2Q 13 3Q 13 4Q 13 1Q 14 2Q 14 Net Financing Revenue Net Interest Margin 67% 67% 59% 73% 55% 49% 1Q 13 2Q 3 3Q 13 4Q 13 1Q 14 2Q 14 Adj. Effici ncy Ratio ($ billions) $38.8 $39.9 $41.7 $43.2 $45.2 $45.9 $48.6 $49.4 $51.4 $52.8 $54.9 $55.6 $9.9 $9.6 $9.7 $9.7 $9.7 $9.7 1Q 13 2 13 3 4 1Q 14 2Q 14 Ally Bank Retail Ally Bank Brokered Please refer to slides 13 and 14 for notes and reconciliations Represents non-GAAP financial measures
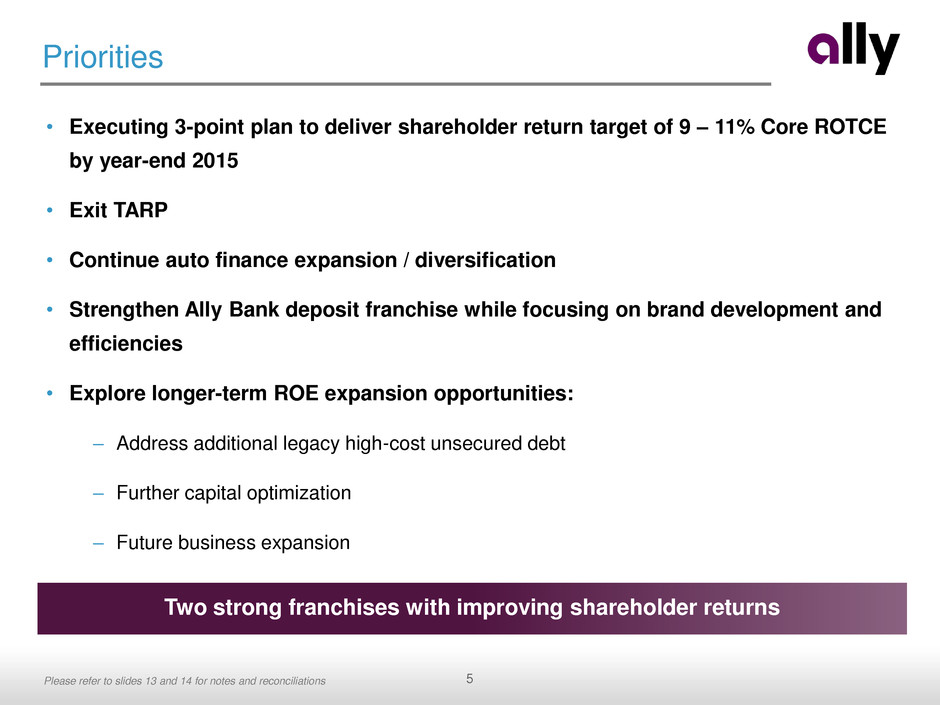
5 Priorities • Executing 3-point plan to deliver shareholder return target of 9 – 11% Core ROTCE by year-end 2015 • Exit TARP • Continue auto finance expansion / diversification • Strengthen Ally Bank deposit franchise while focusing on brand development and efficiencies • Explore longer-term ROE expansion opportunities: – Address additional legacy high-cost unsecured debt – Further capital optimization – Future business expansion Two strong franchises with improving shareholder returns Please refer to slides 13 and 14 for notes and reconciliations
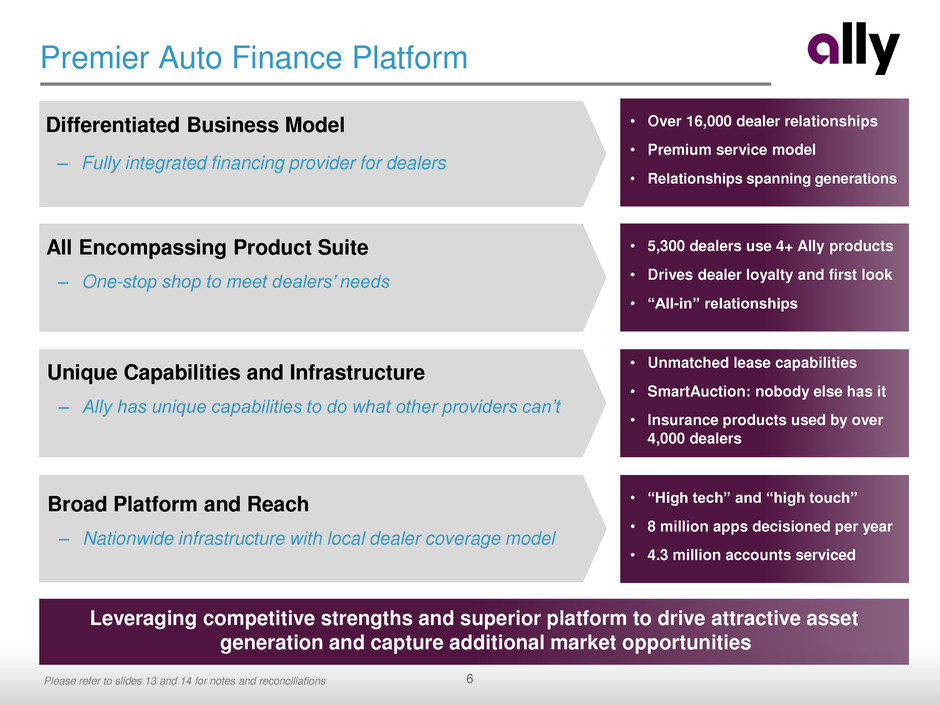
6 Premier Auto Finance Platform • Over 16,000 dealer relationships • Premium service model • Relationships spanning generations All Encompassing Product Suite – One-stop shop to meet dealers’ needs Unique Capabilities and Infrastructure – Ally has unique capabilities to do what other providers can’t Broad Platform and Reach – Nationwide infrastructure with local dealer coverage model Differentiated Business Model – Fully integrated financing provider for dealers • 5,300 dealers use 4+ Ally products • Drives dealer loyalty and first look • “All-in” relationships • Unmatched lease capabilities • SmartAuction: nobody else has it • Insurance products used by over 4,000 dealers Leveraging competitive strengths and superior platform to drive attractive asset generation and capture additional market opportunities • “High tech” and “high touch” • 8 million apps decisioned per year • 4.3 million accounts serviced Please refer to slides 13 and 14 for notes and reconciliations
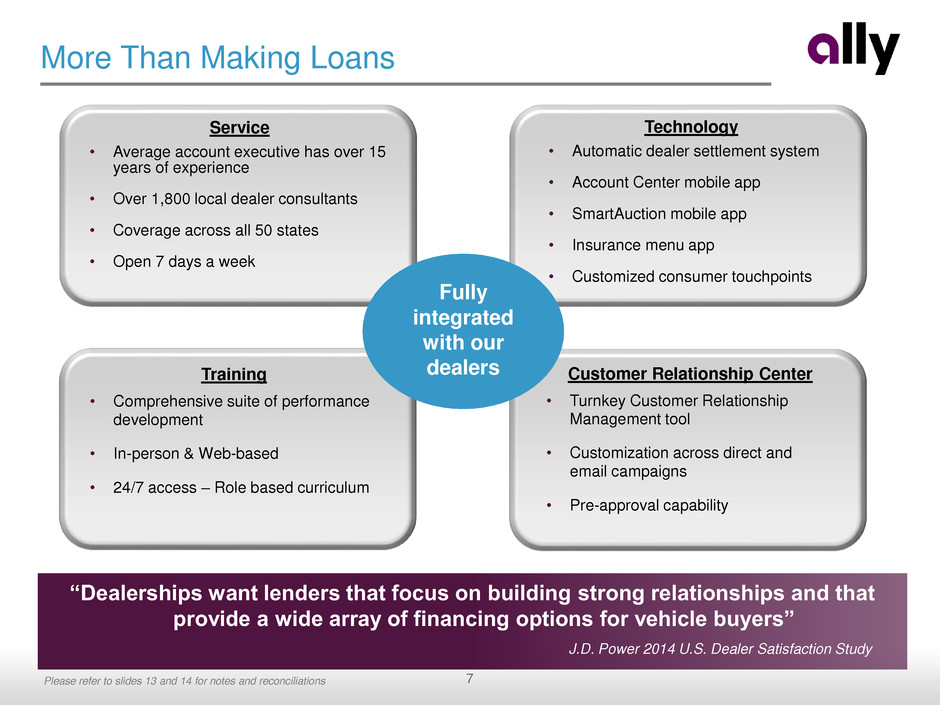
7 More Than Making Loans Technology “Dealerships want lenders that focus on building strong relationships and that provide a wide array of financing options for vehicle buyers” Fully integrated with our dealers Technology • Automatic dealer settlement system • Account Center mobile app • SmartAuction mobile app • Insurance menu app • Customized consumer touchpoints Customer Relationship Center • Turnkey Customer Relationship Management tool • Customization across direct and email campaigns • Pre-approval capability Training • Comprehensive suite of performance development • In-person & Web-based • 24/7 access – Role based curriculum Service • Average account executive has over 15 years of experience • Over 1,800 local dealer consultants • Coverage across all 50 states • Open 7 days a week J.D. Power 2014 U.S. Dealer Satisfaction Study Please refer to slides 13 and 14 for notes and reconciliations
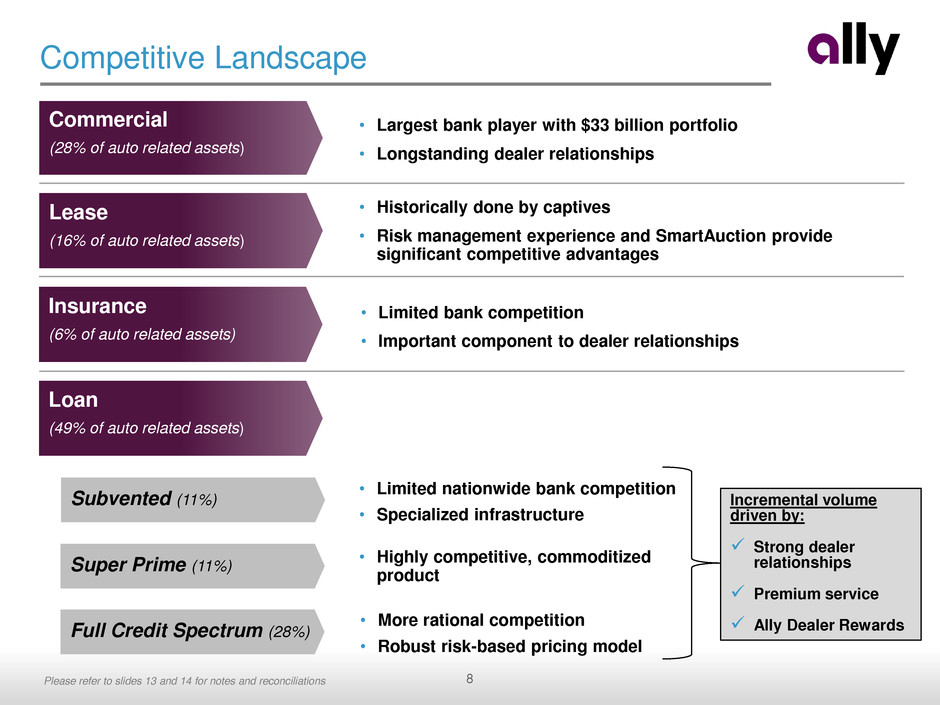
8 Competitive Landscape Lease (16% of auto related assets) Insurance (6% of auto related assets) Loan (49% of auto related assets) • Largest bank player with $33 billion portfolio • Longstanding dealer relationships Commercial (28% of auto related assets) • Historically done by captives • Risk management experience and SmartAuction provide significant competitive advantages • Limited bank competition • Important component to dealer relationships • Highly competitive, commoditized product • More rational competition • Robust risk-based pricing model Subvented (11%) Super Prime (11%) Full Credit Spectrum (28%) • Limited nationwide bank competition • Specialized infrastructure Incremental volume driven by: Strong dealer relationships Premium service Ally Dealer Rewards Please refer to slides 13 and 14 for notes and reconciliations
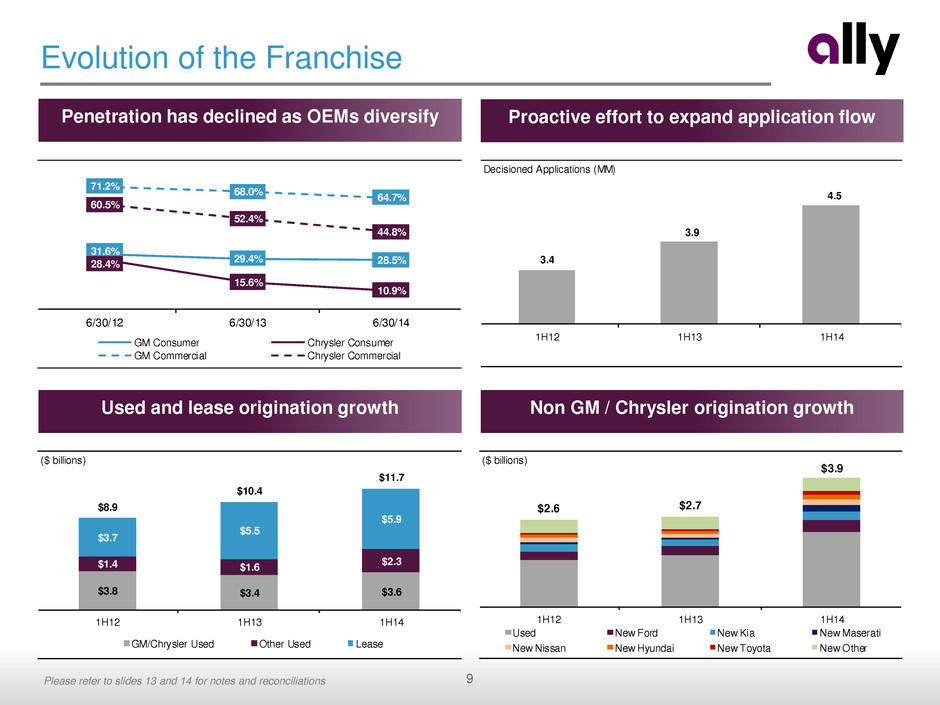
9 Evolution of the Franchise Proactive effort to expand application flow Non GM / Chrysler origination growth Used and lease origination growth Penetration has declined as OEMs diversify 31.6% 29.4% 28.5%28.4% 15.6% 10.9% 71.2% 68.0% 64.7% 60.5% 52.4% 44.8% 6/30/12 6/30/13 6/30/14 GM Consumer Chrysler Consumer GM Commercial Chrysler Commercial Decisioned Applications (MM) 3.4 3.9 4.5 1H12 1H13 1H14 Please refer to slides 13 and 14 for notes and reconciliations ($ billions) $2.6 $2.7 $3.9 1H12 1H13 1H14 Used New Ford New Kia New Maserati New Nissan New Hyundai New Toyota New Other ($ billions) $3.8 $3.4 $3.6 $1.4 $1.6 $2.3 $3.7 $5.5 $5.9 $8.9 $10.4 $11.7 1H12 1H13 1H14 GM/Chrysler Used Other Used Lease
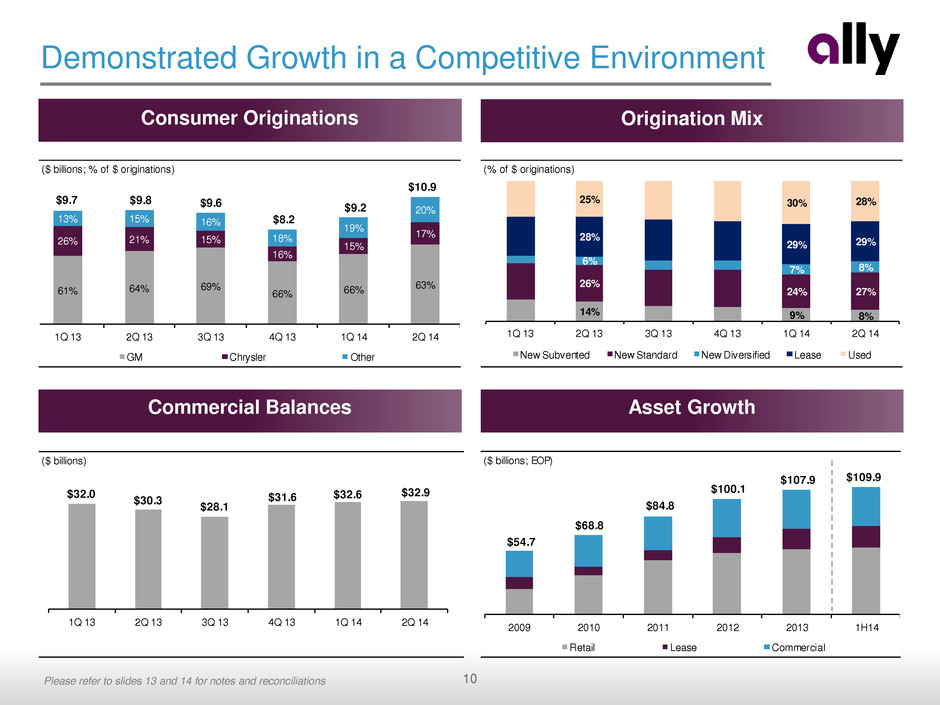
10 ($ billions; EOP) $54.7 $68.8 $84.8 $100.1 $107.9 $109.9 $0.0 $25.0 $50.0 $75.0 $100.0 2009 2010 2011 2012 2013 1H14 Retail Lease Commercial Demonstrated Growth in a Competitive Environment Consumer Originations Origination Mix Asset Growth Commercial Balances ($ billions; % of $ originations) 61% 64% 69% 66% 66% 63% 26% 21% 15% 16% 15% 17% 13% 15% 16% 18% 19% 20% $9.7 $9.8 $9.6 $8.2 $9.2 $10.9 1Q 13 2Q 13 3Q 13 4Q 13 1Q 14 2Q 14 GM Chrysler Other ($ billions) $32.0 $30.3 $28.1 $31.6 $32.6 $32.9 1Q 13 2Q 13 3Q 13 4Q 13 1Q 14 2Q 14 (% of $ originations) 14% 9% 8% 26% 24% 27% 6% 7% 8% 28% 29% 29% 25% 30% 28% 0% 25% 50% 75% 100% 1Q 13 2Q 13 3Q 13 Q 13 Q 14 2Q 14 New Subvented New Standard New Diversified Lease Used Please refer to slides 13 and 14 for notes and reconciliations
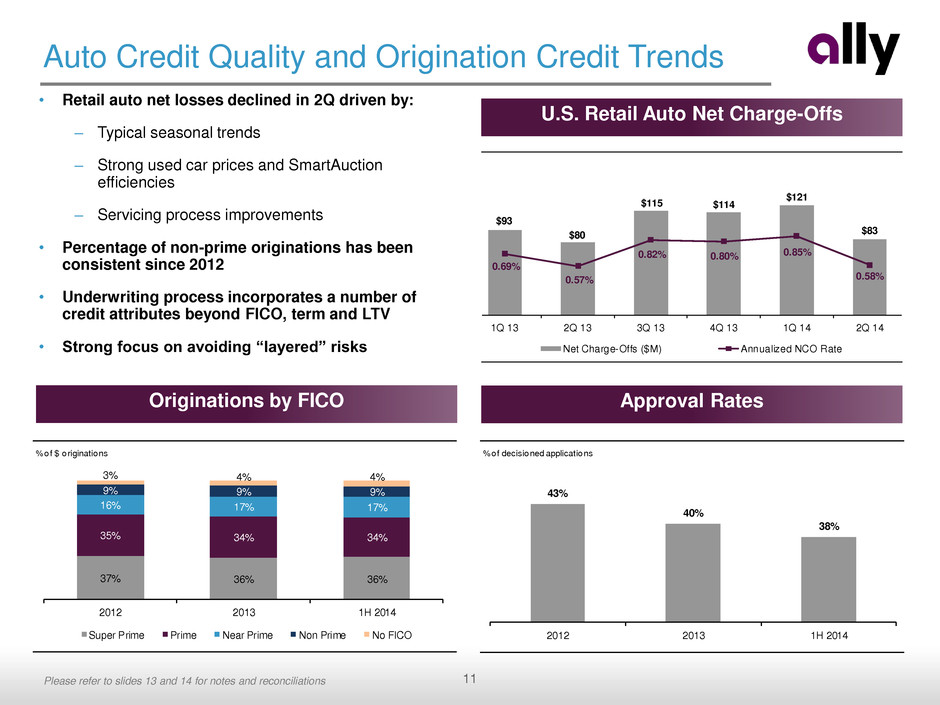
11 Auto Credit Quality and Origination Credit Trends Approval Rates U.S. Retail Auto Net Charge-Offs • Retail auto net losses declined in 2Q driven by: – Typical seasonal trends – Strong used car prices and SmartAuction efficiencies – Servicing process improvements • Percentage of non-prime originations has been consistent since 2012 • Underwriting process incorporates a number of credit attributes beyond FICO, term and LTV • Strong focus on avoiding “layered” risks % of decisioned applications 43% 40% 38% 2012 2013 1H 2014 % o $ originations 37% 36% 36% 35% 34% 34% 16% 17% 17% 9% 9% 9% 3% 4% 4% 2012 2013 1H 2014 Super Prime Prime Near Prime Non Prime No FICO Originations by FICO $93 $80 $115 $114 $121 $83 0.69% 0.57% 0.82% 0.80% 0.85% 0.58% 1Q 13 2Q 13 3Q 13 4Q 13 1Q 14 2Q 14 Net Charge-Offs ($M) Annualized NCO Rate Please refer to slides 13 and 14 for notes and reconciliations
12 Conclusion • Differentiated, dealer-centric business model • Premium service offering • “All in” dealer relationships • Diversifying to cover a broader dealer universe • Focus on asset quality and profitability Please refer to slides 13 and 14 for notes and reconciliations
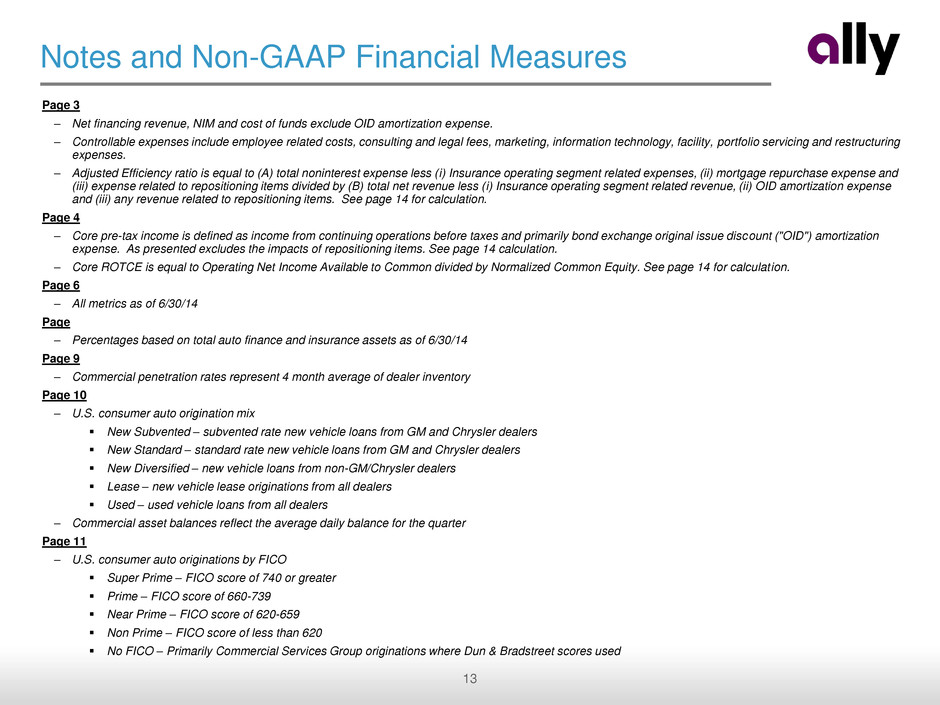
13 Notes and Non-GAAP Financial Measures Page 3 – Net financing revenue, NIM and cost of funds exclude OID amortization expense. – Controllable expenses include employee related costs, consulting and legal fees, marketing, information technology, facility, portfolio servicing and restructuring expenses. – Adjusted Efficiency ratio is equal to (A) total noninterest expense less (i) Insurance operating segment related expenses, (ii) mortgage repurchase expense and (iii) expense related to repositioning items divided by (B) total net revenue less (i) Insurance operating segment related revenue, (ii) OID amortization expense and (iii) any revenue related to repositioning items. See page 14 for calculation. Page 4 – Core pre-tax income is defined as income from continuing operations before taxes and primarily bond exchange original issue discount ("OID") amortization expense. As presented excludes the impacts of repositioning items. See page 14 calculation. – Core ROTCE is equal to Operating Net Income Available to Common divided by Normalized Common Equity. See page 14 for calculation. Page 6 – All metrics as of 6/30/14 Page – Percentages based on total auto finance and insurance assets as of 6/30/14 Page 9 – Commercial penetration rates represent 4 month average of dealer inventory Page 10 – U.S. consumer auto origination mix New Subvented – subvented rate new vehicle loans from GM and Chrysler dealers New Standard – standard rate new vehicle loans from GM and Chrysler dealers New Diversified – new vehicle loans from non-GM/Chrysler dealers Lease – new vehicle lease originations from all dealers Used – used vehicle loans from all dealers – Commercial asset balances reflect the average daily balance for the quarter Page 11 – U.S. consumer auto originations by FICO Super Prime – FICO score of 740 or greater Prime – FICO score of 660-739 Near Prime – FICO score of 620-659 Non Prime – FICO score of less than 620 No FICO – Primarily Commercial Services Group originations where Dun & Bradstreet scores used
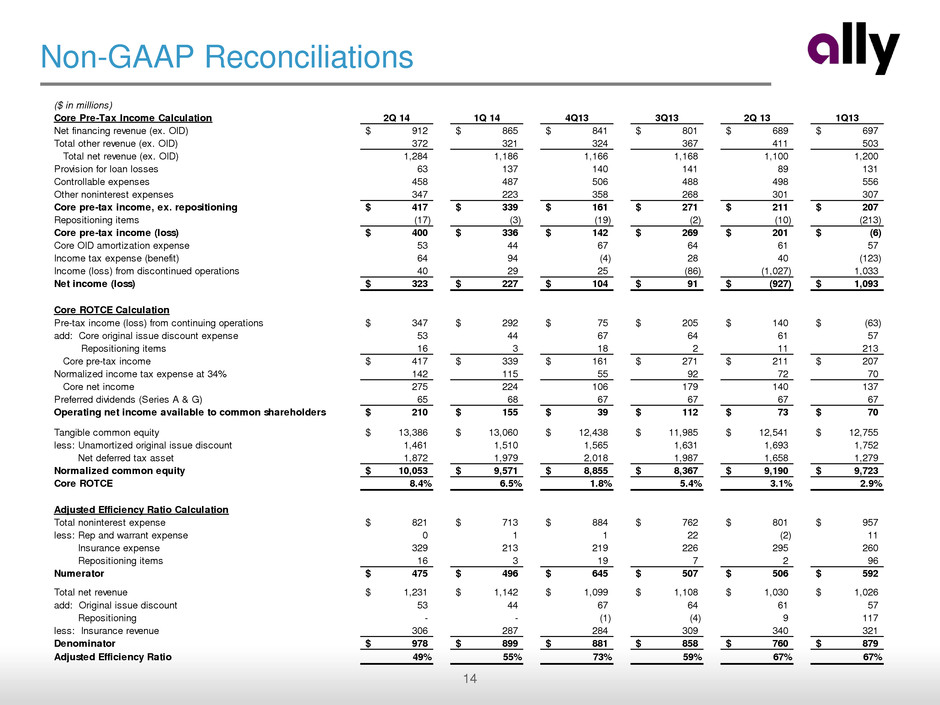
14 Non-GAAP Reconciliations ($ in millions) Core Pre-Tax Income Calculation 2Q 14 1Q 14 4Q13 3Q13 2Q 13 1Q13 Net financing revenue (ex. OID) 912$ 865$ 841$ 801$ 689$ 697$ Total other revenue (ex. OID) 372 321 324 367 411 503 Total net revenue (ex. OID) 1,284 1,186 1,166 1,168 1,100 1,200 Provision for loan losses 63 137 140 141 89 131 Controllable expenses 458 487 506 488 498 556 Other noninterest expenses 347 223 358 268 301 307 Core pre-tax income, ex. repositioning 417$ 339$ 161$ 271$ 211$ 207$ Repositioning items (17) (3) (19) (2) (10) (213) Core pre-tax income (loss) 400$ 336$ 142$ 269$ 201$ (6)$ Core OID amortization expense 53 44 67 64 61 57 Income tax expense (benefit) 64 94 (4) 28 40 (123) Income (loss) from discontinued operations 40 29 25 (86) (1,027) 1,033 Net income (loss) 323$ 227$ 104$ 91$ (927)$ 1,093$ Core ROTCE Calculation Pre-tax income (loss) from continuing operations 347$ 292$ 75$ 205$ 140$ (63)$ add: Core original issue discount expense 53 44 67 64 61 57 Repositioning items 16 3 18 2 11 213 Core pre-tax income 417$ 339$ 161$ 271$ 211$ 207$ Normalized income tax expense at 34% 142 115 55 92 72 70 Core net income 275 224 106 179 140 137 Preferred dividends (Series A & G) 65 68 67 67 67 67 Operating net income available to common shareholders 210$ 155$ 39$ 112$ 73$ 70$ Tangible common equity 13,386$ 13,060$ 12,438$ 11,985$ 12,541$ 12,755$ less: Unamortized original issue discount 1,461 1,510 1,565 1,631 1,693 1,752 Net deferred tax asset 1,872 1,979 2,018 1,987 1,658 1,279 Normalized common equity 10,053$ 9,571$ 8,855$ 8,367$ 9,190$ 9,723$ Core ROTCE 8.4% 6.5% 1.8% 5.4% 3.1% 2.9% Adjusted Efficiency Ratio Calculation Total noninterest expense 821$ 713$ 884$ 762$ 801$ 957$ less: Rep and warrant expense 0 1 1 22 (2) 11 Insurance expense 329 213 219 226 295 260 Repositioning items 16 3 19 7 2 96 Numerator 475$ 496$ 645$ 507$ 506$ 592$ Total net revenue 1,231$ 1,142$ 1,099$ 1,108$ 1,030$ 1,026$ add: Original issue discount 53 44 67 64 61 57 Repositioning - - (1) (4) 9 117 less: Insurance revenue 306 287 284 309 340 321 Denominator 978$ 899$ 881$ 858$ 760$ 879$ Adjusted Efficiency Ratio 49% 55% 73% 59% 67% 67%
