Attached files
| file | filename |
|---|---|
| 8-K - 8-K - MATTRESS FIRM HOLDING CORP. | a14-20489_18k.htm |
| EX-99.1 - EX-99.1 - MATTRESS FIRM HOLDING CORP. | a14-20489_1ex99d1.htm |
| EX-99.2 - EX-99.2 - MATTRESS FIRM HOLDING CORP. | a14-20489_1ex99d2.htm |
| EX-2.1 - EX-2.1 - MATTRESS FIRM HOLDING CORP. | a14-20489_1ex2d1.htm |
| EX-10.1 - EX-10.1 - MATTRESS FIRM HOLDING CORP. | a14-20489_1ex10d1.htm |
| EX-10.2 - EX-10.2 - MATTRESS FIRM HOLDING CORP. | a14-20489_1ex10d2.htm |
Exhibit 99.3
|
|
Pending Acquisition of Sleep Train September 4, 2014 |
|
|
Forward Looking Statements and Non-GAAP Information This presentation contains forward-looking statements within the meaning of federal securities laws, that are subject to risks and uncertainties. All statements other than statements of historical fact included in this presentation are forward-looking statements. Forward-looking statements give our current expectations and projections relating to our financial condition, results of operations, plans, objectives, future performance and business. You can identify forward-looking statements by the fact that they do not relate strictly to historical or current facts. These statements may include words such as "anticipate," "estimate," "expect," "project," "intend," "believe" and other words and terms of similar meaning in connection with any discussion of the timing or nature of future operating or financial performance or other events. These forward-looking statements are based on assumptions that we have made in light of our industry experience and on our perceptions of historical trends, current conditions, expected future developments and other factors we believe are appropriate under the circumstances. As you consider this presentation, you should understand that these statements are not guarantees of performance or results. They involve risks, uncertainties (some of which are beyond our control) and assumptions. Although we believe that these forward-looking statements are based on reasonable assumptions, you should be aware that many factors could affect our actual financial results and cause them to differ materially from those anticipated in the forward-looking statements. Because of these factors, we caution that you should not place undue reliance on any of our forward-looking statements. Further, any forward-looking statement speaks only as of the date on which it is made. New risks and uncertainties arise from time to time, and it is impossible for us to predict those events or how they may affect us. We have no duty to, and do not intend to, update or revise the forward-looking statements in this presentation after the date of this presentation. This presentation includes data, which excludes non-recurring charges relating to our ERP system implementation costs, acquisition-related costs and impairment charges. Such data is considered a financial measure not in accordance with the accounting principles generally accepted in the United States, or and is not in lieu of, or preferable to, or GAAP, financial data. However, we are providing this information as we believe it facilitates year-over-year comparisons for investors and financial analysts. Please refer to the reconciliation footnotes below for a reconciliation of such non-GAAP financial measures to the most directly comparable GAAP measures. |
|
|
Strategic Rationale National scale synergy opportunities Expand into West Coast strategic markets Fortify Leading Position Acquire high-volume stores and leadership team Enhance financial growth prospects Adding 311 locations from a leading market share retailer with limited overlap Presence in California, Washington, Oregon, Idaho, Nevada and Hawaii Provides customers with great value, convenience and choice Total enterprise pro forma sales approaching $2 billion annually Total enterprise locations exceeding 2,000 store units Over $20 million of potential cost & revenue synergy by 3rd year post closing Leverage nationwide delivery & distribution, advertising efficiencies & exclusive partnerships Well positioned, long- Immediate scale with a well-run, multi-brand organization Experienced and disciplined culture, highly aligned with Mattress Firm Estimated to achieve mid-single digit GAAP EPS percentage accretion in first year post closing, excluding one-time costs Combined business anticipated to generate significant free cash flow Establishes a foundation to accelerate our proven RMS model through further store penetration to drive up market level profitability 2 #1 |
|
|
Transaction Overview 3 Key Items Description Purchase Price Total purchase price of approximately $425 million, subject to working capital and other customary adjustments. Mattress Firm will assume certain additional liabilities totaling approximately $15 million o Approximately 90% funded by cash and payment of third party debt o Approximately 10% payable in Mattress Firm equity Financing Cash portion of purchase price financed through a combination of existing cash on hand and the issuance of senior secured debt Accretion / Synergies Estimated to achieve mid-single digit GAAP EPS percentage accretion in the first year post-closing 1 Estimated annual potential synergies of $20 million by the third year post-closing 1 Leadership Steve Stagner will serve as CEO Dale Carlsen will serve as President, CSO and Vice Chairman of the Mattress Firm Board of Directors Ken Murphy and Rob Killgore will serve as co- Estimated Closing including the termination of the applicable HSR waiting period Tax Attributes The Company expects to receive future annual cash income tax benefits of approximately $11 million over the next 15 years from deductible tax basis goodwill generated from the transaction, subject to Total undiscounted future tax benefits of approximately $165 million (equal to approximately $107 million when discounted at a 6% rate) The purchase price, as adjusted for the net present value of the related future tax benefits, is approximately $333 million 1. Excluding one-time costs. |
|
|
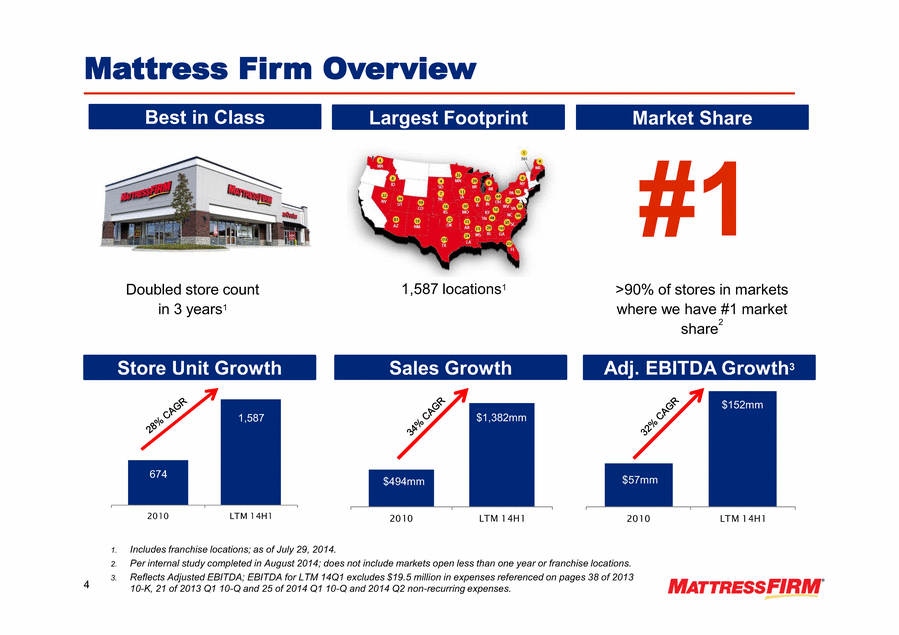
2010 LTM 14H1 2010 LTM 14H1 2010 LTM 14H1 Mattress Firm Overview 1. Includes franchise locations; as of July 29, 2014. 2. Per internal study completed in August 2014; does not include markets open less than one year or franchise locations. 3. Reflects Adjusted EBITDA; EBITDA for LTM 14Q1 excludes $19.5 million in expenses referenced on pages 38 of 2013 10-K, 21 of 2013 Q1 10-Q and 25 of 2014 Q1 10-Q and 2014 Q2 non-recurring expenses. Doubled store count in 3 years1 #1 >90% of stores in markets where we have #1 market share2 Largest Footprint Best in Class Sales Growth Store Unit Growth Market Share Adj. EBITDA Growth3 $57mm $152mm $494mm $1,382mm 1,587 674 1,587 locations1 4 |
|
|
Sleep Train Overview Diversified Brands 5 #1 West Coast Retailer Market Share Store Unit Growth Sales Growth 2010 2013 #1 >90% of stores in markets with #1 market share(1) 311 Stores 233 300 2010 2013 $313mm $471mm 1. Per internal study completed in August 2014. 77 35 7 5 9 178 |
|
|
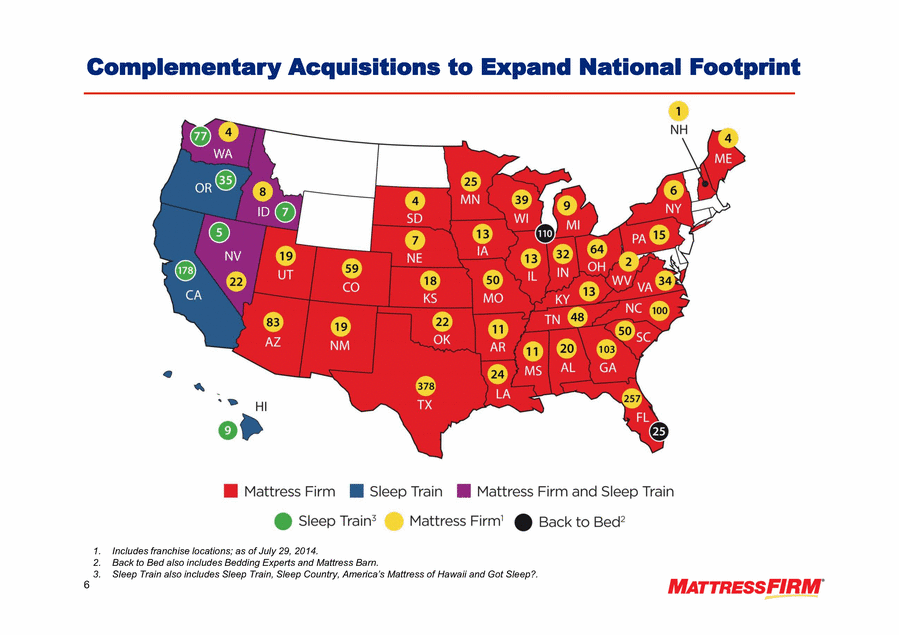
Complementary Acquisitions to Expand National Footprint 1. Includes franchise locations; as of July 29, 2014. 2. Back to Bed also includes Bedding Experts and Mattress Barn. 3. 6 |
|
|
Current Pro Forma 3 Top Mattress Specialty Retailers 1 as the #1 Mattress Specialty Retailer in the fragmented retail bedding environment Market Leading Position 7 1. Source: Furniture Today Top 100, May 2014. 2. Reflects sales of the respective retailers divided by the estimated size of the U.S. mattress retail market in 2013; Furniture Today 2014 Retail Planning Guide. 3. Assumes the 2012 and 2013 sales for Mattress Firm includes Sleep Train and Back to Bed. ($ in millions) ($ in millions) Rank Company 2013 Stores 2013 Sales YoY Growth Market Share(2) 1 Mattress Firm 1,791 $1,964 14.2% 14.2% 2 939 1,000 2.5% 7.2% 3 Sleep Number 440 922 2.3% 6.6% 4 395 314 4.9% 2.3% 5 31 99 2.9% 0.7% 6 Innovative Mattress Solutions 150 93 -3.1% 0.7% 7 Mattress Warehouse 165 91 7.1% 0.7% 8 American Mattress 92 67 -4.3% 0.5% 4,003 $4,551 7.2% 32.7% Top 8 Rank Company 2013 Stores 2013 Sales YoY Growth Market Share(2) 1 Mattress Firm 1,361 $1,387 18.8% 10.0% 2 939 1,000 2.5% 7.2% 3 Sleep Number 440 922 2.3% 6.6% 4 Sleep Train 299 471 5.2% 3.4% 5 395 314 4.9% 2.3% 6 Back to Bed 131 106 1.9% 0.8% 7 31 99 2.9% 0.7% 8 Innovative Mattress Solutions 150 93 -3.1% 0.7% 9 Mattress Warehouse 165 91 7.1% 0.7% 10 American Mattress 92 67 -4.3% 0.5% 4,003 $4,551 7.2% 32.7% Top 10 |
|
|
Pro Forma Company Note: Store count includes franchise locations; as of July 2014. Sales for Mattress Firm as of July 29, 2014. Sales for Back to Bed per Furniture Today and as of December 31, 2013. Sales for Sleep Train per Furniture Today and as of December 31, 2013. 8 + = Stores Sales 1,587 311 2,033 $1,382 $471 $1,961 + 135 $106 Consolidated Company |
|
|
Significant Synergy Potential . 9 Estimated Potential Synergies Cost Revenue Sourcing & Procurement Distribution & Logistics Advertising SG&A Professional Services Other Approximately $20 million of estimated synergies by Year 3 Exclusive and Tertiary Products Multi-Channel / Omni-Channel Sales Strategic Partnerships Enhanced use of Customer Financing Other |
|
|
Relative Market Share Model 2009 2013 2009 2013 2009 2013 2009 2013 2009 2013 Driving Profitability Model Market Penetration Relative Market Share Incremental Advertising Market Profitability Comp Sales ADV Spend ADV per Capita Store Count Stores per Capita Sales per Store Adj. EBITDA Adj. EBITDA Margin $0.88 $1.93 Leadership Fortress Developmental Developmental Leadership 1:98k 1:62k 105 stores 65 stores $5.6mm $12.5mm $1.2mm $1.5mm $14.3mm $29.6mm 19.4% 20.5% Case Study: Houston 10 |
|
|
Market Penetration Highly Correlated to Profitability $0.41 $0.75 $1.33 $1.58 $0.9mm $1.0mm $1.0mm $1.3mm 4.8% 13.2% 13.7% 19.8% Developmental Leadership Fortress - Recent Acq. Fortress Market Level Adjusted EBITDA1 Sales per Store1 Advertising $ Per Capita1 Note: Based on fiscal year 2013 results, including 91% of total stores (excluding markets not branded as Mattress Firm and markets open less than one year). 1. Annualized weighted average of stores in each category. % of Sales: 12.7% % of Sales: 9.7% Occupancy 21.0% Occupancy 14.6% Occupancy 14.5% % of Sales: 8.8% FY 2013 Penetration level (stores per capita) 1:>170k 1:90k 170k 1:<90k 1:<90k % of Store Base 4% 27% 47% 22% 11 |
|
|
Proven Track Record of Acquisitions 1 1. Does not include acquisitions prior to 2006. Does not include acquisitions of less than 10 stores. Mattress of Hawaii and Got Sleep?. 40 stores Atlanta, Miami, SW Florida, Tampa 2012 Austin, Dallas, Houston, San Antonio, Las Vegas 36 stores 2007 27 stores Charleston, Charlotte, Columbia, Greensboro, Greenville, Raleigh 2012 26 stores Phoenix 2006 14 stores Las Vegas 2007 55 stores Atlanta, Minneapolis, St. Louis 2011 34 stores Colorado Springs, Denver, Wichita 2014 Yotes Franchise 181 stores Houston, Dallas, Jacksonville, Miami, Orlando, SW Florida, Tampa 2012 10 stores St. Louis 2007 Yotes Franchise 25 stores Virginia Beach 2010 39 stores Green Bay, Madison, Milwaukee, Wausau 2013 Perfect Mattress Franchise 55 stores Dallas, Austin 2014 Houston 13 stores 2007 75 stores Colorado Springs, Denver, Phoenix, Tucson 2014 Online Retailer 2013 Nationwide 12 15 stores Pittsburgh Announced 135 stores Chicago Orlando Announced 311 stores California, Oregon, Washington, Idaho, Nevada and Hawaii Announced |
|
|
Years at Sleep Train Years of Relevant Experience Experience Dale Carlsen CEO and President 29 34 Rob Killgore Chief Operating Officer 28 28 Pete DiCorti Chief Financial Officer 6 41 Mike Combest EVP of Operations 24 24 John Haitz EVP of Finance 12 30 Mike Wilson EVP of Marketing 7 30 Paul Grimm General Counsel 9 30 Hernani Alves VP of Retail Sales 16 20 Matt Anderson VP of Training and Development 19 19 Brian Baxter VP of Merchandising 11 24 Tracy Jackson VP of Human Resources 10 17 Experienced and Deep Management Team 13 Gordon, Odom & Davis Inc. Arthur Young & Co |
|
|
Investment Thesis Proven Track Record of Driving Profitability Compelling Industry Dynamics Best-in-Class Specialty Retailer Highly Achievable Growth Plan Experienced and Invested Management Team Long term stability and consistent growth Fragmented industry with no national chain Pent-up demand with 80% replacement Largest footprint >90% stores in markets where company is #1 Unique selling proposition Fast <1 year cash on cash payback with new stores High correlation between penetration and profitability History of developing markets through increasing RMS Doubled store count over last three years Currently announced acquisitions will further enhance store growth ability Management aligned with shareholders Top executives have 15+ years of relevant experience Mix between retail and industry experience 14 |


