Attached files
| file | filename |
|---|---|
| 8-K - DNB FINANCIAL CORPORATION FORM 8-K - DNB FINANCIAL CORP /PA/ | dnb8k.htm |

DNB Financial Corporation
Investor Overview Presentation
Summer 2014

Forward-looking statements:
Certain statements contained in this presentation are forward-looking in nature. These include all
Certain statements contained in this presentation are forward-looking in nature. These include all
statements about DNB's plans, objectives, expectations and other statements that are not historical
facts, and usually use words such as "expect," "anticipate," "believe" and similar expressions. Such
statements represent management's current beliefs, based upon information available at the time
the statements are made, with regard to the matters addressed. All forward-looking statements
are subject to risks and uncertainties that could cause DNB's actual results or financial condition to
differ materially from those expressed in or implied by such statements. Factors of particular
importance to DNB include, but are not limited to: (1) changes in general, national or regional economic
conditions; (2) changes in interest rates; (3) changes in loan default and charge-off rates; (4) changes in
deposit levels; (5) changes in levels of income and expense in non-interest income and expense related
activities; (6) residential mortgage and secondary market activity; (7) changes in accounting and
activities; (6) residential mortgage and secondary market activity; (7) changes in accounting and
regulatory guidance applicable to banks; (8) price levels and conditions in the public securities markets
generally; (9) competition and its effect on pricing, spending, third-party relationships and revenues;
and (10) changes in regulation resulting from or relating to financial reform legislation. DNB does not
undertake any obligation to update or revise any forward-looking statements, whether as a result of
new information, future events or otherwise.
new information, future events or otherwise.
Non-GAAP Financial Measures:
This presentation includes non-GAAP financial measures. Information about any such non-GAAP
This presentation includes non-GAAP financial measures. Information about any such non-GAAP
financial measures, including a reconciliation of those measures to GAAP, can be found in the
presentation and/or in our SEC reports available on our website at http://investors.dnbfirst.com/.
FORWARD-LOOKING STATEMENTS & ADDITIONAL
INFORMATION
2

I. Corporate Overview/Compelling Investment Opportunity (Pages 4-7)
II. Strong Market Drives Opportunity (Pages 8-19)
III. Consistent Performance, Stable Growth & Financial Trends (Pages 20-31)
IV. Experienced Management and Board Leadership (Pages 32-38)
V. Invest in DNBF (Pages 39-42)
TABLE OF CONTENTS
3

CORPORATE OVERVIEW
Founded: 1860, The oldest National Bank in the greater
Philadelphia Region
Philadelphia Region
Headquarters: Downingtown, Chester County, Pennsylvania
NASDAQ Ticker: DNBF
Total Assets: $685 million
Deposits: $576 million
Total Equity: $62 million
Branch Offices: 13
Share Price: $21.25 ($22.00 as of August 25, 2014)
Market Cap: $59 million
Shares Outstanding: 2.8 million
Snapshot June 30, 2014
4
COMPELLING INVESTMENT OPPORTUNITY
Snapshot June 30, 2014
• High quality footprint, serving growing, diversified and affluent markets in
Chester and Delaware Counties, Pennsylvania
Chester and Delaware Counties, Pennsylvania
• Book value per share has grown from $16.18 in 2Q 2013 to $17.62 in 2Q
2014
2014
• High level of low cost core deposits: Cost of Deposits - .25% YTD or .23% QTD
and Composite Cost of Funds - .40% YTD or .38% QTD
and Composite Cost of Funds - .40% YTD or .38% QTD
• Increasing momentum in non-Interest income has grown and now generates
$1 million per quarter with about 29% coming from wealth management
$1 million per quarter with about 29% coming from wealth management
• Strong liquidity combined with the ability to shift earning assets from
investments to loans will contribute to higher margins over time
investments to loans will contribute to higher margins over time
• Superior asset quality - NPL/Gross Loans of 1.18%
5

COMPELLING INVESTMENT OPPORTUNITY
• Well capitalized, highly liquid, with clean, conservative balance sheet
• Well positioned to grow to $1 billion-plus in assets
• Strong Market Demographics
• Favorable loan and low cost deposit trends
• Proven management team generating results since 2007
• Historic quarterly cash dividend
• Focus on Relationship Banking
6
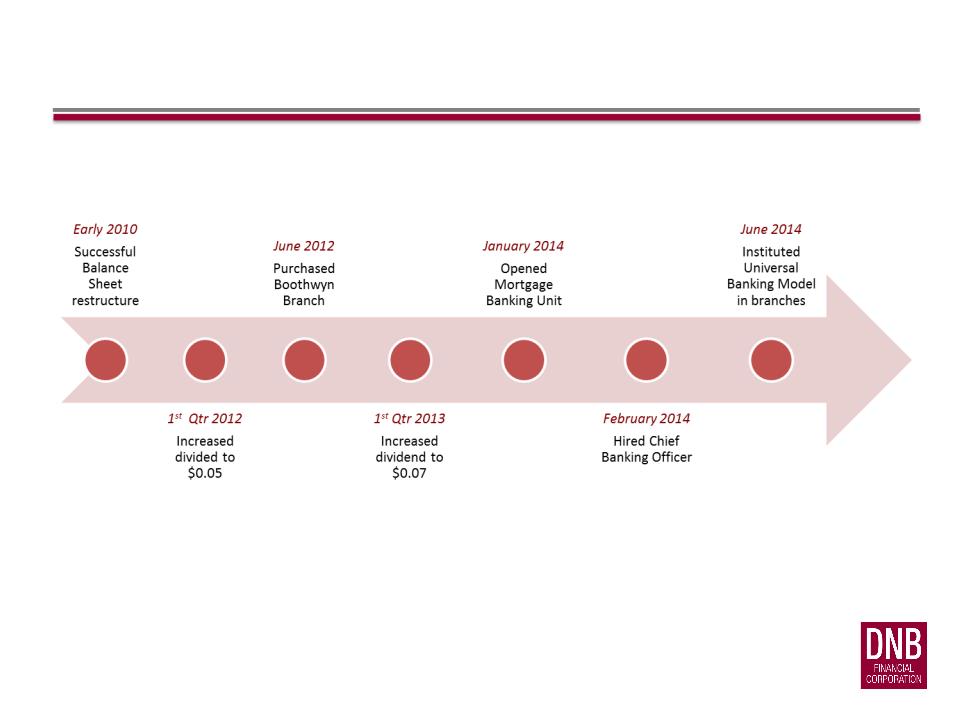
KEY INITIATIVES & MILESTONES
7

Strong Market Drives Opportunity
8
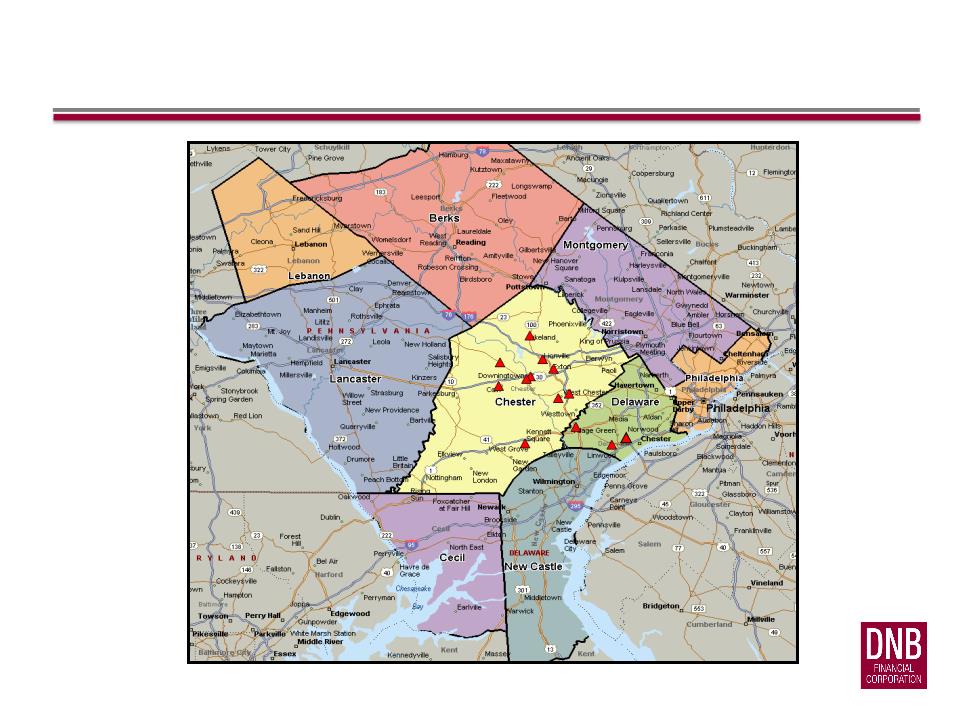
ESTABLISHED PRESENCE IN ATTRACTIVE
SOUTHEASTERN PENNSYLVANIA MARKET
9
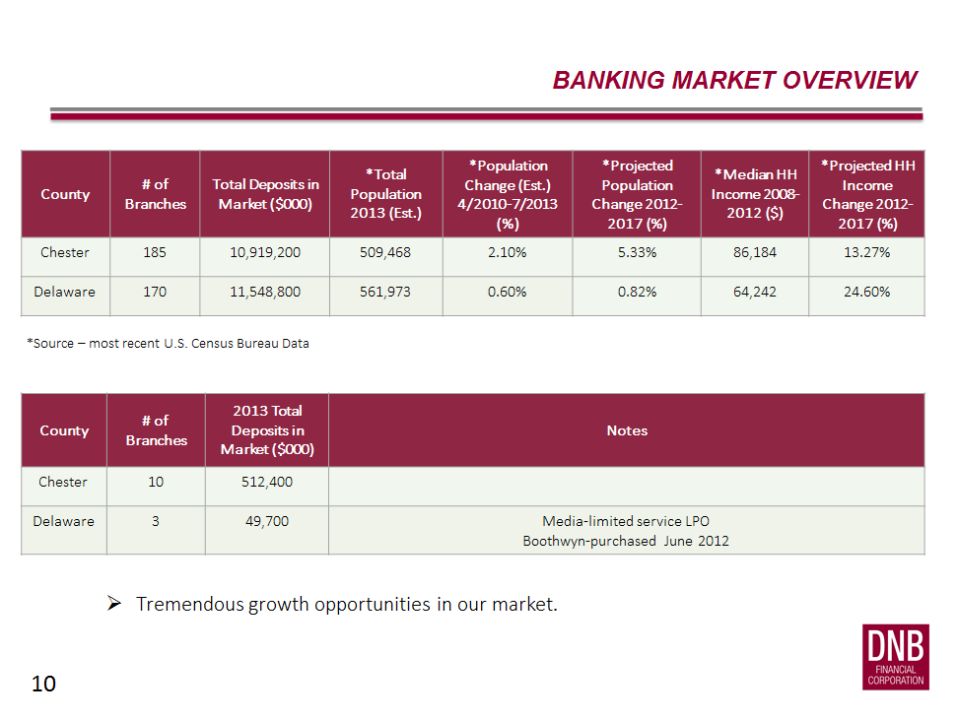

MARKET OVERVIEW AND DEMOGRAPHICS
Largest Market: Chester County, PA
• Fast Growing: Population (est.) 509,468 in 2013, representing an increase of
10,582 from the 2010 Census (2014 data not available)
10,582 from the 2010 Census (2014 data not available)
• Most Affluent County in PA: Median Household Income is $86,184,
significantly above U.S. average of $51,371, and the county ranks 14th
nationally in disposable income (highest income county in the state)
significantly above U.S. average of $51,371, and the county ranks 14th
nationally in disposable income (highest income county in the state)
• Diverse Economy: the largest industry is manufacturing which represents
23.1% of the workforce, retail trade is the major employer making up 13.8%
23.1% of the workforce, retail trade is the major employer making up 13.8%
of the employment and the North East portion of the county is a booming
corridor of high tech pharmaceutical companies (Chester County Chamber of
Commerce)
corridor of high tech pharmaceutical companies (Chester County Chamber of
Commerce)
11

Growing Banking Presence: Delaware County, PA
• Population (est.) 561,098 in 2013, representing an increase of 2,994 from the
2010 Census (2014 data not available)
2010 Census (2014 data not available)
• Median Household Income is $64,242, above U.S. average of $51,371
• Fifth most populous county in the state of PA, conducive for expanded
banking services growth
banking services growth
• In excess of 7,200 businesses (over $500,000 in sales)
MARKET OVERVIEW AND DEMOGRAPHICS
12

• Continue to attract low cost core deposits
• Grow fee revenue as a percentage of total revenues by investing in new
business lines, building full client relationships and maximizing significant
untapped cross-sell potential
business lines, building full client relationships and maximizing significant
untapped cross-sell potential
• Build relationship banking in retail and commercial while providing a
consistent DNB First customer experience
consistent DNB First customer experience
• Maximize the potential of technology, social media and mobile delivery
• Capture additional business with wealth management, insurance and
Mortgage Banking
Mortgage Banking
• Explore accretive Bank & non-Bank acquisition opportunities in Delaware
and Chester counties, as well as in contiguous markets
and Chester counties, as well as in contiguous markets
STRATEGY TO SERVE OUR MARKETS
AND GROW
AND GROW
13

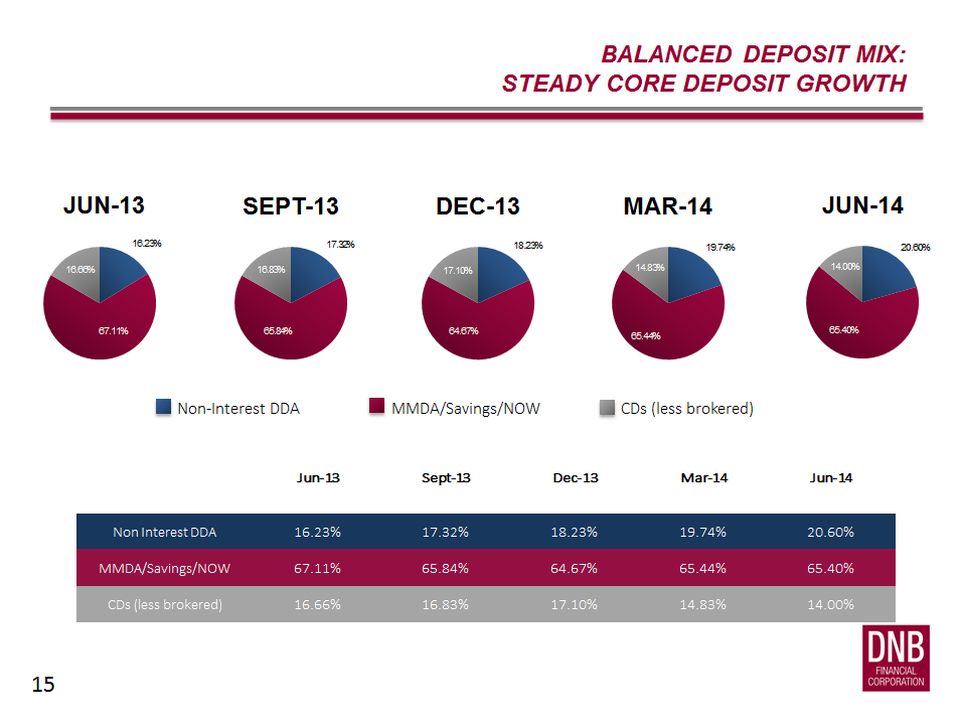

HIGH LEVEL OF LOW
COST CORE DEPOSITS
16
Core Deposits includes: Demand Deposit, NOW , MMDA & Savings
(excludes CD’s)
(excludes CD’s)
DETAILED LOAN PORTFOLIO COMPOSITION
|
Loan Type
|
$ Balance
|
Percent
|
|
Commercial RE OO
|
87,740
|
19.99%
|
|
Commercial RE NOO
|
90,025
|
20.51%
|
|
Residential 1-4
|
67,265
|
15.32%
|
|
Commercial & Industrial
|
55,987
|
12.75%
|
|
Residential 5+
|
33,213
|
7.57%
|
|
SBA/USDA Guaranteed
|
32,281
|
7.35%
|
|
Construction
|
24,051
|
5.48%
|
|
Home Equity LOC
|
25,614
|
5.83%
|
|
Municipal/Govt/Non-Profit
|
6,539
|
1.49%
|
|
Home Equity
|
7,184
|
1.64%
|
|
Consumer
|
7,257
|
1.65%
|
|
Farmland
|
1,864
|
0.42%
|
|
Total
|
439,022
|
100.00%
|
Snapshot June 30, 2014
17
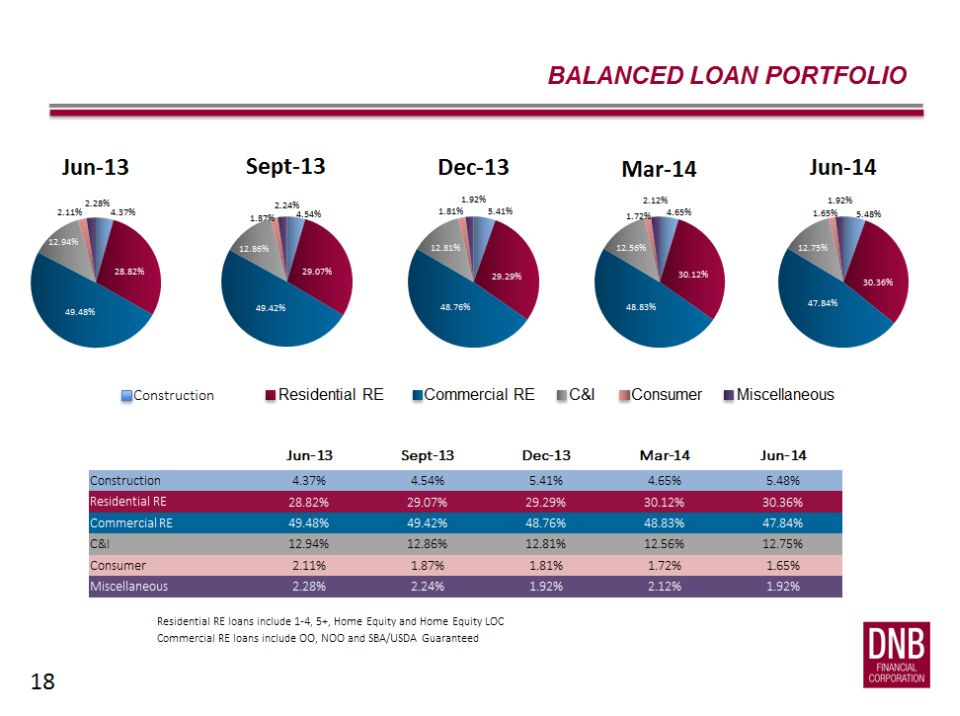

LOAN PORTFOLIO
19

DNB’s Financial Strength, Consistent
Performance, Stable Growth and Financial
Trends
Trends
20
EXECUTIVE SUMMARY
21
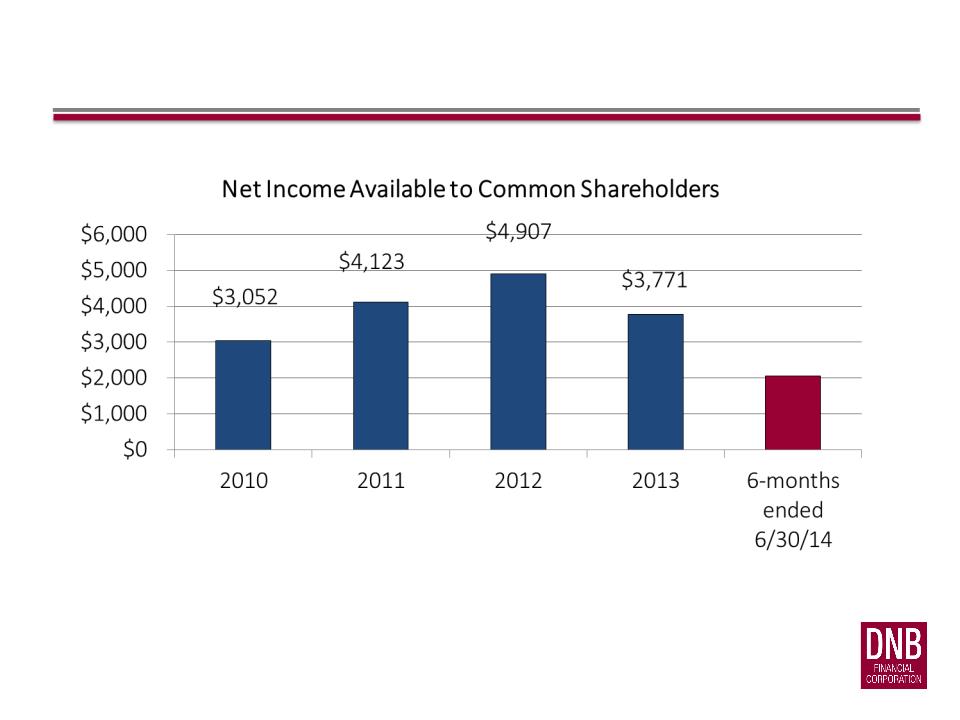
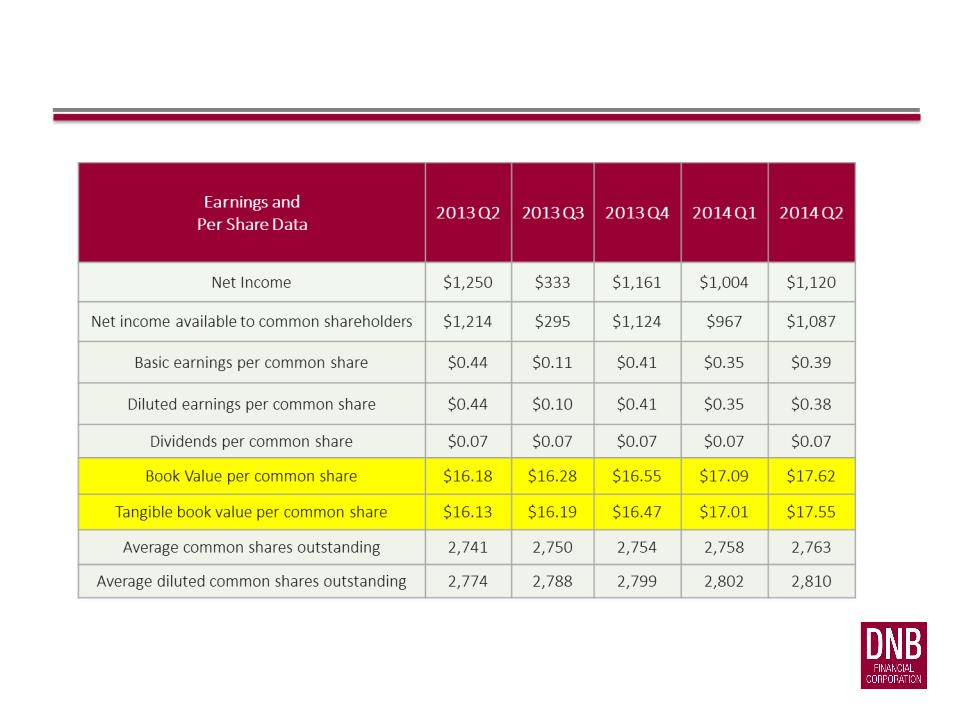
EARNINGS & PER SHARE DATA
22
$2,054

EARNINGS & PER SHARE DATA
23

EARNINGS & PER SHARE DATA
24
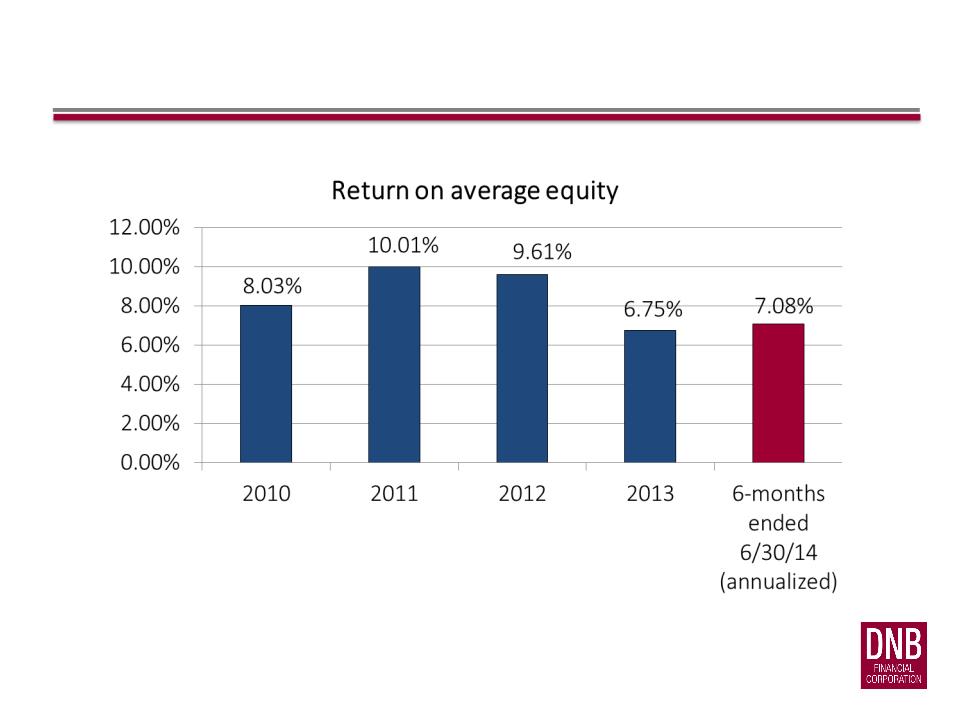
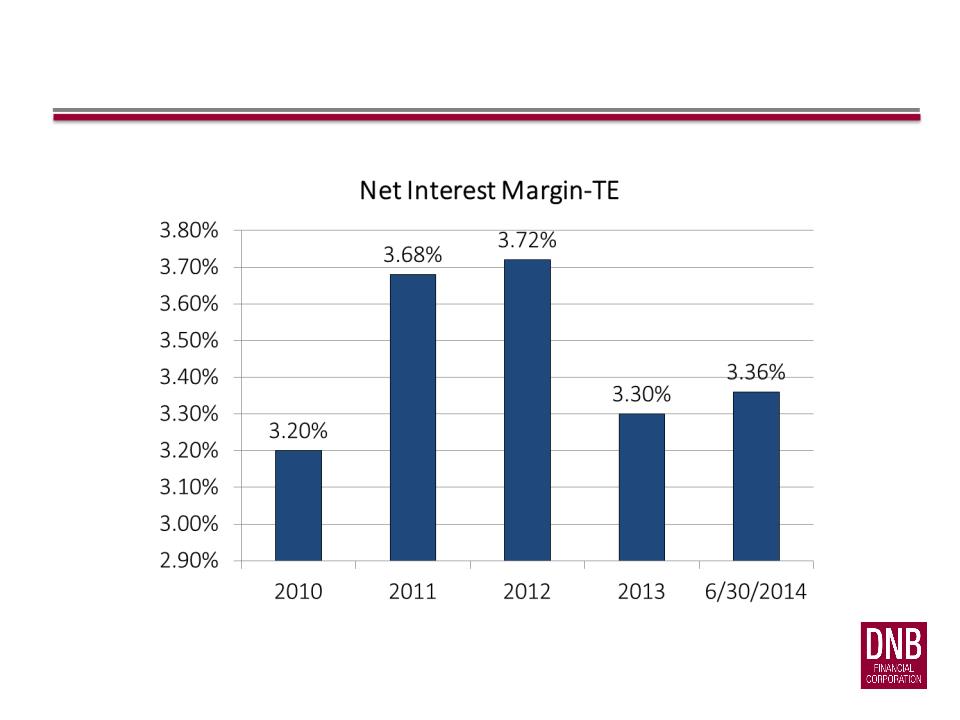
EXECUTIVE SUMMARY
|
Performance Ratios
|
2013 Q2
|
2013 Q3
|
2013 Q4
|
2014 Q1
|
2014 Q2
|
|
Return on average assets
|
0.76%
|
0.20%
|
0.70%
|
0.62%
|
0.67%
|
|
Return on average equity
|
8.60%
|
2.28%
|
7.86%
|
6.78%
|
7.35%
|
|
Return on average tangible
equity |
8.65%
|
2.29%
|
7.89%
|
6.81%
|
7.38%
|
|
Net interest margin
|
3.35%
|
3.21%
|
3.31%
|
3.36%
|
3.36%
|
|
Efficiency ratio
|
66.98%
|
70.84%
|
70.15%
|
73.63%
|
71.97%
|
25

PERFORMANCE RATIOS
26
PERFORMANCE RATIOS
27
PERFORMANCE RATIOS
28
EXECUTIVE SUMMARY
|
Asset Quality Ratios
|
2013
Q2 |
2013
Q3 |
2013
Q4 |
2014
Q1 |
2014
Q2 |
|
Net Charge-offs to average loans
|
0.20%
|
1.02%
|
0.01%
|
0.06%
|
0.03%
|
|
Non-performing loans/Total loans
|
2.60%
|
1.40%
|
1.38%
|
1.26%
|
1.18%
|
|
Allowance for credit loss/Total loans
|
1.72%
|
1.08%
|
1.11%
|
1.10%
|
1.11%
|
|
Allowance for credit loss/Non-
performing loans |
65.94%
|
77.04%
|
80.73%
|
87.59%
|
94.62%
|
29

ASSET QUALITY RATIOS
30

EXECUTIVE SUMMARY
|
Capital Ratios
|
2013
Q2 |
2013
Q3 |
2013
Q4 |
2014
Q1 |
2014
Q2 |
|
Total equity/Total assets
|
8.60%
|
8.89%
|
8.86%
|
8.83%
|
9.00%
|
|
Tangible equity/Tangible assets
|
8.58%
|
8.87%
|
8.84%
|
8.78%
|
8.95%
|
|
Tangible common equity/Tangible assets
|
6.63%
|
6.87%
|
6.87%
|
6.88%
|
7.06%
|
|
Tier 1 leverage ratio
|
10.42%
|
10.39%
|
10.61%
|
10.72%
|
10.76%
|
|
Tier 1 risk-based capital ratio
|
15.22%
|
15.18%
|
15.35%
|
15.00%
|
14.88%
|
|
Total risk-based capital ratio
|
16.47%
|
16.16%
|
16.40%
|
16.04%
|
15.92%
|
31

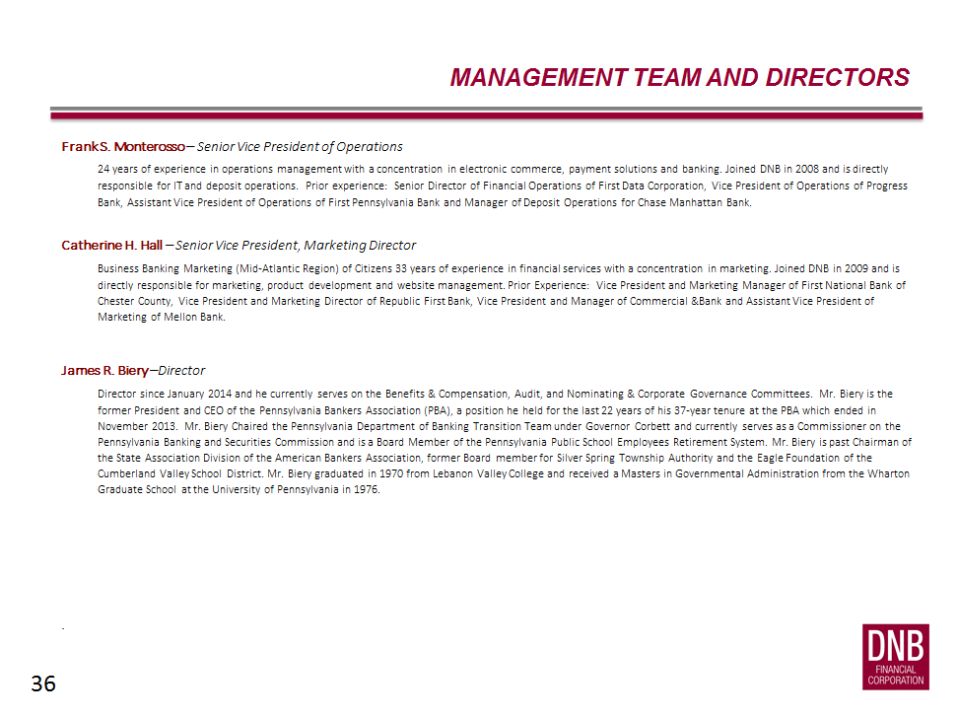
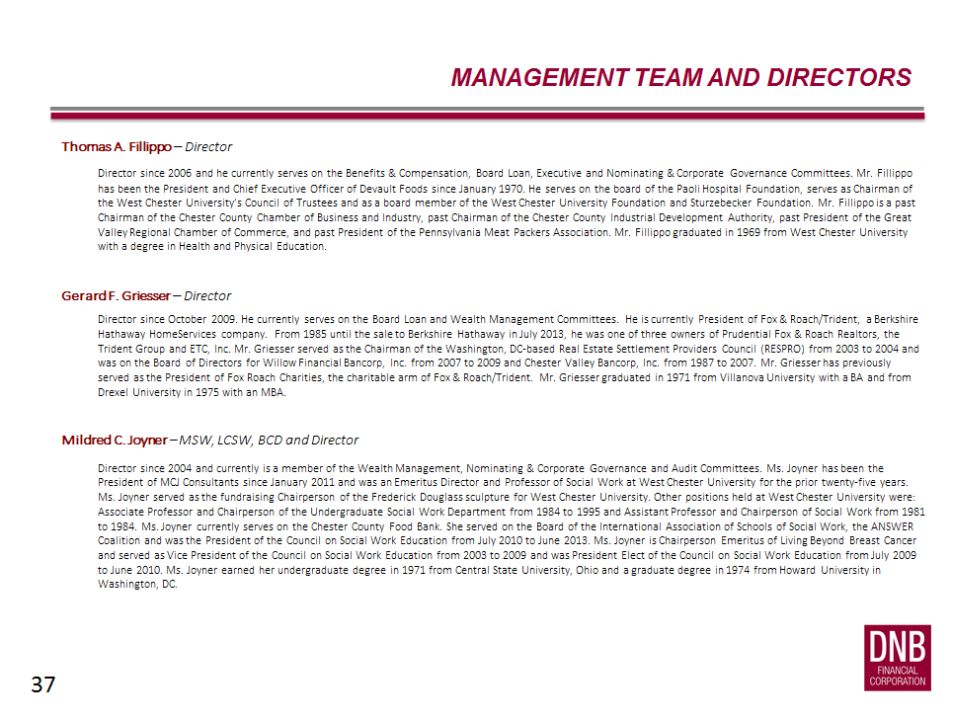
Experienced Management and Board
Leadership
Leadership
32


Invest in DNB Financial
39

DNBF STOCK PERFORMANCE
|
Security or Index
|
2013 Return
|
|
DNBF*
|
33.87%
|
|
NASDAQ Bank Index*
|
39.33%
|
|
KBW Bank Index*
|
34.71%
|
Closing price on Dec 27, 2013: $20.75
Closing price on August 25, 2014: $22.00
*Source: Bloomberg
40

INVESTOR RELATIONS CONTACT
Gerald F. Sopp
484.359.3138
gsopp@dnbfirst.com
http://investors.dnbfirst.com/
41
For more information, Investors may
contact:
contact:

THANK YOU
42