Attached files
| file | filename |
|---|---|
| 8-K - MEADOWBROOK INSURANCE GROUP, INC 8-K 8-28-2014 - MEADOWBROOK INSURANCE GROUP INC | form8k.htm |
| EX-99.1 - EXHIBIT 99.1 - MEADOWBROOK INSURANCE GROUP INC | ex99_1.htm |
Exhibit 99.2

Investor SupplementSecond Quarter 2014 Update

* Forward-Looking Statements & Non-GAAP Financial Measures The Company’s investor presentation may include certain statements which constitute forward-looking statements within the meaning of Section 27A of the Securities Act of 1933, as amended, and Section 21E of the Securities Exchange Act of 1934, as amended. These statements include information regarding the intent, belief, or current expectations of management, including, but not limited to, those statements that use the words “believes,” “expects,” “anticipates,” “estimates,” or similar expressions. You are cautioned that any such forward-looking statements are not guarantees of future performance and involve a number of risks and uncertainties, and results could differ materially from those indicated by such forward-looking statements. Among the important factors that could cause actual results to differ materially from those indicated by such forward-looking statements are: actual loss and loss adjustment expenses exceeding our reserve estimates; competitive pressures in our business; the failure of any of the loss limitation methods we employ; a failure of additional capital to be available or only available on unfavorable terms; our geographic concentration and the business and economic conditions, natural perils, man made perils, and regulatory conditions within our most concentrated regions; our ability to appropriately price the risks we underwrite; goodwill impairment risk employed as part of our growth strategy; efforts with regard to the review of strategic alternatives; actions taken by regulators, rating agencies or lenders, including the impact of the downgrade by A.M. Best of the Company’s insurance company subsidiaries’ financial strength rating, the lowering of the outlook of this rating from “stable” to “negative”, A.M. Best’s downgrade of our issuer credit rating and any other future action by A.M. Best with respect to such ratings; increased risks or reduction in the level of our underwriting commitments due to market conditions; a failure of our reinsurers to pay losses in a timely fashion, or at all; interest rate changes; continued difficult conditions in the global capital markets and the economy generally; market and credit risks affecting our investment portfolio; liquidity requirements forcing us to sell our investments; a failure to introduce new products or services to keep pace with advances in technology; the new federal financial regulatory reform; our holding company structure and regulatory constraints restricting dividends or other distributions by our insurance company subsidiaries; minimum capital and surplus requirements imposed on our insurance company subsidiaries; acquisitions and integration of acquired businesses resulting in operating difficulties, which may prevent us from achieving the expected benefits; our reliance upon producers, which subjects us to their credit risk; loss of one of our core producers; our dependence on the continued services and performance of our senior management and other key personnel; our reliance on our information technology and telecommunications systems; managing technology initiatives and obtaining the efficiencies anticipated with technology implementation; a failure in our internal controls; the cyclical nature of the property and casualty insurance industry; severe weather conditions and other catastrophes; the effects of litigation, including the previously disclosed arbitration and class action litigation or any similar litigation which may be filed in the future; state regulation; and assessments imposed upon our insurance company subsidiaries to provide funds for failing insurance companies. For additional information with respect to certain of these and other factors, refer to the Item 1A of Part I to our Annual Report on Form 10-K for the year ended December 31, 2013 and subsequent filings made with the United States Securities and Exchange Commission. We are not under any obligation to (and expressly disclaim any obligation to) update or alter our forward-looking statements, whether as a result of new information, future events or otherwise.Notes on Non-GAAP Financial MeasuresNet operating income is a non-GAAP measure defined as net income excluding after-tax realized gains and losses. Accident year combined ratio is a non-GAAP measure that represents the impact of any adverse or favorable development on prior year loss reserves.Statutory surplus is a non-GAAP measure with the most directly comparable financial GAAP measure being shareholders’ equity.These non-GAAP metrics are common measurements for property and casualty insurance companies. We believe this presentation enhances the understanding of our results by highlighting the underlying profitability of our insurance business. Additionally, these measures are key internal management performance standards.

* Investments

* Investment Portfolio Review We maintain a high-quality, low-risk investment portfolio. Portfolio Allocation and Quality Low equity risk exposure93% fixed income 7% equityHigh credit quality99% of bonds are investment gradeAverage S&P rating of AA- / Moody’s of Aa3DurationFixed income effective duration is 4.7Tax adjusted fixed income duration is 4.1Duration of Reserves is approximately 3.9
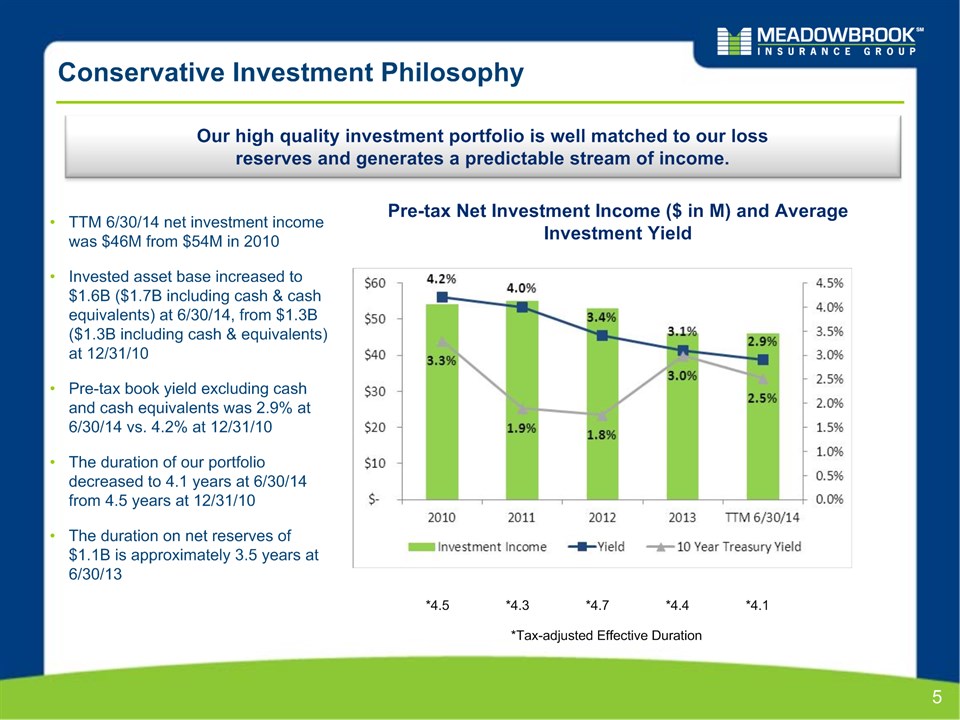
* Conservative Investment Philosophy Our high quality investment portfolio is well matched to our loss reserves and generates a predictable stream of income. TTM 6/30/14 net investment income was $46M from $54M in 2010Invested asset base increased to $1.6B ($1.7B including cash & cash equivalents) at 6/30/14, from $1.3B ($1.3B including cash & equivalents) at 12/31/10Pre-tax book yield excluding cash and cash equivalents was 2.9% at 6/30/14 vs. 4.2% at 12/31/10The duration of our portfolio decreased to 4.1 years at 6/30/14 from 4.5 years at 12/31/10The duration on net reserves of $1.1B is approximately 3.5 years at 6/30/13 Pre-tax Net Investment Income ($ in M) and Average Investment Yield *4.5 *4.3 *4.7 *4.4 *Tax-adjusted Effective Duration *4.1

* Government and Agency – June 30, 2014 Profile Summary Profile $25.0 million market value; approximately 2% of the investment portfolio Rated Aaa by Moody’s and AA+ by S&PJune 30, 2014 net unrealized gain was $452KAverage investment book yield: 1.17% Government & Agency vs. Entire Portfolio Government & Agency Breakout
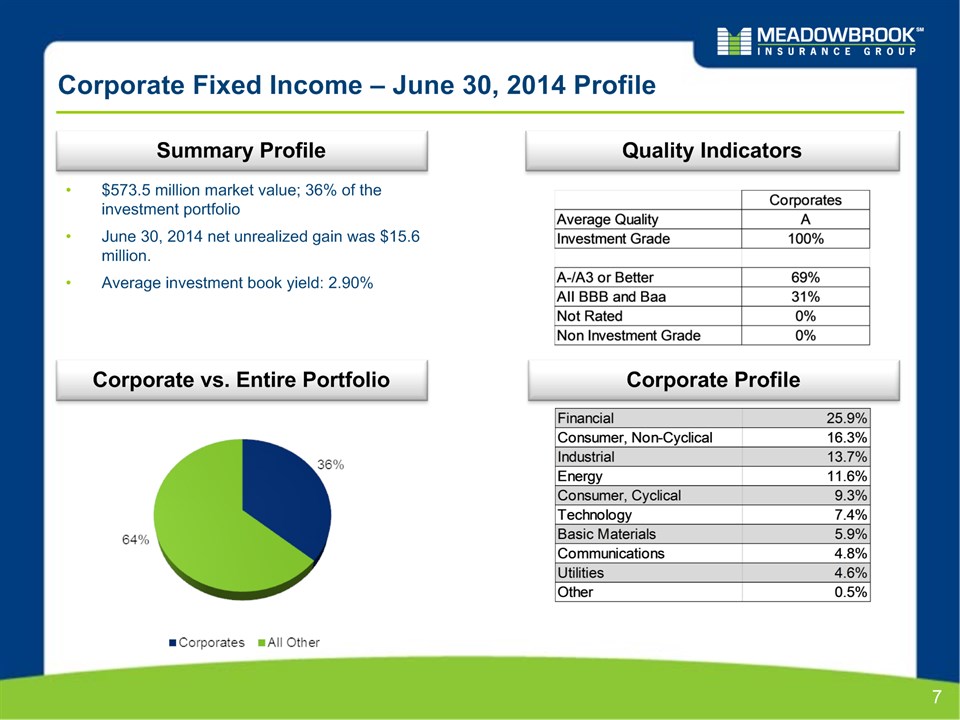
* Corporate Fixed Income – June 30, 2014 Profile Summary Profile $573.5 million market value; 36% of the investment portfolio June 30, 2014 net unrealized gain was $15.6 million.Average investment book yield: 2.90% Quality Indicators Corporate vs. Entire Portfolio Corporate Profile

* Municipal Bonds – June 30, 2014 Profile Summary Profile $733.6 million market value; 46% of the investment portfolio June 30, 2014 net unrealized gain was $21.0 million consist of:Tax exempt $18.4 millionTaxable $2.6 millionAverage tax equivalent yield: 4.30% Quality Indicators & Geographic Distribution Municipals vs. Entire Portfolio Munis Taxable Munis Average S&P Quality AA+ AA+ Investment Grade 100% 100%

* Mortgage & Asset Backed – June 30, 2014 Profile Summary Profile $156.4 million market value; 10% of the investment portfolioAs of June 30, 2014, unrealized gain of $1.4 million;Each sub-class within the structured group, (RMBS, ABS & CMBS) had minor amounts of unrealized gains;Average investment book yield: 2.76% Quality Indicators Structured vs. Entire Portfolio Structured RMBS Profile

* Equities – June 30, 2014 Profile Summary Profile $105.3 million market value; 7% of the investment portfolio;June 30, 2014 net unrealized gain was $13.5 million;All composed of high dividend equities;Average tax equivalent yield: 4.07% Equities vs. Entire Portfolio Equity Mix

* Convertible Debt Offering

* $100M Convertible Debt Offering $100 million Cash Convertible Senior NotesUnderlying “Equivalent” Shares – 10.9 million5.00% Cash Coupon37.5% Conversion Premium ($9.19 per share)75% High Call ($11.69 per share)Net share settlementMaturity of March 15, 2020No covenants Key Terms Use of Proceeds $100,000,000 March 2013 5.00% Cash Convertible Senior Notes due 2020 Interest payable March 15 and September 15 (a) (a) Computed as follows: $100m Convertible Debt / $9.19 Share Price = 10.9 million shares

* MIG Convertible Note We have issued debt with a 5.00% couponWe will pay additional cash if our share price exceeds the $9.19 lower strike price (on 10.9 million “equivalent” shares)We have bought a bond hedge requiring counter parties to pay us the same amount we pay to the note holders in B aboveWe must issue shares to the bond hedge counter parties if market price is above the upper strike price of $11.69 at maturity of the underlying bonds Convert Key Share Prices

* MIG Convertible Note Settlement Stock Price at Maturity Payout at Maturity ($ in millions) < $9.19 > $11.69 MIG Convertible + Call Spread Due 2020 Example if share price = $14: 10.9m 'equivalent' shares x $2.31 ($14 market price less $11.69 higher strike price) = $25.1m divided by $14 share price = 1.8m shares

* Accounting for Convertible Debt Offering The following was recorded in Q1 2013 related to the convertible debt offering (in millions) * Gross proceeds of $100m was bifurcated into $87.1m of debt and $12.9m of derivative liability related to the conversion feature. The $12.9m will accrete to the $100m face value over the life of the loan through a charge to interest expense.The total interest expense impacting the P&L will consist of the 5% coupon payment (paid in cash) and the accretion of the conversion feature noted above of approximately 2.4% (non-cash), or 7.4% total.^ A bond hedge (derivative asset) was purchased to offset the derivative liability recorded related to the conversion feature. The two are marked to market each quarter with no P&L impact as they directly off-set one another.

* Reserve Supplements

Favorable development of $0.8 million, or 0.2 combined ratio percentage pointsGrowth in recent years from rate increases and increase in the average program maturityMore certainty in estimating loss ultimates for mature businessAs programs and books of business mature, underlying claims patterns begin to stabilize allowing more reliance on standard actuarial methods as opposed to actuarial methods modified to consider acceleration in claims handling.Run-off of premium on terminated business has been completedAt 6/30/14 only $1.7M of unearned premium related to terminated business remainedDedicated claims handling team in charge of claims run-off processInitial impact to reserves of claims run-off has been recognizedOpen claim counts on terminated business down 47% from 4.9k at 12/31/12 to 2.6k at 6/30/14Achieved rate increases in excess of loss costs across all lines of business - achieved 4.5 year cumulative written rate increases in excess of 30% compared to cumulative loss ratio trend increases of approximately 10%Previous calendar year development on prior year reserves imbedded in the 2013 & 2014 accident year loss selection resulting in a stronger reserve positionCurrent accident year loss & LAE ratio selection reflects a more conservative expected loss ratio within the standard actuarial methods and consideration of the inherent risks associated with a less mature accident year Reserves continued to stabilize with modest favorable development in first half of 2014 *
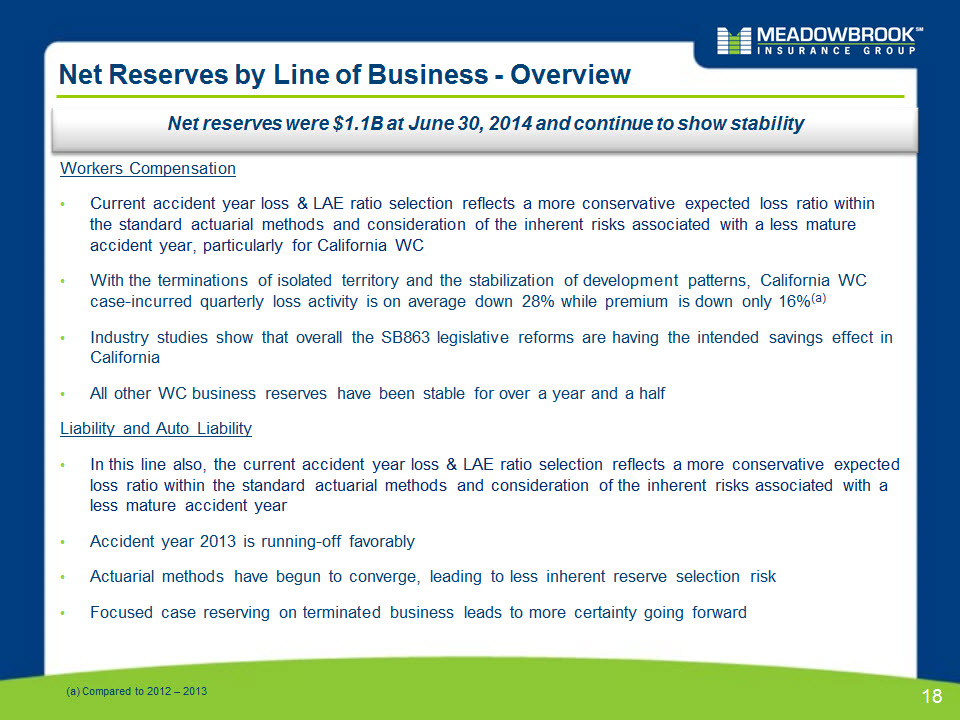
* Net Reserves by Line of Business - Overview Net reserves were $1.1B at June 30, 2014 and continue to show stability Workers CompensationCurrent accident year loss & LAE ratio selection reflects a more conservative expected loss ratio within the standard actuarial methods and consideration of the inherent risks associated with a less mature accident year, particularly for California WCWith the terminations of isolated territory and the stabilization of development patterns, California WC case-incurred quarterly loss activity is on average down 28% while premium is down only 16%(a) Industry studies show that overall the SB863 legislative reforms are having the intended savings effect in CaliforniaAll other WC business reserves have been stable for over a year and a halfLiability and Auto LiabilityIn this line also, the current accident year loss & LAE ratio selection reflects a more conservative expected loss ratio within the standard actuarial methods and consideration of the inherent risks associated with a less mature accident yearAccident year 2013 is running-off favorablyActuarial methods have begun to converge, leading to less inherent reserve selection riskFocused case reserving on terminated business leads to more certainty going forward (a) Compared to 2012 – 2013
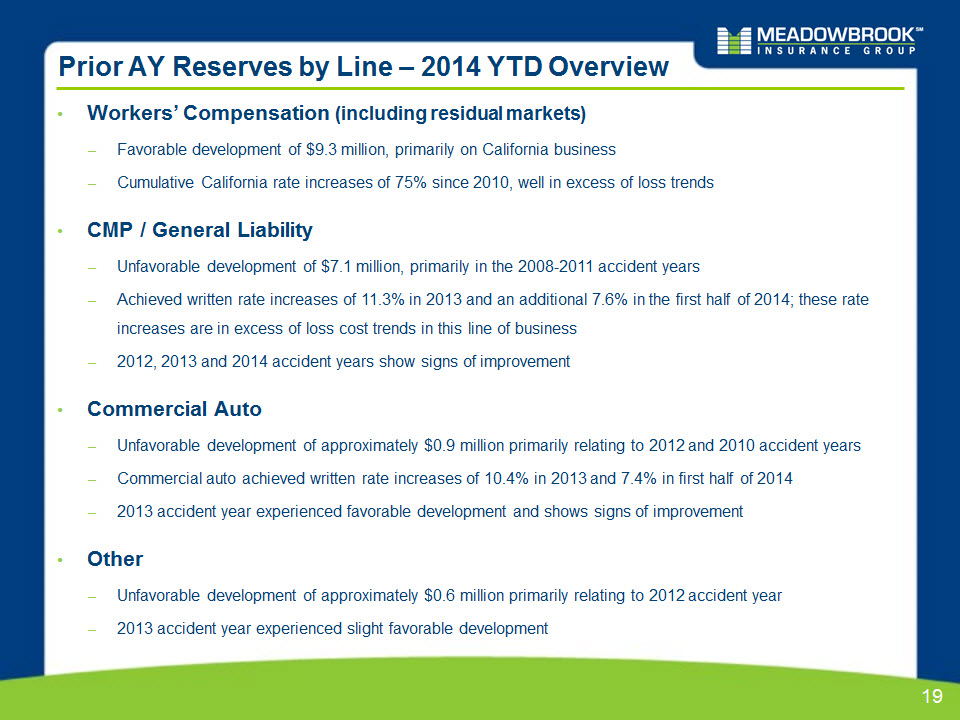
Workers’ Compensation (including residual markets)Favorable development of $9.3 million, primarily on California businessCumulative California rate increases of 75% since 2010, well in excess of loss trendsCMP / General LiabilityUnfavorable development of $7.1 million, primarily in the 2008-2011 accident yearsAchieved written rate increases of 11.3% in 2013 and an additional 7.6% in the first half of 2014; these rate increases are in excess of loss cost trends in this line of business2012, 2013 and 2014 accident years show signs of improvementCommercial AutoUnfavorable development of approximately $0.9 million primarily relating to 2012 and 2010 accident yearsCommercial auto achieved written rate increases of 10.4% in 2013 and 7.4% in first half of 20142013 accident year experienced favorable development and shows signs of improvementOtherUnfavorable development of approximately $0.6 million primarily relating to 2012 accident year2013 accident year experienced slight favorable development * Prior AY Reserves by Line – 2014 YTD Overview

* Reserve Development Shift – Emergence in 2012 and Stabilization in First Half of 2014 Historic Calendar Year Reserve Development Percent of Prior Year Reserves 4.5 % (0.9 %) (9.7 %) (a) 2.3% 4.9% 4.6% Reserve Development :Favorable / (Adverse) ($m) (6.7%) (b) 0.1% (a) Calendar Year 2012 development reflects impact of adjuster staff increase in California WC, claims initiatives on liability occurrence and auto liability, and public entity excess.(b) Calendar year 2013 development primarily reflects increased severity in excess & surplus lines, an isolated California WC territory (that has since been terminated), terminated auto liability business, and public entity excess (which has also been terminated)

AY Loss & ALAE Ratio Net Earned Premium On-going BusinessAY Loss & ALAE Ratio CA Workers’ Comp.* Non-CA Workers’ Comp.* Commercial Auto CMP / GL On-going book of business has generated attractive loss & ALAE ratios across all lines of business AY Loss and ALAE Ratio by LOB Summary * Note: Statutory accident year loss & ALAE ratios evaluated at 6/30/14 and excludes the impact of the Swiss Re quota share.* CA Workers’ Comp and Non-CA Workers’ Comp above exclude residual markets results.

* Terminated Business Statistics Reserves on terminated business have been strengthened and premium has largely run off

($ in millions) * Net Reserve Distribution Reserves, net of reinsurance recoverables, totaled $1.1 billion at both December 31, 2013 and June 30, 2014

* California Workers’ Compensation

California Workers’ CompensationLow Hazard Mix of Business * How does our business mix compare to California workers’ compensation industry? Low hazard group mixWe write approximately 70% of our premium in hazard groups 1 & 2 vs. 55% for the industryAlmost no premium in hazard groups 6 & 7 vs. 5% for the industryIndustry group mix favorableWe write approximately 71% of our premium in the goods and services industry vs. 39% for the industryWe write approximately 1% of our premium in the construction industry vs. 13% for the industryOur construction business is approximately 50% landscape/farm contractors

California Workers’ CompensationLow Hazard Mix of Business (Continued) We write our premium in less hazardous groups and more favorable CA WC industries Hazard Group Distribution Meadowbrook Industry * 6 & 7 1 & 2 3, 4 & 5 3, 4 & 5 1 & 2 6 & 7 NOTE: %’s above are approximate.
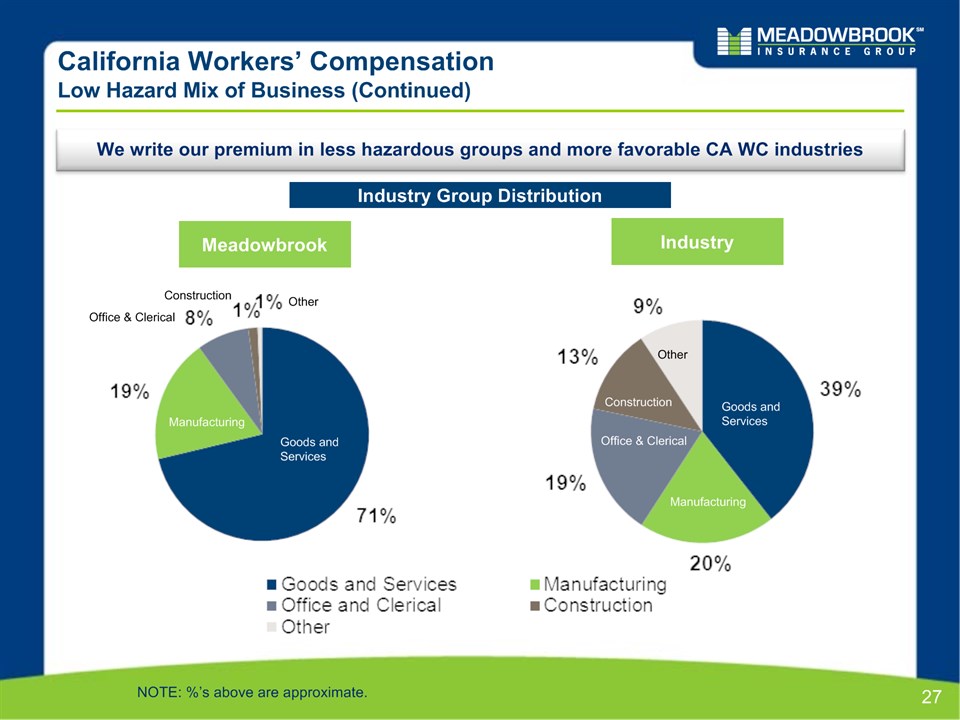
California Workers’ CompensationLow Hazard Mix of Business (Continued) We write our premium in less hazardous groups and more favorable CA WC industries Meadowbrook Industry Industry Group Distribution * Manufacturing Goods andServices Goods andServices Manufacturing Office & Clerical Office & Clerical Construction Construction Other Other NOTE: %’s above are approximate.