Attached files
| file | filename |
|---|---|
| 8-K - 8-K - PENN VIRGINIA CORP | d777671d8k.htm |
| EX-99.1 - EX-99.1 - PENN VIRGINIA CORP | d777671dex991.htm |
 Investor
Presentation August 25, 2014
NYSE: PVA
Exhibit 99.2 |
 Forward-Looking Statements / Oil and Gas Reserves and Definitions
1
Forward-Looking Statements
Certain
statements
contained
herein
that
are
not
descriptions
of
historical
facts
are
“forward-looking”
statements
within
the
meaning
of
Section
27A
of
the
Securities
Act
of
1933,
as
amended,
and
Section
21E
of
the
Securities
Exchange
Act
of
1934,
as
amended.
Because
such
statements
include
risks,
uncertainties
and
contingencies,
actual
results
may
differ
materially
from
those
expressed
or
implied
by
such
forward-looking
statements.
These
risks,
uncertainties
and
contingencies
include,
but
are
not
limited
to,
the
following:
the
volatility
of
commodity
prices
for
oil,
natural
gas
liquids
and
natural
gas;
our
ability
to
develop,
explore
for,
acquire
and
replace
oil
and
gas
reserves
and
sustain
production;
our
ability
to
generate
profits
or
achieve
targeted
reserves
in
our
development
and
exploratory
drilling
and
well
operations;
any
impairments,
write-downs
or
write-offs
of
our
reserves
or
assets;
the
projected
demand
for
and
supply
of
oil,
natural
gas
liquids
and
natural
gas;
reductions
in
the
borrowing
base
under
our
revolving
credit
facility;
our
ability
to
contract
for
drilling
rigs,
supplies
and
services
at
reasonable
costs;
our
ability
to
obtain
adequate
pipeline
transportation
capacity
for
our
oil
and
gas
production
at
reasonable
cost
and
to
sell
the
production
at,
or
at
reasonable
discounts
to,
market
prices;
the
uncertainties
inherent
in
projecting
future
rates
of
production
for
our
wells
and
the
extent
to
which
actual
production
differs
from
estimated
proved
oil
and
gas
reserves;
drilling
and
operating
risks;
our
ability
to
compete
effectively
against
oil
and
gas
companies;
our
ability
to
successfully
monetize
select
assets
and
repay
our
debt;
leasehold
terms
expiring
before
production
can
be
established;
environmental
obligations,
costs
and
liabilities
that
are
not
covered
by
an
effective
indemnity
or
insurance;
the
timing
of
receipt
of
necessary
regulatory
permits;
the
effect
of
commodity
and
financial
derivative
arrangements;
our
ability
to
maintain
adequate
financial
liquidity
and
to
access
adequate
levels
of
capital
on
reasonable
terms;
the
occurrence
of
unusual
weather
or
operating
conditions,
including
force
majeure
events;
our
ability
to
retain
or
attract
senior
management
and
key
technical
employees;
counterparty
risk
related
to
their
ability
to
meet
their
future
obligations;
compliance
with
and
changes
in
governmental
regulations
or
enforcement
practices,
especially
with
respect
to
environmental,
health
and
safety
matters;
uncertainties
relating
to
general
domestic
and
international
economic
and
political
conditions;
and
other
risks
set
forth
in
our
filings
with
the
Securities
and
Exchange
Commission
(SEC).
Additional
information
concerning
these
and
other
factors
can
be
found
in
our
press
releases
and
public
periodic
filings
with
the
SEC.
Many
of
the
factors
that
will
determine
our
future
results
are
beyond
the
ability
of
management
to
control
or
predict.
Readers
should
not
place
undue
reliance
on
forward-looking
statements,
which
reflect
management’s
views
only
as
of
the
date
hereof.
We
undertake
no
obligation
to
revise
or
update
any
forward-looking
statements,
or
to
make
any
other
forward-looking statements, whether as a result of new information, future events, changed
circumstances or otherwise. Oil and Gas Reserves
Effective
January
1,
2010,
the
SEC
permits
oil
and
gas
companies,
in
their
filings
with
the
SEC,
to
disclose
not
only
“proved”
reserves,
but
also
“probable”
reserves
and
“possible”
reserves.
As
noted
above,
statements
of
reserves
are
only
estimates
and
may
not
correspond
to
the
ultimate
quantities
of
oil
and
gas
recovered.
Investors
are
urged
to
consider
closely
the
disclosure
in
PVA’s
Annual
Report
on
Form
10-K
for
the
fiscal
year
ended
December
31,
2013,
which
is
available
from
PVA
at
Four
Radnor
Corporate
Center,
Suite
200,
Radnor,
PA
19087
(Attn:
Investor
Relations).
You
can
also
obtain
this
report
from
the
SEC
by
calling
1-800-SEC-0330
or
from
the
SEC’s website at www.sec.gov.
Definitions
Proved
reserves
are
those
quantities
of
oil
and
gas
which,
by
analysis
of
geosciences
and
engineering
data,
can
be
estimated
with
reasonable
certainty
to
be
economically
producible
from
a
given
date
forward,
from
known
reservoirs,
and
under
existing
economic
conditions,
operating
methods
and
government
regulation
before
the
time
at
which
contracts
providing
the
right
to
operate
expire,
unless
evidence
indicates
that
renewal
is
reasonably
certain,
regardless
of
whether
the
estimate
is
a
deterministic
estimate
or
probabilistic
estimate.
Probable
reserves
are
those
additional
reserves
that
are
less
certain
to
be
recovered
than
proved
reserves,
but
which
are
as
likely
than
not
to
be
recoverable
(there
should
be
at
least
a
50%
probability
that
the
quantities
actually
recovered
will
equal
or
exceed
the
proved
plus
probable
reserve
estimates).
Possible
reserves
are
those
additional
reserves
that
are
less
certain
to
be
recoverable
than
probable
reserves
(there
should
be
at
least
a
10%
probability
that
the
total
quantities
actually
recovered
will
equal
or
exceed
the
proved
plus
probable
plus
possible
reserve
estimates).
“3P”
reserves
refer
to
the
sum
of
proved,
probable
and
possible
reserves.
Estimated
ultimate
recovery
(EUR)
is
the
sum
of
reserves
remaining
as
of
a
given
date
and
cumulative
production
as
of
that
date.
EUR
is
a
measure
that
by
its
nature
is
more
speculative
than
estimates
of
reserves
prepared
in
accordance
with
SEC
definitions
and
guidelines
and
accordingly is less certain.
Reconciliation of GAAP and Non-GAAP Financial Measures
This
presentation
contains
references
to
both
GAAP
and
non-GAAP
financial
measures.
Reconciliations
between
GAAP
and
non-GAAP
financial
measures
are
available
in the appendix to this presentation. |
 2
•
Contiguous and high-quality acreage position in the Eagle
Ford
•
Approximately 101,800 net acres with over 1,600 potential identified drilling
locations; approximately 12-year drilling inventory with 8 rigs
(1)
•
Continue to high-grade our drilling program and increase acreage footprint
•
Recent operational success
•
Strong Upper Eagle Ford results have confirmed stacked potential
and
significant upside
•
Excellent results in the Shiner “Beer Quad”
and Peach Creek areas
•
Significant
oil
focus
–
current
2014E
oil
production
growth
guidance of 42% to 49%
•
Experienced team manages aggressive growth strategy
•
Portfolio optimization focusing on Eagle Ford growth
•
YTD 2014 divestitures with gross proceeds of $319 MM
•
Recently announced Eagle Ford acreage acquisition for $45 MM
(1)
(1) Acreage and location data includes impact of Eagle Ford acquisition announced on 7/10/14
and expected to close in August 2014. Penn Virginia Today
Eagle Ford Shale Will Drive Continued Growth |
 3
Granite Wash/Mid-Continent
Eagle Ford/South Texas
East Texas
Total Company
•
YE 2013 Proved Reserves
(1)
•
2Q 2014 Production
(1)
•
Eagle Ford Acreage & Locations
(2)
(1)
(2)
Acreage and location data includes impact of Eagle Ford acquisition announced on 7/10/14 and
expected to close in August 2014. Includes
14.2
MMBOE
of
proved
reserves
at
YE13
and
1.9
MBOEPD
of
2Q14
production
from
Mississippi
assets
sold
in
July
2014.
Operating Areas
As of and for the Quarter Ended June 30, 2014
•
~142,500 gross (~101,800 net)
•
Over 1,600 gross potential
identified drilling locations
•
7
rigs
drilling,
plan
to
add
8
th
in
3Q
2014
•
21.8 MBOEPD
•
56% Oil, 70% Liquids
•
3% growth over 1Q14
•
136.3 MMBOE
•
40% Developed
•
45% Oil, 61% Liquids
YE13 Proved Reserves: 75.6 MMBOE
29% Developed
2Q14 Production: 15.6 MBOEPD
YE13 Proved Reserves: 35.9 MMBOE
41% Developed
2Q14 Production: 2.4 MBOEPD
YE13 Proved Reserves: 10.6 MMBOE
80% Developed
2Q14 Production: 1.8 MBOEPD |
 Strategy
4
Focused on
Operational Execution
and Further
Expansion in the
Eagle Ford
•
Increasing
to
eight
drilling
rigs
in
3Q
2014,
107
(64.5
net)
TILs
in
2014
(1)
•
Goal: continue to increase acreage position in our “backyard”
•
Delivering high levels of production, reserve and EBITDAX growth
Focused on
Maintaining
Good Liquidity
•
Recent offering, sale of assets, cash flow from operations and availability under
our revolver provide liquidity to fund our anticipated development
program •
Goal is to self-fund our capital program by 2017
•
Recent asset sales and arbitration award increased liquidity
Focused on
Generating New
Opportunities
•
Delineating
reserve
and
production
potential
of
Upper
Eagle
Ford
(Marl)
Shale
•
Continuing to evaluate new oil resource play opportunities that have early entry
possibilities
(1) Assumes 64 (36.5 net) TILs (turn-in lines) for the balance of 2014.
•
Selma
Chalk
assets
–
closed
July
2014
for
$73
MM
gross
•
Eagle
Ford
oil
gathering/transportation
rights
–
closed
July
2014
for
$150
MM
gross
•
Eagle
Ford
gas
gathering/gas
lift
assets
–
closed
January
2014
for
$94
MM
gross
•
Arbitration award of $35 MM |
 5
(1) Pro forma to exclude divested Mississippi volumes. Assumes 64 (36.5 net) TILs
(turn-in lines) for the balance of 2014, of which 14 (12.3 net) wells will be in the Upper Eagle Ford, 22 (9.0 net) wells will be in the “Beer
Quad”,
8
(4.3
net)
wells
will
be
in
Peach
Creek
and
11
(4.3
net)
will
be
in
Rock
Creek
Ranch,
with
6
(3.9
net)
shallow
wells
and
three
(2.8
net)
wells
in
other
areas
of
Shiner.
Shallow
wells
are
wells
with
less
than
10,500’
of
vertical depth (defined as measured depth less lateral length)
•
We have significantly
increased oil production
over the last few years,
and we expect that trend
to continue
•
Addition of 7
th
and 8
th
rigs is anticipated to
provide total production
growth
of
35
-
45%
and
oil
production growth of 45 -
60% in 2015
•
Anticipate 64 (36.5 net)
TILs during 2H14
2014-2015
Historical
and
Estimated
Production
Growth
(1)
PVA is an Eagle Ford Oil Growth Story
0
5,000
10,000
15,000
20,000
25,000
30,000
35,000
40,000
1Q14
2Q14
3Q14-E
4Q14-E
2015-E
Pro Forma Daily Production by Quarter and 2015
Oil (BOPD)
NGL (BOPD)
Gas (BOEPD)
Pro Forma
Guidance
Range
Guidance
Range
Pro Forma
Production
Pro Forma
Production
Guidance
Range |
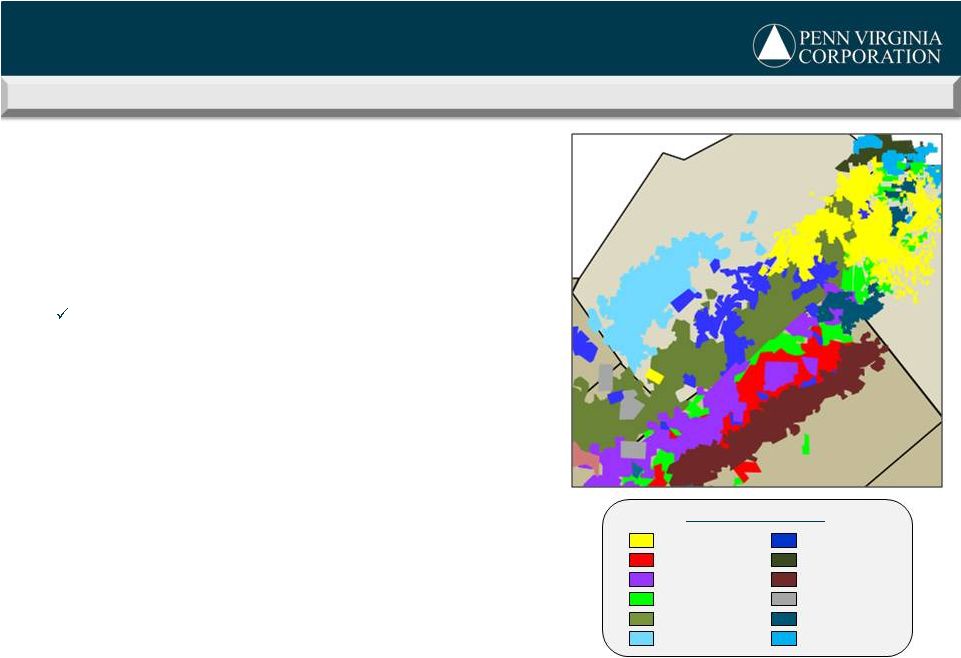 PVA
BHP Billiton
ConocoPhillips
Devon
EOG
Forest / Sabine
Nearby Operators
Marathon
Earthstone
Pioneer
Plains
Sabine / Forest
Sanchez
Gonzales
Lavaca
DeWitt
6
Overview of PVA’s Eagle Ford Position
•
142,500 gross (101,800 net) acres
(1)
•
Avg. IP/30-day rates of 1,490/943 BOEPD for the last 82/68 wells in the
Peach
Creek,
Rock
Creek,
Bozka
and
Shiner
Areas
(2)
•
16,860 net BOEPD of June 2014 Eagle Ford sales (74% oil; 15% NGLs)
•
Proved
PV-10
at
YE13
of
$1,584
MM
($754
MM
of
PD
value)
(3)
Approximately 190 MMBOE of 3P reserves at YE13, excluding Upper
Eagle Ford upside
(4)
•
Greater than 1,600 remaining gross drilling locations
•
Positive down-spacing results associated with pad drilling
•
Additional upside potential in Upper Eagle Ford (Marl) and Austin Chalk
•
Rigs and infrastructure in place
•
Drilling
plan
includes
8
rigs
in
2H14;
64
(36.5)
net
wells
to
be
TIL in 2H14
•
Multiple providers of frac stimulation services
•
Monetized gas gathering and gas lift systems and oil gathering and
transportation rights in 1H14 for approximately $245 MM
(1)
Acreage and location data includes impact of Eagle Ford acquisition announced on 7/10/14 and
expected to close in August 2014. (2)
Since the beginning of 2Q13; excludes “shallow” wells. Shallow wells are wells
with less than 10,500’ of vertical depth (defined as measured depth less lateral length).
(3)
Based on SEC proved reserve estimates as of 12/31/13. See reconciliation to standardized
measure in appendix. (4)
3P reserves based on internal estimates of probable and possible reserves as of 12/31/13.
Emerging Presence in Leading U.S. Oil Shale Play |
 7
Growing Our Eagle Ford Position
Increases in Production, Revenues and Reserves
Growth in Eagle Ford Production
Growth in Eagle Ford Proved Reserves
Growth in Eagle Ford Revenues
Growth in Eagle Ford 3P Reserves |
 PVA's
Concentrated Position in the Eagle Ford Over
100,000
Net
Acres
in
the
Core
of
the
Eagle
Ford
(1)
8
(1) Acreage and location data includes impact of Eagle Ford acquisition announced on 7/10/14
and expected to close in August 2014. |
 9
Currently have >600
Upper Eagle Ford
(Marl) Shale Drilling
Locations
•
Located in the eastern portion of our Lavaca County acreage position
•
Potential of the Upper Eagle Ford has expanded to the east and west with the
recent results of our Welhausen and Martinsen wells
Additional 400
Drilling Locations
May Exist On
"Legacy" Acreage
•
Located in the Peach Creek Field and other portions of the Shiner Field
•
For
now,
our
inventory
assumes
only
“lower”
Eagle
Ford
locations
in
these
areas
Early Upper Eagle
Ford Results Have
Been Very
Encouraging
•
PVA’s two recent test wells: Welhausen #A2H and Martinsen #2H
•
Welhausen #2H IP –
2,165 BOEPD (26 frac stages); 1,070 BOEPD over 95 days
•
Martinsen #2H IP –
1,360 BOEPD (27 frac stages); 1,238 BOEPD over 30 days
•
Plan to spud 19 and TIL 14 (12.3 net) Upper Eagle Ford wells in 2H14
210 to 450 MMBOE
of Gross Resource
Potential May Exist
Across Our Current
Acreage
•
Assumes an EUR range of 350 to 450 MBOE per well
•
Assumes 600 to 1,000 gross drilling locations
Upper Eagle Ford / Marl Upside |
 Lavaca
Gonzales
Fayette
Lavaca
Gonzales
Lavaca
FEET
0
13,954
Upper Eagle Ford / Marl Upside
10
Devon Medina #2H
Drilling
Sabine –
Sustr #1H
IP 1,054 BOEPD IP30 869 BOEPD
Sabine –
Targac #1H
IP 1,226 BOEPD IP30 840 BOEPD
Sabine –
Gillespie #1H
IP 843 BOEPD IP30 654 BOEPD
Tier 1 Fairway
Existing Completions
2014 Spuds (1-2 well pads)
PVA Leasehold
Upper Eagle Ford / Marl
Penn Virginia Martinsen #2H
IP 1,360 BOEPD IP30 1,238 BOEPD
CUM 56,187 1.7 months
27 frac stages / 5,857’
lateral
Penn Virginia Fojtik #1H
IP 1,209 BOEPD IP30 684 BOEPD
CUM 97,308 BOE –
15.4 months
17 frac stages / 4,202’
lateral
Penn Virginia Welhausen #A2H
IP 2,165 BOEPD IP30 1,767 BOEPD
CUM 101,685 –
3.1 months
26 frac stages / 5,976’
lateral |
 Upper EF
Performance Substantiates Development Plan to spud 19 and TIL 14 (12.3 net) Upper Eagle
Ford wells in 2H14 2014 Upper Eagle Ford Tests
Welhausen #A2H
•
26 frac stages
•
IP: 2,165 BOEPD
83.3 BOEPD / stage
•
IP95: 1,070 BOEPD
41.1 BOEPD / stage
Martinsen #2H
•
27 frac stages
•
IP: 1,360 BOEPD
50.4 BOEPD / stage
•
IP30: 1,238 BOEPD
45.9 BOEPD / stage
11
0
10
20
30
40
50
60
70
80
90
100
15
30
45
60
75
90
Days on Production
Upper Eagle Ford Shale
Aligned Days of Production
Internal Shiner Type Curve
Welhausen #A2H
Martinsen #2H |
 •
Due to acquisitions and leasing efforts, our acreage position currently stands at 142,500 gross
(101,800 net) acres
(1)
•
We have an inventory of 1,600+ gross potential identified drilling locations, generating
a ~12-year inventory with 8 rigs
•
3 successful tests of Upper Eagle Ford (Marl) thus far, 19 more spuds planned for 2H14
•
Inventory will continue to increase with an ongoing active leasing program
•
Potential for additional 400 stacked lateral Upper Eagle Ford locations overlying Lower Eagle
Ford locations 12
Note: Latest through 07/31/14
(1)
Acreage and location data Includes impact of Eagle Ford acquisition announced on 7/10/14 and
expected to close in August 2014. (2)
Includes over 600 undeveloped and 3 developed Upper Eagle Ford (Marl) Shale locations and wells
in Shiner. (3)
Represents gross acres per location. Actual location count depends upon lease configurations,
lateral lengths and spacing between laterals. Area
Producing
Wells
Drilling
Locations
(2)
Gross
Acreage
Net
Acreage
Acres /
Location
(3)
Shiner-
Upper
EF
(1,2)
3
617
30,025
26,571
48
Shiner
-
Beer
Quad
22
48
6,400
3,354
91
Shiner
-
Other
28
417
37,957
31,603
85
Peach Creek
125
311
32,007
16,696
73
Rock Creek / Bozka
22
78
6,472
5,084
65
Shallow / Hunt
31
179
29,647
18,472
141
Totals
231
1,650
142,508
101,780
76
Eagle Ford Drilling Inventory
Inventory of Drilling Locations Increasing Due to Leasing and Downspacing
|
 2H 2014 Work
Program Focused on Best Areas 13
Notes
Includes Eagle Ford wells over the past five quarters. The 58 gross wells panned for 2H14
excludes six shallow wells. 22
14
11
8
0
3
58 Gross TILs
2H 2014:
0
10
20
30
40
50
60
70
80
0
250
500
750
1,000
1,250
1,500
1,750
2,000
Shiner High
GOR
Rock Creek
Bozka
Peach Creek
Shiner -
Mod
GOR
Upper EF
Shiner Beer
Quad
Initial Production (Boe/d; left axis)
Initial Production (per stage; right axis)
Initial Production per Area |
 Well Costs per
Stage are Declining 14
Notes
-
Excludes shallow wells.
$0
$100
$200
$300
$400
$500
$600
$700
$800
2011
2012
2013
1H14
Annual Trend in Average Well Costs per Frac Stage |
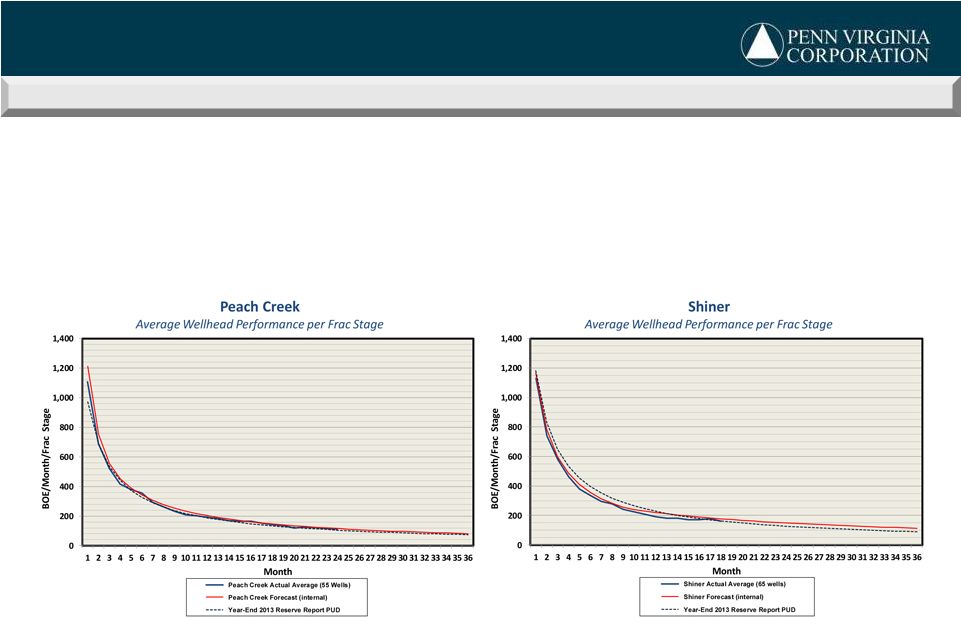 •
Normalizing production for number of frac stages, the last 55 wells in Peach Creek have
a tight fit with both the YE13 external and internal type curve per frac stage over the
past 24 months
•
Normalizing production for number of frac stages, the last 65 wells in Shiner have a
tight fit with the internal type curve per frac stage over the past 18 months
Gross Production Actuals vs. Type-Curves
Average Production per Frac Stage of Recent Wells vs. YE13 External and Internal Type
Curves 15 |
 (1) Based on
YE13 type curve per outside reservoir engineering firm. Terminal declines of 12% in both Peach Creek and Shiner begin at 7.8 years and are higher than internal terminal decline estimates.
(2) Gross EUR assumes 13.1 MBOE of EUR per frac stage in Peach Creek (11.3 thousand barrels of
oil (MBO), 1.0 MBO of NGLs and 133 Mcf of gas) and 17.9 BOE per frac stage in Shiner (11.5 MBO, 3.4 MBO of NGLs and 489 Mcf of gas).
(3) Internal
reserves
are
based
on
recent
results
in
those
areas
in
which
the
majority
of
our
future
drilling
program
will
occur.
(4) Assumes a flat $80 or $100 per barrel WTI oil price.
(5) Capital cost plus before tax PV-10 divided by capital cost.
Eagle Ford Well Economics
Pretax IRR Sensitivities –
Excellent Returns in Primary Development Areas
Peach Creek Field
•
Assumes 28 frac stages
•
367 MBOE EUR type curve
(1)
; 86% oil, 8% NGLs
(2)
•
Drilling and completion costs of $8.4 MM ($301K/stage)
•
Internal estimates, which include a 5% terminal decline
assumption, yield a 520 MBOE type curve
(3)
Shiner Field
•
Assumes 27 frac stages
•
484 MBOE EUR type curve
(1)
; 65% oil, 19% NGLs
(2)
•
Drilling and completion costs of $9.2 MM ($342K/stage)
•
Internal estimates, which include a 5% terminal decline
assumption, yield a 680 MBOE type curve
(3)
Key Takeaways
$80 WTI Price
$100 WTI Price
IRR
(4)
40%
72%
BTAX PV-10
(4)
($MM)
$4.7
$8.0
PV/I
(5)
1.51
1.87
Key Takeaways
$80 WTI Price
$100 WTI Price
IRR
(4)
45%
83%
BTAX PV-10
(4)
($MM)
$4.7
$7.9
PV/I
(5)
1.55
1.94
16 |
 17
Maintain at Least
$150 MM of
Financial Liquidity
•
Pro forma 2Q 2014 liquidity of $625 MM
•
Reflects net proceeds from recent asset sales and arbitration settlement, net of
pending Eagle Ford acquisition
Target Debt-to-
Adjusted EBITDAX
< 2.5x
•
Pro forma 2Q 2014 net leverage ratio of 2.5x
•
Potential to achieve target in the next 18 months
•
Any additional non-core asset sales would accelerate this goal
Protect Cash Flows
with Hedges
•
~82% of 2H14 and ~57% of 2015 oil production hedged; commenced 2016 hedging
•
Target 70% of production while leverage is higher than 3.0x
•
Protect minimum $85 WTI oil price along with some upside
Continue to Invest in
High Return
Development
Projects
•
90%+ of capital investment is in Eagle Ford development
•
Wellhead
rates
of
return
of
50%
–
60%
at
$90
WTI
price
(70%
–
80%
at
$100
WTI)
•
Operational flexibility to continue to high-grade drilling program
Financial Strategy
Focus on a Strong Balance Sheet and Value Creation |
 Capitalization
and Credit Stats 18
Improving Credit Statistics and Liquidity
(1) Market value for 6% Series A and Series B Convertible Preferred Stock depositary
shares calculated based on closing prices of each issue at 6/30/14 and 8/20/14. (2)
Market value for common share based on closing price at 6/30/14 and 8/20/14.
Capitalization ($ millions)
6/30/14
Market
Adjustments
Asset Sales/
Acquisition
Adjustments
Pro Forma
6/30/14
Cash
$25
$162
$187
Debt
Credit Facility
$55
($55)
-
Senior Notes
1,075
1,075
Total Debt
$1,130
$0
($55)
$1,075
6% Convertible Series A Preferred (PVAYL: $88.8MM face value)
(1)
300
(89)
211
6% Convertible Series B Preferred (PVGPP: $325MM face value)
(1)
358
(33)
325
Market Cap
(2)
1,185
(219)
966
Enterprise Value
$2,973
($340)
($55)
$2,578
Proved Reserves (MMBOE)
136
(14)
122
Year-End 2013 PV-10
$1,717
($45)
$1,672
Credit Statistics
6/30/14
PF 6/30/14
Net Debt /
Proved Reserves ($/BOE)
$8.11
$7.27
LTM Adjusted EBITDAX
3.1x
2.5x
PV-10 / Net Debt
1.6x
1.9x
Net Debt / EV
37%
34%
Liquidity
$445
$625 |
 Company
Highlights 19
Premier Eagle Ford
Position
•
~101,800
net
acres
in
the
Eagle
Ford
with
~12
years
of
drilling
inventory
(1)
•
Continued acreage growth through organic leasing and bolt-on acquisitions
Operational
Excellence
•
Beginning to delineate Upper Eagle Ford, generating over 600 gross locations
•
Significant Upper Eagle Ford reserve and production upside
•
Pad drilling and “zipper fracs”
enhancing drilling returns
•
Focused
development
program
has
generated
substantial
production
growth
in
the
Eagle
Ford,
increasing
from
2.3
MBOEPD
in
2011
to
16.9
MBOEPD
in
2Q
2014
•
Initial production rates remain strong with attractive drilling economics
Sufficient Liquidity
to Execute Future
Drilling Schedule
•
Recent offering, cash flow from operations and availability under our revolver
provide liquidity to fund our anticipated development program
•
Asset sales increased liquidity and decreased leverage
(1) Acreage and location data includes impact of Eagle Ford acquisition announced on 7/10/14
and expected to close in August 2014. |
 20
Appendix |
 Note:
Some EFS operators off map.
(1)
Based on recent company presentations, as well as industry publications. Some industry
publication information may be out of date. Eastern
Volatile
Oil
and
Condensate
Rich
Gas
Windows
(1)
21
Overview of the Eagle Ford
PVA
BHP
CHK
COG
COP
CRK
CRZO
DVN
EOG
FST/Sabine
MRO
MUR
NFX
Earthstone
PXD
PXP
Sabine/FST
SFY
SN
STO
TLM
EFS Operators |
   Casing
Oil
Oil
Gas
Equiv
%
Pressure
Gravity
Location
(BOPD)
(MCFD)
(BOEPD)
Rank
Oil
GOR
(psi)
API-60°
Shiner - "Beer Quad" (Mod. GOR)
1,581
1,904
1,899
72.4
1 83%
1,285
2,952
47.1
Shiner - Upper Eagle Ford (Marl)
917
5,077
1,763
66.8
2 52%
5,444
3,788
53.5
Shiner - Moderate GOR
1,118
1,372
1,346
62.6
3 83%
1,225
2,931
47.9
Rock Creek Ranch / Bozka
1,339
1,131
1,527
60.6
4 88%
841
2,341
45.1
Peach Creek
1,295
790
1,426
57.9
5 91%
592
1,981
44.2
Shiner - High GOR
833
2,136
1,189
55.5
6 70%
2,645
3,396
49.5
Totals and Averages
1,244
1,474
1,490
61.7
84%
1,321
2,652
46.6
Oil
Gas
Equiv
30-Day/IP
%
Location
(BOPD)
(MCFD)
(BOEPD)
Rank
BOEPDPS
Oil
GOR
Shiner - "Beer Quad" (Mod. GOR)
1,097
1,458
1,340
50.8
2 68%
82%
1,329
Shiner - Upper Eagle Ford (Marl)
830
4,038
1,502
56.9
1 86%
55%
4,809
Shiner - Moderate GOR
628
809
763
35.5
5 59%
82%
1,296
Rock Creek Ranch / Bozka
848
645
955
39.0
3 73%
89%
787
Peach Creek
868
540
958
38.3
4 63%
91%
598
Shiner - High GOR
500
1,261
706
33.1
6 60%
70%
2,571
Totals and Averages
779
984
943
39.2
64%
83%
1,378
Initial Potential
30-Day Average
BOEPD/
Stage
(BOEPDPS)
BOEPD/
Stage
(BOEPDPS)
BOEPDPS
BOEPDPS
Detailed Analysis of EFS Wells by Location
22
Wells TIL Since 4/1/13 -
Excludes Non-Operated and “Shallow”
Wells
Notes
-
“Beer Quad”
wells are moderate GOR wells, with beer types in their names, located primarily in Lavaca
County to the northwest of the town of Shiner. -
“Shiner -
Moderate GOR”
wells are located to the east and northeast of the “Beer Quad.”
-
Excluded
shallow
wells
are
wells
with
less
than
10,500’
of
vertical
depth
(defined
as
measured
depth
less
lateral
length).
-
Sorted by ranking of IP BOEPD / frac stage.
-
In the “Shiner -
Upper Eagle Ford (Marl)”
location, the 30-day information pertains to one well. The other two wells have not yet
had 30 days of production information. |
 Detailed
Analysis of EFS Wells by Location 23
Notes
-
“Beer Quad”
wells are moderate GOR wells, with beer types in their names, located primarily in Lavaca
County to the northwest of the town of Shiner. -
“Shiner -
Moderate GOR”
wells are located to the east and northeast of the “Beer Quad.”
-
Excluded
shallow
wells
are
wells
with
less
than
10,500’
of
vertical
depth
(defined
as
measured
depth
less
lateral
length).
-
Sorted by ranking of IP BOEPD / frac stage.
-
In the “Shiner -
Upper Eagle Ford (Marl)”
location, the 30-day information pertains to one well. The other two wells have not yet
had 30 days of production information. Wells TIL Since 4/1/13 -
Excludes Non-Operated and “Shallow”
Wells
Gross
Net
WI
Location
Wells
Wells
(%)
Shiner -
"Beer Quad" (Mod. GOR)
17
8.0
47%
Shiner -
Upper Eagle Ford (Marl)
2
1.9
94%
Shiner -
Moderate GOR
12
9.2
77%
Rock Creek Ranch / Bozka
8
3.7
47%
Peach Creek
29
13.6
47%
Shiner -
High GOR
14
12.5
89%
Totals and Averages
82
48.8
60%
No. of
Lateral
Lat. Length
Vertical
Frac
Proppant
Length
per Stage
+ Curve
Location
Stages
(lbs)
(ft)
(ft/stage)
(lbs)
Rank
(lbs)
Rank
(ft)
Shiner -
"Beer Quad" (Mod. GOR)
26.4
9,350,587
5,970
226
354,222
2
1,582
2
12,483
Shiner -
Upper Eagle Ford (Marl)
26.5
9,970,830
5,917
223
376,349
1
1,686
1
13,125
Shiner -
Moderate GOR
21.7
6,579,536
5,124
236
302,518
4
1,295
5
12,342
Rock Creek Ranch / Bozka
26.8
9,041,509
6,152
237
333,514
3
1,441
3
11,047
Peach Creek
25.8
7,800,856
5,982
232
301,591
5
1,324
4
11,264
Shiner -
High GOR
21.6
6,144,944
4,928
229
282,999
6
1,253
6
12,841
Totals and Averages
24.7
7,834,661
5,689
231
314,401
1,381
11,968
Proppant
per Stage
Proppant
per Stage
Drilling and Completion Information
Proppant
per Foot
Proppant
per Foot |
 24
Internal Well Economics
(1) Based on latest internal type curve. Terminal decline of 5%n
both Peach Creek and Shiner, as opposed to 12% terminal decline
per outside reservoir engineering report.
(2) Gross EUR assumes 18.5 MBOE of EUR per frac stage in Peach Creek (15.9 MBO of oil, 1.4 MBO
of NGLs and 188 Mcf of gas) and 25.2 BOE per frac stage in Shiner (16.2 MBO, 4.8 MBO of NGLs and 687 Mcf of gas).
(3) The majority of our future drilling program will occur in these areas. Type curve utilized
is supported with early time production information. (4) Assumes a flat $80 or $100 per
barrel WTI oil price. (5) Capital cost plus before tax PV-10 divided by capital
cost. Note: Internal type curves represent management's best estimates
of type curves and may differ from those of our third-party reserve engineers. Financial
reporting reserves are based on the type curves of our third-party reserve engineers. Both the
internal type curves and those of our third-party reserve engineers are estimates based on
limited data. There can be no assurance that actual production will conform with either set of type curves.
Pretax IRR Sensitivities –
Superior Returns in Peach Creek and Shiner
Peach Creek Field
•
Assumes 28 frac stages
•
520 MBOE EUR type curve
(1)
; 86% oil, 8% NGLs
(2)
•
Drilling and completion costs of $8.4 MM ($301K/stage)
•
Internal reserves based on recent well results using a higher
IP, lower initial decline rate and 5% terminal decline rate
(3)
Shiner Field
•
Assumes 27 frac stages
•
680 MBOE EUR type curve
(1)
; 65% oil, 19% NGLs
(2)
•
Drilling and completion costs of $9.2 MM ($342K/stage)
•
Internal reserves based on recent well results using a higher
IP, lower initial decline rate and 5% terminal decline rate
(3)
Key Takeaways
$80 WTI Price
$100 WTI Price
IRR
(4)
61%
118%
BTAX PV-10
(4)
($MM)
$7.7
$11.7
PV/I
(5)
1.83
2.27
Key Takeaways
$80 WTI Price
$100 WTI Price
IRR
(4)
69%
136%
BTAX PV-10
(4)
($MM)
$7.5
$11.4
PV/I
(5)
1.88
2.35 |
 Crude Oil
Hedges (Swaps and Collars) (1)
Natural Gas Hedges (Swaps and Collars)
(1)
•
Maintain an active hedging program to help support capital spending program and
ensure strong coverage metrics
•
Hedges in place to protect cash flow
•
Latest oil hedges:
–
12,500 BOPD (82% of est. vol.) is hedged for 2H14 at an average floor price of $92.80
–
11,500
BOPD
(~57%
of
est.
vol.)
is
hedged
for
2015
at
an
average
floor
price
of
$90.17
–
3,000 BOPD is hedged for 2016 at an average floor price of $90.84
•
Latest natural gas hedges:
–
10,000 MMBtu/d (~30% of est. vol.) is hedged for 2H14 at an average floor price of
$4.20 –
5,000 MMBtu/d is hedged for 1Q15 at an average floor price of $4.50
25
(1)
As of 8/21/14.
Protect Cash Flow
Hedging Strategy |
 1Q14
2Q14
1H14
Low
High
Low
High
Production:
Crude oil (MBbls)
1,076
1,119
2,195
2,685
-
2,915
4,880
-
5,110
NGLs (MBbls)
227
261
488
625
-
685
1,113
-
1,173
Natural gas (MMcf)
3,593
3,618
7,211
5,946
-
6,552
13,157
-
13,763
Equivalent production (MBOE)
1,902
1,983
3,885
4,301
-
4,692
8,186
-
8,577
Equivalent daily production (BOEPD)
21,133
21,786
21,461
23,375
-
25,500
22,426
-
23,497
Percent crude oil and NGLs
68.5%
69.6%
69.1%
73.6%
-
80.1%
71.5%
-
75.0%
Production revenues (a):
Crude oil
$105.6
$112.1
$217.7
$235.3
-
$262.3
$453.0
-
$480.0
NGLs
9.4
8.0
17.4
20.6
-
25.6
38.0
-
43.0
Natural gas
18.2
16.3
34.5
25.5
-
31.5
60.0
-
66.0
Total product revenues
$133.2
$136.4
$269.6
$281.4
-
$319.4
$551.0
-
$589.0
Total product revenues ($ per BOE)
$70.01
$68.81
$69.40
$65.43
-
$68.08
$67.31
-
$68.68
Percent crude oil and NGLs
86.3%
88.1%
87.2%
85.2%
-
95.8%
86.1%
-
91.8%
Adjusted EBITDAX (b)
$93.8
$95.0
$188.8
$210.0
-
$245.0
$398.8
-
$433.8
Capital expenditures:
Drilling and completion
$135.5
$154.0
$289.5
$320.4
-
$339.4
$609.9
-
$628.9
Lease acquisitions
36.9
12.8
49.7
47.3
-
65.3
97.0
-
115.0
Seismic (c)
4.5
0.1
4.6
3.4
-
4.4
8.0
-
9.0
Pipeline, gathering, facilities and other
5.6
2.6
8.2
8.8
-
10.8
17.0
-
19.0
Total oil and gas capital expenditures
$182.4
$169.5
$351.9
$380.0
-
$420.0
$731.9
-
$771.9
End of period debt outstanding
$1,265.0
$1,130.0
$1,130.0
$1,075.0
-
$1,075.0
$1,075.0
-
$1,075.0
2014 Guidance
2H14
26
Full-Year and Second-Half 2014 Guidance
(a)
Assumes average benchmark prices of $90.00 per barrel for crude oil and $4.50 per MMBtu for
natural gas in the second half of 2014, prior to any premium or discount for quality, basin
differentials,
the
impact
of
hedges
and
other
adjustments.
NGL
realized
pricing
is
assumed
to
be
$35.00
per
barrel
in
the
second
half
of
2014.
(b)
Adjusted
EBITDAX
is
not
a
measure
of
financial
performance
under
GAAP
and
should
not
be
considered
as
a
measure
of
liquidity
or
as
an
alternative
to
net
income.
(c)
Seismic expenditures are also reported as a component of exploration expense and as a
component of net cash provided by operating activities. |
 Current
Derivative Positions as of 8/21/14 Notes:
(a)
All or a portion of these derivatives have include "lower" puts sold at a strike price
of $70 per barrel. If the price of WTI oil goes below $70 per barrel, the cash receipts on the derivatives will be limited to
the difference between the swap / floor price and $70 per barrel.
(b)
This swaption contract gives our counterparties the option to enter into a fixed price swap
with us at a future date. If the forward commodity price for calendar year 2015 is higher than or equal to
$88.00
per
barrel
on
December
31,
2014,
the
counterparty
will
exercise
its
option
to
enter
intoa
fixed
price
swap
at
$88.00
per
barrel
for
calendar
year
2015,
at
which
point
the
contract
functions
as a
fixed price swap. If the forward commodity price for calendar year 2015 is lower than
$88.00 per barrel on December 31, 2014, the option expires and no fixed price swap is in effect.
We estimate that, excluding the derivative positions described above, for every $10.00 per
barrel increase or decrease in the crude oil price, operating income for the second half of 2014 would increase
or decrease by approximately $39.1 million. In addition, we estimate that, excluding the
derivative positions described above, for every $1.00 per MMBtu increase or decrease in the natural gas price,
operating
income
for
thesecond
half
of
2014
wouldincrease
or
decrease
by
approximately
$7.9
million.
This
assumes
that
crude
oil
prices,
natural
gas
pricesand
inlet
volumes
remain
constantat
anticipated
levels.
These
estimated
changes
in
operating
income
exclude
potential
cash
receipts
or
payments
in
settling
these
derivative
positions.
27
Derivatives
Weighted Average Price
Instrument Type
Average Volume Per Day
Floor/ Swap
Ceiling
Natural gas:
(MMBtu)
($ / MMBtu)
($ / MMBtu)
Third quarter 2014
Swaps
15,000
4.10
Fourth quarter 2014
Swaps
5,000
4.50
First quarter 2015
Swaps
5,000
4.50
Crude oil:
(barrels)
($ /
barrel) ($ / barrel)
Third quarter 2014
Collars
2,000
90.00
94.33
Fourth quarter 2014
Collars
2,000
90.00
94.33
First quarter 2015
Collars (a)
4,000
87.50
94.66
Second quarter
2015 Collars (a)
4,000
87.50
94.66
Third quarter 2015
Collars (a)
3,000
86.67
94.73
Fourth quarter
2015 Collars (a)
3,000
86.67
94.73
Third quarter 2014
Swaps (a)
10,000
93.21
Fourth quarter
2014 Swaps (a)
11,000
93.45
First quarter 2015
Swaps (a)
9,000
91.81
Second quarter
2015 Swaps (a)
9,000
91.81
Third quarter 2015
Swaps (a)
7,000
91.09
Fourth quarter
2015 Swaps (a)
7,000
91.09
First quarter 2016
Swaps
3,000
90.84
Second quarter 2016
Swaps
3,000
90.84
Third quarter 2016
Swaps
3,000
90.84
Fourth quarter 2016
Swaps
3,000
90.84
First quarter 2015
Swaption (b)
1,000
88.00
Second quarter
2015 Swaption (b)
1,000
88.00
Third quarter 2015
Swaption (b)
1,000
88.00
Fourth quarter
2015 Swaption (b)
1,000
88.00 |
 2009
2010
2011
2012
2013
Adjusted EBITDAX
Net income (loss) from continuing operations
$ (130.9)
$ (65.3)
$ (132.9)
$ (104.6)
$ (143.1)
$ (182.8)
Add: Income tax expense (benefit)
(85.9)
(42.9)
(88.2)
(68.7)
(77.7)
(97.7)
Add: Interest expense
44.2
53.7
56.2
59.3
78.8
88.3
Add: Depreciation, depletion and amortization
154.4
134.7
162.5
206.3
245.6
273.3
Add: Exploration
57.8
49.6
78.9
34.1
21.0
18.9
Add: Share-based compensation expense
9.1
7.8
7.4
6.3
5.8
3.7
Add/Less: Derivatives (income) expense included in net income
(31.6)
(41.9)
(15.7)
(36.2)
20.9
80.0
Add/Less: Cash receipts (payments) to settle derivatives
58.1
32.8
27.4
29.7
(1.0)
(17.1)
Add/Less: Loss on firm transportation commitment
-
-
- 17.3
-
-
Add: Impairments
106.4
46.0
104.7
104.5
132.2
250.1
Add/Less: Net loss (gain) on sale of assets, other
(2.0)
(1.2)
22.0
(0.6)
33.7
(55.2)
Adjusted EBITDAX
$ 179.7
$ 173.3
$ 222.5
$ 247.6
$ 316.2
$ 361.5
Pro Forma Adjusted EBITDAX
$ 342.4
$ 361.5
dollars in millions
Year ended December 31,
LTM
2Q14
Non-GAAP Reconciliation
28
Adjusted EBITDAX Reconciliation |