Attached files
| file | filename |
|---|---|
| 8-K - 8-K - PACWEST BANCORP | a14-19151_18k.htm |
Exhibit 99.1
|
|
INVESTOR MEETINGS WITH WUNDERLICH SECURITIES BALTIMORE AND PHILADELPHIA August 19 and 20, 2014 |

|
|
This communication contains certain “forward-looking statements” about the Company and its subsidiaries within the meaning of the Private Securities Litigation Reform Act of 1995, including certain plans, strategies, goals, and projections and including statements about our expectations regarding our profitability and credit trends. All statements contained in this communication that are not clearly historical in nature are forward-looking, and the words “anticipate,” “assume,” “intend,” “believe,” “forecast,” “expect,” “estimate,” “plan,” “continue,” “will,” “should,” “look forward” and similar expressions are generally intended to identify forward-looking statements. All forward-looking statements (including statements regarding future financial and operating results and future transactions and their results) involve risks, uncertainties and contingencies, many of which are beyond our control, which may cause actual results, performance, or achievements to differ materially from anticipated results, performance or achievements. Actual results could differ materially from those contained or implied by such forward-looking statements for a variety of factors, including without limitation: changes in economic or competitive market conditions could negatively impact investment or lending opportunities or product pricing and services; deteriorations in credit and other markets; higher than anticipated loan losses; credit quality deterioration or pronounced and sustained reduction in market values or other economic factors which adversely effect our borrowers’ ability to repay loans and leases; continued or worsening credit losses or charge-offs; higher than anticipated delinquencies and reserves; asset/liability repricing risks and liquidity risks reduces interest margins and the value of investments; higher than anticipated increases in operating expenses; increased costs to manage and sell foreclosed assets; reduced demand for our services due to strategic or regulatory reasons; legislative or regulatory requirements or changes adversely affected the Company’s business, including an increase to capital requirements; the Company’s ability to obtain regulatory approvals, complete future acquisitions, and successfully integrate acquired entities or achieve expected benefits, synergies, and/or operating efficiencies within expected time frames or at all; difficulties and delays in integrating the Company and CapitalSource businesses or fully realizing cost savings and other benefits; business disruption following the CapitalSource merger; and other risk factors described in documents filed by PacWest with the U.S. Securities and Exchange Commission (“SEC”). All forward-looking statements included in this communication are based on information available at the time of the communication. We are under no obligation to (and expressly disclaim any such obligation to) update or alter our forward-looking statements, whether as a result of new information, future events or otherwise except as required by law. Forward-Looking Statements |

|
|
Presentation Index Company Overview 5 Second Quarter Highlights 9 Loans and Leases 14 Credit Quality 19 Deposits 26 Net Interest Margin 29 Controlled Expenses34 Acquisitions and the CapitalSource Merger. 37 Strong Franchise Value. 41 Non-GAAP Measurements 43 |
|
|
Company Overview |
|
|
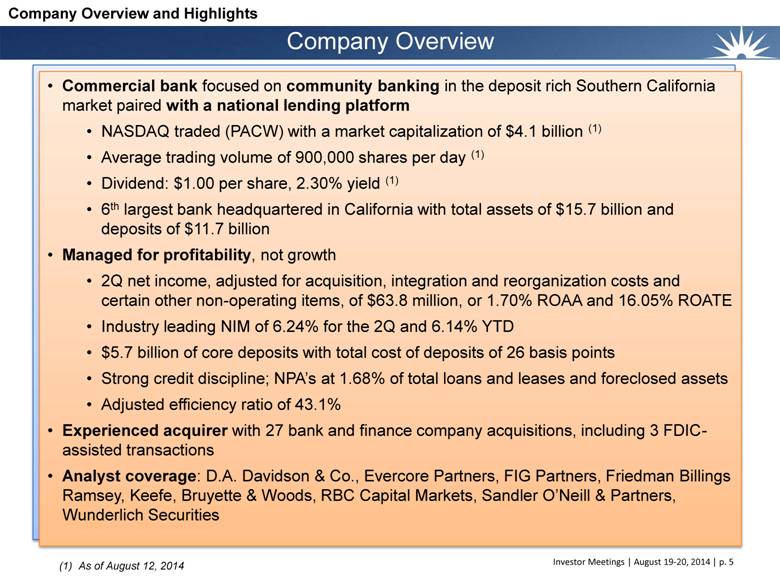
Company Overview As of August 12, 2014 Commercial bank focused on community banking in the deposit rich Southern California market paired with a national lending platform NASDAQ traded (PACW) with a market capitalization of $4.1 billion (1) Average trading volume of 900,000 shares per day (1) Dividend: $1.00 per share, 2.30% yield (1) 6th largest bank headquartered in California with total assets of $15.7 billion and deposits of $11.7 billion Managed for profitability, not growth 2Q net income, adjusted for acquisition, integration and reorganization costs and certain other non-operating items, of $63.8 million, or 1.70% ROAA and 16.05% ROATE Industry leading NIM of 6.24% for the 2Q and 6.14% YTD $5.7 billion of core deposits with total cost of deposits of 26 basis points Strong credit discipline; NPA’s at 1.68% of total loans and leases and foreclosed assets Adjusted efficiency ratio of 43.1% Experienced acquirer with 27 bank and finance company acquisitions, including 3 FDIC-assisted transactions Analyst coverage: D.A. Davidson & Co., Evercore Partners, FIG Partners, Friedman Billings Ramsey, Keefe, Bruyette & Woods, RBC Capital Markets, Sandler O’Neill & Partners, Wunderlich Securities Company Overview and Highlights |
|
|
Attractive branch network with 81 full service branches 78 in Southern California 3 in San Francisco Bay area Offers a full suite of deposit and business lending products Limited consumer lending offerings Strong focus on cross selling Borrower relationships generally include a deposit account Total cost of deposits at 26 bps Efficient deposit model with average branch size of $142 million Loan production of $137 million in 2Q14 Diversified by loan type, geography and industry Asset Based Lending Equipment and Lender Finance Cash Flow Lending Technology, Healthcare and Security Commercial Real Estate General, Multifamily, Healthcare and SBA Focus on middle to small market businesses Expertise in niche segments limits new competitors Loan and lease production of $745 million in 2Q14 Business Model Community Banking National Lending Company Overview and Highlights |
|
|
Stock Performance vs. Indices Company Overview and Highlights Market data is as of August 12, 2014 |
|
|
Second Quarter Highlights |
|
|
Adjusted efficiency ratio of 43.1% Average branch size of $142 million Operating expense to average assets of 2.14% Strong Capital Levels Low Efficiency Ratio Loan and Lease Production and Solid Credit Quality Industry Leading Net Interest Margin Net interest margin of 6.24% Core net interest margin of 5.74% Total cost of deposits of 26 bps Bank Tier 1 RBC and Total RBC ratios of 12.58% and 13.32% Consolidated tangible common equity ratio of 12.14% Tangible book value per share of $16.43 Loan and lease production of $881 million Organic loan and lease growth of $143 million, or 5.2% NPA ratio, excluding PCI loans, of 1.39% versus 2.81% in prior quarter Non-PCI credit loss allowance of 0.67% and adjusted credit loss allowance of 2.45% (1) Non-PCI charge-off rate of 5 bps for trailing twelve months Second Quarter Highlights Robust Core Earnings Adjusted net income of $63.8 million Adjusted EPS of $0.64 Adjusted ROAA and ROATE of 1.70% and 16.05% Adds back the unamortized discount on Non-PCI loans to the loan balance and allowance for credit losses (see page 23 for calculation). Highlights Total cost of deposits at 26 bps $200 million organic core deposit growth Core deposit growth includes: $95 million with $175 million in the pipeline from CapitalSource Division borrowers Low Cost Deposit Base |
|
|
Financial Highlights Acquisition, integration and reorganization costs and certain other non-operating items have been excluded from net earnings, noninterest income, and noninterest expense to calculate these amounts and ratios. See “Non-GAAP Measurements” slides. Excludes accelerated accretion of acquisition discounts resulting from early acquired loan payoffs. Highlights |
|
|
Solid Earnings Track Record * See “Non-GAAP Measurements” slide. Highlights |
|
|
Solid Capital Position – 2Q14 Source: SNL Financial Highlights |
|
|
Loans and Leases |
|
|
Diversified Loan and Lease Portfolio Loans and Leases As of June 30, 2014 |
|
|
Loan Production of $881 Million in 2Q14 $693 $880 $845 $880 $726 ($ in millions) $881 Loans and Leases |
|
|
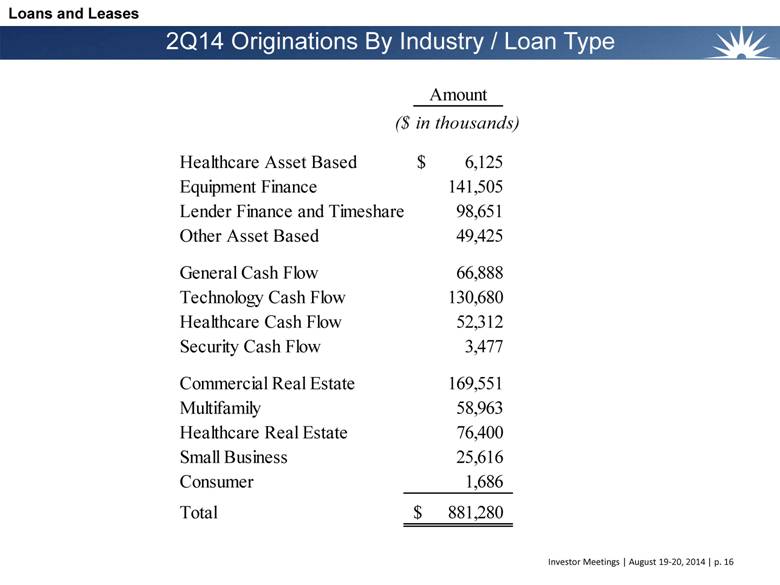
2Q14 Originations By Industry / Loan Type Loans and Leases |
|
|
2Q14 Loan Rollforward by Segment Loans and Leases |
|
|
Credit Quality |
|
|
Non-PCI Credit Quality Stable to Improving Classified loans and leases are those with a credit risk rating of substandard or doubtful Allowance for credit losses includes allowance for loan and lease losses and reserves for unfunded commitments Includes the remaining unamortized discount related to acquired loans (see page 23 for calculation) Credit Quality |
|
|
Key Credit Trends Credit Quality |
|
|
Non-Accrual Loan and Lease Detail Credit Quality |
|
|
10 Largest Non-PCI Nonaccrual Loans Credit Quality New nonaccrual in second quarter of 2014 Nonaccrual asset-based loan or equipment lease in the CapitalSource Division |
|
|
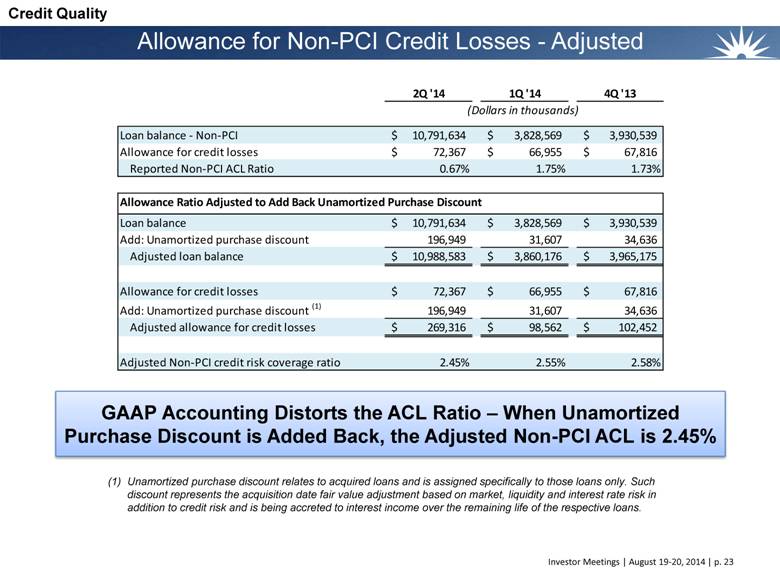
Allowance for Non-PCI Credit Losses - Adjusted GAAP Accounting Distorts the ACL Ratio – When Unamortized Purchase Discount is Added Back, the Adjusted Non-PCI ACL is 2.45% Credit Quality Unamortized purchase discount relates to acquired loans and is assigned specifically to those loans only. Such discount represents the acquisition date fair value adjustment based on market, liquidity and interest rate risk in addition to credit risk and is being accreted to interest income over the remaining life of the respective loans. |
|
|
Transformed in 2008 and 2009 During 2008 and 2009, in the midst of an economic downturn and while CapitalSource was transforming from a Finance Company to a Bank, the following changes in lending practices were implemented: Expanded lending efforts: Timeshare Healthcare real estate Technology cash flow Loans to home and commercial security monitoring companies Added new lending lines: Equipment finance Small business lending (SBA) Multifamily Reduced risk by: Discontinuing lending on real estate with insufficient in-place cash flow at closing, including repositioned assets. Limiting construction lending and eliminating land-secured loans Eliminating mezzanine or second lien lending on real estate Curtailing general cash flow lending and focusing on specific cash flow industry niches. Eliminating cash flow lending to media companies, and curtailing cash flow lending to retailers. Overview of Legacy CapitalSource Lending Practices Credit Quality |
|
|
Deposits |
|
|
Deposit Detail Deposits |
|
|
Deposit Portfolio ($ in Billions) $4.6 $4.6 $4.8 $4.7 $4.6 $5.5 $5.4 $5.3 $5.4 $11.7 Deposits June 30, 2014 Time Deposits Time Deposits Total Estimated Under $100,000 Time Contractual Effective Time Deposit Maturities $100,000 of More Deposits Rate Rate (Dollars in thousands) Due in three months or less 842,413 $ 1,467,897 $ 2,310,310 $ 0.84% 0.62% Due in over three months through six months 548,254 845,683 1,393,937 0.88% 0.70% Due in over six months through twelve months 630,769 983,575 1,614,344 0.91% 0.78% Due in over 12 months through 24 months 169,043 264,693 433,736 1.05% 0.73% Due in over 24 months 60,994 116,298 177,292 1.02% 0.72% Total 2,251,473 $ 3,678,146 $ 5,929,619 $ 0.89% 0.69% |
|
|
Net Interest Margin |
|
|
Industry Leading Net Interest Margin Core NIM Excludes Accelerated Discount Accretion due to Early Payoff of Acquired Loans Source: SNL Financial Net Interest Margin |
|
|
Disciplined and Diversified Lending Produces Higher Loan Yields Core Loan Yield Excludes Accelerated Discount Accretion from Early Payoff of Acquired Loans Source: SNL Financial Net Interest Margin |
|
|
Deposit Franchise with a 26 Basis Point Cost Purchase accounting discount accretion on deposits reduced the cost of deposits by 22 bps (1) Source: SNL Financial Net Interest Margin |
|
|
Effect of Purchase Accounting on NIM Net Interest Margin |
|
|
Controlled Expenses |
|
|
Efficiency Ratio Trend As part of the adjusted efficiency ratio calculation, adjusted net revenues exclude FDIC loss sharing expense, accelerated discount accretion resulting from the early payoff of acquired loans and gain on sale of assets, and adjusted noninterest expense excludes covered OREO expenses, acquisition, integration and reorganization costs, accelerated vesting of restricted stock, and debt termination expenses. Focus and Execution Drive Efficiency Source: SNL Financial Controlled Expenses |
|
|
Efficiency Ratios Average Branch Size ($-M) Focus and Execution Drive Efficiency * The 2008 efficiency ratio excludes the goodwill write-off. When the goodwill write-off is included in non-interest expense, the efficiency ratio is 371.7%. ** Adjusted efficiency ratio – see Non-GAAP Measurements slide Source: Company Filings and SNL Data Source Controlled Expenses |
|
|
Acquisitions |
|
|
Asset Generation Capability In-Market Consolidation Strong Core Deposit Base Similar Strategic Focus Key Drivers of Accretion: Cost Savings Customer Retention Margin Improvement Acquisition Strategy Market Expansion Acquisitions |
|
|
The CapitalSource Merger Acquisitions Created the 6th largest publicly-owned bank headquartered in CA Merger closed on April 7, 2014 – systems were converted and 13 overlapping branches closed on April 12, 2014 Continues PACW’s growth as a highly profitable business-focused bank with excellent credit quality Improved loan diversification with broadened middle-market reach with top funding and lending teams drawn from each firm to produce a national lending platform The resulting banking franchise has the capital resources, scale, management team and financial strength necessary to thrive in the current competitive environment |
|
|
Acquisitions CapitalSource Merger Closing Date Balance Sheet and Purchase Accounting Adjustments At April 7, 2014 Purchase PACW/CSE Accounting Pro Forma Combined Adjustments PACW (In thousands) Assets: Cash and cash equivalents $850,143 $(527,118) $323,025 Investment securities 1,128,135 3,463 1,131,598 Loans and leases, net of unearned income 11,090,866 (48,146) 11,042,720 OREO 56,640 442 57,082 Goodwill and intangible assets 394,829 1,342,999 1,737,828 Deferred tax asset, net 246,797 54,128 300,925 Other assets 1,090,508 (6,753) 1,083,755 Total assets $14,857,918 $819,015 $15,676,933 Liabilities and Shareholders' Equity: Deposits 11,508,138 17183 11525321 Borrowings 6,490 - 6,490 Tangible Equity 1,637,751 Subordinated debentures 544,894 (111,235) 433,659 Tangible Capital Ratio 11.75% Discontinued operations 148,697 - 148,697 Tangible Book Other liabilities 197,943 (10,756) 187,187 Value Per Share $16.07 Total liabilities 12,406,162 (104,808) 12,301,354 Total shareholders' equity 2,451,756 923,823 3,375,579 $14,857,918 $819,015 $15,676,933 Purchase Accounting Estimated Accretion/ Description Adjustment Amortization Period (Dr. (Cr.)) Loans and non-operating leases $(215,019) 60 months using a level yield method Operating leases (in other assets) $(10,352) 48 months using a level yield method Investment in trust preferred securities $(3,352) Straight line over 280 months Core deposit intangible $6,720 Straight line over 84 months Time deposit premium $(17,183) 60 months using an accelerated method Subordinated debentures $111,235 Straight line over 280 months Investor Meetings | August 19-20, 2014 39 |
|
|
Strong Franchise Value |
|
|
Attractive Southern California Footprint Strong Franchise Value |
|
|
Strong Franchise Value California Public Banks and Thrifts As of June 30, 2014 Rank Company Name Ticker Assets ($000) 1 Wells Fargo & Company WFC $1,598,874,000 2 First Republic Bank FRC 46,229,343 3 City National Corporation CYN 30,819,092 4 SVB Financial Group SIVB 33,309,016 5 East West Bancorp, Inc. EWBC 27,557,105 6 PacWest Bancorp PACW $15,684,866 7 Cathay General Bancorp CATY 11,556,822 8 CVB Financial Corp. CVBF 7,423,993 9 BBCN Bancorp, Inc. BBCN 6,866,291 10 Farmers & Merchants Bank of Long Beach FMBL 5,414,864 11 Westamerica Bancorporation WABC 4,931,095 12 Opus Bank OPB 4,346,091 13 Banc of California, Inc. BANC 4,386,522 14 BofI Holding, Inc. BOFI 4,402,999 15 Wilshire Bancorp, Inc. WIBC 3,681,261 16 Community Bank CYHT 3,505,007 17 Mechanics Bank MCHB 3,359,907 18 Hanmi Financial Corporation HAFC 3,094,775 19 TriCo Bancshares TCBK 2,724,481 20 1867 Western Financial Corporation WFCL 2,235,272 21 Farmers & Merchants Bancorp FMCB 2,127,301 22 Preferred Bank PFBC 1,904,018 23 Bank of Marin Bancorp BMRC 1,823,901 24 Exchange Bank EXSR 1,763,153 25 Pacific Premier Bancorp, Inc. PPBI 1,921,525 26 Heritage Oaks Bancorp HEOP 1,677,672 27 Bridge Capital Holdings BBNK 1,627,173 28 Heritage Commerce Corp HTBK 1,480,619 29 Sierra Bancorp BSRR 1,498,039 Source: SNL Financial 30 American Business Bank AMBZ 1,455,080 Investor Meetings | August 19-20, 2014 42 |
|
|
Non-GAAP Measurements The Company uses certain non-GAAP financial measures to provide meaningful supplemental information regarding the Company’s operational performance and to enhance investors’ overall understanding of such financial performance. These non-GAAP financial measures are presented for supplemental informational purposes only for understanding the Company’s operating results and should not be considered a substitute for financial information presented in accordance with GAAP. These non-GAAP financial measures presented by the Company may be different from non-GAAP financial measures used by other companies. The tables on the following slides present reconciliations of non-GAAP financial measurements to the GAAP financial measurements and certain key performance ratios. |
|
|
Non-GAAP Measurements Adjusted Net Earnings and Profitability Metrics Three Months Ended June 30, March 31, June 30, 2014 2014 2013 (Dollars in thousands) Reported net earnings $10,555 $25,080 $4,349 Add (subtract): Tax benefit on discontinued operations (476) (588) (34) Tax expense on continuing operations 14,846 14,576 1,906 Reported pre-tax earnings 24,925 39,068 6,221 Add (subtract): Acquisition, integration and reorganization costs 86,242 2,200 17,997 FDIC loss sharing expense, net 8,525 11,430 5,410 Covered OREO income, net (185) (1,615) (94) (Gain) loss on sale of loans and leases 485 (106) (279) (Gain) loss on securities (89) (4,752) - (Gain) on sale of owned office building - (1,570) - Adjusted pre-tax earnings before accelerated discount accretion 119,903 44,655 29,255 Subtract: Accelerated discount accretion resulting from payoffs of acquired loans (15,290) (7,655) (177) Adjusted pre-tax earnings 104,613 37,000 29,078 Tax expense (39% for 2014, 35% for 2013) (40,799) (14,430) (10,177) Adjusted net earnings $63,814 $22,570 $18,901 Adjusted diluted earnings per share $0.64 $0.48 $0.48 Average assets $15,037,101 $6,513,376 $5,777,891 Average stockholders' equity $3,233,018 $820,248 $666,425 Less: Average intangible assets 1,638,267 225,294 129,863 Average tangible common equity $1,594,751 $594,954 $536,562 Annualized return on average assets (1) 0.28% 1.56% 0.30% Annualized adjusted return on average assets (2) 1.70% 1.41% 1.31% Annualized return on average equity (3) 1.31% 12.40% 2.62% Annualized adjusted return on average equity (4) 7.92% 11.16% 11.38% Annualized return on average tangible equity (5) 2.65% 17.10% 3.25% Annualized adjusted return on average tangible equity (6) 16.05% 15.39% 14.13% (1) Annualized net earning divided by average assets. (2) Annualized adjusted net earnings divided by average assets. (3) Annualized net earnings divided by average stockholders' equity. (4) Annualized adjusted net earnings divided by average stockholders' equity. (5) Annualized net earnings divided by average tangible common equity. (6) Annualized adjusted net earnings divided by average tangible common equity. Investor Meetings | August 19-20, 2014 44 |
|
|
Non-GAAP Measurements Adjusted Efficiency Ratio Three Months Ended Six Months Ended June 30, March 31, June 30, June 30, June 30, Adjusted Efficiency Ratio 2014 2014 2013 2014 2013 (Dollars in thousands) Noninterest expense $169,906 $50,869 $64,216 $220,775 $108,399 Less: Acquisition, integration and reorganization costs 86,242 2,200 17,997 88,442 18,689 Covered OREO income, net (185) (1,615) (94) (1,800) (907) Adjusted noninterest expense $83,849 $50,284 $46,313 $134,133 $90,617 Net interest income $192,533 $86,015 $68,473 $278,548 $134,166 Noninterest income 8,479 4,691 203 13,170 3,043 Net revenues 201,012 90,706 68,676 291,718 137,209 Less: FDIC loss sharing expense, net (8,525) (11,430) (5,410) (19,955) (8,547) Gain on securities 89 4,752 - 4,841 409 Gain on sale of owned office building - 1,570 - 1,570 - Gain (loss) on sale of loans and leases (485) 106 279 (379) 504 Accelerated discount accretion resulting from payoffs of acquired loans 15,290 7,655 177 22,945 854 Adjusted net revenues $194,643 $88,053 $73,630 $282,696 $143,989 Base efficiency ratio (1) 84.5% 56.1% 93.5% 75.7% 79.0% Adjusted efficiency ratio (2) 43.1% 57.1% 62.9% 47.4% 62.9% (1) Noninterest expense divided by net revenues (2) Adjusted noninterest expense divided by adjusted net revenues Investor Meetings | August 19-20, 2014 45 |
|
|
Non-GAAP Measurements Tangible Common Equity Three Months Ended June 30, March 31, June 30, Tangible Common Equity Ratio 2014 2014 2013 PacWest Bancorp Consolidated: Stockholder's equity $3,437,932 $833,702 $801,699 Less:Intangible assets 1,745,584 224,627 229,380 Tangible common equity $1,692,348 $609,075 $572,319 Total assets $15,684,866 $6,517,853 $6,709,102 Less:Intangible assets 1,745,584 224,627 229,380 Tangible assets $13,939,282 $6,293,226 $6,479,722 Equity to assets ratio 21.92% 12.79% 11.95% Tangible common equity ratio 12.14% 9.68% 8.83% Book value per share $33.37 $18.21 $17.40 Tangible book value per share $16.43 $13.31 $12.42 Shares outstanding 103,033,449 45,777,580 46,080,731 Pacific Western Bank: Stockholder's equity $3,298,908 $910,644 $890,477 Less:Intangible assets 1,745,584 224,627 229,380 Tangible common equity $1,553,324 $686,017 $661,097 Total assets $15,376,440 $6,507,288 $6,699,832 Less:Intangible assets 1,745,584 224,627 229,380 Tangible assets $13,630,856 $6,282,661 $6,470,452 Equity to assets ratio 21.45% 13.99% 13.29% Tangible common equity ratio 11.40% 10.92% 10.22% Investor Meetings | August 19-20, 2014 46 |