Attached files
| file | filename |
|---|---|
| EX-31.2 - EXHIBIT 31.2 - Sino Agro Food, Inc. | v385583_ex31-2.htm |
| EX-32.1 - EXHIBIT 32.1 - Sino Agro Food, Inc. | v385583_ex32-1.htm |
| EXCEL - IDEA: XBRL DOCUMENT - Sino Agro Food, Inc. | Financial_Report.xls |
| EX-31.1 - EXHIBIT 31.1 - Sino Agro Food, Inc. | v385583_ex31-1.htm |
UNITED STATES
SECURITIES AND EXCHANGE COMMISSION
WASHINGTON, DC 20549
FORM 10-Q
(Mark One)
| x | QUARTERLY REPORT PURSUANT TO SECTION 13 OR 15(d) OF THE SECURITIES EXCHANGE ACT OF 1934 |
For the quarterly period ended June 30, 2014
OR
| ¨ | TRANSACTION REPORT PURSUANT TO SECTION 13 OR 15(d) OF THE SECURITIES EXCHANGE ACT OF 1934 |
For the transition period from ___________________________ to ___________________________
Commission file number: 000-54191
| SINO AGRO FOOD, INC. |
(Exact Name of Registrant as Specified in Its Charter)
| Nevada | 33-1219070 | |
(State of Other Jurisdiction of Incorporation or Organization) |
(I.R.S. Employer Identification Number) | |
Room 3801, Block A, China Shine Plaza No. 9 Lin He Xi Road Tianhe District, Guangzhou City, P.R.C. |
510610 | |
| (Address of Principal Executive Offices) | (Zip Code) |
(860) 20 22057860
(Registrant’s Telephone Number, Including Area Code)
Copies to:
Sichenzia Ross Friedman Ference LLP
61 Broadway, 32nd Floor
New York, NY10006
Attn: Marc Ross, Esq.
Indicate by check mark whether the registrant (1) has filed all reports required to be filed by Section 13 or 15(d) of the Securities Exchange Act of 1934 during the preceding 12 months (or for such shorter period that the registrant was required to file such reports), and (2) has been subject to such filing requirements for the past 90 days. Yes x No ¨
Indicate by check mark whether the registrant has submitted electronically and posted on its corporate Web site, if any, every Interactive Data File required to be submitted and posted pursuant to Rule 405 of Regulation S-T (§232.405 of this chapter) during the preceding 12 months (or for such shorter period that the registrant was required to submit and post such files). Yes ¨ No x
Indicate by check mark whether the registrant is a large accelerated filer, an accelerated filer, a non-accelerated filer, or a smaller reporting company. See the definitions of “large accelerated filer,” “accelerated filer,” "non-accelerated filer" and “smaller reporting company” in Rule 12b-2 of the Exchange Act. (Check one):
| Large accelerated filer | ¨ | Accelerated filer | ¨ |
| Non-accelerated filer | ¨ | Smaller reporting company | x |
Indicate by check mark whether the registrant is a shell company (as defined in Rule 12b-2 of the Exchange Act). Yes ¨ No x
As of August 11, 2014, there were 164,228,043 shares of our common stock issued and outstanding.
TABLE OF CONTENTS
| Page | ||
| PART I – FINANCIAL INFORMATION | ||
| Item 1. | Financial Statements | F-1 |
| Item 2. | Management’s Discussion and Analysis of Financial Condition and Plan of Operations | 1 |
| Item 3. | Quantitative and Qualitative Disclosures About Market Risk | 48 |
| Item 4. | Controls and Procedures | 48 |
| PART II – OTHER INFORMATION | ||
| Item 1. | Legal Proceedings | 49 |
| Item 1A. | Risk Factors | 49 |
| Item 2. | Unregistered Sale of Equity Securities and Use of Proceeds | 49 |
| Item 3. | Defaults Upon Senior Securities | 49 |
| Item 4. | Mine Safety Disclosures | 49 |
| Item 5. | Other Information | 49 |
| Item 6. | Exhibits | 49 |
| SIGNATURES | 50 | |
PART I - FINANCIAL INFORMATION
SINO AGRO FOOD, INC. AND SUBSIDIARIES
QUARTERLY FINANCIAL STATEMENTS
FOR THE SIX MONTHS ENDED JUNE 30, 2014
(Unaudited)
SINO AGRO FOOD, INC. AND SUBSIDIARIES
INDEX TO QUARTERLY FINANCIAL STATEMENTS
FOR THE SIX MONTHS ENDED JUNE 30, 2014
(Unaudited)
CONSOLIDATED BALANCE SHEETS
| Note | June 30, 2014 | December 31, 2013 | ||||||||
| ASSETS | ||||||||||
| Current assets | ||||||||||
| Cash and cash equivalents | 5 | $ | 3,631,566 | $ | 1,327,274 | |||||
| Inventories | 6 | 25,937,818 | 8,148,203 | |||||||
| Cost and estimated earnings in excess of billings on uncompleted contracts | 18 | 757,303 | 663,296 | |||||||
| Deposits and prepaid expenses | 7 | 93,203,999 | 92,401,416 | |||||||
| Accounts receivable, net of allowance for doubtful accounts | 8 | 117,184,211 | 82,057,942 | |||||||
| Other receivables | 9 | 11,026,053 | 3,782,771 | |||||||
| Total current assets | 251,740,950 | 188,380,902 | ||||||||
| Property and equipment | ||||||||||
| Property and equipment, net of accumulated depreciation | 10 | 50,081,031 | 46,487,058 | |||||||
| Construction in progress | 11 | 72,395,107 | 59,134,732 | |||||||
| Land use rights, net of accumulated amortization | 12 | 59,871,240 | 60,705,829 | |||||||
| Total property and equipment | 182,347,378 | 166,327,619 | ||||||||
| Other assets | ||||||||||
| Goodwill | 13 | 724,940 | 724,940 | |||||||
| Proprietary technologies, net of accumulated amortization | 14 | 11,771,492 | 12,081,470 | |||||||
| Licenses | 16 | - | - | |||||||
| Total other assets | 12,496,432 | 12,806,410 | ||||||||
| Total assets | $ | 446,584,760 | $ | 367,514,931 | ||||||
| LIABILITIES AND STOCKHOLDERS' EQUITY | ||||||||||
| Current liabilities | ||||||||||
| Accounts payable and accrued expenses | $ | 19,783,024 | $ | 11,055,194 | ||||||
| Other payables | 17 | 11,660,708 | 10,768,786 | |||||||
| Billings in excess of costs and estimated earnings on uncompleted contracts | 18 | 3,521,421 | 3,146,956 | |||||||
| Due to a director | 3,762,108 | 1,793,768 | ||||||||
| Dividends payable | 19 | 3,146,987 | - | |||||||
| Short term bank loan | 20 | 4,063,059 | 4,100,377 | |||||||
| 45,937,307 | 30,865,081 | |||||||||
| Non-current liabilities | ||||||||||
| Deferred dividends payable | 19 | - | 3,146,987 | |||||||
| Long term debts | 20 | 2,616,610 | 180,417 | |||||||
| Bonds payable | 21 | 1,725,000 | 1,725,000 | |||||||
| 4,341,610 | 5,052,404 | |||||||||
| Commitments and contingencies | - | - | ||||||||
| Stockholders' equity | ||||||||||
| Preferred stock: $0.001 par value | ||||||||||
| (10,000,000 shares authorized, 7,000,100 shares issued and outstanding as of June 30, 2014 and December 31, 2013, respectively) | ||||||||||
| Series A preferred stock: $0.001 par value | 22 | - | - | |||||||
| (100 shares designated, 100 shares issued and outstanding as of June 30, 2014 and December 31, 2013, respectively) | ||||||||||
| Series B convertible preferred stock: $0.001 par value | 22 | 7,000 | 7,000 | |||||||
| (10,000,000 shares designated, 7,000,000 shares issued and outstanding as of June 30, 2014 and December 31, 2013, respectively) | ||||||||||
| Series F Non-convertible preferred stock: $0.001 par value | ||||||||||
| (1,000,000 shares designated, 0 shares issued and outstanding as of June 30, 2014 and December 31, 2013, respectively) | 22 | - | - | |||||||
| Common stock: $0.001 par value | 22 | 160,198 | 137,602 | |||||||
| (170,000,000 shares authorized, 160,198,044 and 137,602,043 shares issued and oustanding as of June 30, 2014 and December 31, 2013, respectively) | ||||||||||
| Additional paid - in capital | 118,369,556 | 108,038,413 | ||||||||
| Retained earnings | 221,945,794 | 178,070,837 | ||||||||
| Accumulated other comprehensive income | 5,600,438 | 6,260,131 | ||||||||
| Treasury stock | 22 | (1,250,000 | ) | (1,250,000 | ) | |||||
| Total Sino Agro Food, Inc. and subsidiaries stockholders' equity | 344,832,986 | 291,263,983 | ||||||||
| Non - controlling interest | 51,472,857 | 40,333,463 | ||||||||
| Total stockholders' equity | 396,305,843 | 331,597,446 | ||||||||
| Total liabilities and stockholders' equity | $ | 446,584,760 | $ | 367,514,931 | ||||||
The accompanying notes are an integral part of these consolidated financial statements.
| F - 1 |
CONSOLIDATED BALANCE SHEETS OF INCOME AND OTHER COMPREHENSIVE INCOME
| Three months ended | Three months ended | Six months ended | Six months ended | |||||||||||||||||
| Note | June 30, 2014 | June 30, 2013 | June 30, 2014 | June 30, 2013 | ||||||||||||||||
| Revenue | ||||||||||||||||||||
| - Sale of goods | $ | 82,357,060 | $ | 42,151,850 | $ | 160,629,369 | $ | 78,701,204 | ||||||||||||
| - Counsulting and service income from development contracts | 14,346,298 | 11,735,189 | 26,589,500 | 30,196,812 | ||||||||||||||||
| - Commission income | 329,146 | 513,290 | 741,424 | 610,064 | ||||||||||||||||
| 97,032,504 | 54,400,329 | 187,960,293 | 109,508,080 | |||||||||||||||||
| Cost of goods sold | (58,049,860 | ) | (26,338,635 | ) | (113,914,389 | ) | (52,103,281 | ) | ||||||||||||
| Cost of services | (6,685,461 | ) | (8,671,247 | ) | (13,188,873 | ) | (16,491,535 | ) | ||||||||||||
| Gross profit | 32,297,183 | 19,390,447 | 60,857,031 | 40,913,264 | ||||||||||||||||
| General and administrative expenses | (3,281,860 | ) | (1,608,304 | ) | (5,950,254 | ) | (3,813,692 | ) | ||||||||||||
| Net income from operations | 29,015,323 | 17,782,143 | 54,906,777 | 37,099,572 | ||||||||||||||||
| Other income (expenses) | ||||||||||||||||||||
| Government grant | 124,440 | - | 237,672 | 79,759 | ||||||||||||||||
| Other income | 1,265 | 47,718 | 4,523 | 65,907 | ||||||||||||||||
| Gain of extinguishment of debts | 26 | 198,373 | 498,025 | 241,393 | 1,051,013 | |||||||||||||||
| Interest expense | (110,386 | ) | (54,958 | ) | (219,493 | ) | (112,010 | ) | ||||||||||||
| Net income (expenses) | 213,692 | 490,785 | 264,095 | 1,084,669 | ||||||||||||||||
| Net income before income taxes | 29,229,015 | 18,272,928 | 55,170,872 | 38,184,241 | ||||||||||||||||
| Provision for income taxes | 5 | - | - | - | - | |||||||||||||||
| Net income | 29,229,015 | 18,272,928 | 55,170,872 | 38,184,241 | ||||||||||||||||
| Less: Net (income) loss attributable to non - controlling interest | (6,141,977 | ) | (3,941,988 | ) | (11,295,915 | ) | (7,474,529 | ) | ||||||||||||
| Net income attributable to Sino Agro Food, Inc. and subsidiaries | 23,087,038 | 14,330,940 | 43,874,957 | 30,709,712 | ||||||||||||||||
| Other comprehensive (loss) income Foreign currency translation (loss) income | (108,578 | ) | 1,728,409 | (816,214 | ) | 1,436,541 | ||||||||||||||
| Comprehensive income | 22,978,460 | 16,059,349 | 43,058,743 | 32,146,253 | ||||||||||||||||
| Less: other comprehensive loss (income) attributable to non - controlling interest | 43,000 | (217,553 | ) | 156,521 | (165,771 | ) | ||||||||||||||
| Comprehensive income attributable to Sino Agro Food, Inc. and subsidiaries | $ | 23,021,460 | $ | 15,841,796 | $ | 43,215,264 | $ | 31,980,482 | ||||||||||||
| Earnings per share attributable to Sino Agro Food, Inc. and subsidiaries common stockholders: | ||||||||||||||||||||
| Basic | $ | 0.15 | $ | 0.13 | $ | 0.29 | $ | 0.28 | ||||||||||||
| Diluted | $ | 0.14 | $ | 0.12 | $ | 0.28 | $ | 0.27 | ||||||||||||
| Weighted average number of shares outstanding: | ||||||||||||||||||||
| Basic | 155,390,109 | 115,366,595 | 149,059,330 | 110,403,819 | ||||||||||||||||
| Diluted | 162,390,109 | 122,366,595 | 156,059,330 | 117,403,819 | ||||||||||||||||
The accompanying notes are an integral part of these consolidated financial statements.
| F - 2 |
CONSOLIDATED STATEMENTS OF CASH FLOWS
| Six months ended | Six months ended | |||||||
| June 30, 2014 | June 30, 2013 | |||||||
| Cash flows from operating activities | ||||||||
| Net income for the period | $ | 55,170,872 | $ | 38,184,241 | ||||
| Adjustments to reconcile net income for the period to net cash from operations: | ||||||||
| Depreciation | 1,131,273 | 638,671 | ||||||
| Amortization | 1,056,859 | 976,294 | ||||||
| Common stock issued for services | 66,872 | 181,200 | ||||||
| Gain on extinguishment of debts | (241,393 | ) | (1,051,013 | ) | ||||
| Other amortized cost | 100,000 | - | ||||||
| Changes in operating assets and liabilities: | ||||||||
| Increase in inventories | (17,789,615 | ) | (1,842,406 | ) | ||||
| Increase/(decrease) in cost and estimated earnings in excess of billings on uncompleted contacts | (94,007 | ) | 1,050,105 | |||||
| Decrease (increase) in deposits and prepaid expenses | 563,949 | (4,783,140 | ) | |||||
| Decrease in due to a director | 1,968,340 | 8,264,907 | ||||||
| Increase in accounts payable and accrued expenses | 8,727,830 | 2,606,191 | ||||||
| Increase in other payables | 10,466,922 | 3,608,856 | ||||||
| Increase in accounts receivable | (35,126,269 | ) | (29,425,520 | ) | ||||
| Increase (decrease) in billings in excess of costs and estimated earnings on uncompleted contracts | 374,465 | (1,867,709 | ) | |||||
| Increase in other receivables | (7,243,282 | ) | (420,024 | ) | ||||
| Net cash provided by operating activities | 19,132,816 | 16,120,653 | ||||||
| Cash flows from investing activities | ||||||||
| Purchases of property and equipment | (3,372,840 | ) | - | |||||
| Payment for construction in progress | (15,655,682 | ) | (13,596,632 | ) | ||||
| Acquisition of land use rights | - | (490,323 | ) | |||||
| Net cash used in investing activities | (19,028,522 | ) | (14,086,955 | ) | ||||
| Cash flows from financing activities | ||||||||
| Proceeds from long term debts | 2,436,193 | - | ||||||
| Dividends paid | - | (951,308 | ) | |||||
| Net cash provided by (used in) financing activities | 2,436,193 | (951,308 | ) | |||||
| Effects on exchange rate changes on cash | (236,195 | ) | (115,206 | ) | ||||
| Increase in cash and cash equivalents | 2,304,292 | 967,184 | ||||||
| Cash and cash equivalents, beginning of period | 1,327,274 | 8,424,265 | ||||||
| Cash and cash equivalents, end of period | 3,631,566 | 9,391,449 | ||||||
| Supplementary disclosures of cash flow information: | ||||||||
| Cash paid for interest | 219,493 | $ | 112,010 | |||||
| Cash paid for income taxes | - | - | ||||||
| Non - cash transactions | ||||||||
| Common stock issued for settlement of debts | $ | 9,575,000 | $ | 9,404,638 | ||||
| Series B convertible preferred stock cancelled | - | $ | (3,000 | ) | ||||
| Transfer construction in progress to property and equipment | $ | 1,865,678 | - | |||||
| Transfer deposits and prepaid expenses to property and equipment | $ | 513,272 | $ | - | ||||
The accompanying notes are an integral part of these consolidated financial statements.
| F - 3 |
NOTES TO CONSOLIDATED FINANCIAL STATEMENTS
FOR THE SIX MONTHS ENDED JUNE 30, 2014 AND 2013
| 1. | CORPORATE INFORMATION |
Sino Agro Food, Inc. (the “Company” or “SIAF”) (formerly known as Volcanic Gold, Inc. and A Power Agro Agriculture Development, Inc.) was incorporated on October 1, 1974 in the State of Nevada.
The Company was engaged in the mining and exploration business but ceased its mining and exploring business on October 14, 2005. On August 24, 2007, the Company entered into a Merger and Acquisition Agreement with Capital Award Inc., a Belize corporation (“CA”) and its subsidiaries Capital Stage Inc. (“CS”) and Capital Hero Inc. (“CH”). Effective the same date, CA completed a reverse merger transaction with SIAF. SIAF acquired all the outstanding common stock of CA from Capital Adventure, a shareholder of CA, for 32,000,000 shares of the Company’s common stock.
On August 24, 2007 the Company changed its name from Volcanic Gold, Inc. to A Power Agro Agriculture Development, Inc. On December 8, 2007, the Company changed its name to Sino Agro Food, Inc.
On September 5, 2007, the Company acquired three existing businesses in the People’s Republic of China (the “P.R.C.”):
| (a) | Hang Yu Tai Investment Limited (“HYT”), a company incorporated in Macau, the owner of a 78% equity interest in ZhongXingNongMu Ltd (“ZX”), a company incorporated in the PRC; |
| (b) | Tri-way Industries Limited (“TRW”), a company incorporated in Hong Kong; |
| (c) | Macau Eiji Company Limited (“MEIJI”), a company incorporated in Macau, the owner of 75% equity interest in Enping City Juntang Town Hang Sing Tai Agriculture Co. Ltd. (“HST”), a P.R.C. corporate Sino-Foreign joint venture. |
On November 27, 2007, MEIJI and HST established a corporate Sino - Foreign joint venture, Jiang Men City Heng Sheng Tai Agriculture Development Co. Ltd. (“JHST”), a company incorporated in the P.R.C. with MEIJI owning a 75% interest and HST owning a 25% interest and MEIJI withdrew its 25% equity interest in HST.
On November 26, 2008, SIAF established Pretty Mountain Holdings Limited (“PMH”), a company incorporated in Hong Kong with an 80% equity interest. On May 25, 2009, PMH formed a corporate Sino-Foreign joint venture, Qinghai Sanjiang A Power Agriculture Co. Ltd. (“SJAP”), incorporated in the PRC, of which PMH owns a 45% equity interest. At the time, the remaining 55% equity interest in SJAP was owned by the following entities:
| • | Qinghai Province Sanjiang Group Company Limited (English translation) (“Qinghai Sanjiang”), a private limited company incorporated in P.R.C. with major business activities in the agriculture industry; and |
| • | Guangzhou City Garwor Company Limited (English translation) (“Garwor”), a private limited company incorporated in the P.R.C., specializing in sales and marketing. |
SJAP is engaged in the business of manufacturing bio-organic fertilizer, livestock feed and development of other agriculture projects in the County of Huangyuan, in the vicinity of the Xining City, Qinghai Province, P.R.C.
In September 2009, the Company carried out an internal reorganization of its corporate structure and business, and formed a 100% owned subsidiary, A Power Agro Agriculture Development (Macau) Limited (“APWAM”), which was formed in Macau. APWAM then acquired PMH’s 45% equity interest in SJAP. By virtue of the acquisition, APWAM assumed all obligations and liabilities of PMH under the Sino Foreign Joint Venture Agreement. On May 7, 2010, Qinghai Sanjiang sold and transferred its equity interest in SJAP to Garwor. The State Administration for Industry and Commerce of Xining City Government of the P.R.C. approved the sale and transfer. As a result, APWAM owned 45% of SJAP and Garwor owned the remaining 55%. This remains the case as of the date of this report (the “Report”).
On September 9, 2010, an application was submitted by the Company to the Companies Registry of Hong Kong for deregistration of PMH under Section 291AA of the Hong Kong Companies Ordinance. On January 28, 2011, PMH was dissolved.
On February 15, 2011 and March 29, 2011, the Company entered into an agreement and a memorandum of understanding (an “ MOU”), respectively, to sell 100% equity interest in HYT group (including HYT and ZX) to Mr. Xin Ming Sun, a director of ZhongXingNong Nu Co., Ltd for $45,000,000, with effective date of January 1, 2011.
| F - 4 |
SINO AGRO FOOD, INC.
NOTES TO CONSOLIDATED FINANCIAL STATEMENTS
FOR THE SIX MONTHS ENDED JUNE 30, 2014 AND 2013
| 1. | CORPORATE INFORMATION (CONTINUED) |
On February 28, 2011, the Company applied to form Enping City Bi Tao A Power Prawn Culture Development Co Limited (“ EBAPCD”) , and the Company would indirectly own a 25% equity interest in future Sino Joint Venture Company (pending approval).
On February 28, 2011, TRW applied to form a corporate joint venture, Enping City Bi Tao A Power Fishery Development Co., Limited (“EBAPFD”), incorporated in the PRC. TRW owned a 25% equity interest in EBAPFD. On November 17, 2011, TRW formed Jiang Men City A Power Fishery Development Co., Limited (“JFD”) in which it acquired a 25% equity interest, while withdrawing its 25% equity interest in EBAPFD. As of December 31, 2011, the Company had invested for total cash consideration of $1,258,607 in JFD. JFD operates an indoor fish farm. On January 1, 2012, the Company acquired an additional 25% equity interest in JFD for total cash consideration of $1,662,365. As of January 1, 2012, the Company had consolidated the assets and operations of JFD. On April 1, 2012, the Company acquired an additional 25% equity interest in JFD for the total cash consideration of $1,702,580. These acquisitions were at our option according the terms of the original development agreement. The Company presently owns a 75% equity interest in JFD, representing majority of voting rights and controls its board of directors.
On April 15, 2011, MEIJI applied to form Enping City A Power Cattle Farm Co., Limited (“ECF”), all of which the Company would indirectly own a 25% equity interest in on November 17, 2011. On January 1, 2012, the Company had invested $1,076,489 in ECF and the amount was settled in contra against accounts receivable due from ECF. On September 17, 2012 MEIJI formed Jiang Men City Hang Mei Cattle Farm Development Co., Limited (“JHMC”) and acquired additional 50% equity interest for the total cash consideration of $2,944,176 on September 30, 2012 while withdrawing its 25% equity interest in ECF. This acquisition was at our option according to the terms of the original development agreement. The Company presently owns 75% equity interest in JHMC, representing majority of voting right and controls its board of directors. As of September 30, 2012, the Company had consolidated the assets and operations of JHMC. Up to June 30, 2014, MEIJI further invested in JHMC of $400,000 in JHMC.
On July 18, 2011, the Company formed Hunan Shenghua A Power Agriculture Co., Limited (“HSA”), in which the Company owns a 26% equity interest, and SJAP owns a 50% equity interest with the Chinese partner owning the remaining 24%. Up to June 30, 2014, MEIJI and SJAP total investment in HSA were $857,808 and 629,344, respectively.
On November 12, 2013, the Company acquired a shell company, Goldcup9203 AB, incorporated in Sweden, in which the Company owns a 100% equity interest. Goldcup 9203 AB changed its name to Sino Agro Food Sweden AB (publ) (“SAFS”). Up to June 30, 2014, the Company’s total investment in SAFS was $77,664.
SJAP formed Qinghai Zhong He Meat Products Co., Limited (“QZH”) , with SJAP would owning 100% equity interest. Up to June 30, 2014, the SJAP’s total investment in QZH was $487,805.
The Company’s principal executive office is located at Room 3801, Block A, China Shine Plaza, No. 9 Lin He Xi Road, Tianhe District, Guangzhou City, Guangdong Province, P.R.C., 510610.
The nature of the operations and principal activities of the Company and its subsidiaries are described in Note 2.2.
| 2. | SUMMARY OF SIGNIFICANT ACCOUNTING POLICIES |
| 2.1 | FISCAL YEAR |
The Company has adopted December 31 as its fiscal year end.
| F - 5 |
SINO AGRO FOOD, INC.
NOTES TO CONSOLIDATED FINANCIAL STATEMENTS
FOR THE SIX MONTHS ENDED JUNE 30, 2014 AND 2013
| 2. | SUMMARY OF SIGNIFICANT ACCOUNTING POLICIES (CONTINUED) |
2.2 REPORTING ENTITIES
| Name of subsidiaries | Place of incorporation | Percentage of interest | Principal activities | |||
| Capital Award Inc. ("CA") | Belize | 100% (12.31.2013: 100%) directly | Fishery development and holder of A-Power Technology master license. | |||
| Capital Stage Inc. ("CS") | Belize | 100% (12.31.2013: 100%) indirectly | Dormant | |||
| Capital Hero Inc. ("CH") | Belize | 100% (12.31.2013: 100%) indirectly | Dormant | |||
| Sino Agro Food Sweden ("SAFS") | Sweden | 100% (12.31.2013: 100%) directly | Dormant | |||
| Tri-way Industries Limited ("TRW") | Hong Kong, P.R.C. | 100% (12.31.2013: 100%) directly | Investment holding, holder of enzyme technology master license for manufacturing of livestock feed and bio-organic fertilizer and has not commenced its planned business of fish farm operations. | |||
| Macau Meiji Limited ("MEIJI") | Macau, P.R.C. | 100% (12.31.2013: 100%) directly | Investment holding, cattle farm development, beef cattle and beef trading | |||
| A Power Agro Agriculture Development (Macau) Limited ("APWAM") | Macau, P.R.C. | 100% (12.31.2013: 100%) directly | Investment holding | |||
| Jiang Men City Heng Sheng Tai Agriculture Development Co. Ltd ("JHST") | P.R.C. | 75% (12.31.2013: 75%) indirectly | Hylocereus Undatus Plantation ("HU Plantation"). | |||
| Jiang Men City A Power Fishery Development Co., Limited ("JFD") | P.R.C. | 75% (12.31.2013: 75%) indirectly | Fish cultivation | |||
| Jiang Men City Hang Mei Cattle Farm Development Co., Limited ("JHMC") | P.R.C. | 75% (12.31.2013: 75%) indirectly | Beef cattle cultivation | |||
| Hunan Shenghua A Power Agriculture Co., Limited ("HSA") | P.R.C. | 26% directly and 50% indirectly (12.31.2013: 26% directly and 50% indirectly) | Manufacturing of organic fertilizer,livestock feed, and beef cattle and sheep cultivation, and plantation of crops and pastures | |||
| Name of variable interest entity | Place of incorporation | Percentage of interest | Principal activities | |||
| Qinghai Sanjiang A Power Agriculture Co., Ltd ("SJAP") | PRC | 45% (12.31.2013: 45%) indirectly | Manufacturing of organic fertilizer,livestock feed, and beef cattle and plantation of crops and pastures | |||
| Qinghai Zhong He Meat Products Co., Limited (QZH) | P.R.C. | 100% (12.31.2013: 0%) indirectly | Slaughter of cattle |
| F - 6 |
SINO AGRO FOOD, INC.
NOTES TO CONSOLIDATED FINANCIAL STATEMENTS
FOR THE SIX MONTHS ENDED JUNE 30, 2014 AND 2013
| 2. | SUMMARY OF SIGNIFICANT ACCOUNTING POLICIES (CONTINUED) |
| 2.3 | BASIS OF PRESENTATION |
The unaudited consolidated financial statements for the six months ended June 30, 2014 are prepared in accordance with generally accepted accounting principles in the United States of America (“US GAAP”).
The unaudited quarterly financials for the six months ended June 30, 2014 results are for the six months and do not necessarily indicate the results for a full year. The information included in this interim report should be read in conjunction with the information included in the Company’s annual report on Form 10-K for the fiscal year ended December 31, 2013.
| 2.4 | BASIS OF CONSOLIDATION |
The consolidated financial statements include the financial statements of the Company, its subsidiaries CA, CS, CH, TRW, MEIJI, JHST, JFD, JHMC, HSA, APWAM, and SAFS and its variable interest entity SJAP and QZH. All material inter-company transactions and balances have been eliminated in consolidation.
SIAF, CA, CS, CH, TRW, MEIJI, JHST, JFD, JHMC, HSA, APWAM, QZH, SAFS and SJAP are hereafter referred to as (“the Company”).
| 2.5 | BUSINESS COMBINATION |
The Company adopted the accounting pronouncements relating to business combination (primarily contained in ASC Topic 805 “Business Combinations”), including assets acquired and liabilities assumed on arising from contingencies. These pronouncements established principles and requirement for how the acquirer of a business recognizes and measures in its financial statements the identifiable assets acquired, the liabilities assumed, and any non-controlling interest in the acquisition as well as provides guidance for recognizing and measuring the goodwill acquired in the business combination and determines what information to disclose to enable users of the financial statements to evaluate the nature and financial effects of the business combination. In addition, these pronouncements eliminate the distinction between contractual and non-contractual contingencies, including the initial recognition and measurement criteria and require an acquirer to develop a systematic and rational basis for subsequently measuring and accounting for acquired contingencies depending on their nature. The Company’s adoption of these pronouncements will have an impact on the manner in which it accounts for any future acquisitions.
| 2.6 | NON - CONTROLLING INTEREST IN CONSOLIDATED FINANCIAL STATEMENTS |
The Company adopted the accounting pronouncement on non-controlling interests in consolidated financial statements, which establishes accounting and reporting standards for the non-controlling interest in a subsidiary and for the deconsolidation of a subsidiary. This guidance is primarily contained in ASC Topic “Consolidation.” It clarifies that a non-controlling interest in a subsidiary is an ownership interest in the consolidated financial statements. The adoption of this standard has not had material impact on the Company’s consolidated financial statements.
| 2.7 | USE OF ESTIMATES |
The preparation of consolidated financial statements in conformity with US GAAP requires management to make assumptions and estimates that affect the reported amounts of assets and liabilities and disclosure of contingent assets and liabilities at the dates of the consolidated financial statements and the reported amounts of revenues and expenses during the reporting periods covered thereby. Actual results could differ from these estimates. Judgments and estimates of uncertainties are required in applying the Company’s accounting policies in certain areas. The following are some of the areas requiring significant judgments and estimates: determinations of the useful lives of assets, estimates of allowances for doubtful accounts, cash flow and valuation assumptions in performing asset impairment tests of long-lived assets, estimates of the realization of deferred tax assets and inventory reserves.
| F - 7 |
SINO AGRO FOOD, INC.
NOTES TO CONSOLIDATED FINANCIAL STATEMENTS
FOR THE SIX MONTHS ENDED JUNE 30, 2014 AND 2013
| 2. | SUMMARY OF SIGNIFICANT ACCOUNTING POLICIES (CONTINUED) |
| 2.8 | REVENUE RECOGNITION |
The Company’s revenue recognition policies are in compliance with ASC 605. Sales revenue is recognized when all of the following have occurred: (i) persuasive evidence of an arrangement exists, (ii) delivery has occurred or services have been rendered, (iii) the price is fixed or determinable, and (iv) the ability to collect is reasonably assured. These criteria are generally satisfied at the time of shipment when risk of loss and title passes to the customer.
Government grants are recognized when (i) the Company has substantially accomplished what must be done pursuant to the terms of the grant that are established by the local government; and (ii) the Company receives notification from the local government that the Company has satisfied all of the requirements to receive the government grants; and (iii) the amounts are received.
Multiple-Element Arrangements
To qualify as a separate unit of accounting under ASC 605-25 “ Multiple Element Arrangements”, the delivered item must have value to the customer on a standalone basis. The significant deliverables under the Company’s multiple-element arrangements are consulting and service under development contract, commission and management service.
Revenues from the Company's consulting and services under development contracts are performed under fixed-price contracts. Revenues under long-term contracts are accounted for under the percentage-of-completion method of accounting in accordance with the Financial Accounting Standards Board (“FASB”) Accounting Standards Codification (“ASC”) Topic 605, Revenue Recognition (“ASC 605”). Under the percentage-of-completion method, the Company estimates profit as the difference between total estimated revenue and total estimated cost of a contract and recognizes that profit over the contract term. The percentage of costs incurred determines the amount of revenue to be recognized. Payment terms are generally defined by the installation contract and as a result may not match the timing of the costs incurred by the Company and the related recognition of revenue. Such differences are recorded as either costs or estimated earnings in excess of billings on uncompleted contracts or billings in excess of costs and estimated earnings on uncompleted contracts. The Company determines a customer’s credit worthiness at the time an order is accepted. Sudden and unexpected changes in a customer’s financial condition could put recoverability at risk.
The percentage of completion method requires the ability to estimate several factors, including the ability of the customer to meet its obligations under the contract, including the payment of amounts when due. If the Company determines that collectability is not assured, the Company will defer revenue recognition and use methods of accounting for the contract such as the completed contract method until such time as the Company determines that collectability is reasonably assured or through the completion of the project.
For fixed-price contracts, the Company uses the ratio of costs incurred to date on the contract to management's estimate of the contract's total costs, to determine the percentage of completion on each contract. This method is used as management considers expended costs to be the best available measure of progression of these contracts. Contract costs include all direct material, subcontract and labor costs and those indirect costs related to contract performance, such as supplies, tool repairs and depreciation. The Company accounts for maintenance and repair services under the guidance of ASC 605 as the services provided relate to construction work. Contract costs incurred to date and expected total contract costs are continuously monitored during the term of the contract. Changes in job performance, job conditions, and estimated profitability arising from contract penalty, change orders and final contract settlements may result in revisions to the estimated profit ability during the contract. These changes, which include contracts with estimated costs in excess of estimated revenues, are recognized as contract costs in the period in which the revisions are determined. Profit incentives are included in revenues when their realization is reasonably assured. At the point the Company anticipates a loss on a contract, the Company estimates the ultimate loss through completion and recognizes that loss in the period in which the loss was identified.
| F - 8 |
SINO AGRO FOOD, INC.
NOTES TO CONSOLIDATED FINANCIAL STATEMENTS
FOR THE SIX MONTHS ENDED JUNE 30, 2014 AND 2013
| 2. | SUMMARY OF SIGNIFICANT ACCOUNTING POLICIES (CONTINUED) |
| 2.8 | REVENUE RECOGNITION (CONTINUED) |
The Company does not provide warranties to customers on a basis customary to the industry, however, customers can claim warranty directly from product manufacturers for defects in equipment or products. Historically, the Company has experienced no warranty claims.
The Company provides various management services to its customers in the P.R.C. based on a negotiated fixed-price contract. The clients usually pay the fees when the services contract is signed and services are rendered. The Company recognizes these services-based revenues from contracts when (i) management services are rendered; (ii) clients recognize the completion of services; and (iii) collectability is reasonably assured. Fees received in advance are recorded as deferred revenue under current liabilities.
| 2.9 | COST OF GOODS SOLD AND COST OF SERVICES |
Cost of goods sold consists primarily of direct purchase cost of merchandise goods, and related levies. Cost of services consists primarily direct cost and indirect cost incurred to date for development contracts and provision for anticipated losses for development contracts.
| 2.10 | SHIPPING AND HANDLING |
Shipping and handling costs related to cost of goods sold are included in general and administrative expenses, which totaled $4,316 , $7,542, $10,582 and $10,850 for the three months and for the six months ended June 30, 2014 and 2013, respectively.
| 2.11 | ADVERTISING |
Advertising costs are included in general and administrative expenses, which totaled $952,924, $542, $953,054 and $542 for the three months ended and the six months ended June 30, 2014 and 2013, respectively.
| 2.12 | FOREIGN CURRENCY TRANSLATION AND OTHER COMPREHENSIVE INCOME |
The reporting currency of the Company is the U.S. dollar. The functional currency of the Company is the Chinese Renminbi (RMB).
For those entities whose functional currency is other than the U.S. dollar, all assets and liabilities are translated into U.S. dollars at the exchange rate on the balance sheet date; shareholders’ equity is translated at historical rates and items in the statements of income and of cash flows are translated at the average rate for the period. Because cash flows are translated based on the average translation rate, amounts related to assets and liabilities reported in the statements of cash flows will not necessarily agree with changes in the corresponding balances in the balance sheets. Translation adjustments resulting from this process are included in accumulated other comprehensive income in the statements of shareholders’ equity. Transaction gains and losses that arise from exchange rate fluctuations on transactions denominated in a currency other than the functional currency are included in the statements of income and comprehensive income, as incurred.
Accumulated other comprehensive income in the consolidated statement of shareholders’ equity amounted to $5,600,438 as of June 30, 2014 and $6,260,131 as of December 31, 2013. The balance sheet amounts with the exception of equity as of June 30, 2014 and December 31, 2013 and 2012 were translated using an exchange rate of RMB 6.15 to $1.00 and RMB 6.10 to $1.00, respectively. The average translation rates applied to the statements of income and other comprehensive income and of cash flows for the six months ended June 30, 2014 and 2013 were RMB 6.13 to $1.00 and RMB 6.24 to $1.00, respectively.
| 2.13 | CASH AND CASH EQUIVALENTS |
The Company considers all highly liquid securities with original maturities of three months or less when acquired to be cash equivalents. Cash and cash equivalents kept with financial institutions in the PRC are not insured or otherwise protected. Should any of those institutions holding the Company’s cash become insolvent, or should the Company become unable to withdraw funds for any reason, the Company could lose the cash on deposit with that institution.
| F - 9 |
SINO AGRO FOOD, INC.
NOTES TO CONSOLIDATED FINANCIAL STATEMENTS
FOR THE SIX MONTHS ENDED JUNE 30, 2014 AND 2013
| 2. | SUMMARY OF SIGNIFICANT ACCOUNTING POLICIES (CONTINUED) |
| 2.14 | ACCOUNTS RECEIVABLE |
The Company maintains reserves for potential credit losses on accounts receivable. Management reviews the composition of accounts receivable and analyzes historical bad debts, customer concentrations, customer credit worthiness, current economic trends and changes in customer payment patterns to evaluate the adequacy of these reserves. Reserves are recorded primarily on a specific identification basis.
The standard credit period for most of the Company’s clients is three months. The collection period over 1 year is classified as long-term accounts receivable. Management evaluates the collectability of the receivables at least quarterly. Provision for doubtful accounts as of June 30, 2014 and December 31, 2013 are $0.
| 2.15 | INVENTORIES |
Inventories are valued at the lower of cost (determined on a weighted average basis) and net realizable value.
Costs incurred in bringing each product to its location and conditions are accounted for as follows:
| (a) | raw materials – purchase cost on a weighted average basis; |
| (b) | manufactured finished goods and work-in-progress – cost of direct materials and labor and a proportion of manufacturing overhead based on normal operation capacity but excluding borrowing costs; and |
| (c) | retail and wholesale merchandise finished goods – purchase cost on a weighted average basis. |
Net realizable value is the estimated selling price in the ordinary course of business, less estimated costs for completion and the estimated costs necessary to make the sale.
| 2.16 | PROPERTY AND EQUIPMENT |
Property and equipment are stated at cost less accumulated depreciation and any accumulated impairment losses. Such costs include the cost of replacing parts that are eligible for capitalization when the cost of replacing the parts is incurred. Similarly, when each major inspection is performed, its cost is recognized in the carrying amount of the property and equipment as a replacement only if it is eligible for capitalization. The assets’ residual values, useful lives and depreciation methods are reviewed, and adjusted if appropriate, at each financial year end.
Depreciation is calculated on a straight-line basis over the estimated useful lives of the assets.
| Plant and machinery | 5 - 10 years |
| Structure and leasehold improvements | 10 - 20 years |
| Mature seeds and herbage cultivation | 20 years |
| Furniture and equipment | 2.5 - 10 years |
| Motor vehicles | 5 -10 years |
An item of property and equipment is removed from the accounts upon disposal or when no future economic benefits are expected to arise from the continued use of the asset. Any gain or loss arising on disposal of the asset (calculated as the difference between the net disposal proceeds and the carrying amount of the item) is included in the consolidated statements of income in the period the item is disposed.
| 2.17 | GOODWILL |
Goodwill is an asset representing the fair economic benefits arising from other assets acquired in a business combination that are not individually identified or separately recognized. Goodwill is tested for impairment on an annual basis at the end of the Company’s fiscal year, or when impairment indicators arise. The Company uses a fair-value-based approach to test for impairment at the level of each reporting unit. The Company directly acquired MEIJI, which is the holding company of JHST that operates the Hu Plantation. As a result of this acquisition, the Company recorded goodwill in the amount of $724,940. This goodwill represents the fair value of the assets acquired in these acquisitions over the cost of the assets acquired.
| F - 10 |
SINO AGRO FOOD, INC.
NOTES TO CONSOLIDATED FINANCIAL STATEMENTS
FOR THE SIX MONTHS ENDED JUNE 30, 2014 AND 2013
| 2. | SUMMARY OF SIGNIFICANT ACCOUNTING POLICIES (CONTINUED) |
| 2.18 | PROPRIETARY TECHNOLOGIES |
A master license of stock feed manufacturing technology was acquired and the costs of acquisition are capitalized as proprietary technologies when technological feasibility has been established. Cost of acquisition of stock feed manufacturing technology master license is amortized using the straight-line method over its estimated life of 20 years.
An aromatic cattle-feeding formula was acquired and the costs of acquisition are capitalized as proprietary technologies when technological feasibility has been established. Cost of acquisition on aromatic cattle-feeding formula is amortized using the straight-line method over its estimated life of 25 years.
The cost of sleepy cod breeding technology license is capitalized as proprietary technologies when technological feasibility has been established. Cost of granting sleepy cod breeding technology license is amortized using the straight-line method over its estimated life of 25 years.
Bacterial cellulose technology license and related trade mark are capitalized as proprietary technologies when technological feasibility has been established. Cost of license and related trade mark is amortized using the straight-line method over its estimated life of 20 years.
The Company has determined that technological feasibility is established at the time a working model of products is completed. Proprietary technologies are intangible assets of finite lives. Management evaluates the recoverability of proprietary technologies on an annual basis at the end of the Company’s fiscal year, or when impairment indicators arise. As required by ASC Topic 350 “Intangible – Goodwill and Other”, the Company uses a fair-value-based approach to test for impairment.
| 2.19 | CONSTRUCTION IN PROGRESS |
Construction in progress represents direct costs of construction as well as acquisition and design fees incurred. Capitalization of these costs ceases and the construction in progress is transferred to property and equipment when substantially all the activities necessary to prepare the assets for their intended use are completed. No depreciation is provided until construction is completed and the asset is ready for its intended use.
| 2.20 | LAND USE RIGHTS |
Land use rights represent acquisition of rights to agricultural land from farmers and are amortized on the straight-line basis over their respective lease periods. The lease period of agricultural land is in the range from 10 to 60 years. Land use rights purchase prices were determined in accordance with the P.R.C. Government’s minimum lease payments on agricultural land and mutually agreed to terms between the Company and the vendors.
| 2.21 | CORPORATE JOINT VENTURE |
A corporation formed, owned, and operated by two or more businesses as a separate and discrete business or project (venture) for their mutual benefit is considered to be a corporate joint venture. Investee entities, in which the Company can exercise significant influence, but not control, are accounted for under the equity method of accounting. Under the equity method of accounting, the Company’s share of the earnings or losses of these companies is included in net income.
A loss in value of an investment that is other than a temporary decline is recognized as a charge to operations. Evidence of a loss in value might include, but would not necessarily be limited to, the absence of an ability to recover the carrying amount of the investment or inability of the investee to sustain an earnings capacity that would justify the carrying amount of the investment.
| F - 11 |
SINO AGRO FOOD, INC.
NOTES TO CONSOLIDATED FINANCIAL STATEMENTS
FOR THE SIX MONTHS ENDED JUNE 30, 2014 AND 2013
| 2. | SUMMARY OF SIGNIFICANT ACCOUNTING POLICIES (CONTINUED) |
| 2.22 | VARIABLE INTEREST ENTITY |
A variable interest entity (“VIE”) is an entity (investee) in which the investor has obtained less than a majority interest, according to the Financial Accounting Standards Board (FASB). A VIE is subject to consolidation if a VIE meets one of the following three criteria as elaborated in ASC Topic 810-10, Consolidation:
| (a) | equity-at-risk is not sufficient to support the entity's activities; |
| (b) | as a group, the equity-at-risk holders cannot control the entity; or |
| (c) | the economics do not coincide with the voting interest. |
If a firm is the primary beneficiary of a VIE, the holdings must be disclosed on the balance sheet. The primary beneficiary is defined as the person or company with the majority of variable interests. A corporation formed, owned, and operated by two or more businesses (ventures) as a separate and discrete business or project (venture) for their mutual benefit is defined as a joint venture.
| 2.23 | TREASURY STOCK |
Treasury stock means shares of a corporation’s own stock that have been issued and subsequently reacquired by the corporation. Converting outstanding shares to treasury shares does not reduce the number of shares issued but does reduce the number of shares outstanding. These shares are not eligible to receive dividends. Accounting for excesses and deficiencies on treasury stock transactions is governed by ASC 505-30-30.
State laws and federal agencies closely regulate transactions involving a company’s own capital stock, so the purchase of outstanding shares must have a legitimate purpose. Some of the most common reasons for purchasing outstanding shares are as follows:
| (a) | to meet additional stock needs for various reasons, including newly implemented stock option plans, stock for convertible bonds or convertible preferred stock, or a stock dividend. |
| (b) | to make more shares available for acquisitions of other entities. |
The cost method of accounting for treasury shares has been adopted by the Company. The purchase of outstanding shares and thus converting them into treasury shares is treated as a temporary reduction in shareholders’ equity in view of the expectation to reissue the shares instead of retiring them. When the Company reissues the treasury shares, the temporary account is eliminated. The cost of acquiring outstanding shares for converting into treasury shares is charged to a contra account, in this case a contra equity account that reduces the stockholder equity balance.
| 2.24 | INCOME TAXES |
The Company accounts for income taxes under the provisions of ASC Topic 740 “Accounting for Income Taxes.” Under ASC Topic 740, deferred tax assets and liabilities are determined based on the difference between the financial statement carrying amounts and the tax bases of assets and liabilities using enacted tax rates in effect in the years in which the differences are expected to reverse.
The provision for income tax is based on the results for the year as adjusted for items, which are non-assessable or disallowed. It is calculated using tax rates that have been enacted or substantively enacted at the balance sheet date. Deferred tax is accounted for using the balance sheet liability method in respect of temporary differences arising from differences between the carrying amount of assets and liabilities in the financial statements and the corresponding tax basis used in the computation of assessable tax profit. In principle, deferred tax liabilities are recognized for all taxable temporary differences, and deferred tax assets are recognized to the extent that it is probable that taxable profit will be available against which deductible temporary differences can be utilized.
| F - 12 |
SINO AGRO FOOD, INC.
NOTES TO CONSOLIDATED FINANCIAL STATEMENTS
FOR THE SIX MONTHS ENDED JUNE 30, 2014 AND 2013
| 2. | SUMMARY OF SIGNIFICANT ACCOUNTING POLICIES (CONTINUED) |
| 2.24 | INCOME TAXES (CONTINUED) |
Deferred income taxes are calculated at the tax rates that are expected to apply to the period when the asset is realized or the liability is settled. Deferred tax is charged or credited in the income statement, except when it related to items credited or charged directly to equity, in which case the deferred tax is also dealt with in equity. Deferred tax assets and liabilities are offset when they relate to income taxes levied by the same taxation authority and the Company intends to settle its current tax assets and liabilities on a net basis.
ASC Topic 740 also prescribes a more-likely-than-not threshold for financial statement recognition and measurement of a tax position taken, or for one expected to be taken, in a tax return. ASC Topic 740 also provides guidance related to, among other things, classification, accounting for interest and penalties associated with tax positions, and disclosure requirements. Any interest and penalties accrued related to unrecognized tax benefits will be recorded as tax expense.
| 2.25 | POLITICAL AND BUSINESS RISK |
The Company's operations are carried out in the P.R.C. Accordingly, the political, economic and legal environment in the P.R.C. may influence the Company’s business, financial condition and results of operations by the general state of the P.R.C.'s economy. The Company's operations in the PRC are subject to specific considerations and significant risks not typically associated with companies in North America and Western Europe. The Company's results may be adversely affected by changes in governmental policies with respect to laws and regulations, anti-inflationary measures, currency conversion and remittance abroad, and rates and methods of taxation, among other things.
| 2.26 | CONCENTRATION OF CREDIT RISK |
Cash includes cash at banks and demand deposits in accounts maintained with banks within the P.R.C. Total cash in these banks as of June 30, 2014 and December 31, 2013 amounted to $3,483,283 and $1,256,440 respectively, none of which is covered by insurance. The Company has not experienced any losses in such accounts and believes it is not exposed to any risks to its cash in bank accounts.
The Company had 5 major customers (A, B, C, D & E) whose business individually represented the following percentages of the Company’s total revenue for the periods indicated:
| Three months | Three months | Six months | Six months | |||||||||||||
| ended | ended | ended | ended | |||||||||||||
| June 30, | June 30, | June 30, | June 30, | |||||||||||||
| 2014 | 2013 | 2014 | 2013 | |||||||||||||
| Customer A | 31.08 | % | 26.94 | % | 30.33 | % | 18.57 | % | ||||||||
| Customer B | 18.77 | % | 12.51 | % | 17.23 | % | 12.32 | % | ||||||||
| Customer C | 9.90 | % | - | 10.10 | % | - | ||||||||||
| Customer D | 8.17 | % | 7.98 | % | - | - | ||||||||||
| Customer E | 5.17 | % | 8.90 | % | 5.06 | % | 10.09 | % | ||||||||
| Customer F | - | 7.86 | % | - | - | |||||||||||
| Customer G | - | - | 6.54 | % | - | |||||||||||
| Customer H | - | - | - | 16.71 | % | |||||||||||
| Customer I | - | - | - | 8.20 | % | |||||||||||
| 73.09 | % | 64.19 | % | 69.26 | % | 65.89 | % | |||||||||
| F - 13 |
SINO AGRO FOOD, INC.
NOTES TO CONSOLIDATED FINANCIAL STATEMENTS
FOR THE SIX MONTHS ENDED JUNE 30, 2014 AND 2013
2. SUMMARY OF SIGNIFICANT ACCOUNTING POLICIES (CONTINUED)
| 2.26 | CONCENTRATION OF CREDIT RISK (CONTINUED) |
| Percent of | ||||||||||
| Segment | revenue | Amount | ||||||||
| Customer A | Fishery Development and Corporate and others Divisions | 30.33 | % | $ | 57,017,319 | |||||
| Customer B | Organic Fertilizer and Bread Grass Division | 17.23 | % | $ | 32,394,481 | |||||
| Customer C | Fishery Development Division | 10.10 | % | $ | 18,982,739 | |||||
Accounts receivable are derived from revenue earned from customers located primarily in the P.R.C. The Company performs ongoing credit evaluations of customers and has not experienced any material losses to date.
The Company had 5 major customers whose accounts receivable balance individually represented the following percentages of the Company’s total accounts receivable:
| June 30, 2014 | December 31, 2013 | |||||||
| Customer A | 16.17 | % | 8.69 | % | ||||
| Customer B | 12.36 | % | 12.86 | % | ||||
| Customer C | 10.34 | % | - | |||||
| Customer D | 8.12 | % | - | |||||
| Customer E | 7.76 | % | 8.36 | % | ||||
| Customer F | - | 10.23 | % | |||||
| Customer G | - | 8.27 | % | |||||
| 54.75 | % | 48.41 | % | |||||
As of June 30, 2014, amounts due from customers A, B and C are $18,945,544, $14,488,064 and $12,113,628, respectively. The Company has not experienced any significant difficulty in collecting its accounts receivable in the past and is not aware of any financial difficulties of its major customers.
| 2.27 | IMPAIRMENT OF LONG-LIVED ASSETS AND INTANGIBLE ASSETS |
In accordance with ASC Topic 360, “Property, Plant and Equipment,” long-lived assets to be held and used are analyzed for impairment whenever events or changes in circumstances indicate that the related carrying amounts may not be recoverable. The Company reviews the carrying amount of its long-lived assets, including intangibles, for impairment, each reporting period. An asset is considered impaired when estimated future cash flows are less than the carrying amount of the asset. In the event the carrying amount of such asset is considered not recoverable, the asset is adjusted to its fair value. Fair value is generally determined based on discounted future cash flow. As of June 30, 2014 and December 31, 2013, the Company determined no impairment losses were necessary.
| F - 14 |
SINO AGRO FOOD, INC.
NOTES TO CONSOLIDATED FINANCIAL STATEMENTS
FOR THE SIX MONTHS ENDED JUNE 30, 2014 AND 2013
| 2. | SUMMARY OF SIGNIFICANT ACCOUNTING POLICIES (CONTINUED) |
| 2.28 | EARNINGS PER SHARE |
As prescribed in ASC Topic 260 “Earnings per Share,” Basic Earnings per Share (“EPS”) is computed by dividing net income available to common stockholders by the weighted average number of common stock shares outstanding during the year. Diluted EPS is computed by dividing net income available to common stockholders by the weighted-average number of common stock shares outstanding during the year plus potential dilutive instruments such as stock options and warrants. The effect of stock options on diluted EPS is determined through the application of the treasury stock method, whereby proceeds received by the Company based on assumed exercises are hypothetically used to repurchase the Company’s common stock at the average market price during the period.
For the three months ended June 30, 2014 and 2013, basic earnings per share attributable to Sino Agro Food, Inc. and subsidiaries common stockholders amount to $0.15 and $0.13, respectively. For the six months ended June 30, 2014 and 2013, basic earnings per share attributable to Sino Agro Food, Inc. and subsidiaries common stockholders amount to $0.29 and $0.28, respectively. For the three months ended June 30, 2014 and 2013, diluted earnings per share attributable to Sino Agro Food, Inc. and its subsidiaries’ common stockholders amounted to $0.14 and $0.12, respectively. For the six months ended June 30, 2014 and 2013, diluted earnings per share attributable to Sino Agro Food, Inc. and its subsidiaries’ common stockholders amounted to $0.28 and $0.27, respectively.
| 2.29 | ACCUMULATED OTHER COMPREHENSIVE INCOME |
ASC Topic 220 “Comprehensive Income” establishes standards for reporting and displaying comprehensive income and its components in financial statements. Comprehensive income is defined as the change in stockholders’ equity of a business enterprise during a period from transactions and other events and circumstances from non-owner sources. The comprehensive income for all periods presented includes both the reported net income and net change in cumulative translation adjustments.
| 2.30 | RETIREMENT BENEFIT COSTS |
P.R.C. state managed retirement benefit programs are defined contribution plans and the payments to the plans are charged as expenses when employees have rendered service entitling them to the contribution made by the employer.
| 2.31 | STOCK-BASED COMPENSATION |
The Company has adopted both ASC Topic 718, “Compensation - Stock Compensation” and ASC Topic 505-50, “Equity-Based Payments to Non- Employees” using the fair value method in which an entity issues its equity instruments to acquire goods and services from employees and non-employees. Stock compensation for stock granted to non-employees has been determined in accordance with this accounting standard and the accounting standard regarding accounting for equity instruments that are issued to other than employees for acquiring, or in conjunction with selling goods or services, as the fair value of the consideration received or the fair value of equity instruments issued, whichever is more reliably measured. This accounting standard allows the “simplified” method to determine the term of employee options when other information is not available. Under ASC Topic 718 and ASC Topic 505-50, stock compensation expenses is measured at the grant date on the value of the option or restricted stock and is recognized as expenses, less expected forfeitures, over the requisite service period, which is generally the vesting period.
| F - 15 |
SINO AGRO FOOD, INC.
NOTES TO CONSOLIDATED FINANCIAL STATEMENTS
FOR THE SIX MONTHS ENDED JUNE 30, 2014 AND 2013
2. SUMMARY OF SIGNIFICANT ACCOUNTING POLICIES (CONTINUED)
| 2.32 | FAIR value of financial INSTRUMENTS |
The Company follows paragraph 825-10-50-10 of the FASB Accounting Standards Codification for disclosures about fair value of its financial instruments and paragraph 820-10-35-37 of the FASB Accounting Standards Codification (“Paragraph 820-10-35-37”) to measure the fair value of its financial instruments. Paragraph 820-10-35-37 establishes a framework for measuring fair value under U.S. GAAP, and expands disclosures about fair value measurements. To increase consistency and comparability in fair value measurements and related disclosures, Paragraph 820-10-35-37 establishes a fair value hierarchy, which prioritizes the inputs to valuation techniques used to measure fair value into three (3) broad levels. The fair value hierarchy gives the highest priority to quoted prices (unadjusted) in active markets for identical assets or liabilities and the lowest priority to unobservable inputs. The three (3) levels of fair value hierarchy defined by Paragraph 820-10-35-37 are described below:
| Level 1 | Quoted market prices available in active markets for identical assets or liabilities as of the reporting date. |
| Level 2 | Pricing inputs other than quoted prices in active markets included in Level 1, which are either directly or indirectly observable as of the reporting date. |
| Level 3 | Pricing inputs that are generally observable inputs and not corroborated by market data. |
The carrying amounts of the Company’s financial assets and liabilities, such as cash and accrued expenses, approximate their fair values because of the short maturity of these instruments. The Company does not have any assets or liabilities measured at fair value on a recurring or a non-recurring basis, consequently, the Company did not have any fair value adjustments for assets and liabilities measured at fair value as of June 30, 2014 or December 31, 2013, nor gains or losses are reported in the statements of income and comprehensive income that are attributable to the change in unrealized gains or losses relating to those assets and liabilities still held at the reporting date for the six months ended June 30, 2014 or 2013.
| 2.33 | NEW ACCOUNTING PRONOUNCEMENTS |
The Company does not expect any recent accounting pronouncements to have a material effect on the Company’s financial position, results of operations, or cash flows.
In February 2013, the FASB issued guidance on disclosure requirements for items reclassified out of Accumulated Other Comprehensive Income (“AOCI”).This new guidance requires entities to present (either on the face of the income statements or in the notes) the effects on the line items of the income statement foramounts reclassified out of AOCI. The new guidance will be effective for us beginning July 1, 2013. Other than requiring additional disclosures, we do not anticipate a material impact on the consolidated financial statements upon adoption.
In March 2013, the FASB issued guidance on a parent’s accounting for the cumulative translation adjustment upon derecognition of a subsidiary or group ofassets within a foreign entity. This new guidance requires that the parent releases any related cumulative translation adjustment into net income only if the saleor transfer results in thecomplete or substantially complete liquidation of the foreign entity in which the subsidiary or group of assets had resided. The newguidance will be effective for us beginning July 1, 2014. We do not anticipate a material impact on the consolidated financial statements upon adoption.
In July 2013, the FASB issued ASU 2013-11, “Presentation of an Unrecognized Tax Benefit When a Net Operating Loss Carry forward, a Similar Tax Loss, or a Tax Credit Carry forward Exists”. These amendments provide that an unrecognized tax benefit, or a portion thereof, should be presented in the financial statements as a reduction to a deferred tax asset for a net operating loss carryforward, a similar tax loss, or a tax credit carry forward, except to the extent that a net operating loss carry forward, a similar tax loss, or a tax credit carry forward is not available at the reporting date to settle any additional income taxes that would result from disallowance of a tax position, or the tax law does not require the entity to use, and the entity does not intend to use, the deferred tax asset for such purpose, then the unrecognized tax benefit should be presented as a liability. For public entities, the amendments are effective for fiscal years, and interim periods within those years, beginning after December 15, 2013. The adoption of ASU 2013-11 is not expected to have a material impact on the Company’s consolidated financial statements.
| F - 16 |
SINO AGRO FOOD, INC.
NOTES TO CONSOLIDATED FINANCIAL STATEMENTS
FOR THE SIX MONTHS ENDED JUNE 30, 2014 AND 2013
| 2. | SUMMARY OF SIGNIFICANT ACCOUNTING POLICIES (CONTINUED) |
| 2.33 | NEW ACCOUNTING PRONOUNCEMENTS (CONTINUED) |
In May 2014, the Financial Accounting Standards Board issued guidance related to revenue from contracts with customers. Under this guidance, revenue is recognized when promised goods or services are transferred to customers in an amount that reflects the consideration that is expected to be received for those goods or services. The updated standard will replace most existing revenue recognition guidance under GAAP when it becomes effective and permits the use of either the retrospective or cumulative effect transition method. Early adoption is not permitted. The updated standard will be effective for us in the first quarter of 2017. We have not yet selected a transition method and we are currently evaluating the effect that the updated standard will have on our consolidated financial statements and related disclosures.
Other accounting standards that have been issued or proposed by FASB that do not require adoption until a future date are not expected to have a material impact on the consolidated financial statements upon adoption.
| 3. | SEGMENT INFORMATION |
The Company establishes standards for reporting information about operating segments on a basis consistent with the Company’s internal organization structure as well as business segments and major customers in consolidated financial statements. The Company operates in five principal reportable segments: Fishery Development Division, and HU Plantation Division and Organic Fertilizer and Bread Grass Division, Cattle Development Division and Corporate and others. No geographic information is required as all revenue and assets are located in the P.R.C.
| For the three months ended June 30, 2014 | ||||||||||||||||||||||||
| Fishery Development Division (1) | HU Plantation Division (2) | Organic Fertilizer and Bread Grass Division (3) | Cattle Farm Development Division (4) | Corporate and others (5) | Total | |||||||||||||||||||
| Revenue | $ | 39,950,675 | $ | 2,511,888 | $ | 32,784,632 | $ | 7,123,915 | $ | 14,661,394 | $ | 97,032,504 | ||||||||||||
| Net income (loss) | $ | 7,937,761 | $ | 1,210,425 | $ | 8,901,795 | $ | 1,058,369 | $ | 3,978,688 | $ | 23,087,038 | ||||||||||||
| Total assets | $ | 116,064,028 | $ | 49,025,362 | $ | 201,091,298 | $ | 45,873,510 | $ | 34,530,562 | $ | 446,584,760 | ||||||||||||
| For the three months ended June 30, 2013 | ||||||||||||||||||||||||
| Fishery Development Division (1) | HU Plantation Division (2) | Organic Fertilizer and Bread Grass Division (3) | Cattle Farm Development Division (4) | Corporate and others (5) | Total | |||||||||||||||||||
| Revenue | $ | 17,904,106 | $ | 3,554,986 | $ | 16,946,378 | $ | 6,421,161 | $ | 9,573,698 | $ | 54,400,329 | ||||||||||||
| Net income (loss) | $ | 2,898,600 | $ | 2,452,706 | $ | 5,679,317 | $ | 929,277 | $ | 2,371,040 | $ | 14,330,940 | ||||||||||||
| Total assets | $ | 67,526,143 | $ | 38,726,053 | $ | 120,479,483 | $ | 41,542,654 | $ | 26,251,321 | $ | 294,525,654 | ||||||||||||
| F - 17 |
SINO AGRO FOOD, INC.
NOTES TO CONSOLIDATED FINANCIAL STATEMENTS
FOR THE SIX MONTHS ENDED JUNE 30, 2014 AND 2013
3. SEGMENT INFORMATION (CONTINUED)
| For the six months ended June 30, 2014 | ||||||||||||||||||||||||
| Fishery Development Division (1) | HU Plantation Division (2) | Organic Fertilizer and Bread Grass Division (3) | Cattle Farm Development Division (4) | Corporate and others (5) | Total | |||||||||||||||||||
| Revenue | 83,714,940 | $ | 3,271,940 | 61,759,715 | 14,668,506 | 24,545,192 | 187,960,293 | |||||||||||||||||
| Net income (loss) | $ | 18,248,399 | $ | 1,185,157 | 18,919,825 | $ | 1,324,563 | 4,197,013.00 | $ | 43,874,957 | ||||||||||||||
| Total assets | $ | 116,064,028 | $ | 49,025,362 | $ | 201,091,298 | $ | 45,873,510 | $ | 34,530,562 | $ | 446,584,760 | ||||||||||||
| For the six months ended June 30, 2013 | ||||||||||||||||||||||||
| Fishery Development Division (1) | HU Plantation Division (2) | Organic Fertilizer and Bread Grass Division (3) | Cattle Farm Development Division (4) | Corporate and others (5) | Total | |||||||||||||||||||
| Revenue | $ | 42,122,633 | $ | 3,554,986 | $ | 31,824,277 | $ | 14,783,718 | $ | 17,222,466 | $ | 109,508,080 | ||||||||||||
| Net income (loss) | $ | 11,053,353 | $ | 2,211,567 | $ | 9,342,579 | $ | 3,369,881 | $ | 4,732,332 | $ | 30,709,712 | ||||||||||||
| Total assets | $ | 67,526,143 | $ | 38,726,053 | $ | 120,479,483 | $ | 41,542,654 | $ | 26,251,321 | $ | 294,525,654 | ||||||||||||
Note
| (1) | Operated by Capital Award, Inc. (“CA”). and Jiangmen City A Power Fishery Development Co., Limited (“JFD”). |
| (2) | Operated by Jiangmen City Heng Sheng Tai Agriculture Development Co., Limited (“JHST”). |
| (3) | Operated by Qinghai Sanjiang A Power Agriculture Co., Limited (“SJAP”), A Power Agro Agriculture Development (Macau) Limited (“APWAM”) , Qinghai Zhong He Meat Products Co., Limited (“QZH”), A Power Agro Agriculture Development (Macau) Limited (“APWAM”) and Hunan Shenghua A Power Agriculture Co., Limited (“HSA”). |
| (4) | Operated by Jiangmen City Hang Mei Cattle Farm Development Co. Limited (“JHMC”) and Macau Meiji Limited (“MEIJI”). |
| (5) | Operated by Sino Agro Food, Inc. (“SIAF”) and Sino Agro Food Sweden AB (publ) (“SAFS”). |
| F - 18 |
SINO AGRO FOOD, INC.
NOTES TO CONSOLIDATED FINANCIAL STATEMENTS
FOR THE SIX MONTHS ENDED JUNE 30, 2014 AND 2013
3. SEGMENT INFORMATION (CONTINUED)
Further analysis of revenue:-
| Three months ended June 30, 2014 | ||||||||||||||||||||||||
| Fishery Development Division (1) | HU Plantation Division (2) | Organic Fertilizer and Bread Grass Division (3) | Cattle Farm Development Division (4) | Corporate and others (5) | Total | |||||||||||||||||||
| Name of entity | ||||||||||||||||||||||||
| Sale of goods | ||||||||||||||||||||||||
| Capital Award, Inc. ("CA") | $ | 26,904,918 | $ | - | $ | - | $ | - | $ | - | $ | 26,904,918 | ||||||||||||
| Jiang Men City Heng Sheng Tai Agriculture | ||||||||||||||||||||||||
| Development Co., Limited ("JHST") | - | 2,511,888 | - | - | - | 2,511,888 | ||||||||||||||||||
| Hunan Shenghua A Power | ||||||||||||||||||||||||
| Agriculture Co., Limited ("HSA") | - | - | 5,134,313 | - | - | 5,134,313 | ||||||||||||||||||
| Qinghai Sanjiang A Power | ||||||||||||||||||||||||
| Agriculture Co., Limited ("SJAP") | - | - | 25,851,492 | - | - | 25,851,492 | ||||||||||||||||||
| Qinghai Zhong He Meat Products Co., Limited ("QZH") | - | - | 1,798,827 | - | - | 1,798,827 | ||||||||||||||||||
| Macau Eiji Company Limited ("MEIJI") | - | - | - | 7,123,915 | - | 7,123,915 | ||||||||||||||||||
| Sino Agro Food, Inc. ("SIAF") | - | - | - | - | 13,031,707 | 13,031,707 | ||||||||||||||||||
| Consulting and service income for development contracts | ||||||||||||||||||||||||
| Capital Award, Inc. ("CA") | 12,716,611 | - | - | - | - | 12,716,611 | ||||||||||||||||||
| Macau Eiji Company Limited ("MEIJI") | - | - | - | - | - | - | ||||||||||||||||||
| Sino Agro Food, Inc. ("SIAF") | - | - | - | - | 1,629,687 | 1,629,687 | ||||||||||||||||||
| Commission and management fee | ||||||||||||||||||||||||
| Capital Award, Inc. ("CA") | 329,146 | - | - | - | - | 329,146 | ||||||||||||||||||
| Macau Eiji Company Limited ("MEIJI") | - | - | - | - | - | - | ||||||||||||||||||
| $ | 39,950,675 | $ | 2,511,888 | $ | 32,784,632 | $ | 7,123,915 | $ | 14,661,394 | $ | 97,032,504 | |||||||||||||
| Three months ended June 30, 2013 | ||||||||||||||||||||||||
| Fishery Development Division (1) | HU Plantation Division (2) | Organic Fertilizer and Bread Grass Division (3) | Cattle Farm Development Division (4) | Corporate and others (5) | Total | |||||||||||||||||||
| Name of entity | ||||||||||||||||||||||||
| Sale of goods | ||||||||||||||||||||||||
| Capital Award, Inc. ("CA") | $ | 11,955,394 | $ | - | $ | - | $ | - | $ | - | $ | 11,955,394 | ||||||||||||
| Jiang Men City Heng Sheng Tai | ||||||||||||||||||||||||
| Agriculture Development Co., Limited ("JHST") | - | 3,554,986 | - | - | - | 3,554,986 | ||||||||||||||||||
| Hunan Shenghua A Power | ||||||||||||||||||||||||
| Agriculture Co., Limited ("HSA") | - | - | 2,596,551 | - | - | 2,596,551 | ||||||||||||||||||
| Qinghai Sanjiang A Power | ||||||||||||||||||||||||
| Agriculture Co., Limited ("SJAP") | - | - | 14,349,827 | - | - | 14,349,827 | ||||||||||||||||||
| Qinghai Zhong He Meat Products Co., Limited ("QZH") | - | - | - | - | - | - | ||||||||||||||||||
| Macau Eiji Company Limited ("MEIJI") | - | - | - | 4,589,061 | - | 4,589,061 | ||||||||||||||||||
| Sino Agro Food, Inc. ("SIAF") | - | - | - | - | 5,106,031 | 5,106,031 | ||||||||||||||||||
| Consulting and service income for development contracts | ||||||||||||||||||||||||
| Capital Award, Inc. ("CA") | 5,630,970 | - | - | - | - | 5,630,970 | ||||||||||||||||||
| Macau Eiji Company Limited ("MEIJI") | - | - | - | 1,832,100 | - | 1,832,100 | ||||||||||||||||||
| Sino Agro Food, Inc. ("SIAF") | - | - | - | - | 4,272,119 | 4,272,119 | ||||||||||||||||||
| Commission and management fee | - | |||||||||||||||||||||||
| Capital Award, Inc. ("CA") | 317,742 | - | - | - | - | 317,742 | ||||||||||||||||||
| Macau Eiji Company Limited ("MEIJI") | - | - | - | - | 195,548 | 195,548 | ||||||||||||||||||
| $ | 17,904,106 | $ | 3,554,986 | $ | 16,946,378 | $ | 6,421,161 | $ | 9,573,698 | $ | 54,400,329 | |||||||||||||
| F - 19 |
SINO AGRO FOOD, INC.
NOTES TO CONSOLIDATED FINANCIAL STATEMENTS
FOR THE SIX MONTHS ENDED JUNE 30, 2014 AND 2013
3. SEGMENT INFORMATION (CONTINUED)
Further analysis of revenue (Continued):-
| Six months ended June 30, 2014 | ||||||||||||||||||||||||
| Fishery Development Division (1) | HU Plantation Division (2) | Organic Fertilizer and Bread Grass Division (3) | Cattle Farm Development Division (4) | Corporate and others (5) | Total | |||||||||||||||||||
| Name of entity | ||||||||||||||||||||||||
| Sale of goods | ||||||||||||||||||||||||
| Capital Award, Inc. ("CA") | $ | 58,013,703 | $ | - | $ | - | $ | - | $ | - | $ | 58,013,703 | ||||||||||||
| Jiang Men City Heng Sheng Tai Agriculture | ||||||||||||||||||||||||
| Development Co., Limited ("JHST") | - | 3,271,940 | - | - | - | 3,271,940 | ||||||||||||||||||
| Hunan Shenghua A Power | ||||||||||||||||||||||||
| Agriculture Co., Limited ("HSA") | - | - | 9,956,493 | - | - | 9,956,493 | ||||||||||||||||||
| Qinghai Sanjiang A Power | ||||||||||||||||||||||||
| Agriculture Co., Limited ("SJAP") | - | - | 50,004,395 | - | - | 50,004,395 | ||||||||||||||||||
| Qinghai Zhong He Meat Products Co., Limited ("QZH") | - | - | 1,798,827 | - | - | 1,798,827 | ||||||||||||||||||
| Macau Eiji Company Limited ("MEIJI") | - | - | - | 14,668,506 | - | 14,668,506 | ||||||||||||||||||
| Sino Agro Food, Inc. ("SIAF") | - | - | - | - | 22,915,505 | 22,915,505 | ||||||||||||||||||
| Consulting and service income for development contracts | ||||||||||||||||||||||||
| Capital Award, Inc. ("CA") | 24,959,813 | - | - | - | - | 24,959,813 | ||||||||||||||||||
| Macau Eiji Company Limited ("MEIJI") | - | - | - | - | - | - | ||||||||||||||||||
| Sino Agro Food, Inc. ("SIAF") | - | - | - | - | 1,629,687 | 1,629,687 | ||||||||||||||||||
| Commission and management fee | ||||||||||||||||||||||||
| Capital Award, Inc. ("CA") | 741,424 | - | - | - | - | 741,424 | ||||||||||||||||||
| Macau Eiji Company Limited ("MEIJI") | - | - | - | - | - | - | ||||||||||||||||||
| $ | 83,714,940 | $ | 3,271,940 | $ | 61,759,715 | $ | 14,668,506 | $ | 24,545,192 | $ | 187,960,293 | |||||||||||||
| Six months ended June 30, 2013 | ||||||||||||||||||||||||
| Fishery Development Division (1) | HU Plantation Division (2) | Organic Fertilizer and Bread Grass Division (3) | Cattle Farm Development Division (4) | Corporate and others (5) | Total | |||||||||||||||||||
| Name of entity | ||||||||||||||||||||||||
| Sale of goods | ||||||||||||||||||||||||
| Capital Award, Inc. ("CA") | $ | 24,864,595 | $ | - | $ | - | $ | - | $ | - | $ | 24,864,595 | ||||||||||||
| Jiang Men City Heng Sheng Tai | ||||||||||||||||||||||||
| Agriculture Development Co., Limited ("JHST") | - | 3,554,986 | - | - | - | 3,554,986 | ||||||||||||||||||
| Hunan Shenghua A Power | ||||||||||||||||||||||||
| Agriculture Co., Limited ("HSA") | - | - | 4,722,855 | - | - | 4,722,855 | ||||||||||||||||||
| Qinghai Sanjiang A Power | ||||||||||||||||||||||||
| Agriculture Co., Limited ("SJAP") | - | - | 27,101,422 | - | - | 27,101,422 | ||||||||||||||||||
| Qinghai Zhong He Meat Products Co., Limited ("QZH") | - | - | - | - | - | - | ||||||||||||||||||
| Macau Eiji Company Limited ("MEIJI") | - | - | - | 7,669,937 | - | 7,669,937 | ||||||||||||||||||
| Sino Agro Food, Inc. ("SIAF") | - | - | - | - | 10,787,409 | 10,787,409 | ||||||||||||||||||
| Consulting and service income for development contracts | ||||||||||||||||||||||||
| Capital Award, Inc. ("CA") | 16,843,522 | - | - | - | - | 16,843,522 | ||||||||||||||||||
| Macau Eiji Company Limited ("MEIJI") | - | - | - | 7,113,781 | - | 7,113,781 | ||||||||||||||||||
| Sino Agro Food, Inc. ("SIAF") | - | - | - | - | 6,239,509 | 6,239,509 | ||||||||||||||||||
| Commission and management fee | ||||||||||||||||||||||||
| Capital Award, Inc. ("CA") | 414,516 | - | - | - | - | 414,516 | ||||||||||||||||||
| Macau Eiji Company Limited ("MEIJI") | - | - | - | - | 195,548 | 195,548 | ||||||||||||||||||
| $ | 42,122,633 | $ | 3,554,986 | $ | 31,824,277 | $ | 14,783,718 | $ | 17,222,466 | $ | 109,508,080 | |||||||||||||
| F - 20 |
SINO AGRO FOOD, INC.
NOTES TO CONSOLIDATED FINANCIAL STATEMENTS
FOR THE SIX MONTHS ENDED JUNE 30, 2014 AND 2013
3. SEGMENT INFORMATION (CONTINUED)
Further analysis of cost of goods sold and cost of services:-
| Three months ended June 30, 2014 | ||||||||||||||||||||||||
| Fishery Development Division(1) | HU Plantation Division (2) | Organic Fertilizer and Bread Grass Division (3) | Cattle Farm Development Division (4) | Corporate and others (5) | Total | |||||||||||||||||||
| COST OF GOODS SOLD | ||||||||||||||||||||||||
| Name of entity | ||||||||||||||||||||||||
| Sale of goods | ||||||||||||||||||||||||
| Capital Award, Inc. ("CA") | $ | - | $ | - | $ | - | $ | - | $ | - | $ | - | ||||||||||||
| Jiang Men City Heng Sheng Tai Agriculture | ||||||||||||||||||||||||
| Development Co., Limited ("JHST") | 17,380,116 | 473,892 | - | - | - | 17,854,008 | ||||||||||||||||||
| Hunan Shenghua A Power | ||||||||||||||||||||||||
| Agriculture Co., Limited ("HSA") | - | - | 2,945,036 | - | - | 2,945,036 | ||||||||||||||||||
| Qinghai Sanjiang A Power | ||||||||||||||||||||||||
| Agriculture Co., Limited ("SJAP") | - | - | 17,752,361 | - | - | 17,752,361 | ||||||||||||||||||
| Qinghai Zhong He Meat Products Co., Limited ("QZH") | - | - | 1,160,279 | - | - | 1,160,279 | ||||||||||||||||||
| Macau Eiji Company Limited ("MEIJI") | - | - | - | 6,754,437 | - | 6,754,437 | ||||||||||||||||||
| Sino Agro Food, Inc. ("SIAF") | - | - | - | - | 11,583,739 | 11,583,739 | ||||||||||||||||||
| $ | 17,380,116 | $ | 473,892 | $ | 21,857,676 | $ | 6,754,437 | $ | 11,583,739 | $ | 58,049,860 | |||||||||||||
| Three months ended June 30, 2014 | ||||||||||||||||||||||||
| Fishery Development Division (1) | HU Plantation Division (2) | Organic Fertilizer and Bread Grass Division (3) | Cattle Farm Development Division (4) | Corporate and others (5) | Total | |||||||||||||||||||
| COST OF SERVICES | ||||||||||||||||||||||||
| Name of entity | ||||||||||||||||||||||||
| Consulting and service income for development contracts | ||||||||||||||||||||||||
| Capital Award, Inc. ("CA") | $ | 5,131,217 | $ | - | $ | - | $ | - | $ | - | $ | 5,131,217 | ||||||||||||
| Macau Eiji Company Limited ("MEIJI") | - | - | - | - | - | - | ||||||||||||||||||
| Sino Agro Food, Inc. ("SIAF") | - | - | - | - | 1,554,244 | 1,554,244 | ||||||||||||||||||
| $ | 5,131,217 | $ | - | $ | - | $ | - | $ | 1,554,244 | $ | 6,685,461 | |||||||||||||
| F - 21 |
SINO AGRO FOOD, INC.
NOTES TO CONSOLIDATED FINANCIAL STATEMENTS
FOR THE SIX MONTHS ENDED JUNE 30, 2014 AND 2013
3. SEGMENT INFORMATION (CONTINUED)
Further analysis of cost of goods sold and cost of services (Continued):-
| Three months ended June 30, 2013 | ||||||||||||||||||||||||
| Fishery Development Division (1) | HU Plantation Division (2) | Organic Fertilizer and Bread Grass Division (3) | Cattle Farm Development Division (4) | Corporate and others (5) | Total | |||||||||||||||||||
| COST OF GOODS SOLD | ||||||||||||||||||||||||
| Name of entity | ||||||||||||||||||||||||
| Sale of goods | ||||||||||||||||||||||||
| Capital Award, Inc. ("CA") | $ | 8,079,088 | $ | - | $ | - | $ | - | $ | - | $ | 8,079,088 | ||||||||||||
| Jiang Men City Heng Sheng Tai | ||||||||||||||||||||||||
| Agriculture Development Co., Limited ("JHST") | - | 1,260,957 | - | - | - | 1,260,957 | ||||||||||||||||||
| Hunan Shenghua A Power | ||||||||||||||||||||||||
| Agriculture Co., Limited ("HSA") | - | - | 1,585,335 | - | 1,585,335 | |||||||||||||||||||
| Qinghai Sanjiang A Power | ||||||||||||||||||||||||
| Agriculture Co., Limited ("SJAP") | - | - | 9,307,714 | - | 9,307,714 | |||||||||||||||||||
| Qinghai Zhong He Meat Products Co., Limited ("QZH") | - | - | - | - | - | - | ||||||||||||||||||
| Macau Eiji Company Limited ("MEIJI") | - | - | - | 1,660,849 | - | 1,660,849 | ||||||||||||||||||
| Sino Agro Food, Inc. ("SIAF") | - | - | - | - | 4,444,692 | 4,444,692 | ||||||||||||||||||
| $ | 8,079,088 | $ | 1,260,957 | $ | 10,893,049 | $ | 1,660,849 | $ | 4,444,692 | $ | 26,338,635 | |||||||||||||
| Three months ended June 30, 2013 | ||||||||||||||||||||||||
| Fishery Development Division (1) | HU Plantation Division (2) | Organic Fertilizer and Bread Grass Division (3) | Cattle Farm Development Division (4) | Corporate and others (5) | Total | |||||||||||||||||||
| COST OF SERVICES | ||||||||||||||||||||||||
| Name of entity | ||||||||||||||||||||||||
| Consulting and service income for development contracts | ||||||||||||||||||||||||
| Capital Award, Inc. ("CA") | $ | 5,694,307 | $ | - | $ | - | $ | - | $ | - | $ | 5,694,307 | ||||||||||||
| Macau Eiji Company Limited ("MEIJI") | - | - | - | 1,654,843 | - | 1,654,843 | ||||||||||||||||||
| Sino Agro Food, Inc. ("SIAF") | - | - | - | - | 1,322,097 | 1,322,097 | ||||||||||||||||||
| $ | 5,694,307 | $ | - | $ | - | $ | 1,654,843 | $ | 1,322,097 | $ | 8,671,247 | |||||||||||||
| F - 22 |
SINO AGRO FOOD, INC.
NOTES TO CONSOLIDATED FINANCIAL STATEMENTS
FOR THE SIX MONTHS ENDED JUNE 30, 2014 AND 2013
3. SEGMENT INFORMATION (CONTINUED)
Further analysis of cost of goods sold and cost of services (Continued):-
| Six months ended June 30, 2014 | ||||||||||||||||||||||||
| Fishery Development Division (1) | HU Plantation Division (2) | Organic Fertilizer and Bread Grass Division (3) | Cattle Farm Development Division (4) | Corporate and others (5) | Total | |||||||||||||||||||
| COST OF GOODS SOLD | ||||||||||||||||||||||||
| Name of entity | ||||||||||||||||||||||||
| Sale of goods | ||||||||||||||||||||||||
| Capital Award, Inc. ("CA") | $ | - | $ | - | $ | - | $ | - | $ | - | $ | - | ||||||||||||
| Jiang Men City Heng Sheng Tai Agriculture | ||||||||||||||||||||||||
| Development Co., Limited ("JHST") | 38,925,682 | 719,070 | - | - | - | 39,644,752 | ||||||||||||||||||
| Hunan Shenghua A Power | ||||||||||||||||||||||||
| Agriculture Co., Limited ("HSA") | - | - | 5,673,014 | - | - | 5,673,014 | ||||||||||||||||||
| Qinghai Sanjiang A Power | ||||||||||||||||||||||||
| Agriculture Co., Limited ("SJAP") | - | - | 33,281,567 | - | - | 33,281,567 | ||||||||||||||||||
| Qinghai Zhong He Meat Products Co., Limited ("QZH") | - | - | 1,160,279 | - | - | 1,160,279 | ||||||||||||||||||
| Macau Eiji Company Limited ("MEIJI") | - | - | - | 13,975,273 | - | 13,975,273 | ||||||||||||||||||
| Sino Agro Food, Inc. ("SIAF") | - | - | - | - | 20,179,504 | 20,179,504 | ||||||||||||||||||
| $ | 38,925,682 | $ | 719,070 | $ | 40,114,860 | $ | 13,975,273 | $ | 20,179,504 | $ | 113,914,389 | |||||||||||||
| Six months ended June 30, 2014 | ||||||||||||||||||||||||
| Fishery Development Division (1) | HU Plantation Division (2) | Organic Fertilizer and Bread Grass Division (3) | Cattle Farm Development Division (4) | Corporate and others (5) | Total | |||||||||||||||||||
| COST OF SERVICES | ||||||||||||||||||||||||
| Name of entity | ||||||||||||||||||||||||
| Consulting and service income for development contracts | ||||||||||||||||||||||||
| Capital Award, Inc. ("CA") | $ | 11,634,629 | $ | - | $ | - | $ | - | $ | - | $ | 11,634,629 | ||||||||||||
| Macau Eiji Company Limited ("MEIJI") | - | - | - | - | - | - | ||||||||||||||||||
| Sino Agro Food, Inc. ("SIAF") | - | - | - | - | 1,554,244 | 1,554,244 | ||||||||||||||||||
| $ | 11,634,629 | $ | - | $ | - | $ | - | $ | 1,554,244 | $ | 13,188,873 | |||||||||||||
| F - 23 |
SINO AGRO FOOD, INC.
NOTES TO CONSOLIDATED FINANCIAL STATEMENTS
FOR THE SIX MONTHS ENDED JUNE 30, 2014 AND 2013
3. SEGMENT INFORMATION (CONTINUED)
Further analysis of cost of goods sold and cost of services (Continued):-
| Six months ended June 30, 2013 | ||||||||||||||||||||||||
| Fishery Development Division (1) | HU Plantation Division (2) | Organic Fertilizer and Bread Grass Division (3) | Cattle Farm Development Division (4) | Corporate and others (5) | Total | |||||||||||||||||||
| COST OF GOODS SOLD | ||||||||||||||||||||||||
| Name of entity | ||||||||||||||||||||||||
| Sale of goods | ||||||||||||||||||||||||
| Capital Award, Inc. ("CA") | $ | 19,252,489 | $ | - | $ | - | $ | - | $ | - | $ | 19,252,489 | ||||||||||||
| Jiang Men City Heng Sheng Tai | ||||||||||||||||||||||||
| Agriculture Development Co., Limited ("JHST") | - | 1,260,957 | - | - | - | 1,260,957 | ||||||||||||||||||
| Hunan Shenghua A Power | ||||||||||||||||||||||||
| Agriculture Co., Limited ("HSA") | - | - | 2,892,406 | - | - | 2,892,406 | ||||||||||||||||||
| Qinghai Sanjiang A Power | ||||||||||||||||||||||||
| Agriculture Co., Limited ("SJAP") | - | - | 15,873,176 | - | - | 15,873,176 | ||||||||||||||||||
| Qinghai Zhong He Meat Products Co., Limited ("QZH") | - | - | - | - | - | - | ||||||||||||||||||
| Macau Eiji Company Limited ("MEIJI") | - | - | - | 3,394,437 | - | 3,394,437 | ||||||||||||||||||
| Sino Agro Food, Inc. ("SIAF") | - | - | - | - | 9,429,816 | 9,429,816 | ||||||||||||||||||
| $ | 19,252,489 | $ | 1,260,957 | $ | 18,765,582 | $ | 3,394,437 | $ | 9,429,816 | $ | 52,103,281 | |||||||||||||
| Six months ended June 30, 2013 | ||||||||||||||||||||||||
| Fishery Development Division (1) | HU Plantation Division (2) | Organic Fertilizer and Bread Grass Division (3) | Cattle Farm Development Division (4) | Corporate and others (5) | Total | |||||||||||||||||||
| COST OF SERVICES | ||||||||||||||||||||||||
| Name of entity | ||||||||||||||||||||||||
| Consulting and service income for development contracts | ||||||||||||||||||||||||
| Capital Award, Inc. ("CA") | $ | 9,102,403 | $ | - | $ | - | $ | - | $ | - | $ | 9,102,403 | ||||||||||||
| Macau Eiji Company Limited ("MEIJI") | - | - | - | 5,519,294 | - | 5,519,294 | ||||||||||||||||||
| Sino Agro Food, Inc. ("SIAF") | - | - | - | - | 1,869,838 | 1,869,838 | ||||||||||||||||||
| $ | 9,102,403 | $ | - | $ | - | $ | 5,519,294 | $ | 1,869,838 | $ | 16,491,535 | |||||||||||||
| F - 24 |
SINO AGRO FOOD, INC.
NOTES TO CONSOLIDATED FINANCIAL STATEMENTS
FOR THE SIX MONTHS ENDED JUNE 30, 2014 AND 2013
4. INCOME TAXES
United States of America
The Company was incorporated in the State of Nevada, in the United States of America. The Company has no trading operations in United States of America and no US corporate tax has been provided for in the consolidated financial statements of the Company
Undistributed Earnings of Foreign Subsidiaries
The Company intends to use the remaining accumulated and future earnings of foreign subsidiaries to expand operations outside the United States and accordingly, undistributed earnings of foreign subsidiaries are considered to be indefinitely reinvested outside the United States and no provision for U.S. Federal and State income tax or applicable dividend distribution tax has been provided thereon.
The Company fails to file US tax returns for the years ended December 31, 2007 through December 31, 2013 in compliance with US Treasury Internal Revenue Service Code. The Company reviews tax position with the assistance US tax professional and believes that there will be no taxes and no penalties assessed by the Internal Revenue Service in the United States of America. The Company has appointed US tax professional to assist the Company to file these income tax returns and filed the US tax returns for the years ended December 31, 2007 through December 31, 2013 on June 2014.
China
Beginning January 1, 2008, the new Enterprise Income Tax (“EIT”) law replaced the existing laws for Domestic Enterprises (“DE’s”) and Foreign Invested Enterprises (“FIE’s”). The new standard EIT rate of 25% replaced the 33% rate currently applicable to both DE’s and FIE’s. The Company is currently evaluating the impact that the new EIT will have on its financial condition. Beginning January 1, 2008, China unified the corporate income tax rule on foreign invested enterprises and domestic enterprises. The unified corporate income tax rate is 25%.
Under new tax legislation in China beginning in January 2008, the agriculture, dairy and fishery sectors are exempt from enterprise income taxes.
No EIT has been provided in the financial statements since SIAF, CA, JHST, JHMC, JFD, HSA, QZH and SJAP are exempt from EIT for the three months ended June 30, 2014 and 2013 and for the six months ended June 30, 2014 and 2013 as they are within the agriculture, dairy and fishery sectors.
Belize
CA, CS and CH are international business companies incorporated in Belize, and are exempt from corporate tax in Belize.
Hong Kong
No Hong Kong profits tax has been provided in the consolidated financial statements, since TRW did not earn any assessable profits arising in Hong Kong for the three months ended June 30, 2014 and 2013 and for the six months ended June 30, 2014 and 2013.
Macau
No Macau Corporate income tax has been provided in the consolidated financial statements since APWAM and MEIJI did not earn any assessable profits for the three months ended June 30, 2014 and 2013 and for the six months ended June 30, 2014 and 2013.
Sweden
No Sweden Corporate income tax has been provided in the consolidated financial statements since SAFS incurred a tax loss for the three months ended June 30, 2014 and for the six months ended June 30, 2014 and 2013.
No deferred tax assets and liabilities are of June 30, 2014 and December 31, 2013 since there was no difference between the financial statements carrying amounts and the tax bases of assets and liabilities using enacted tax rates in effect in the period in which the differences are expected to reverse.
| F - 25 |
SINO AGRO FOOD, INC.
NOTES TO CONSOLIDATED FINANCIAL STATEMENTS
FOR THE SIX MONTHS ENDED JUNE 30, 2014 AND 2013
4. INCOME TAXES (CONTINUED)
Provision for income taxes is as follows:
| Three months ended | Three months ended | Six months ended | Six months ended | |||||||||||||
| June 30, 2014 | June 30, 2013 | June 30, 2014 | June 30, 2013 | |||||||||||||
| SIAF | $ | - | $ | - | $ | - | $ | - | ||||||||
| SAFS | - | - | - | - | ||||||||||||
| TRW | - | - | - | - | ||||||||||||
| MEIJI and APWAM | - | - | - | - | ||||||||||||
| JHST, JFD, JHMC, SJAP, QZH and HSA | - | - | - | - | ||||||||||||
| $ | - | $ | - | $ | - | $ | - |
The Company did not recognize any interest or penalties related to unrecognized tax benefits for the six months ended June 30,, 2014 and 2013. The Company had no uncertain positions that would necessitate recording of tax related liability. The Company is subject to examination by the respective tax authorities.
5. CASH AND CASH EQUIVALENTS
| June 30, 2014 | December 31, 2013 | |||||||
| Cash and bank balances | $ | 3,631,566 | $ | 1,327,274 | ||||
6. INVENTORIES
As of June 30, 2014, inventories are as follows:
| June 30, 2014 | December 31, 2013 | |||||||
| Sleepy cods, prawns, eels and marble goble | $ | 3,544,935 | $ | 1,761,111 | ||||
| Bread grass | 374,773 | 580,955 | ||||||
| Beef cattle | 7,827,427 | 1,951,962 | ||||||
| Organic fertilizer | 1,531,096 | 895,670 | ||||||
| Forage for cattle and consumable | 2,425,543 | 684,979 | ||||||
| Raw materials for bread grass and organic fertilizer | 9,533,570 | 855,493 | ||||||
| Immature seeds | 700,474 | 698,704 | ||||||
| Harvested HU plantation | - | 719,329 | ||||||
| $ | 25,937,818 | $ | 8,148,203 | |||||
| F - 26 |
SINO AGRO FOOD, INC.
NOTES TO CONSOLIDATED FINANCIAL STATEMENTS
FOR THE SIX MONTHS ENDED JUNE 30, 2014 AND 2013
7. DEPOSITS AND PREPAID EXPENSES
| June 30, 2014 | December 31, 2013 | |||||||
| Deposits for | ||||||||
| - purchases of equipment | $ | 4,372,776 | $ | 4,886,048 | ||||
| - acquisition of land use rights | 7,826,508 | 7,826,508 | ||||||
| - inventories purchases and miscellaneous # | 3,899,435 | 9,771,383 | ||||||
| - aquaculture contract | 11,043,090 | - | ||||||
| - building materials | 877,598 | 1,281,935 | ||||||
| - proprietary technologies | - | 4,404,210 | ||||||
| - construction in progress | 23,021,316 | 23,021,316 | ||||||
| Shares issued for employee compensation and overseas professional fee | 1,053,568 | 100,308 | ||||||
| Temporary deposits paid to entities for eqity investments in future | ||||||||
| Sino Joint Venture companies (Note 1) | 41,109,708 | 41,109,708 | ||||||
| $ | 93,203,999 | $ | 92,401,416 | |||||
| Note (1) | |||||||||||||||||
| Intended | |||||||||||||||||
| unincorporated | |||||||||||||||||
| investee | Project engaged | June 30, 2014 | December 31, 2013 | ||||||||||||||
| A | Trade centre | * | $ | 4,086,941 | $ | 4,086,941 | |||||||||||
| A | Sea food centre | * | 1,032,914 | 1,032,914 | |||||||||||||
| B | Fish Farm 2 Gao Qiqiang Aguaculture | * | 6,000,000 | 6,000,000 | |||||||||||||
| C | Prawn farm 1 | * | 14,554,578 | 14,554,578 | |||||||||||||
| D | Prawn farm 2 | * | 9,877,218 | 9,877,218 | |||||||||||||
| E | Cattle farm 2 | * | 5,558,057 | 5,558,057 | |||||||||||||
| $ | 41,109,708 | $ | 41,109,708 | ||||||||||||||
The Company made temporary deposits paid to entities for equity investments in future Sino Joint Venture companies (“SJVCs”)engaged in projects development of trade and seafood centres, fish, prawns and cattle farms. Such temporary deposits represented as deposits of the respective consideration required for the purchase of equity stakes of respective future SJVCs.The amounts were classified as temporary because legal procedures of formation of SJVCs have not yet been completed. As of December 31 2013, the percentages of equity stakes of SFJVCs A (trade and seafood centres), B ( fish farm 1 Gao Qiqiang Aquaculture Farm ), C (prawn farm 1), D (pawn farm 2) and E (cattle farm 2) are not yet dertermined, 23%, 23%, 56% and 35% respectively.
* The above amounts were subject to conversion to an additional equity investment in the investees upon the completion of legal procedures of formation of SJVCs.
# Miscellaneous represents the value of the shares of the Company held by the custodian for convertible notes, rental and utility deposits, and deposits for sundries purchases and sundries prepaid expenses.
| 8. | ACCOUNTS RECEIVABLE |
| The Company has performed an analysis on all of its accounts receivable and determined that all amounts are collectible by the Company. As such, all accounts receivable are reflected as a current asset and no allowance for bad debt has been recorded as of June 30, 2014 and December 31, 2013. Bad debts written off for the three months ended and the six months ended June 30, 2014 and 2013 are $0. |
| Aging analysis of accounts receivable is as follows: |
| June 30, 2014 | December 31, 2013 | |||||||
| 0 - 30 days | $ | 66,756,218 | $ | 20,864,404 | ||||
| 31 - 90 days | 24,432,375 | 28,960,582 | ||||||
| 91 - 120 days | 9,711,157 | 23,941,294 | ||||||
| over 120 days and less than 1 year | 16,284,461 | 8,291,662 | ||||||
| over 1 year | - | - | ||||||
| $ | 117,184,211 | $ | 82,057,942 | |||||
| F - 27 |
SINO AGRO FOOD, INC.
NOTES TO CONSOLIDATED FINANCIAL STATEMENTS
FOR THE SIX MONTHS ENDED JUNE 30, 2014 AND 2013
| 9. | OTHER RECEIVABLES |
| June 30, 2014 | December 31, 2013 | |||||||
| Advanced to employees | $ | 224,700 | $ | 109,278 | ||||
| Advanced to suppliers | 2 ,451,353 | 3,673,493 | ||||||
| Advanced to subcontractors and suppliers relating to Zhongshan Prawn Farm | 8,350,000 | - | ||||||
| $ | 11,026,053 | $ | 3,782,771 | |||||
Advanced to subcontractors and supplies relating to Zhongshan Prawn Farm is unsecured, interest free and repayable within two years.
| 10. | PLANT AND EQUIPMENT |
| June 30, 2014 | December 31, 2013 | |||||||
| Plant and machinery | $ | 5,343,903 | $ | 5,263,933 | ||||
| Structure and leasehold improvements | 38,012,265 | 36,308,860 | ||||||
| Mature seeds and herbage cultivation | 9,234,439 | 6,294,372 | ||||||
| Furniture and equipment | 393,412 | 391,608 | ||||||
| Motor vehicles | 765,858 | 765,858 | ||||||
| 53,749,877 | 49,024,631 | |||||||
| Less: Accumulated depreciation | (3,668,846 | ) | (2,537,573 | ) | ||||
| Net carrying amount | $ | 50,081,031 | $ | 46,487,058 | ||||
Depreciation expense was $596,470 and $331,596 for the three months ended June 30, 2014 and 2013, respectively. Depreciation expense was $1,131,273 and $638,671 for the six months ended June 30, 2014 and 2013, respectively.
| 11. | CONSTRUCTION IN PROGRESS |
| June 30, 2014 | December 31, 2013 | |||||||
| Construction in progress | ||||||||
| - Office, warehouse and organic fertilizer plant in HSA | $ | 26,759,971 | $ | 22,761,164 | ||||
| - Organic fertilizer and bread grass production plant and office building | 7,274,004 | 8,600,187 | ||||||
| - Oven room、road for production of dried flowers | 276,288 | - | ||||||
| - Rangeland for beef cattle and office building | 36,240,390 | 26,054,582 | ||||||
| - Fish pond | 1,844,454 | 1,718,799 | ||||||
| $ | 72,395,107 | $ | 59,134,732 | |||||
| 12. | LAND USE RIGHTS |
| Private ownership of agricultural land is not permitted in the PRC. Instead, the Company has leased six lots of land. The cost of the first lot of land use rights acquired in 2007 in Guangdong Province was $6,408,289 and consists of 180.23 acres with the lease expiring in 2067. The cost of the second lot of land use rights acquired in 2008 in Guangdong Province was $764,128, which consists of 31.84 acres with the lease expiring in 2068. The cost of the third lot of land use rights acquired in 2011 was $12,040,571, which consists of 93.64 acres in Guangdong Province, with the lease expiring in 2037. The cost of the fourth lot of land use rights acquired in 2011 was $35,405,750 which consisted of 287.21 acres in the Hunan Province, PRC and the leases expire in 2051, 2054 and 2071. The cost of the fifth lot of land use rights acquired in 2012 was $528,240 which consisted of 21.09 acres in Qinghai Province, PRC and the lease expires in 2051. The cost of the sixth lot of land use rights acquired in 2013 was $489,904 which consisted of 6.27 acres in Guangdong Province, the PRC and the lease expires in 2023. |
| F - 28 |
SINO AGRO FOOD, INC.
NOTES TO CONSOLIDATED FINANCIAL STATEMENTS
FOR THE SIX MONTHS ENDED JUNE 30, 2014 AND 2013
| 12. | LAND USE RIGHTS (CONTINUED) |
| June 30, 2014 | December 31, 2013 | |||||||
| Cost | $ | 65,118,060 | $ | 65,192,615 | ||||
| Less: Accumulated amortization | (5,246,820 | ) | (4,486,786 | ) | ||||
| Net carrying amount | $ | 59,871,240 | $ | 60,705,829 | ||||
| Expiry date | Location | Amount | ||||||
| Balance @1.1.2013 | $ | 58,630,950 | ||||||
| Additons: | ||||||||
| 2013 | 2023 | Enping city, Guangdong Province, the P.R.C. | 489,904 | |||||
| 2013 | Land improvement cost incurred | 3,914,275 | ||||||
| Exchange difference | 2,157,486 | |||||||
| Balance @12.31.2013 | $ | 65,192,615 | ||||||
| Exchange difference | (74,555 | ) | ||||||
Balance @6.30.2014 | $ | 65,118,060 | ||||||
| Land use rights are amortized on the straight-line basis over their respective lease periods. The lease period of agriculture land is 30 to 60 years. Amortization of land use rights was $397,510 and $539,677 for the three months ended June 30, 2014 and 2013, respectively. Amortization of land use rights was $760,034 and $768,337 for the six months ended June 30, 2014 and 2013, respectively. |
| 13. | GOODWILL |
| Goodwill represents the fair value of the assets acquired the acquisitions over the cost of the assets acquired. It is stated at cost less accumulated impairment losses. Management tests goodwill for impairment on an annual basis or when impairment indicators arise. In these instances, the Company recognizes an impairment loss when it is probable that the estimated cash flows are less than the carrying value of the assets. To date, no such impairment loss has been recorded. |
| June 30, 2014 | December 31, 2013 | |||||||
| Goodwill from acquisition | $ | 724,940 | $ | 724,940 | ||||
| Less: Accumulated impairment losses | - | - | ||||||
| Net carrying amount | $ | 724,940 | $ | 724,940 | ||||
| 14. | PROPRIETARY TECHNOLOGIES |
| By an agreement dated November 12, 2008, TRW acquired an enzyme technology master license, registered under a Chinese patent, for the manufacturing of livestock feed and bioorganic fertilizer and its related labels for $8,000,000. On March 6, 2012, MEIJI acquired an aromatic-feed formula technology for the production of aromatic cattle for $1,500,000. On October 1, 2013, SIAF was granted a license to exploit sleep cod breeding technology license for to grow out sleep cod for $2,270,968 for 50 years. SJAP booked bacterial cellulose technology license and related trademark for $2,119,075 and amortized expenditures for 25 years starting from January 1, 2014. |
| F - 29 |
SINO AGRO FOOD, INC.
NOTES TO CONSOLIDATED FINANCIAL STATEMENTS
FOR THE SIX MONTHS ENDED JUNE 30, 2014 AND 2013
| 14. | PROPRIETARY TECHNOLOGIES (CONTINUED) |
| June 30, 2014 | December 31, 2013 | |||||||
| Cost | $ | 13,883,015 | $ | 13,896,168 | ||||
| Less: Accumulated amortization | (2,111,523 | ) | (1,814,698 | ) | ||||
| Net carrying amount | $ | 11,771,492 | $ | 12,081,470 | ||||
| Amortization of proprietary technologies was $150,269 and $98,750 for the three months ended June 30, 2014 and 2013, respectively. Amortization of proprietary technologies was $296,825 and $207,957 for the six months ended June 30, 2014 and 2013, respectively.No impairment of proprietary technologies has been identified for the three months ended and for the six months ended June 30, 2014 and 2013. |
| 15. | VARIABLE INTEREST ENTITY |
| On September 28, 2009, APWAM acquired the PMH’s 45% equity interest in the Sino-Foreign joint venture company, Qinghai Sanjiang A Power Agriculture Co. Limited (“SJAP”), which was incorporated in the PRC. Up to June 30, 2014, the Company invested $2,251,359 in this joint venture. SJAP is engaged in its business of the manufacturing of organic fertilizer, livestock feed, and beef cattle and plantation of crops and pastures. |
| Continuous assessment of the VIE relationship with SJAP |
| The Company may also have a controlling financial interest in an entity through an arrangement that does not involve voting interests, such as a VIE. The Company evaluates entities deemed to be VIE’s using a risk and reward model to determine whether to consolidate. A VIE is an entity (1) that has total equity at risk that is not sufficient to finance its activities without additional subordinated financial support from other entities, (2) where the group of equity holders does not have the power to direct the activities of the entity that most significantly impact the entity’s economic performance, or the obligation to absorb the entity’s expected losses or the right to receive the entity’s expected residual returns, or both, or (3) where the voting rights of some investors are not proportional to their obligations to absorb the expected losses of the entity, their rights to receive the expected residual returns of the entity, or both, and substantially all of the entity’s activities either involve or are conducted on behalf of an investor that has disproportionately fewer voting rights. |
| The Company also quantitatively and qualitatively examined if SJAP is considered a VIE. Qualitative analyses considered the extent to which the nature of its variable interest exposed the Company to losses. For quantitative analyses, the Company also used internal cash flow models to determine if SJAP was a VIE and, if so, whether the Company was the primary beneficiary. The projection of these cash flows and probabilities thereof requires significant managerial judgment because of the inherent limitations that relate to the use of historical data for the projection of future events. On June 30, 2014, the Company evaluated the above VIE testing results and concluded that the Company is the primary beneficiary of SJAP’s expected losses or residual returns and that SJAP qualifies as a VIE of the Company. As result, the Company has consolidated SJAP as a VIE. |
| The reasons for the changes are as follows: |
| •Originally, the board of directors of SJAP consisted of 7 members; 3 appointees from Qinghai Sanjiang (one stockholder), 1 from Garwor (one stockholder), and 3 from the Company, such that the Company did not have majority interest represented on the board of directors of SJAP. |
| •On May 7, 2010, Qinghai Sanjiang sold and transferred its equity interest in SJAP to Garwor. The State Administration for Industry and Commerce of Xining City Government of the P.R.C. approved the sale and transfer. |
| Consequently Garwor and the Company agreed that the new board of directors of SJAP would consist of 3 members; 1 appointee from Garwor and 2 appointees from the Company, such that the Company now had a majority interest in the board of directors of SJAP. Also, and in accordance with the Company’s Sino Joint Venture Agreement, the Company’s management appointed the chief financial officer of SJAP. As a result, the financial statements of SJAP were included in the consolidated financial statements of the Company. |
| F - 30 |
SINO AGRO FOOD, INC.
NOTES TO CONSOLIDATED FINANCIAL STATEMENTS
FOR THE SIX MONTHS ENDED JUNE 30, 2014 AND 2013
| 15. | VARIABLE INTEREST ENTITY (CONTINUED) |
| SJAP formed Qinghai Zhong He Meat Products Co., Limited (“QZH”) , with SJAP would owning 100% equity interest. Up to June 30, 2014, the SJAP’s total investment in QZH was $487,805. QZH is engaged in its business of the slaughter of cattle. |
| Continuous assessment of the VIE relationship with QZH |
| The Company may also have a controlling financial interest in an entity through an arrangement that does not involve voting interests, such as a VIE. The Company evaluates entities deemed to be VIE’s using a risk and reward model to determine whether to consolidate. A VIE is an entity (1) that has total equity at risk that is not sufficient to finance its activities without additional subordinated financial support from other entities, (2) where the group of equity holders does not have the power to direct the activities of the entity that most significantly impact the entity’s economic performance, or the obligation to absorb the entity’s expected losses or the right to receive the entity’s expected residual returns, or both, or (3) where the voting rights of some investors are not proportional to their obligations to absorb the expected losses of the entity, their rights to receive the expected residual returns of the entity, or both, and substantially all of the entity’s activities either involve or are conducted on behalf of an investor that has disproportionately fewer voting rights. |
| The Company also quantitatively and qualitatively examined if QZH is considered a VIE. Qualitative analyses considered the extent to which the nature of its variable interest exposed the Company to losses. For quantitative analyses, the Company also used internal cash flow models to determine if QZH was a VIE and, if so, whether the Company was the primary beneficiary. The projection of these cash flows and probabilities thereof requires significant managerial judgment because of the inherent limitations that relate to the use of historical data for the projection of future events. On June 30, 2014, the Company evaluated the above VIE testing results and concluded that the Company is the primary beneficiary of QZH’s expected losses or residual returns and that QZH qualifies as a VIE of the Company. As result, the Company has consolidated QZH as a VIE. |
| SJAP is sole stockholder of QZH and SJAP appointed sole director of QZH. Consequently, the Company indirectly control directorship of QZH, such that the Company now had a majority interest in the directorship of QZH. Also, and in accordance with the Company’s Sino Joint Venture Agreement, the Company’s management appointed the chief financial officer of QZH. As a result, the financial statements of QZH were included in the consolidated financial statements of the Company. |
| 16. | LICENSE RIGHTS |
| Pursuant to an agreement dated August 1, 2006 between Infinity Environmental Group Limited (“Infinity”) and the Company, the Company was granted an A Power Technology License with the condition that the Company was required to pay the license fee covering 500 units of APM as performance payment to Infinity on or before July 31, 2008. This license allows the Company to develop service, manage and supply A Power Technology Farms in the P.R.C. using the A Power Technology, but subject to a condition that the Company is required to pay a license fee to Infinity once the Company has sold the license to its customer. Under the said license, the Company has the right to authorize developers and/or joint venture partners to develop A Power Technology Farms in the P.R.C. Infinity is a company incorporated in Australia. An impairment loss made for the three months ended June 30, 2014 and 2013 are $0 and allowance for accumulated impairment losses has been recorded as of June 30, 2014 and December 31, 2013 are $1. |
| 17. | OTHER PAYABLES |
| June 30, 2014 | December 31, 2013 | |||||||
| Due to third parties | $ | 7,310,440 | $ | 4,715,543 | ||||
| Promissory notes issued to third parties | 1,944,125 | 3,625,000 | ||||||
| Due to local government | 2,406,143 | 2,428,243 | ||||||
| $ | 11,660,708 | $ | 10,768,786 | |||||
| Due to third parties are unsecured, interest free and have no fixed terms of repayment. |
| F - 31 |
SINO AGRO FOOD, INC.
NOTES TO CONSOLIDATED FINANCIAL STATEMENTS
FOR THE SIX MONTHS ENDED JUNE 30, 2014 AND 2013
| 18. | CONSTRUCTION CONTRACT |
| (i) Costs and estimated earnings in excess of billings on uncompleted contract |
| June 30, 2014 | December 31, 2013 | |||||||
| Costs | $ | 10,375,203 | $ | 3,527,975 | ||||
| Estimated earnings | 12,411,294 | 8,538,930 | ||||||
| Less: Billings | (22,029,194 | ) | (11,403,609 | ) | ||||
| Costs and estimated earnings in excess of billings on uncompleted contract | $ | 757,303 | $ | 663,296 | ||||
| (ii) Billings in excess of costs and estimated earnings on uncompleted contracts |
| June 30, 2014 | December 31, 2013 | |||||||
| Billings | $ | 24,651,272 | $ | 8,406,900 | ||||
| Less: Costs | (8,521,055 | ) | (2,179,410 | ) | ||||
| Estimated earnings | (12,608,796 | ) | (3,080,534 | ) | ||||
| Billing in excess of costs and estimated earnings on uncompleted contract | $ | 3,521,421 | $ | 3,146,956 | ||||
| (iii) Overall |
| June 30, 2014 | December 31, 2013 | |||||||
| Billings | $ | 46,680,466 | $ | 19,810,509 | ||||
| Less: Costs | (18,896,258 | ) | (5,707,385 | ) | ||||
| Estimated earnings | (25,020,090 | ) | (11,619,464 | ) | ||||
| Billing in excess of costs and estimated earnings on uncompleted contract | $ | 2,764,118 | $ | 2,483,660 | ||||
| 19. | DIVIDENDS PAYABLE AND DEFFERRED DIVIDEND PAYABLE |
The payments of the F series shares has not been effected due to the F series shares were not issued physically but in book entry form and created complication that will need to be resolved before payments can be effected. In this respect, the Company expected to resolve the matter and the effect payment on or before the end of the year. |
| 20. | BORROWINGS |
|
| There are no provisions in the Company’s bank borrowings and long term debts that would accelerate repayment of debt as a result of a change in credit ratings or a material adverse change in the Company’s business. Under certain agreements, the Company has the option to retire debt prior to maturity, either at par or at a premium over par. |
| F - 32 |
SINO AGRO FOOD, INC.
NOTES TO CONSOLIDATED FINANCIAL STATEMENTS
FOR THE SIX MONTHS ENDED JUNE 30, 2014 AND 2013
| 20. | BORROWINGS (CONTINUED) |
Short term bank loan
| Interest rate | Term | June 30, 2014 | December 31, 2013 | |||||||||
| Agricultural Development | 6% | August 30, 2013 - August 29, 2014 | ||||||||||
| Bank of China | (August 30, 2012 - August 29, 2013) | |||||||||||
| Huangyuan County Branch, | ||||||||||||
| Xining , Qinghai Province, | $ | 4,063,059 | ^* | $4,100,377 | ^* | |||||||
| the P.R.C. |
Long term debts
| Name of lender | Interest rate | Term | June 30, 2014 | December 31, 2013 | ||||||||
| Gan Guo Village Committee | 12.22% | June 2012 - June 2017 | ||||||||||
| Bo Huang Town | ||||||||||||
| Huangyuan County, | ||||||||||||
| Xining City, | ||||||||||||
| Qinghai Province, the P.R.C. | $ | 178,774 | $ | 180,417 | ||||||||
| Agricultural Development | 6.40% | January 3, 2014 - December 17, 2018 | ||||||||||
| Bank of China | ||||||||||||
| Huangyuan County Branch, | ||||||||||||
| Xining , Qinghai Province, | $ 2,437,836 | ^*# | - | |||||||||
| the P.R.C. | ||||||||||||
| $ | 2,616,610 | $ | 180,417 | |||||||||
^ personal and corporate guaranteed by third parties.
*secured by land use rights with net carrying amount of $503,842 (12.31.2013: $515,026).
# repayable $325,092, $650,184, $650,184 and $812,732 in 2015, 2016, 2017 and 2018, respectively.
| F - 33 |
SINO AGRO FOOD, INC.
NOTES TO CONSOLIDATED FINANCIAL STATEMENTS
FOR THE SIX MONTHS ENDED JUNE 30, 2014 AND 2013
| 21. | BONDS PAYABLE |
| On July 1, 2013 , the Company offered a maximum of $21,000,000 of units (“Units”) for an aggregate of 840 Units; each Unit consisting of a $25,000 principal amount promissory note made by the Subscription Agreement and Confidential Private Placement Memorandum with maturity date two years from the Initial Closing Date of the Offering September 30, 2013. The interest rate of 5% is paid annually. Commissions, issue cost and discounts are amortized over 2 years from October 1, 2013. |
| Terms of the bonds are as follows: |
| Issue size: | $16,800,000 | |
| Number of units offered: | 840 units | |
| Number of units issued: | 69 units | |
| Principal value per unit: | $25,000 per unit | |
| Net payable value /bond: | $20,000 per unit | |
| Discounted value/bond: | $5,000 paid to bond holder | |
| Maturity date: | 2 years (September 30, 2015) | |
| Participating interest: | 5% per annum | |
| Effective yield: | 11.80% per annum | |
| June 30, 2014 | December 31, 2013 | |||||||
| 5% Participating zeron coupon bonds | ||||||||
| repayable on September 30, 2015 | $ | 1,725,000 | $ | 1,725,000 | ||||
| The Company calculated professional service compensation of $400,000 in respect of bond issue, and recognized $50,000 and $0 for the three months ended June 30, 2014 and 2013 and $100,000 and $0 for the six months ended June 30, 2014 and 2013. As of June 30, 2014, the deferred compensation balance was $200,000 and the deferred compensation balance of $200,000 was to be amortized over 15 months beginning on July 1, 2014. |
| 22. | SHAREHOLDERS’ EQUITY |
| The Group’s share capital as of June 30, 2014 and December 31, 2013 shown on the consolidated balance sheet represents the aggregate nominal value of the share capital of the Company as at that date. |
| On March 22, 2010, the Company designated 100 shares of Series A preferred stock at a par value per share of $0.001. As of the same date, 100 shares of Series A preferred stock were issued at $1 per share for cash in the amount of $100. |
| The Series A preferred stock: |
| (i) does not pay a dividend; |
| (ii) votes together with the shares of Common Stock of the Corporation as a single class and, regardless of the number of shares of Series A Preferred Stock outstanding and as long as at least one of such shares of Series A Preferred Stock is outstanding, shall represent eighty percent (80%) of all votes entitled to be voted at any annual or special meeting of shareholders of the Corporation or action by written consent of shareholders. Each outstanding share of the Series A Preferred Stock shall represent its proportionate share of the 80%, which is allocated to the outstanding shares of Series A Preferred Stock; and |
| (iii) ranks senior to common stockholders, holders of Series B convertible preferred stockholders and any other stockholders on liquidation. |
| The Company has designated 100 shares of Series A preferred stock with 100 shares issued and outstanding as of June 30, 2014 and December 31, 2013, respectively. |
| F - 34 |
SINO AGRO FOOD, INC.
NOTES TO CONSOLIDATED FINANCIAL STATEMENTS
FOR THE SIX MONTHS ENDED JUNE 30, 2014 AND 2013
22. SHAREHOLDERS’ EQUITY (CONTINUED)
| The Series B convertible preferred stock: |
| On March 22, 2010, the Company designated 7,000,000 shares of Series B convertible preferred stock at a par value per share of $0.001. The Series B convertible preferred stock is redeemable, the stockholders are not entitled to receive any dividend and voting rights but rank senior over common stockholders on liquidation, and can convert to common stock on a one for one basis at any time. On June 26, 2010, 7,000,000 shares of common stock were surrendered for cancellation and the Company issued 7,000,000 shares of Series B convertible preferred stock at $1.00 per share. Pursuant to share exchange agreement made as of December 22, 2012, between the Company and a stockholder, Capital Adventure Inc., a holder of 3,000,000 shares of common shares, with the consent of Board of Directors, to exchange for 3,000,000 shares of Series B convertible preferred stock on one-for-one basis. As of December 23, 2012, 3,000,000 shares of Series B convertible preferred stock were issued to Capital Adventure Inc., for the exchange of its holding of 3,000,000 shares of common stocks. As of December 31, 2012, 3,000,000 shares of common stocks were still not returned to the Company. On March 27, 2013, 3,000,000 shares of Series B convertible preferred stock were cancelled. |
| There were 7,000,000 shares of Series B convertible preferred stock issued and outstanding as of June 30 , 2014 and December 31, 2013, respectively. |
| The Series F Non-Convertible preferred stock: |
| On August 1, 2012, the Company designated 1,000,000 shares of Series F Non-Convertible Preferred Stock with a par value per share of $0.001.. |
| The Series F Non-Convertible Preferred Stock: |
| (i) | is not redeemable; |
| (ii) | except for (iv), with respect to dividend rights, rights on liquidation, winding up and dissolution, rank junior and subordinate to (a) all classes of Common Stock,(b) all other classes of Preferred Stock and (c) any class or series of capital securities of the Company. |
| (iii) | except for (iv), shall not entitled to receive any dividend; and |
| (iv) | on May 30, 2014, the holders of record of shares of Series F Non-Convertible Preferred Stock shall be entitled to a coupon payment directly from the Company at the redemption rate of $3.40 per share for every 100 shares of Common Stock. Upon redemption, the Record Holder shall no longer own any shares of Series F that have been redeemed, and all such redeemed shares shall disappear and no longer exist on the books and records of the Company; redeemed shares of Series F which no longer exist upon redemption shall thereafter be counted toward the authorized but unissued “blank check” preferred stock of the Company. |
| On August 22, 2012, the Company’s Board of Directors declared that the Company’s stockholders were entitled to receive one share of restricted Series F Non-convertible Preferred Stock for every 100 shares of Common Stock owned by the stockholders as of September 28, 2012, with lesser or greater amounts being rounded up to the nearest 100 shares of Common Stock for purpose of the computing the dividend. The holders of record of shares of Series F Non - Convertible Preferred Stock shall be entitled to a coupon payment directly from the Company at the redemption rate of $3.40 per share and be payable on May 30, 2014. During the year ended December 31, 2012 , the transfer agent of the Company recorded 924,180 shares of Series F Non-Convertible preferred stock on the account. On October 1, 2012, the Company did not issue physical shares but only issued coupons to notify respective shareholders on that date. These F shares of 924,180 shares, were based on numbers of shares of Common Stock as of September 28, 2012 of 91,931,287 shares, calculated at one share of Series F Non-Convertible preferred stock for every 100 shares of Common Stock with decimal number of shares being rounded up to one. |
| As a result, total issued and outstanding of Series F Non-Convertible Preferred Stock as of June 30, 2014 and December 31, 2013 are 0 shares. |
| Common Stock: |
| F - 35 |
SINO AGRO FOOD, INC.
NOTES TO CONSOLIDATED FINANCIAL STATEMENTS
FOR THE SIX MONTHS ENDED JUNE 30, 2014 AND 2013
| 22. | SHAREHOLDERS’ EQUITY (CONTINUED) |
| On December 5, 2012, the Company obtained stockholders consent for the approval of an amendment to our articles of incorporation to increase our authorized shares of common stock, no par value (the “Common Stock”), from 100,000,000 to 130,000,000. The board of directors believes that the increase in our authorized Common Stock will provide us with greater flexibility with respect to our capital structure for purposes including additional equity financings and stock based acquisitions. The certificate of amendment effectuating the vote by the shareholders was filed with the State of Nevada on January 24, 2013. |
| On March 28, 2013, the Company filed a prospectus related to a public offering of Common Stock of the Company for maximum aggregate gross proceeds of $26,250,000 within a period not to exceed 180 days from the date of this prospectus and no Common stock was offered to the public in respect of this public offering. . |
| On October 4, 2013, the Company obtained stockholder consent for the approval of an amendment to our articles of incorporation to increase our authorized shares of common stock, no par value (the “Common Stock”), from 130,000,000 to 170,000,000. The board of directors believes that the increase in our authorized Common Stock will provide us with greater flexibility with respect to our capital structure for purposes including additional equity financings and stock based acquisitions. The certificate of amendment effectuating the vote by the shareholders was filed with the State of Nevada on November 1, 2013. |
| During the year ended December 31, 2013, the Company issued 37,299,984 shares of common stock for $18,030,632 at values ranging from $0.37 to $0.62 per share to settle debts due to third parties. The Company executed several agreements with third parties to settle debts by issuance of the Company’s common stock. The shares issued by the Company were valued at the trading price of the stock on the date the shares were issued. Any excess of the fair value of the shares over the carrying cost of the debt has been reported as a gain on the extinguishment of debts of $1,318,947 and $1,666,386 has been credited to consolidated statements of income as other income for the years ended December 31, 2013 and 2012, respectively; and (ii) 297,209 shares of common stock valued to employees at fair value of $0.45 per share for $133,744 for employee compensation. The fair value of the common stock issued was determined by using the trading price of the Company’s common stock on the date of issuance of $0.45 per share. |
| During the three months ended June 30, 2014, the Company issued 8,232,618 shares of common stock for $3,555,875 at values ranging from $0.40 to $0.45 per share to settle debts due to third parties. The Company executed several agreements with third parties to settle debts by issuance of the Company’s common stock. The shares issued by the Company were valued at the trading price of the stock on the date the shares were issued. Any excess of the fair value of the shares over the carrying cost of the debt has been reported as a gain on the extinguishment of debts of $198,373 and $498,025 has been credited to consolidated statements of income as other income for the three months ended June 30, 2014 and 2013, respectively. |
| During the six months ended June 30, 2014, the Company issued (i) 20,142,617 shares of common stock for $9,575,000 at values ranging from $0.40 to $0.55 per share to settle debts due to third parties. The Company executed several agreements with third parties to settle debts by issuance of the Company’s common stock. The shares issued by the Company were valued at the trading price of the stock on the date the shares were issued. Any excess of the fair value of the shares over the carrying cost of the debt has been reported as a gain on the extinguishment of debts of $241,393 and $1,051,013 has been credited to consolidated statements of income as other income for the six months ended June 30, 2014 and 2013, respectively; (ii) 1,292,620 shares of common stock valued to employees at fair value of $0.43 per share for $555,827 for employee compensation. The fair value of the common stock issued was determined by using the trading price of the Company’s common stock on the date of issuance of $0.43 per share; and (iii) 1,160,764 shares of common stock valued to professionals at fair value of $0.40 per share for $464,306 for service compensation. The fair value of the common stock issued was determined by using the trading price of the Company’s common stock on the date of issuance of $0.40 per share. |
| The Company has common stock of 160,198,044 and 137,602,043 shares issued and outstanding as of June 30, 2014 and December 31, 2013, respectively. |
| F - 36 |
SINO AGRO FOOD, INC.
NOTES TO CONSOLIDATED FINANCIAL STATEMENTS
FOR THE SIX MONTHS ENDED JUNE 30, 2014 AND 2013
| 23. | OBLIGATION UNDER OPERATING LEASES |
| The Company leases (i) 2,178 square feet of agriculture space used for offices for a monthly rent of $634 in Enping City, Guangdong Province, PRC, its lease expiring on March 31, 2017; (ii) 5,081 square feet of office space in Guangzhou City, Guangdong Province, PRC for a monthly rent of $12,733, its lease expiring on July 8, 2016; and (iii) 1,555 square feet of staff quarters in Linli District, Hunan Province, PRC for a monthly rent of $163, its lease expiring on May 1, 2016. |
Lease expense was $40,591 and $38,002 for the three months ended June ended June 30, 2014 and 2013, respectively. Lease expense was $78,118 and $75,052 for the six months ended June 30, 2014 and 2013, respectively.The future minimum lease payments as of June 30, 2014, are as follows:
| $ | ||||
| Year ended December 31, 2014 | 67,634 | |||
| Year ended December 31, 2015 | 162,364 | |||
| Thereafter | 86,561 | |||
| 316,559 |
| 24. | STOCK BASED COMPENSATION |
On July 2, 2013, the Company issued employees a total of 297,209 shares of common stock valued at fair value of range from $0.45 per share for services rendered to the Company. The fair value of the common stock issued was determined by using the trading price of the Company’s common stock on the date of issuance of $0.45 per share.
On April 25, 2014, the Company issued employees a total of 1,292,620 shares of common stock valued at fair value of range from $0.43 per share for services rendered to the Company. The fair values of the common stock issued were determined by using the trading price of the Company’s common stock on the date of issuance of $0.43 per share a
On June 16, 2014, the Company issued professionals a total of 1,160,764 shares of common stock valued at fair value of range from $0.40 per share for services rendered to the Company. The fair values of the common stock issued were determined by using the trading price of the Company’s common stock on the date of issuance of $0.40 per share and $0.40 per share.
The Company calculated stock based compensation of $133,744 and $405,544, and recognized $33,436, and $90,600, $66,872 and $181,200 for the three months ended June 30, 2014 and 2013 and for the six months ended June 30, 2014 and 2013.
As of June 30, 2014, the deferred compensation balance was $1,053,568 and the deferred compensation balance of which (i) $33,436 was to be amortized over 3 months beginning on July 1, 2014; and (ii) $1,020,132 was to be amortized over 12 months beginning on July 1, 2014.
25. CONTINGENCIES
As of June 30, 2014 and December 31, 2013, the Company did not have any pending claims, charges, or litigation that it expects would have a material adverse effect on its consolidated balance sheets, consolidated statements of income and other comprehensive income or cash flows.
| F - 37 |
SINO AGRO FOOD, INC.
NOTES TO CONSOLIDATED FINANCIAL STATEMENTS
FOR THE SIX MONTHS ENDED JUNE 30, 2014 AND 2013
26. GAIN ON EXTINGUISHMENT OF DEBTS
The Company executed several agreements with third parties to settle debts by issuance of the Company’s common stock. The shares issued by the Company were valued at the trading price of the stock on the date the shares were issued. Any excess of the fair value of the shares over the carrying cost of the debt has been reported as a gain on the extinguishment of debts of $198,373 and $498,025 has been credited to consolidated statements of income as other income for the three months ended June 30, 2014 and 2013, respectively. Any excess of the fair value of the shares over the carrying cost of the debt has been reported as a gain on the extinguishment of debts of $241,393 and $1,051,013 has been credited to consolidated statements of income as other income for the six months ended June 30, 2014 and 2013, respectively.
27. RELATED PARTY TRANSACTIONS
In addition to the transactions and balances as disclosed elsewhere in these consolidated financial statements, during the six months ended June 30, 2014 and 2013, the Company had the following significant related party transactions:-
| Name of related party | Nature of transactions | |
| Mr. Solomon Yip Kun Lee, Chairman | Included in due to a director, due to Mr. Solomon Yip Kun Lee is $3,762,108 and $1,793,768 as of June 30, 2014 and December 31, 2013, respectively. The amounts are unsecured, interest free and have no fixed term of repayment. |
| F - 38 |
ITEM 2. MANAGEMENT’S DISCUSSION AND ANALYSIS OF FINANCIAL CONDITION AND RESULTS OF OPERATIONS
This Quarterly Report on Form 10-Q (the “Form 10-Q”) contains “forward-looking statements,” within the meaning of the Private Securities Litigation Reform Act of 1995 and Section 21E of the Securities Exchange Act of 1934, as amended (the “Exchange Act”). The Company intends such forward-looking statements to be covered by the safe harbor provisions for forward-looking statements contained in Section 21E of the Exchange Act. Forward-looking statements can be identified by the use of forward-looking terminology, such as “estimates,” “projects,” “plans,” “believes,” “expects,” “anticipates,” “intends,” or the negative thereof or other variations thereon, or by discussions of strategy that involve risks and uncertainties These statements reflect management’s current beliefs and are based on information now available to it. Accordingly, these statements are subject to certain risks, uncertainties and contingencies that could cause the Company’s actual results, performance or achievements in 2014 and beyond to differ materially from those expressed in, or implied by, such statements. Such statements, include, but are not limited to, statements contained in this Form 10-Q relating to the Company’s business, financial performance, business strategy, recently announced transactions and capital outlook. Important factors that could cause actual results to differ materially from those in the forward-looking statements include: a continued decline in general economic conditions nationally and internationally; decreased demand for our products and services; market acceptance of our products; the impact of any litigation or infringement actions brought against us; competition from other providers and products; the inability to raise capital to fund continuing operations; changes in government regulation; the ability to complete customer transactions, and other factors relating to our industry, our operations and results of operations and any businesses that may be acquired by us. Should one or more of these risks or uncertainties materialize, or should the underlying assumptions prove incorrect, actual results may differ significantly from those anticipated, believed, estimated, expected, intended or planned. Readers of this Form 10-Q should not place undue reliance on any forward-looking statements. Except as required by federal securities laws, the Company undertakes no obligation to update or revise these forward-looking statements to reflect new events or uncertainties.
You should read the following discussion and analysis of the financial condition and results of operations of the Company together with the financial statements and the related notes presented in Item 1 of this Form 10-Q.
Description, interpretation and clarification of business category on the consolidated results of the operations
The company strategy is to manage and operate its businesses under six (6) business divisions or units on a standalone basis, namely:
| 1) | Fishery Division; |
| 2) | Plantation Division; |
| 3) | Beef Division; |
| 4) | Cattle Farm Division; |
| 5) | Organic Fertilizer Division; and |
| 6) | Corporate & Others Division |
A summary of each business division is described below:
| l | Fishery Division refers to the operations of Capital Award Inc. (Capital Award or CA) covering its engineering, technology and consulting service management of fishery farms and seafood sales operations and marketing, where; |
Capital Award generates revenue as being the sole marketing, sales and distribution agent of the fishery farms (covering both of the fish, prawns and eel farms) developed by Capital Award in China as follows:
(A). Engineering and Technology Services via Consulting and Service Contracts (“CSC’s”) for the development, construction, and supply of plant and equipment, and management of fishery (and prawn or shrimp) farms and related business operations.
(B). Seafood Sales
Capital Award generates revenue as the sole marketing, sales and distribution agent for the fish and prawn farms developed by Capital Award in China as follows:
(1) Sales to Sino Foreign Joint Venture Companies (SFJVC) and sales derived from the SFJVC (currently, only the JFD subsidiary is an SFJVC) are being consolidated into Tri-way Industries Ltd. (Hong Kong) (TRW) as one entity.
(2) Sales to and sales derived from un-incorporated companies (covering EBAPCD and ZSAPP) are accounted for independently as follows:
CA and EBAPCD: (a). CA purchases prawn fingerling and feed stocks from third party suppliers and resells to EBAPCD at variable small profit margins and (b). CA purchases matured prawns from EBAPCD and sells them to third parties (in wholesale markets) at a gross profit margin approximating 15%.
| - 1 - |
CA and ZSAPP: (a). CA earns commission from the sale of prawn fingerlings that are sold by ZSAPP to third parties, and in this respect ZSAPP produces its own prawn fingerlings as compared to CA purchasing them for EBAPCD, as described above, and (b). CA purchases matured prawns from ZSAPP and sells to third parties (in wholesale markets) at a gross profit margin approximating15%.
| l | Plantation Division refers to the operations of Jiangmen City Heng Sheng Tai Agriculture Development Co. Ltd. (JHST) in the HU Plantation business where dragon fruit flowers (dried and fresh) and immortal vegetables are sold to wholesale and retail markets for a profit margin. JHST’s financial statements are consolidated into the financial statements of Macau EIJI Company Ltd. (MEIJI) as one entity. |
| l | Cattle Farm Division refers to the operations of Cattle farm (1) under Jiangmen City Hang Mei Cattle Farm Development Co. Ltd where Cattle are sold live to third party live-stock wholesalers who are selling them mainly in Guangzhou and Beijing live-stock wholesale markets. (JHMC), the financial statements of which are consolidated into MEIJI as one entity along with MEIJI’s operation in the consulting and service for development of other cattle farms (i.e., Cattle Farm 2) or related projects. |
| l | Organic Fertilizer Division refers to (i) the operation of SJAP in manufacturing and sales of organic fertile, bulk livestock feed and, concentrated livestock feed, the sales of live cattle inclusive (a): Cattle that are not being slaughtered in our own slaughter house operated by Qinghai Zhong He Meat Products Co., Limited (QZHP), are sold live to third party live-stock wholesalers and (b): Cattle that are sold to QZHP and being slaughtered and deboned and packed by QZHP; and the sales of meats deboned and packed by QZHP that are sold to various meat distributors, wholesalers and super market chains and our own retailed butcher stores. (ii) The operation of Hunan Shenghua A Power Agriculture Co. Ltd. (HSA) in manufacturing and sales of organic fertilizer. Also QZHP is a fully owned subsidiary of SJAP as such financial statements of these three companies (SJAP, QZHP and HSA are being consolidated into APWAM as one entity. |
| l | Corporate &Others Division refers to the business operations of Sino Agro Food, Inc., including import/export business and consulting and service operations provided to projects that not included in the above categories, and not limited to corporate affairs. |
| - 2 - |
MD & A OF CONSOLIDATED RESULTS OF OPERATIONS
Part A. Unaudited Income Statements of Consolidated Results of Operations for three months ended June 30, 2014 compared to the three months ended June 30, 2013.
A (1) Income Statements (Unaudited)
| In $ | Three months ended | Three months ended | Difference | Note | ||||||||||||
| June. 30. 2014 | June. 30. 2013 | |||||||||||||||
| Revenue | 97,032,504 | 54,400,329 | 42,632,175 | 1 | ||||||||||||
| Consulting, services, commission and management fee | 14,675,444 | 12,248,479 | 2,426,965 | 1.1 | ||||||||||||
| Sale of goods | 82,357,060 | 42,151,850 | 40,205,210 | 1.2 | ||||||||||||
| Cost of goods sold and services | 64,735,321 | 35,009,882 | 29,725,439 | 2 | ||||||||||||
| Consulting, services, commission and management fee | 6,685,461 | 8,671,247 | (1,985,786 | ) | 2.1 | |||||||||||
| Sale of goods | 58,049,860 | 26,338,635 | 31,711,225 | 2.2 | ||||||||||||
| Gross Profit | 32,297,183 | 19,390,447 | 12,906,736 | 3 | ||||||||||||
| Consulting, services, commission and management fee | 7,989,983 | 3,577,232 | 4,412,751 | 3.1 | ||||||||||||
| Sale of goods | 24,307,200 | 15,813,215 | 8,493,985 | 3.2 | ||||||||||||
| Other income (expenses) | 213,692 | 490,785 | (277,093 | ) | ||||||||||||
| General and administrative expenses | (3,281,860 | ) | (1,608,304 | ) | (1,673,556 | ) | 4 | |||||||||
| Net income | 29,229,015 | 18,272,928 | 10,956,087 | |||||||||||||
| EBITDA | 31,527,533 | 19,942,851 | 11,584,682 | |||||||||||||
| Depreciation and amortization (D&A) | (2,188,132 | ) | (1,614,965 | ) | (573,167 | ) | 5 | |||||||||
| EBIT | 29,339,401 | 18,327,886 | 11,011,515 | |||||||||||||
| Net Interest | (110,386 | ) | (54,958 | ) | (55,428 | ) | ||||||||||
| Tax | - | - | - | |||||||||||||
| Net Income | 29,229,015 | 18,272,928 | 10,956,087 | |||||||||||||
| Non - controlling interest | (6,141,977 | ) | (3,941,988 | ) | (2,199,989 | ) | 7 | |||||||||
| Net income to SIAF Inc. and subsidiaries | 23,087,038 | 14,330,940 | 8,756,098 | |||||||||||||
| Weighted average number of shares outstanding | 0 | |||||||||||||||
| - Basic | 155,390,109 | 115,366,595 | 40,023,514 | |||||||||||||
| - Diluted | 162,390,109 | 122,366,595 | 40,023,514 | |||||||||||||
| Earnings Per Share (EPS) | 8 | |||||||||||||||
| - Basic | 0.15 | 0.13 | 0.02 | |||||||||||||
| - Diluted | 0.14 | 0.12 | 0.02 | |||||||||||||
This Part A discusses and analyzes certain items (marked with notes) that we believe assist shareholders in obtaining a better understanding on the Company’s results of operations and financial condition:
| - 3 - |
(A): Information of Note (1, 2 & 3) Sales, cost of sales and gross profit and analysis:
| l | The Company’s revenues were generated from (A) Sale of Goods and (B) Consulting and Services provided in project and business developments covering engineering, construction, supervision, training, managements and technology etc. |
Table (A.2) below shows segmental break-down figures of sales of Goods, related cost of sales and GPs for the three months ended June 30, 2014(Q2 2014) and the three months ended June 30, 2013 (Q2 2013).
| 2014Q2 | 2013Q2 | 2014Q2 | 2013Q2 | 2014Q2 | 2013Q2 | |||||||||||||||||||||
| CA | Sales of | |||||||||||||||||||||||||
| Fish (Sleepy cods) | 4,099,410 | 2,799,629 | 3,183,840 | 2,685,624 | 915,570 | 114,005 | ||||||||||||||||||||
| Eels | 17,574,960 | 9,155,765 | 10,874,310 | 5,393,464 | 6,700,650 | 3,762,301 | ||||||||||||||||||||
| Prawns | 5,230,548 | - | 3,078,087 | - | 2,152,461 | - | ||||||||||||||||||||
| CA/ Fishery total | 26,904,918 | 11,955,394 | 17,136,237 | 8,079,088 | 9,768,681 | 3,876,306 | ||||||||||||||||||||
| JHST | Sales of Fresh HU Flowers | - | 456,281 | - | 123,195 | - | 333,086 | |||||||||||||||||||
| Sales of Dried HU Flowers | 2,185,504 | 2,939,730 | 624,732 | 1,078,146 | 1,560,772 | 1,861,584 | ||||||||||||||||||||
| Sales of Dried Immortal vegetables | 326,384 | - | 93,039 | - | 233,345 | - | ||||||||||||||||||||
| Sales of Other Value added products | - | 158,974 | - | 59,615 | - | 99,359 | ||||||||||||||||||||
| JHST/Plantation Total | 2,511,888 | 3,554,986 | 717,771 | 1,260,957 | 1,794,117 | 2,294,029 | ||||||||||||||||||||
| SJAP | Sales of live cattle | 18,874,020 | 7,328,071 | 14,017,814 | 5,852,877 | 4,856,206 | 1,475,194 | |||||||||||||||||||
| Sales of feedstock | ||||||||||||||||||||||||||
| Bulk Livestock feed | 1,419,500 | 2,171,512 | 726,430 | 877,310 | 693,070 | 1,294,202 | ||||||||||||||||||||
| Concentrate livestock feed | 3,539,632 | 3,153,736 | 1,976,521 | 1,714,279 | 1,563,111 | 1,439,457 | ||||||||||||||||||||
| Sales of fertilizer | 2,018,340 | 1,696,508 | 1,031,596 | 863,247 | 986,744 | 833,261 | ||||||||||||||||||||
| * QHMP's (Slaughter & Deboning operation) | 1,059,198 | - | 391,266 | - | 667,932 | - | ||||||||||||||||||||
| ** QHMP's Sales of live cattle | 739,629 | - | 769,013 | - | -29,384 | - | ||||||||||||||||||||
| SJAP Total | 27,650,319 | 14,349,827 | 18,912,640 | 9,307,714 | 8,737,679 | 5,042,113 | ||||||||||||||||||||
| HSA | Sales of Organic fertilizer | 1,027,187 | 544,650 | 799,917 | 437,481 | 227,270 | 107,170 | |||||||||||||||||||
| Sales of Organic Mixed Fertilizer | 4,107,126 | 2,051,901 | 2,145,119 | 1,147,854 | 1,962,007 | 904,046 | ||||||||||||||||||||
| HSA Total | 5,134,313 | 2,596,551 | 2,945,036 | 1,585,335 | 2,189,277 | 1,011,216 | ||||||||||||||||||||
| SJAP's & HS.A./Organic fertilizer total | 32,784,632 | 16,946,378 | 21,857,676 | 10,893,049 | 10,926,956 | 6,053,329 | ||||||||||||||||||||
| MEIJI | ||||||||||||||||||||||||||
| Sale of Live cattle (Aromatic) | 7,123,915 | 4,589,061 | 6,754,437 | 1,660,849 | 369,478 | 2,928,212 | ||||||||||||||||||||
| MEIJI / Cattle farm Total | 7,123,915 | 4,589,061 | 6,754,437 | 1,660,849 | 369,478 | 2,928,212 | ||||||||||||||||||||
| SIAF | ||||||||||||||||||||||||||
| Sales of Seafood trading/import/export | 13,031,707 | 5,106,031 | 11,583,739 | 4,444,692 | 1,447,968 | 661,339 | ||||||||||||||||||||
| SIAF/ Others & Corporate total | 13,031,707 | 5,106,031 | 11,583,739 | 4,444,692 | 1,447,968 | 661,339 | ||||||||||||||||||||
| Group Total | 82,357,060 | 42,151,850 | 58,049,860 | 26,338,635 | 24,307,200 | 15,813,215 | ||||||||||||||||||||
| - 4 - |
Table (A.3) below shows the percentage of gross profit the three months ended June 30, 2014 and the three months ended June 30, 2013.
| Gross Profit in % of sales | 2014Q2 | 2013Q2 | Difference | |||||||||
| SJAP | ||||||||||||
| Live cattle | 26 | % | 20 | % | 6 | % | ||||||
| Feedstock | ||||||||||||
| Bulk Livestock feed | 49 | % | 60 | % | -11 | % | ||||||
| Concentrate livestock feed | 44 | % | - | - | ||||||||
| Fertilizer | 49 | % | 49 | % | 0 | % | ||||||
| QZH: Live cattle | 63 | % | - | - | ||||||||
| QZH: Beef meat | -4 | % | - | - | ||||||||
| SJAP Gross Profit | 33 | % | 35 | % | -2 | % | ||||||
| HSA | ||||||||||||
| Fertilizer | 22 | % | 20 | % | 2 | % | ||||||
| Organic Mixed Fertilizer | 48 | % | 44 | % | 4 | % | ||||||
| HSA Gross Profit | 43 | % | 39 | % | 4 | % | ||||||
| JHST | ||||||||||||
| Fresh HU Flowers | 0 | % | 73 | % | -73 | % | ||||||
| Dried HU Flowers | 83 | % | 63 | % | 20 | % | ||||||
| Dried Immortal vegetables | 71 | % | - | - | ||||||||
| Other Value added products | - | - | - | |||||||||
| JHST Gross Profit | 82 | % | 65 | % | 17 | % | ||||||
| CA | ||||||||||||
| Fish (Sleepy cods) | 22 | % | 4 | % | 18 | % | ||||||
| Eels | 38 | % | 41 | % | -3 | % | ||||||
| Prawns | 36 | % | - | - | ||||||||
| CA Gross Profit | 35 | % | 32 | % | 3 | % | ||||||
| MEIJI | ||||||||||||
| Sale of Live cattle (Aromatic) | 5 | % | 64 | % | -59 | % | ||||||
| MEIJIGP | 5 | % | 64 | % | -59 | % | ||||||
| SIAF | ||||||||||||
| Seafood trading/import/export | 11 | % | 13 | % | -2 | % | ||||||
Group Total GP on goods sold (excluding C&S)) | 30 | % | 38 | % | -8 | % | ||||||
Notes to Table A.1’s:
Note (1, 1.2, 2, 2.2, 3, and 3.2);
Revenues (sale of goods)
The Company’s revenues generated from sale of goods increased by $40,205,210 (or 95%) from $42,151,850 for Q2 2013 to $82,357,060 for Q2 2014. The increase was primarily due to increase of revenues from fishery, organic fertilizer, Cattle Farm and Corporate sectors collectively.
Fishery: Revenue from fishery increased by $ 14,949,524 (or 125%) from $11,955,394 for Q2 2013 to $26,904,918 for Q2 2014. The increase in fishery was primarily due to our increase in productivities and in term increasing the sale of sleepy cods, eels and prawns.
| - 5 - |
Plantation: Revenue from our plantation decreased by $1,043,098 (or 29%) from $3,554,986 for Q2 2013 to $2,511,888 for Q2 2014. The decrease was primarily due to this year’s wet season affecting the yields of the regional growers whom we collected flowers from in the past that we didn’t buy any fresh flowers from for drying this quarter thus in term lowering our overall sales of dried flowers.
Organic fertilizer: Revenue from organic fertilizer increased by $15,838,254 (or 93%) from $16,946,378 for Q2 2013 to $32,784,632 for Q2 2014. The increase was primarily due to the increase of SJAP’s sales of live cattle and HSA’s increase in sales of fertilizer. (More details and information are presented in a subsequent section).
Cattle farm: Revenue from cattle farm increased by $2,534,854 (or 55%) from $4,589,061 for Q2 2013 to $7,123,915 for Q2 2014. The increase was primarily due to the combination of increase of cattle being grown in the farm, increase of number of cattle being fattened by sub-contracted growers. (More details and information are presented in in a subsequent section).
Corporate: Revenue from the corporate increased by $7,925,676 (or 155%) from $5,106,031 for Q2 2013 to $13,031,707 for Q2 2014. The increase was primarily due to more imported sea food being marketed. (More details and information are presented in a subsequent section).
Cost of Goods Sold
Cost of goods sold increased by $31,711,225 (or 120%) from $26,338,635 for Q2 2013 to $58,049,860 for Q22014. The increase was primarily due to increase of cost of goods sold from fishery, organic fertilizer, cattle farm and corporate sectors collectively.
Fishery: Cost of goods sold from fishery increased by $9,301,028 (or 112%) from $8,079,088 for Q22013 to $17,136,237 for Q2 2014. The increase in cost of goods from fishery was primarily due to the increase in productivities and in term cost of production of sleepy cods, eels and prawns.
Plantation: Cost of goods sold from plantation decreased by $543,186 (or 43%) from $1,260,957 for Q2 2013 to $717,771 for Q2 2014. The decrease was primarily due to the fact that there were no fresh HU Flowers being sold since the prices in dried flowers were more attractive than the fresh flowers and this quarter, there were no dried flowers processed from fresh flowers brought from and supplied by other regional growers due to short supply caused by the wet-season. (More details and information are presented in a subsequent section).
Organic fertilizer: Cost of goods sold from organic fertilizer increased by $9,804,348 (90%) from $10,893,049 for Q2 2013 to $20,697,397 for Q2 2014. The corresponding increase was primarily due to the increase of cost of production in SJAP’s increase in the production of live cattle and HSA’s increased production of fertilizer.
Cattle farm: Cost of goods sold from cattle farm increased by $5,093,588 (or 307%) from $1,660,849 for Q2 2013 to $6,754,437 for Q2 2014. The increase was primarily due to (i) the increase of number of bigger sized cattle being purchased to increase the turn round cycles of the sales of cattle of the farm and (ii) the increase of sales of fattened cattle from sub-contracted growers (i.e. trading of cattle). (More details and information are presented in a subsequent section).
Corporate: Cost of goods sold from corporate increased by $7,139,047 (or 161%) from $4,444,692 for Q2 2013 to $11,583,739 for Q2 2014. The increase was primarily due the corresponding increase of sales.
Note (3): Gross Profit (sale of goods)
Gross profit generated from goods sold increased by $8,493,985 (or 54%) from $15,813,215 for the three months ended June 30, 2013 to $24,307,200 for the three months ended June 30 2014. The increase was primarily due to increase of gross profit from fishery by $7,353,199 and was attributable to 30% of total increase of 24,307,200. Gross profit from fishery of $7,353,199 (Q21 2013: $3,876,306 attributed to 25% of total gross profit of $15,813,215).
Fishery: Gross profit from fishery increased by $5,892,375 (or 152%) from $3,876,306 for the three months ended June 30, 2013 to $9,524,802 for the three months ended June 30, 2014. Gross profit derived from sales of sleepy cods, eels and prawns were $918,909, $5,225,445 and $1,208,845 respectively in Q2 2014 compares to $114,005, $3,762,301 and $0 respectively in Q2 2013.
Plantation: Gross profit from our plantation decreased by $256,033 (or 11%) from $2,294,029 for the three months ended June 30, 2013 to $2,037,996 for the three months ended June 30 2014. The decrease was primarily due to this year’s wet season affecting the yields of the regional growers whom we collected flowers from in the past that we didn’t buy any fresh flowers from for drying this quarter thus in turn lowering our overall sales of dried flowers.
Organic fertilizer: Gross profit from organic fertilizer increased by $4,873,627 (or 81%) from $6,053,329 for the three months ended June 30, 2013 to $10,926,956 for the three months ended June 30, 2014. The increase was primarily due to the increase of SJAP’s sales of live cattle and HSA’s increase of sales of fertilizer.
| - 6 - |
Cattle farm: Gross profit from cattle decrease by $2,558,734 (or 87%) from $2,928,212 for the three months ended June 30, 2013 to $369,478 for the three months ended June 30, 2014. The decrease was primarily due to (i) the increase of trading of cattle from contracted growers at Changchun Village committee at lower margins, and there was inventory of young cattle brought in early months of 2013 at very low purchase cost due to the cold winter of 2013 created the opportunity for us to purchase this inventory at much lower cost than normal, however this opportunity didn’t occur in 2014. (More details and information are presented in a subsequent section).
Corporate: Gross profit from the corporate increased by $786,629 (or 119%) from $661,339 for the three months ended June 30, 2013 to $1,447,968 for the three months ended June 30, 2014. The increase was primarily due to the more category of sea food being marketed in Q2 2014 and the overall cost of saving made on air-flights charges, packaging materials and lower mortality of live seafood upon arrival of sales destinations. (More details and information are presented in a subsequent section).
| - 7 - |
Table A.4. : (below) shows the itemized sales of goods and related cost of sales in quantity and unit price for the three months ended June 30, 2014(Q2 2014) and the three months ended June 30, 2013 (Q2 2013).
| Subsidiary | Description of items | 2014Q2 | 2013Q2 | Notes | ||||||||||||||
| SJAP | Cattle Operation | Difference | ||||||||||||||||
| Production and Sales of live cattle | Heads | 5,157 | 2,418 | 2,739 | A.4.1 | |||||||||||||
| Average Unit sales price | US$/head | 4,009 | 3,031 | 978 | ||||||||||||||
| Unit cost prices | US$/head | 2,943 | 2,421 | 523 | ||||||||||||||
| SJAP | Production and sales of feedstock | - | ||||||||||||||||
| Bulk Livestock feed | MT | 8,500 | 14,016 | -5,516 | A.4.2 | |||||||||||||
| Average Unit sales price | US$/MT | 167 | 155 | 12 | ||||||||||||||
| Unit cost prices | US$/MT | 85 | 63 | 23 | ||||||||||||||
| Concentrated livestock feed | MT | 4,288 | 7,673 | -3,386 | A.4.3 | |||||||||||||
| Average Unit sales price | US$/MT | 406 | 411 | -5 | ||||||||||||||
| Unit cost prices | US$/MT | 190 | 223 | -33 | ||||||||||||||
| Production and sales of fertilizer | MT | 11,213 | 11,296 | -83 | A.4.4 | |||||||||||||
| Average Unit sales price | US$/MT | 180 | 150 | 30 | ||||||||||||||
| Unit cost prices | US$/MT | 92 | 76 | 16 | ||||||||||||||
| * QHMP (Slaughter & De-boning operation) | ||||||||||||||||||
| Slaughter of cattle | Heads | 158 | - | 158 | A.4.5 | |||||||||||||
| De-boned Meats | MT | 88 | - | 88 | ||||||||||||||
| Average Unit sales price | US$/MT | 11,987 | - | - | ||||||||||||||
| Unit cost prices | US$/MT | 4,428 | - | - | ||||||||||||||
| ** Re-Sales of live cattle | Heads | 192 | - | 192 | ||||||||||||||
| Average Unit sales price | US$/head | 3,853 | - | - | ||||||||||||||
| Unit cost prices | US$/head | 4,009 | - | - | ||||||||||||||
| Imported Beef & Lamb | MT | Inventory entry | - | - | A.4.6 | |||||||||||||
| Average of sales price | US$/MT | Inventory entry | - | - | ||||||||||||||
| Average of cost prices | US$/MT | Inventory entry | - | - | ||||||||||||||
| HS.A | Fertilizer and Cattle operation | |||||||||||||||||
| Organic Fertilizer | MT | 4,029 | 2,287 | 1,742 | A.4.7 | |||||||||||||
| Average Unit sales price | US$/MT | 255 | 238 | 17 | ||||||||||||||
| Unit cost prices | US$/MT | 199 | 191 | 7 | ||||||||||||||
| Organic Mixed Fertilizer | MT | 9,165 | 5,000 | 4,165 | A.4.8 | |||||||||||||
| Average Unit sales price | US$/MT | 448 | 410 | 38 | ||||||||||||||
| Unit cost prices | US$/MT | 234 | 230 | 4 | ||||||||||||||
| JHST | Plantation of HU Flowers and Immortal vegetables | |||||||||||||||||
| Fresh HU Flowers | Pieces | - | 3,061,500 | -3,061,500 | A.4.9 | |||||||||||||
| Average Unit sales price | US$/Pieces | - | 0.15 | -0 | ||||||||||||||
| Unit cost prices | US$/Pieces | - | 0.04 | -0 | ||||||||||||||
| Dried HU Flowers | MT | 158 | 237 | -79 | A.4.10 | |||||||||||||
| Average Unit sales price | US$/MT | 13,836 | 12,404 | 1,432 | ||||||||||||||
| Unit cost prices | US$/MT | 3,954 | 4,549 | -595 | ||||||||||||||
| Immortal Vegetables (Dried) | MT | 2.17 | - | 2.17 | A.4.11 | |||||||||||||
| Average Unit sales price | US$/MT | 150,407 | - | - | ||||||||||||||
| Unit cost prices | US$/MT | 42,875 | - | - | ||||||||||||||
| Other Value added products | Pieces | - | 20,000.00 | -20,000 | A.4.12 | |||||||||||||
| Average Unit sales price | US$/Pieces | - | 8 | -8 | ||||||||||||||
| Unit cost prices | US$/Pieces | - | 3 | -3 | ||||||||||||||
| CA | Production and sale (Inclusive contrated farms) of live | |||||||||||||||||
| Fish (Sleepy cods) | MT | 270 | 200 | 70 | A.4.13 | |||||||||||||
| Average Unit sales price | US$/MT | 15,183 | 13,998 | 1,185 | ||||||||||||||
| Unit cost prices | US$/MT | 11,792 | 13,428 | -1,636 | ||||||||||||||
| Eels | MT | 786 | 1,415 | -629 | A.4.14 | |||||||||||||
| Average Unit sales price | US$/MT | 22,360 | 6,469 | 15,891 | ||||||||||||||
| Unit cost prices | US$/MT | 13,835 | 3,811 | 10,024 | ||||||||||||||
| Prawns | MT | 355 | - | 355 | A.4.15 | |||||||||||||
| Average Unit sales price | US$/MT | 14,734 | - | 14,734 | ||||||||||||||
| Unit cost prices | US$/MT | 8,671 | - | 8,671 | ||||||||||||||
| MEIJI | Production and sale of Live cattle (Aromatic) | Heads | 2,324 | 1,325 | 999 | A.4.16 | ||||||||||||
| Average Unit sales price | US$/head | 3,065 | 3,463 | -398 | ||||||||||||||
| Unit cost prices | US$/head | 2,906 | 1,253 | 1,653 | ||||||||||||||
| SIAF | Seafood trading/import/export | |||||||||||||||||
| Mixed seafoods | Kg | 814,482 | 340,402 | 474,080 | A.4.17 | |||||||||||||
| Average of sales price | US$/Kg | 16 | 15 | 1 | ||||||||||||||
| Average of cost prices | US$/Kg | 14 | 13 | 1 | ||||||||||||||
| - 8 - |
Notes to Table A.4.
A.4.1: There were 5,157 head of live cattle at averaged weight of 700 Kg/head sold in Q2 2014 to 2,418 head at average weight of 585/head sold in Q2 2013 representing an increase of 2,739 head as SJAP increases its number of cooperative farms from 2013’s 10 to its present number of 22. Cost of sales increased accordingly however unit sales prices of live cattle in an average has increased from RMB32/Kg (or US$5.2/Kg) in Q2 2013 to RMB35/Kg (or US$5.69/Kg) in Q2 2014.
A.4.2: The decrease in sales of the Bulk livestock feed by 5,516 MT between Q2 2013’s 14,016 MT and Q2 2014’s 8,500 MT was due primarily to the increase of cattle being fattened by our cooperative farms in Q2 2014 such that we had to reserve more Bulk livestock feed for that purpose and limited the sales of the Bulk livestock feed to the non-cooperative farmers.
A.4.3: The decrease in sales of the Concentrated livestock feed by 3,386 MT between Q2 2013’s 7,673 MT and Q2 2014’s 4,288 MT was due primarily to the increase of cattle being fattened by our cooperative farms in Q2 2014 such that we had to reserve more Bulk livestock feed for that purpose and limited the sales of the Bulk livestock feed to the non-cooperative farmers and at the same time, there were no sales of the Concentrated livestock feed for the Government’s Emergency livestock feed program as it did in Q2 2013. This quarter we saw a drop in sales price of $5/MT but saving on cost of production by $33/MT compares to Q2 2013.
A.4.4: There were few changes in SJAP’s fertilizer sales and production between Q2 2014 and Q2 2013 except that its sales prices went up by US$30/MT and cost of production went up correspondingly by $16/MT.
A.4.5: Qinghai Zhong He Meat Products Co., Limited (QZHP) is the fully owned subsidiary of SJAP formed early in the year to operate the Slaughter House and Deboning operational division of SJAP .During the quarter, it has slaughter 158 head of cattle supplied by SJAP’s farm, and deboned and packed and sold 88 MT of meats at an average price of $11,987/MT. During the quarter, it was because there were adjustments made to its plants and equipment that stopped QZHP’s slaughter activity for a number of days such that QZHP had to re-sell 192 head of cattle that were intended to be slaughtered.
A.4.6: Also during the quarter, there were over 9 x 40’ containers of beef and lamb quarterly cut meats being imported from Australia through SIAF (SJAP’s ultimate holding company), and these containers were in transshipment. Some of these containers arrived during July and August 2014, and their deboned meats were sold locally to wholesalers in the Xining City.
A.4.7/8: HSA increased its total sales of fertilizer by 5,907 MT to 13,194 MT in Q2 2014 compares to the 7,287 MT in Q2 2013.That is a growth of 81% and explains why HSA had to develop and complete further fermentation and production facilities during Q1 and Q2 2014.
A.4.9, 10, 11, 12: This year, Guangdong district experienced a very wet season from April to August with constant rain falling practically every day that affected and delayed the growing of HU Flowers and immortal vegetables. As a result most of the regional growers could not supply fresh flowers to us during the quarter, at the same time, the rain also affected the shelf-life of the fresh flowers such that their market prices were low, which enhanced the reason why JHST didn’t sell any fresh flowers this quarter but dried flowers saw a rise in prices by 11.55 % compares to same period of 2013 and cost of production reduced by 13% due primarily to the reducing cost of treatment of plant diseases this quarter compares to Q2 2013.
| JHST dried over 2.17 MT of Immortal Vegetables based on ratio of 10Kg Fresh to 1 Kg of dried vegetables at a good sales price of RMB 150,407/Kg (or $24,456/Kg). It is expecting that the late season due to rain may help to extend the harvesting of HU Flower into November instead of October to make up the short fall in June. There was no other value added HU flowers being processed this quarter, pending on the completion of the development of JHST’s new processing factory to commence on the production of the value added products. However JHST intends to start its development work on its new processing factory when the application to rezone the 50 Mu of land into industrial land will be approved expecting on or before year end of 2014. |
A.4.13, 14, 15: This quarter, we saw an improvement in Sleepy cods’ prices (increased by 8.5%) compares to Q2 2013, but a decrease in production of eels by 654 MT compares to Q2 2013, the primarily reason is that the premium market prices are for larger eels (averaging 2 Kg/eel and larger wholesaling at average of $22,360/MT compares to Q2 2013’s small eels (of 0.5 Kg/eel) prices of $6,469/MT, as such we grew larger eels that took longer time to grow and reducing the turn-around cycles thus reducing overall production. Revenue generated from Prawn consisting the trading of fingerling (i.e. PF2 to PF1) and feed (also from PF2 to PF1), trading of prawn (i.e. brought from PF2 and resold to markets) and consolidated revenue of PF1& FF1, such that the overall gross profit margin is reduced to an average of 37.9% that does not reflect the actual GP% of the growing of prawns of PF1. In this respect (PF1 & FF1)’s production of prawn is achieving over 70% GP on revenue.
A.4.16: MEIJI’s sales revenue is consisting the combination of trading of cattle from sub-contracted growers and the consolidated revenue from CF1, and as the gross profit margin on trading is low thus in term reducing the overall GP% of MEIJI, and in this respect, CF1 is achieving an average above 20% on its rearing of cattle operation.
| - 9 - |
A.4.17: SIAF (Corporate Sector) imported from Madagascar a mixture of live seafood (i.e. crabs, eels and crayfish etc.) by air-flight and sold to the Guangzhou, Shanghai and Hangzhou wholesale markets via (Guangzhou City A Power Na Wei Trading Co., LTD., or GCAPNW) at an average gross profit margin of 11%.
Notes to Table A (1) Note (1.1, 2.1 and 3.1)
Table (A.5) below shows the revenue, cost of services and gross profit generated from Consulting, services, commission and management fee for three months ended June 30, 2014(Q2 2014) and the three months ended June 30,2013 (Q2 2013).
| 2014Q2 | 2013Q2 | Difference | Description of work | Notes | ||||||||||||
| Sales Revenues (Consulting and Services) | ||||||||||||||||
| CA | 13,045,757 | 5,948,712 | 7,097,045 | Primarily on the Zhongshan new prawn project | ||||||||||||
| MEIJI | - | 1,832,100 | -1,832,100 | |||||||||||||
| SIAF | 1,629,687 | 4,467,667 | -2,837,980 | Restaurant (4,5 & 6) and renonvation of Restaurant (1 & 2) | ||||||||||||
| Group Total Revenues | 14,675,444 | 12,248,479 | 2,426,965 | |||||||||||||
| Cost of sales | ||||||||||||||||
| CA | 5,131,217 | 5,694,307 | -563,090 | |||||||||||||
| MEIJI | - | 1,654,843 | -1,654,843 | |||||||||||||
| SIAF | 1,554,244 | 1,322,097 | 232,147 | |||||||||||||
| Group Total Cost of sales | 6,685,461 | 8,671,247 | -1,985,786 | |||||||||||||
| Gross Profit | ||||||||||||||||
| CA | 7,914,540 | 254,405 | 7,660,135 | |||||||||||||
| MEIJI | - | 177,257 | -177,257 | |||||||||||||
| SIAF | 75,443 | 3,145,570 | -3,070,127 | |||||||||||||
| Group Total Gross Profit | 7,989,983 | 3,577,232 | 4,412,751 | |||||||||||||
Revenues: (consulting, service, commission and management fee)
Revenues increased by $2,426,965 (or 20%) from $12,248,478 for Q2 2013 to $14,765,444 for Q22014. The increase was primarily due to an increase in revenue from the construction and development work done on the Zhongshan New Prawn of $7,097,045, which contributed 292% of the total increase of revenue of $2,426,965. Revenue from fishery of $13,045,757 (Q2 2013: $5,948,712) is contributed to 89% (Q2 2013: 49%) of the total revenue of $14,675,444 (Q2 2013: $12,248,479).
CA (Fishery): Revenue from fishery increased by $7,097,045 (or 119%) from $5,948,712 for Q2 2013 to $13,045,757 for Q2 2014.
MEIJI (Cattle farm): Revenue from cattle farm decreased by $1,832,100 (or 100%) from $1,832,100 for Q22013 to $0 for Q2 2014. The reason for the decrease is because the work in progress on cattle farm (2) had been completed in 2013.
SIAF (Corporate): Revenue from corporate decreased by $2,837,980 (or 64%) from $4,467,667 for Q2 2013 to $1,629,687 for Q2 2014. The reason for the decrease is because the slowing of work in progress for the construction of restaurant related work during the quarter.
Cost of services (consulting, service, commission and management fee)
Cost of services for consulting, service, commission and management fee decreased by $1,985,786 (or 23%) from $8,671,247 for Q2 2013 to $6,685,461 for Q2 2014.
CA (Fishery): Cost of services from fishery decreased by $563,090 (or 10%) from $5,694,307 for Q2 2013 to $5,131,217 for Q2 2014.
| - 10 - |
MEIJI (Cattle farm): Cost of services from cattle farm decreased by $1,654,843 (or 100%) from $1,654,843 for Q22013 to $0 for Q22014. The reason for the decrease is because the work in progress had been completed in 2013.
SIAF (Corporate): Cost of services from corporate increased by $232,147 from $1,322,097 (or 18%) for Q2 2013 to $1,554,244 for Q22014. The reason for the decrease is because the slowing of work in progress for the construction of restaurant related work during the quarter.
Gross profit (consulting, service, commission and management fee)
Gross profit of consulting, service, commission and management fee increased by $4,412,751 (or 123%) from $3,577,232 for Q2 2013 to $7,989,983 for Q2 2014.
CA (Fishery): Gross profit from fishery increased by $7,660,135 (or 3,011%) from $254,405 for Q2 2013 to $7,914,540 for Q2 2014.
MEIJI (Cattle farm): Gross profit from cattle farm decreased by $177,257 (or 100%) from $177,257 for Q2 2013 to $0 for Q2 2014. The reason for the decrease is because the work in progress on cattle farm (2) had been completed in 2013.
SIAF (Corporate): Gross profit from corporate decreased by $3,070,127 (or 98%) from $3,145,570 for Q2 2013 to $75,443 for Q2 2014. The reason for the decrease is because the slowing of work in progress for the construction of restaurant related work during the quarter.
| l | Tables(A.6) below highlights on general information of ongoing Consulting and Services provided by Capital Award, MEIJI and SIAF respectively in the Fiscal Year 2014: |
| - 11 - |
Name of the developments |
Location of development |
Designed capacity per year |
Land area or Built up area |
Current Phase & Stage |
Commencement date of development |
(Estimated) development's completion date on or before |
Contractual amount |
% of completion as of 30.06.2014 |
Notes | |||||||||
| Fish Farm (1) | Enping City | 1,200 MT | 9,900 m2 | fully operational | July 2010 | June 2011 | $5.3 million | Fully operational | ||||||||||
| Prawn Farm (1) | Enping City | 2013=400MT 2014=800MT 2015=1200 MT | 23,100 m2 | 2 phases and road work | 2 phases and road work and Phase 3 extension of grow-out farm & Phase 4 demonstrated hydroponic farm | Phase 1 on June 2011 Phase (2.1) Phase (2.2) Road work Started Aug. 2012 | Phase (1) on December 2012 Phase (2) completed Q1 2013 | Phase (1) $11.6 million Phase (2) 6.39 million Road work $2.94 million, Phase 3 US$5.2 million & Phase 4 US$1.6 million | Phase 1 & 2 completed and Phase 3 in progress | |||||||||
| Fish Farm (2) "The Fish & Eel Farm | Xin Hui District, Jiang Men. | 2014=800 MT 2015= 1600 MT 2016=2000MT | 165,000 m2 | 3 Phases | Phase 1 January 15, 2012 Bridge & Road Oct. 2012 Phase (3) 2013 & (4)2014 | Phase 1 June 2014 Bridge & Road Dec. 2013 Phase (3) & (4) 2015 | Phase (1) $8.73 million Bridge & Road $2.48 Phase (3) $4.38 M Phase (4) $10.63 Million | Phase (1) & Bridge and Road completed Jan. 2013 Phase (3) completed and Phase (4) not started. | Phase 4 work in progress | |||||||||
| Prawn Farm (2) The Hatchery & Nusery & Grow-out prawn farm | San Jiao Town, Zhong San City, | 2013=1.6 Billion Fingerling and 400MT of prawns increasing yearly and by 2015 = 3.2 billion fingerling and 1200 MT of Prawns | 120,000 m2 | 2 phases | Phase (1) and Phase (2) May 2012 Phase (3) 2014 | Phase (1) Dec. 2012 and Phase (2) December 2013.Phase (3) Dec. 2014 | Phase (1) $9.26 m and Phase (2) 8.42 Million Phase (3) 11.5 Million | Phase (1) fully operational and Phase (2) in operation and Phase (3) not started | Phase 3 work in progress | |||||||||
| Cattle Farm (1) | LiangXi Town, Enping City | 165,013 m2 | 1,500 Heads | 2 phases | April 2011 | December 2011 | $3.0 million +$1.17 Million | Fully Operational | ||||||||||
| Cattle Fram (2) | LiangXi Town, Enping City | 230,300 m2 | 2,500 heads | 2 Phases | February 2012 | March. 2014 | $10.6 million | completed | Starting to stock | |||||||||
| Cattle Farm (1) external road work | LiangXi Town, Enping City | 4.5 Km road | One Phase | September 2012 | March. 2013 | $4.32 million | Completed | |||||||||||
| Cattle Farm (2) External Road work. | LiangXi Town, Enping City | 5.5 Km Road | One Phase | September 2012 | March. 2013 | $5.28 Million | Completed | |||||||||||
| WHX Restaurants etc. | Guangzhou City | 5,500 seatings in total | Phase (1) Stage (1) | June 2012 | December 2015 | $17.5 million | Work in progress | Restaurant 5 & 6 work in progress | ||||||||||
| NaWei wholesale Center | Guangzhou City | 5,000 m2 | One Phase | July 2012 | March. 2014 | $ 9 million | Completed | Extension work in progress | ||||||||||
| New Zhangshan Prawn Project | Zhongshan City | Phase (1)S(1)= 10,000 MT S(2)= 30,000 MT Phase (2) S(1)=100,000 MT Phase (3) 200,000 MT | 3600 MU land & BU area 3.57 million square meter | Phase (1) Stage (1) | Nov. 2013 | 10 years for 100,000 MT capacity & 20 years for whole integrated project | 10 years for US$2.6 mbillion | minimal | Phase (1) Stage (1) work in progress | |||||||||
| - 12 - |
Note (4) to Table A 1 Other Income
Table (Note 4.1) below shows the Gain/Loss on extinguishment of debts (or Debt Settlement) representing recent sales of unregistered securities and the issuance of shares for Q2 2014
| Date | Shares issued/Bought back | Market Price when issuance | Par value | Additional paid in capital | Consideration received | Income from issuance of shares | Note | |||||||||||||||||||
| As of April 1, 2014 | 149,512,042 | 97,180,623 | ||||||||||||||||||||||||
| 4/8/2014 | 1,289,096 | 0.45 | 1,289 | 578,804 | 605,875 | 25,782 | Debt settlement | |||||||||||||||||||
| 4/25/2014 | 1,292,620 | 0.43 | 1,293 | 554,534 | 555,827 | - | Workers entitlement | |||||||||||||||||||
| 5/14/2014 | 3,372,093 | 0.40 | 3,372 | 1,345,465 | 1,450,000 | 101,163 | Debt settlement | |||||||||||||||||||
| 5/14/2014 | 3,571,429 | 0.40 | 3,571 | 1,425,000 | 1,500,000 | 71,428 | Debt settlement | |||||||||||||||||||
| 6/16/2014 | 1,160,764 | 0.40 | 1,161 | 463,145 | 464,306 | - | Professional Services | |||||||||||||||||||
| As of June 30, 2014 | 160,198,044 | 10,686 | 101,547,571 | 4,576,007 | 198,373 | |||||||||||||||||||||
The Company entered into several agreements with third parties to settle debts by issuance of the Company’s common stock. The shares issued by the Company were valued at the trading price of the stock on the date the shares were issued. For the three months ended June 30, 2014, the Company issued an aggregate of 8,232,618 shares of Common Stock in consideration for extinguishment of debt in the aggregate amount of $3,555,875, reporting gain as income of $198,373 from the extinguishment of debts. For the six months ended June 30, 2014, the Company issued an aggregate of 20,142,617 shares of Common Stock in consideration for extinguishment of debt in the aggregate amount of $9,575,000, reporting gain as income of $241,393 from the extinguishment of debts.
During the last three years, we have issued unregistered securities to Chinese persons none of them residents of the United States. None of these transactions involved any underwriters, underwriting discounts or commissions, or any public offering. The sales of these securities were, except as set forth below, deemed to be exempt from the registration requirements of the Securities Act of 1933 by virtue of Section 4(a)(2) thereof, and/or Rule 506 of Regulation D promulgated there under, as transactions by an issuer not involving a public offering. The recipients of securities in each transaction represented their intention to acquire the securities for investment only and not with a view to or for sale in connection with any distribution thereof and appropriate legends were affixed to the certificates issued in such transactions. All purchasers of our securities were accredited or sophisticated persons and had adequate access, through employment, business or other relationships, to information about us.
We relied upon Regulation S of the Securities Act of 1933, as amended, for the above issuances, none of which was made to US citizens or residents. We believe that Regulation S was available because:
| • | None of these issuances involved underwriters, underwriting discounts or commissions; |
| • | We placed Regulation S required restrictive legends on all certificates issued; |
| • | No offers or sales of stock under the Regulation S offering were made to persons in the United States; and |
| • | No direct selling efforts of the Regulation S offering were made in the United States. |
The other income for the three months ended June 30, 2014 amounted to $213,692 and derived from the combination of (1) Gain on extinguishment of debt $198,373 (Note 4), Government Grant $124,440 and other income $1,265 less interest expenses of $110,386. Whereas the other income for the three months ended June 30, 2013, and derived from the combination of (1) Gain on extinguishment of debt $498,025 (Note 4), Government Grants $Nil and other income $47,718 less interest expenses of $54,958.
Gain (loss) of extinguishment of debts
Any deficit (excess) of the fair value of the shares over the carrying cost of the debt has been reported as a gain (loss) on the extinguishment of debt of $198,373 and $498,025 has been credited (charged) to operations for the three months ended June 30, 2014 and 2013, respectively.
| - 13 - |
| l | Note (5) to Table A 1 General and Administrative Expenses and Interest Expenses |
General and administrative and interest expenses (including depreciation and amortization) increased by $1,728,984 or 103.95 % from $1,663,262 for Q2 2013 to $3,392,246 for Q2 2014. The increase was primarily due to increase in Office and corporate expenses of $1,605,869 from $590,182 for Q2 2013 to $2,196,051 for Q2 2014, and the increase in others and miscellaneous of $43,500 from $77,827 for Q2 2013 to $121,327 for Q2 2014.
Table (to Note 5)
| Category | 2014 Q2 | 2013 Q2 | Difference | |||||||||
| $ | $ | $ | ||||||||||
| Office and corporate expenses | 2,196,051 | 590,182 | 1,605,869 | |||||||||
| Wages and salaries | 381,255 | 375,374 | 5,881 | |||||||||
| Traveling and related lodging | 15,752 | 20,513 | -4761 | |||||||||
| Motor vehicles expenses and local transportation | 56,556 | 44,257 | 12,299 | |||||||||
| Entertainments and meals | 44,391 | 36,832 | 7,559 | |||||||||
| Others and miscellaneous | 121,327 | 77,827 | 43,500 | |||||||||
| Depreciation and amortization | 466,529 | 463,319 | 3,210 | |||||||||
| Sub-total | 3,281,860 | 1,608,304 | 1,673,556 | |||||||||
| Interest expenses | 110,386 | 54,958 | 55,428 | |||||||||
| Total | 3,392,246 | 1,663,262 | 1,728,984 | |||||||||
Note (6) to Table A 1 Depreciation and Amortization
Depreciation and amortization increased by $3,210 or 0.70% to $466,529 for Q2 2014 from $463,319 for Q2 2013. The increase was primarily due to the increase of depreciation by $264,874 to $596,470 for Q2 2014 from depreciation of $307,075 for Q2 2013 whereas the increase of amortization by $171,213to $509,080 for Q2 2014 from amortization of $337,867 for Q2 2013.
In this respect, total depreciation and amortization amounted to $1,614,965 for Q2 2014, out of which amount, $466,529 was reported under general and administration expenses and $1,148,436 was reported under cost of goods sold; whereas total depreciation and amortization was at $970,023 for Q2 2013 and out of which amount $463,319 was reported under General and Administration expenses and $506,704 was reported under cost of goods sold.
| - 14 - |
Note (7) to Table A 1 Non-controlling interests
Table (F) below shows the derivation of non-controlling interest
| Names of intermediate holdco. subsidiaries | Capital Award Inc. (Belize) | Macau EIJI Company Ltd. (Macau) | A Power Agro Agriculture Development (Macau) Ltd. |
Triway Industries Ltd.(HK) | Total | |||||||||||||||||||||||||||
| Abbreviated names | CA | (MEIJI) | (APWAM) | (TRW) | ||||||||||||||||||||||||||||
| % of equity holding on below subsidiaries (in China) | n.a. | 75 | % | 75 | % | 26 | % | 45 | % | 75 | % | |||||||||||||||||||||
| Name of China subsidiaries | None | Jiangmen City Heng Sheng Tai Agriculture Development Co. Ltd.(China) | Jiangmen City Hang Mei Cattle Farm Development Co. Ltd.(China) | Quinghai Sangjiang A Power Agrivulture Co. Ltd. (China) | Qing Hai Zhonghe Meat product Co.Ltd (China) | Jiangmen City A Power Fishery Development Co. Ltd. (China) | ||||||||||||||||||||||||||
| Abbreviated names | (JHST) | (JHMC) | (HSA) | (SJAP) | (QHZH) | (JFD) | ||||||||||||||||||||||||||
| Hunan Shanghua A Power Agriculture Co. Ltd (China | 50 | % | ||||||||||||||||||||||||||||||
| Net income of the P.R.C. subsidiaries for the period ended 30. June 2014 in $ | 0 | $ | 1,210,100 | $ | 687,832 | $ | 1,436,850 | $ | 8,206,291 | $ | 492,224 | $ | 2,153,868 | $ | 14,187,165 | |||||||||||||||||
| Equity % of non-controlling interest | 0 | % | 25 | % | 25 | % | 51.5 | % | 55 | % | 55 | % | 25 | % | 43 | % | ||||||||||||||||
| Non-controlling interest's shares of Net incomes in $ | 0 | $ | 302,525 | $ | 171,958 | $ | 344,844 | $ | 4,513,460 | $ | 270,723 | $ | 538,467 | $ | 6,141,977 | |||||||||||||||||
The Net Income attributed to non-controlling interest is $6,141,977 shared by (JHST, JHMC, HSA, SJAP and JFD collectively )for Q2 2014 as shown in Table (F) above.
Note (8) to Table A 1 Earnings per shares (EPS)
Earnings per share increased by $0.02 (basic) and $0.02 (diluted) per share from EPS of $0.13 (basic) and 0.12 (diluted) Q2 2013 to EPS of $0.15 (basic) and $0.14 (diluted) for Q2 2014. The reason for the increase is primarily due to the increment of net income attributable to Sino Agro Food, Inc. and subsidiaries by $8.75 million from $14.33 million for Q2 2013 to $23.29 million for Q2 2014.
| - 15 - |
Part B. MD & A on Unaudited Consolidated Balance Sheet of Continued Operations for the six months ended 30June 2014(Q2 2014) compared to the twelve months ended 31 December 2013(fiscal year 2013)
| Consolidated Balance sheets | June 30, 2014 | December 31, 2013 | Changes +- | Note | ||||||||||||
| ASSETS | $ | $ | $ | |||||||||||||
| Current assets | ||||||||||||||||
| Cash and cash equivalents | 3,631,566 | 1,327,274 | 2,304,292 | B | ||||||||||||
| Inventories | 25,937,918 | 8,148,203 | 17,789,715 | 9 | ||||||||||||
| Costs and estimated earnings in excess of billings on uncompleted contracts | 757,303 | 663,296 | 94,007 | |||||||||||||
| Deposits and prepaid expenses | 93,203,999 | 92,401,416 | 802,583 | 10 | ||||||||||||
| Accounts receivable | 117,184,211 | 82,057,941 | 35,126,270 | 11 | ||||||||||||
| Other receivables | 11,026,053 | 3,782,772 | 7,243,281 | 15 | ||||||||||||
| Total current assests | 251,741,050 | 188,380,902 | 63,360,148 | |||||||||||||
| Property and equipment | ||||||||||||||||
| Property and equipment, net of accumulated depreciation | 50,081,031 | 46,487,058 | 3,593,973 | 12 | ||||||||||||
| Construction in progress | 72,395,107 | 59,134,732 | 13,260,375 | 13 | ||||||||||||
| Land use rights, net of accumulated amortization | 59,871,240 | 60,705,829 | (834,589 | ) | 14 | |||||||||||
| Total property and equipment | 182,347,378 | 166,327,619 | 16,019,759 | |||||||||||||
| Other assets | ||||||||||||||||
| Goodwill | 724,940 | 724,940 | - | |||||||||||||
| Proprietary technologies, net of accumulated amortization | 11,771,492 | 12,081,470 | (309,978 | ) | ||||||||||||
| Total other assets | 12,496,432 | 12,806,410 | (309,978 | ) | ||||||||||||
| Total assets | 446,584,860 | 367,514,931 | 79,069,929 | |||||||||||||
| Current liabilities | ||||||||||||||||
| Accounts payable and accrued expenses | 19,783,024 | 11,055,194 | 8,727,830 | 16 | ||||||||||||
| Billings in excess of costs and estimated earnings on uncompleted contracts | 3,521,421 | 3,146,956 | 374,465 | |||||||||||||
| Due to a director | 3,762,108 | 1,793,768 | 1,968,340 | |||||||||||||
| Dividends payable | 3,146,987 | - | 3,146,987 | |||||||||||||
| Other payables | 11,660,708 | 10,768,786 | 891,922 | |||||||||||||
| Short term bank loan | 4,063,059 | 4,100,377 | (37,318 | ) | ||||||||||||
| Total current liabilities | 45,937,307 | 30,865,081 | 15,072,226 | |||||||||||||
| Non-current liabilities | - | 3,146,987 | (3,146,987 | ) | ||||||||||||
| Bonds payable | 1,725,000 | 1,725,000 | 0 | |||||||||||||
| Long term debts | 2,616,610 | 180,417 | 2,436,193 | |||||||||||||
Deferred dividends payable |
- | 3,146,987 | (3,146,987 | ) | ||||||||||||
| Total non-current liabilities | 4,341,610 | 5 ,052,404 | (710,794 | ) | ||||||||||||
| Stockholders equity | ||||||||||||||||
| Preferred stock | ||||||||||||||||
| Series A preferred stock | - | |||||||||||||||
| Series B convertible preferred stock | 7,000 | 7,000 | - | |||||||||||||
| Series F Non-convertible preferred stock | - | - | - | 17 | ||||||||||||
| Common stock | 160,198 | 137,602 | 22,596 | |||||||||||||
| Additional paid-in capital | 118,369,556 | 108,038,413 | 10,331,143 | |||||||||||||
| Retained earnings | 221,945,794 | 178,070,837 | 43,874,957 | |||||||||||||
| Accumulated other comprehensive income | 5,600,438 | 6,260,131 | (659,693 | ) | ||||||||||||
| Treasury stock | (1,250,000 | ) | (1,250,000 | ) | - | |||||||||||
| Total SIAF Inc. and subsidaries' equity | 344,832,986 | 291,263,983 | 53,569,003 | |||||||||||||
| Non-controlling interest | 51,472,857 | 40,333,463 | 11,139,394 | |||||||||||||
| Total stockholders' equity | 396,305,843 | 331,597,446 | 64,708,397 | |||||||||||||
| Total liabilities and stockholders' equity | 446,584,760 | 367,514,931 | 79,069,829 | |||||||||||||
| - 16 - |
This Part B discusses and analyzes certain items (marked with notes) that we believe would assist stakeholders in obtaining a better understanding on the Company’s results of operations and financial condition:
Note (B) Cash and Cash Equivalents
The change in cash and cash equivalent of $2,304,292 derived from cash and cash equivalent of $3,631,566 and $1,327,274 as at June 30, 2014 and December 31, 2013 respectively. In this respect it is a regular situation for cash & cash equivalents to get back into its normal pattern after the irregular pattern incurred due to seasonal impacts at the end of the year.
Note (9) Break down on inventories
| June. 30. 2014 | Dec 31,2013 | Difference | ||||||||||
| $ | $ | $ | ||||||||||
| Sleepy cods, prawns, eels and marble goble | 3,544,935 | 1,761,111 | 1,783,824 | |||||||||
| Harvested HU plantation | - | 719,329 | (719,329 | ) | ||||||||
| Bread grass | 374,773 | 580,954 | (206,181 | ) | ||||||||
| Beef cattle | 7,827,427 | 1,951,962 | 5,875,465 | |||||||||
| Organic fertilizer | 1,531,096 | 895,670 | 635,426 | |||||||||
| Forage for cattle and consumable | 2,425,543 | 684,979 | 1,740,564 | |||||||||
| Raw materials for bread grass and organic fertilizer | 9,533,570 | 855,493 | 8,678,077 | |||||||||
| Immature seeds | 700,474 | 698,704 | 1,770 | |||||||||
| 25,937,818 | 8,148,203 | 17,789,615 | ||||||||||
Note (10) Breakdown of Deposits and Prepaid Expenses
| June. 30. 2014 | Dec 31,2013 | Difference | Note | |||||||||||||
| Deposits for | $ | $ | $ | |||||||||||||
| - purchases of equipment | 4,372,776 | 4,886,048 | (513,272 | ) | ||||||||||||
| - acquisition of land use right | 7,826,508 | 7,826,508 | 0 | 10.1 | ||||||||||||
| - inventory purchases | 3,899,435 | 9,776,383 | (5,876,948 | ) | ||||||||||||
| - aquaculture contract | 11,043,090 | - | 11,043,090 | |||||||||||||
| - building materials | 877,598 | 1,281,935 | (404,337 | ) | ||||||||||||
| - proprietary technology | - | 4,404,210 | (4,404,210 | ) | ||||||||||||
| - construction in progress | 23,021,316 | 23,021,316 | 0 | |||||||||||||
| Shares issued for employee compensation and oversea professional fee | 1,053,568 | 100,308 | 953,260 | |||||||||||||
| Temporary deposits paid to entities for investments in future Sino Foreign Joint Venture companies | 41,109,708 | 41,109,708 | 0 | 10.2 | ||||||||||||
| 93,203,999 | 92,406,416 | 797,583 | ||||||||||||||
Note (10.1)
Note (10.1) Breakdown of Deposit for- acquisition of Land Use Right:
As of June 30, 2014, we have $7,826,508 for a deposit paid for the acquisition of a Land Use Right derived from the following transactions:
| • | $3,182,180 (or RMB20,000,000) was full payment made on June 6, 2012 for Land Use Right by HSA comprising a block of land measuring 150 Mu (or 25 acres of prime agriculture land) located at Linli District of Hunan Province within 10 Km of HSA’s complex. The process of application to register the said “Land Use Right” is in progress, and, as such, this payment is recorded as Deposit and Prepaid Expenses pending final authority estimated to be granted on or before September 30, 2014, as the new local ordinances on agriculture land delayed the processing of our application. |
| - 17 - |
| • | $190,930 (or RMB1,200,000) was paid by SJAP as deposit for the acquisition of “Land Use Right” on a block of land measuring 15 Mu (or 2.475 acres) located at Huangyuan district next to SJAP’s complex on October 15, 2012. The process of rezoning this piece of land to residential (at present, agriculture) continues, and once completed will be transferred from the Local Government (Huangyuan County) to SJAP to build new staff quarters. |
$4,453,398 (or RMB 27,989,606) was the full payment by Capital Award for the purchase of the Land Use Right on a block of prime agriculture land measuring 235 Mu (or 38.5 acres) located at the Cong Hua District Guangzhou City in late October 2010. This block of land is part of a larger block of land (of some 500 acres) which is under a subdivision application. However in 2011, the Land Law changed such that the said sub-division now requires the approval of the Central Government in Beijing, which means approval process is lengthened. Cong Hua District was rezoned as a suburb of the Guangzhou City in 2010 and within close proximity of the Guangzhou City and Management considers it as a valuable piece of land very suitable for the development of one of our agriculture projects. Our agreement with the Vendor requires that they use best efforts speed up the said subdivision’s approval on or before June 30 2014, failing which they would replace the said land with another block of land to our satisfaction. Our preference is to wait further on the said approval, they would refund to us $1 million (or its equivalent in RMB) in lieu of compensation for the delay.
Note (10.2) Information of “Temporary deposit and pre-payments for investments in future assets and in future Sino Foreign Joint Venture companies”:
| Under account of | Segment of | Project name | Estimated total | Estimated time | Current status | Deposit & prepayments | Land Bank | % equivalent | ||||||||||||||||||||
| Subsidiary | Asset value | of Acquisition | of Project | made as of June 30, 2014 | or Built Up area | to equity paid | ||||||||||||||||||||||
| $ | $ | m2 | ||||||||||||||||||||||||||
| SIAF | Corporate | Trade Center | 3.5 million | own development | 30% completed | 4,086,941 | 5,000 | 31 | % | |||||||||||||||||||
| Seafood Center | 1,032,914 | |||||||||||||||||||||||||||
| CA | Fishery | Fish Farm (1) | 26.22 Million | 2016 | 2 out 4 phases completed | 6,000,000 | 23,100 | 23 | % | |||||||||||||||||||
| Prawn Farm (1) | 20.93 Million | 2014 | in operation | 14,554,578 | 165,000 | 56 | % | |||||||||||||||||||||
| Prawn Farm (2) | 29.18 Million | 2014 | Part operational Part work in progress | 9,877,218 | 120,000 developed 96,000 m2 undeveloped | 29 | % | |||||||||||||||||||||
| MEIJI | Cattle | Cattle Farm (2) | 15.88 Million | 2014 | 95% completed | 5,558,057 | 230,300 | 35 | % | |||||||||||||||||||
| 41,109,708 | ||||||||||||||||||||||||||||
Note (11) Breakdown of Accounts receivable:
| June 30,2014 Accounts receivable | 0-30 days | 31-90 days | 91-120 days | over 120 days and less than 1 year | ||||||||||||||||
| $ | $ | $ | $ | $ | ||||||||||||||||
| Consulting and Service totaling | ||||||||||||||||||||
| CA (excluding Zhangshan New Prawn Project) | 9,096,028 | 8,900,107 | 195,921 | - | - | |||||||||||||||
| CA on Zhongshan New Prawn Project | 12,113,628 | 12,113,628 | - | - | - | |||||||||||||||
| MEIJI | 4,360,156 | - | - | - | 4,360,156 | |||||||||||||||
| SIAF | 5,653,426 | 2,499,451 | 3,153,975 | - | - | |||||||||||||||
| Sales of Live Fish, eels and prawns (from Farms) (CA) | 18,810,379 | 18,810,379 | - | - | - | |||||||||||||||
| Sales of imported seafood、 beef & mutton (SIAF) | 5,192,045 | 5,192,045 | - | - | - | |||||||||||||||
| Sales of Cattle and Beef Meats (from Enping Farm) (MEIJI) | 10,931,630 | 6,185,500 | - | 4,746,130 | - | |||||||||||||||
| Sales of HU Flowers (Fresh & Dried) (JHST) | 7,619,654 | 1,656,844 | 851,922 | 755,728 | 4,355,160 | |||||||||||||||
| Sales Fertilizer, Bulk Stock feed and Cattle by (SJAP) | 32,623,711 | 8,545,045 | 16,858,070 | 2,513,343 | 4,707,253 | |||||||||||||||
| Sales Fertilizer from (HSA) | 9,654,603 | 1,765,653 | 3,370,365 | 1,695,956 | 2,822,629 | |||||||||||||||
| Sales of Live Fish (JFD) | 35,850 | - | - | - | 35,850 | |||||||||||||||
| Sales of Beef (QHMP) | 1,093,101 | 1,087,566 | 2,122 | - | 3,413 | |||||||||||||||
| Total | 117,184,211 | 66,756,218 | 24,432,375 | 9,711,157 | 16,284,461 | |||||||||||||||
| - 18 - |
Information on trading terms and provision for diminution in value of accounts receivable:
Our accounts receivable ageing is less than 12 months old. Receivables from revenue derived from consulting and services billed for work completed are within our normal trading terms of 180 days and therefore no diminution in value is required, as the credit quality of receivable is not in doubt.
Fish Sales: Most farmed fish are sold to wholesalers at prevailing daily market prices and ageing is within 90 days trading terms with a small portion at 180 days (for oversized fish, as the sale of oversized fish takes time to sell). We sold $ 32 million in live fish, eels and prawns (Live seafood) to the wholesalers for the three months ended June 30, 2014 and as of June 30, 2013, accounts receivable of $ 0 was over 120 days. These debtors represent credit quality receivables as they are well established wholesalers, profitable and viable businesses with a good track record and therefore provision of diminution in value is not required as collection is not in doubt.
Sales of fertilizer and bulk livestock feed: These comprise sales made to regional farmers contracted by us to grow crops and pastures using and purchasing our fertilizer. We in turn agree to buy their cattle that are fed with our bulk and concentrated cattle feed purchased from us. Under this term of arrangements our accounts receivable are normally carried forward until such time they can be offset against our account payables due to these contracted farmers (that is, the amount owed for the amount of crops and pastures is ultimately offset against the amount of cattle that we have purchased from them, respectively). As these debtors are our contract farmers and operate a profitable and viable businesses with us and have a good track record we consider their credit quality is good and collection from them is not in doubt, thus no diminution in value is required.
Information on Concentration of credit risk of account receivables:
We have 4 major long term customers (referring to Customer A, B, C and D mentioned in the Financial Statement of this report under Note), who have accounted for 67.92% or more of our consolidated revenues for Q2 2014as shown in the table below:
| For the three months ended June 30, 2014 | ||||||||
| % of total Revenue | Total Revenue | |||||||
| Customer A | 31.08 | % | 30,155,499 | |||||
| Customer B | 18.77 | % | 18,214,164 | |||||
| Customer C | 9.90 | % | 9,607,061 | |||||
| Customer D | 8.17 | % | 7,926,978 | |||||
| 67.92 | % | 65,903,702 | ||||||
Customer A is WSC 1, which is owned and operated by Guangzhou City A Power NaWei Trading Co. Ltd (“APNW”). CA was the consulting engineer responsible for the construction of WSC 1and development of its business operation via a Consulting and Service Contract granted by APNW. APNW is now one of our main wholesalers, and to whom we bill our sales of seafood (including live and frozen seafood). APNW distributes the seafood to other wholesalers in various cities in China. WSC 1 is ideally situated at the center of all interprovincial logistic services. At the same time, APNW has obtained all relevant Import Quotas and Permits by September 30, 2013. As such, SIAF relies on APNW’s import permits for its import and export trades to be carried out in China. Sales effected through WSC 1 contributes 31.08% of our total consolidated revenue (equivalent to $30,155,499 out of our total revenue of $97,032,504 derived collectively from the following segments of activities:
| Customer A with | For the three months ended June 30, 2014 | |||||||||||||
| Name of company | Segments | Operation Division | Abbreviation name | % of total consolidated | Amount in | |||||||||
| Revenue | $ | |||||||||||||
| CA | Fishery | Sales of fish (from Fish Farm 1) | Wholesale Center (1) | 8.54 | % | 8,290,492 | ||||||||
| Sales of fish / eels from Contract Growers | 4.56 | % | 4,422,764 | |||||||||||
| SIAF | Corporate | Trading sales of seafood, beef & mutton | 17.98 | % | 17,442,243 | |||||||||
| 31.08 | % | 30,155,499 | ||||||||||||
| - 19 - |
Customer B is one of our main agents, namely Mr. Li Hongzhen who distributes SJAP’s organic fertilizer, bulk livestock feed and concentrated livestock feed to our cooperative farmers and other regional farmers. During Q2 2014, Mr. Li had transacted 18.77% of our total consolidated revenue (equivalent to $18,214,164 out of our total revenue of $97,032,504 derived from the sale of SJAP’s organic fertile, bulk livestock feed and concentrated livestock feed under the segment of Organic Fertilizer and Bread Grass.
Customer C is one of our main agents, namely Mr. Xian Zhiming (Zhongshan new prawn farm) who we agreed to extend trading terms between 120 days to 180 days in the interim until such time as we assist them to procure a project loan of up to $60 million targeting on or before September 30, 2014.
Customer D is Cattle Wholesale represented by Mr. Zhen Runchi who buys our fattened cattle to sell them in the Guangdong and Beijiang cattle markets and at the same time supplies to us with young cattle. During Q2 2014, transactions through Mr. Zhen Runchi generated (8.17) % of our total consolidated revenue (equivalent to $(7,926,978) out of our total revenue of $(97,032,504).
The Company had 4 major customers whose accounts receivable balance individually represented the following percentages of the Company’s total accounts receivable during Q2 2014:
| June 30, 2014 | Total | |||||||||||
| % of total Accounts receivables | amount in $ | Accounts receivables | ||||||||||
| Customer A | 16.17 | % | 18,948,687 | |||||||||
| Customer B | 12.36 | % | 14,483,968 | |||||||||
| Customer C | 10.34 | % | 12,116,847 | |||||||||
| Customer D | 8.12 | % | 9,515,358 | |||||||||
| 46.99 | % | 55,064,861 | ||||||||||
Note (12) Property and equipment, net of accumulation depreciation
| June 30. 2014 | ||||
| $ | ||||
| Plant and machinery | 5,343,903 | |||
| Structure and lease hold improvements | 38,012,265 | |||
| Mature seeds and herbage cultivation | 9,234,439 | |||
| Furniture and equipment | 393,412 | |||
| Motor vehicles | 765,858 | |||
| 53,749,877 | ||||
| Less: Accumulated depreciation | (3,668,846 | ) | ||
| Net carrying amount | 50,081,031 | |||
Note (13) Construction in progress
| June 30, 2014 | ||||
| $ | ||||
| Construction in progress | ||||
| - Oven room, road for production of dried flowers | 276,288 | |||
| - 'Office, warehouse and organic fertilizer plant in HSA | 26,759,971 | |||
| - Organic fertilizer and bread grass production plant and office building | 7,274,004 | |||
| - Rangeland for beef cattle and office building | 36,240,390 | |||
| - Fish pond | 1,844,454 | |||
| 72,395,107 | ||||
| - 20 - |
Note (14) Land Use Rights, net of accumulated amortization:
| Item | Owner | Location | Acres | Date Acquired | Tenure | Expiry dates | Cost $ | Monthly amortization $ | Balance at June 30, 2014 $ | Nature of ownership | Nature of project | |||||||||||||||||||
| Hunan lot1 | HS.A | Ouchi Village, Fenghuo Town, Linli County | 31.92 | 4/5/2011 | 43 | 4/4/2054 | 242,703 | 470 | 224,359 | Lease | Fertilizer production | |||||||||||||||||||
| Hunan lot2 | HS.A | Ouchi Village, Fenghuo Town, Linli County | 247.05 | 7/1/2011 | 60 | 6/30/2071 | 36,666,141 | 50,925 | 34,832,834 | Management Right | Pasture growing | |||||||||||||||||||
| Hunan lot3 | HS.A | Ouchi Village, Fenghuo Town, Linli County | 8.24 | 5/24/2011 | 40 | 5/23/2051 | 378,489 | 789 | 348,525 | Land Use Rights | Fertilizer production | |||||||||||||||||||
| Guangdong lot 1 | JHST | Yane Village, Liangxi Town, Enping City | 8.23 | 8/10/2007 | 60 | 8/9/2067 | 1,064,501 | 1,478 | 941,788 | Management Right | HU Plantation | |||||||||||||||||||
| Guangdong lot 2 | JHST | Nandu Village of Yane Village, Liangxi Town, Enping City | 27.78 | 3/14/2007 | 60 | 3/13/2067 | 1,037,273 | 1,441 | 910,495 | Management Right | HU Plantation | |||||||||||||||||||
| Guangdong lot 3 | JHST | Nandu Village of Yane Village, Liangxi Town, Enping City | 60.72 | 3/14/2007 | 60 | 3/13/2067 | 2,267,363 | 3,149 | 1,990,241 | Management Right | HU Plantation | |||||||||||||||||||
| Guangdong lot 4 | JHST | Nandu Village of Yane Village, Liangxi Town, Enping City | 54.68 | 9/12/2007 | 60 | 9/11/2067 | 2,041,949 | 2,836 | 1,809,394 | Management Right | HU Plantation | |||||||||||||||||||
| Guangdong lot 5 | JHST | Jishilu Village of Dawan Village,Juntang Town, Enping City | 28.82 | 9/12/2007 | 60 | 9/11/2067 | 960,416 | 1,334 | 851,036 | Management Right | HU Plantation | |||||||||||||||||||
| Guangdong lot 6 | JHST | Liankai Village of Niujiang Town, Enping City | 31.84 | 1/1/2008 | 60 | 12/31/2068 | 821,445 | 1,141 | 732,455 | Management Right | Fish Farm | |||||||||||||||||||
| Guangdong lot 7 | JHST | Nandu Village of Yane Village, Liangxi Town, Enping City | 41.18 | 1/1/2011 | 26 | 12/31/2037 | 5,716,764 | 18,323 | 4,947,200 | Management Right | HU Plantation | |||||||||||||||||||
| Guangdong lot 8 | JHST | Shangchong Village of Yane Village, Liangxi Town, Enping City | 11.28 | 1/1/2011 | 26 | 12/31/2037 | 1,566,393 | 5,020 | 1,355,533 | Management Right | HU Plantation | |||||||||||||||||||
| Guangdong lot 9 | MEIJI | Xiaoban Village of Yane Village, Liangxi Town, Enping City | 41.18 | 4/1/2011 | 20 | 3/31/2031 | 5,082,136 | 21,176 | 4,256,289 | Management Right | Cattle Farm | |||||||||||||||||||
| Qinghai lot 1 | SJAP | No. 498, Bei Da Road, Chengguan Town of Huangyuan County,Xining City, Qinghai Province | 21.09 | 11/1/2011 | 40 | 10/30/2051 | 527,234 | 1,098 | 492,085 | Land Use Right & Building ownership | Cattle farm, fertilizer and livestock feed production | |||||||||||||||||||
| Guangdong lot 10 | JHST | Niu Jiang Town, Liangxi Town, Enping City | 6.27 | 3/4/2013 | 10 | 3/4/2023 | 489,904 | 4,083 | 424,583 | Management Right (lease) | Processing factory | |||||||||||||||||||
| JHST | Land improvement cost incurred | 12/1/2013 | 3,914,275 | 6,155 | 3,871,193 | |||||||||||||||||||||||||
| Exchange difference | 1,811,386 | 1,883,230 | ||||||||||||||||||||||||||||
| 620.28 | 64,588,373 | 119,418 | 59,871,240 | |||||||||||||||||||||||||||
| - 21 - |
Note (15) Other Receivables
| June 30, 2014 | Note | |||||
| $ | ||||||
| Advanced to employees | 224,700 | |||||
| Advanced to suppliers | 2,451,353 | 15.A | ||||
| Advanced to sub-contractors and suppliers working on the Zhongshan New Prawn Projects | 8,350,000 | 15.B | ||||
| 11,026,053 | ||||||
Note 15.A & B: Breakdown of Advances to Suppliers at SJAP’s operations:
At SJAP it is a common practice to make cash advances to our cooperative growers (presently standing at 100 members) who are our suppliers, to carry them through respective growing periods (for cropping or pasturing or cattle growing purposes) before final harvests of produce or sale of their cattle. On average, it works out at less than $2,442 per member that in the management’s opinion is a normal season to season process deemed fair and equitable. In this respect, as the said average increases it means that the average cooperative farmer is increasing his productivity (whether in the growing of crops or cattle), and in simple terms, it represents good progress indicating that SJAP’s revenue is also increasing.
The sub-contractors and suppliers of the Zhongshan Projects are reputable entities that in the management’s opinion they are honorable persons or entities who employing their funds in and are working on the Zhongshan Project, such that the project will be progressed smoothly.
Note (16) Current Liabilities:
| June 30, 2014 | Note | |||||
| Current liabilities | ||||||
| Accounts payable and accruals | 19,783,024 | 16.A | ||||
| Billings in excess of cost and estimated earnings on uncompleted contracts | 3,521,421 | |||||
| Dividend Payables | 3,146,987 | 16 B | ||||
| Due to a director | 3,762,108 | |||||
| Other payables | 11,660,708 | 16.C | ||||
| Short term bank loan | 4,063,059 | |||||
| 45,937,307 | ||||||
Note 16A: Accounts payables and accrued expenses clarification:
Our current trading environment is limited to a number of suppliers who offer prolonged credit terms means that most purchases are paid for in cash or short credit terms (7 to 10 days), and in a way this allows us better bargaining ability to obtain cash discounts resulting in the low trade account payables balance of $19,783,024 about 10.53% of total sales of $188 million for the reasons stated below:
Our main Account Payables during Q2 2014 were generated from the following activities:
| 1. | We supply the following cost elements: our own staff, engineering and technology that enhanced our profit margins and reduced the overall cost of sales. Consulting and services (“C&S”) since inception is the major contributor of income to date and cost of goods sold averaging 47 %, and 95 % for CA and SIAF, respectively derived from its respective C&S during the fiscal year 2013. |
| 2. | Implementation, supervision, training and associated management work and most of the building sub-contractors worked at fixed costs; consequently, profit margins are contained providing ample opportunity for expanded credit terms. For contracts related to the construction of farms we use plants, equipment, parts and components that were specially manufactured and made as per our own design and engineering by local manufacturers and suppliers (who carry a high amount of initial development costs and inventories for us based on the understanding that we would pay for the deliveries of goods sold within shorter trading terms such that they could afford to carry such costs). We pay promptly in this respect and believe that, as time has passed, our track record has earned our excellent credibility with all of our suppliers and sub-contractors. |
| 3. | Fish sales started gradually in late 2011, and the cost of sales was averaged at 77% for Q2 2014, respectively (the bulk of the cost came from the supplies of baby fingerlings and the live bait as the main fish feed), and customary trading terms of Chinese suppliers is on a cash on delivery basis, and suppliers who provide short credit terms presently is limited to no more than a select few. |
| - 22 - |
| 4. | Cattle sales at SJAP’s own cattle stations and from its cooperative farmers started in 2011 at lower profit margins compared to the sales of fish and the cost of sales was averaged at 75% for Q2 2014; it is also customary in China to pay for the young live cattle by cash on delivery. The Enping cattle farm started to buy young cattle in 2011 and started sales of mature cattle in 2012; cost of sales is averaged at 88%for Q2 2014. Most of the young cattle supplies were from small primary producers (local small farmers) who did not have great financial resources; as such we paid for these supplies of young cattle in cash on delivery or short credit term after delivery. |
| 5. | In SJAP, the bulk of our fertilizers were sold to farmers who are growing pastures and crops for us such that their fertilizer sales were kept as book entries that would be offset with the pastures and crops that we would buy back from them. In the case of HSA, which is a developing stage company in fertilizer manufacturing, prolonged credit term facilities have not been established for its purchase of raw materials. |
| 6. | Bulk livestock feed are produced by regional cooperative growers under contract to us and they use our supply of fertilizer and seeds that represented the main cost components enhancing cost of sales, which average is at 51 %for Q22014. Again, sale of fertilizer is held on credit against crops and pasture grass purchased from them, as well as bulk livestock feed sold to them for cattle rearing, and reconciled once cattle are purchased from them. |
Note (16.B): Series F Non-convertible preferred stock
On August 22, 2012, the Company’s Board of Directors declared that the Company’s stockholders were entitled to receive one share of restricted Series F Non-convertible Preferred Stock for every 100 shares of Common Stock owned by the stockholders as of September 28, 2012, with lesser or greater amounts being rounded up to the nearest 100 shares of Common Stock for purpose of the computing the dividend. The holders of record of shares of Series F Non - Convertible Preferred Stock shall be entitled to a coupon payment directly from the Company at the redemption rate of $3.40 per share and be payable on May 30, 2014. During Q1 2013, the transfer agent of the Company recorded 924,180 shares of Series F Non-Convertible preferred stock on the account. However, the Company did not issue physical shares and only issued coupons to notify respective shareholders on that date. These 924,180 Series F shares, were based on numbers of shares of Common Stock as of September 28, 2012 of 91,931,287 shares, calculated at one share of Series F Non-Convertible preferred stock for every 100 shares of Common Stock with decimal number of shares being rounded up to one. Once payment of $3.40 per share is made the F shares will be voided and will be cancelled in full. As of August 8th 2014, payments of the F series shares has not been effected due to the F series shares were not issued physically but in book entry form that created complication that will need to be resolved before payments can be effected. In this respect the Company is working to rectify the situation and expecting to resolve the matter and effect payment on or before the end of the year.
Note (16C): Analysis of Other Payables:
As of June 30 2014, other payables totaling $11,660,708 composed of the following:
During the six months ended June 30, 2014, the Company issued Promissory notes amounting to $3,849,593 to unrelated third parties for advances granted by third parties collectively to the Company (and/or to its subsidiaries) that are personally guaranteed by a director, repayable within two (2) years at interest free term. Promissory notes could be repaid either by cash or in shares of the Company or a combination thereof. If shares settled debt amounts, the respective share conversion rates will be determined by both parties at the time of settlement. During Q22014 we redeemed $5,530,465 of Promissory Notes for advances granted by third parties in fiscal year 2012 as well as in early months of 2013 by the issuance of shares leaving a balance of $1,944,125 of Promissory Notes still due and outstanding as of June 30, 2014.
A grant of $2,406,143 was received from the Chinese government to SJAP for the development of a certain project; however if SJAP will not be able to complete the project, it will have to repay the grant to the Government. As of June 30 2014, as work is in progress on the said project but it is not yet completed, the grant is recorded as other payables.
During the six months ended June 30, 2014, other advances provided by other unrelated third parties collectively to our subsidiaries with no fixed term of repayment at interest free terms that do not have any promissory note or agreement but verbal understandings. These sums amount to $7,310,440 unpaid and outstanding as of June 30, 2014.
| - 23 - |
Part C. Six Months Ended June 30, 2014 Compared to Six Months Ended June 30, 2013 (presented in summarized Charts below);
Revenue:
Revenues increased by $78,452,213 or 71.64 % to $187,960,293 for the six months ended June 30, 2014 from $109,508,080 for the six months ended June 30, 2013. The increase was primarily due to the increase of revenue generated from our fishery, organic fertilizer, and corporate and others operations and the maturity of on-going divisional businesses improving their revenues.
The following chart illustrates the changes by category from the six months ended June 30, 2014 to June 30, 2013.
| Revenue | ||||||||||||
| 2014 | 2013 | |||||||||||
| Category | Q1- Q2 | Q1-Q2 | Difference | |||||||||
| $ | $ | $ | ||||||||||
| Fishery | 83,714,940 | 42,122,633 | 41,592,307 | |||||||||
| Plantation | 3,271,940 | 3,554,986 | (283,046 | ) | ||||||||
| Organic fertilizer (merger with beef) | 61,759,714 | 31,824,277 | 29,935,437 | |||||||||
| Cattle farm | 14,668,506 | 14,783,718 | (115,212 | ) | ||||||||
| Corporate and others | 24,545,192 | 17,222,466 | 7,322,726 | |||||||||
| Total | 187,960,292 | 109,508,080 | 78,452,212 | |||||||||
Cost of Goods Sold and Services:
Cost of goods sold and services increased by $58,508,446 or 85.30% to $127,103,262 for the six months ended June 30, 2014 from $68,594,816 for the six months ended June 30, 2013. The increase was primarily due to the Company increased our fishery, plantation, beef, organic fertilizer, cattle farm and corporate and others operations for six months ended June 30, 2014 as compared for the six months ended June 30, 2013.
The following chart illustrates the changes by category from the six months ended June 30, 2014 to June 30, 2013.
| Cost of goods sold and services | ||||||||||||
| 2014 | 2013 | |||||||||||
| Category | Q1- Q2 | Q1-Q2 | Difference | |||||||||
| $ | $ | $ | ||||||||||
| Fishery | 50,316,432 | 28,354,892 | 21,961,540 | |||||||||
| Plantation | 962,949 | 1,260,957 | (298,008 | ) | ||||||||
| Organic fertilizer (merge with beef) | 40,114,860 | 18,765,582 | 21,349,278 | |||||||||
| Cattle farm | 13,975,273 | 8,913,731 | 5,061,542 | |||||||||
| Corporate and others | 21,733,748 | 11,299,654 | 21,733,748 | |||||||||
| Total | 127,103,262 | 68,594,816 | 69,808,100 | |||||||||
| - 24 - |
Gross Profit
Gross profit increased by $19,943,767 or 48.75% to $60,857,031 for the six months ended June 30, 2014 from $40,913,264 for the six months ended June 30, 2013. The increase was primarily due to the corresponding increase in operation revenues. The increase was primarily due to the corresponding increase in scale of operation of revenues from plantation, beef, and organic fertilizer..
The following chart illustrates the changes by category from the six months ended June 30, 2014 to June 30, 2013.
The gross profit by category is as follows:
| Category | Q1- Q2 | Q1- Q2 | Difference | |||||||||
| $ | $ | $ | ||||||||||
| Fishery | 33,398,508 | 13,767,741 | 19,630,767 | |||||||||
| Plantation | 2,308,991 | 2,294,029 | 14,962 | |||||||||
| Organic fertilizer | 21,644,854 | 13,058,695 | 8,586,159 | |||||||||
| Cattle farm | 693,233 | 5,869,987 | (5,176,754 | ) | ||||||||
| Corporate and others | 2,811,444 | 5,922,812 | (3,111,368 | ) | ||||||||
| Total | 60,857,030 | 40,913,264 | 19,943,766 | |||||||||
General and Administrative Expenses and Interest Expenses
General and administrative expenses and interest expenses (including depreciation and amortization) increased by $2,244,045 or 57% to $6,619,747 for the six months ended June 30, 2014 from $3,925,702 for the six months ended June 30, 2013. The increase was primarily due to (i) increase in wages and salaries payments paid for incentives compensation to our staffs by the issuance of shares amounting to $516,248 for the six months ended June 30, 2014 as compared to $133,744 for the six months ended June 30, 2013 and (ii) increase in Office and corporate expenses paid for overseas professional services of $464,306 for the six months ended June 30, 2014 from $Nil for the six months ended June 30, 2013.
| Category | 2014 Q1-Q2 | 2013 Q1-Q2 | Difference | |||||||||
| $ | $ | $ | ||||||||||
| Office and corporate expenses | 2,954,272 | 1,328,662 | 1,625,610 | |||||||||
| Wages and salaries | 973,530 | 962,101 | 11,429 | |||||||||
| Traveling and related lodging | 91,344 | 34,998 | 56,346 | |||||||||
| Motor vehicles expenses and local transportation | 92,351 | 73,893 | 18,458 | |||||||||
| Entertainments and meals | 74,680 | 64,850 | 9,830 | |||||||||
| Others and miscellaneous | 349,582 | 300,881 | 48,701 | |||||||||
| Depreciation and amortization | 1,414,496 | 1,048,307 | 366,189 | |||||||||
| Sub-total | 5,950,254 | 3,813,692 | 2,136,562 | |||||||||
| Interest expenses | 219,493 | 112,010 | 107,483 | |||||||||
| Total | 6,169,747 | 3,925,702 | 2,244,045 | |||||||||
| - 25 - |
Depreciation and Amortization
Depreciation and amortization increased by $366,189 or 34.93% to $1,414,496 for the six months ended June 30, 2014 from $1,048,307 for the six months ended June 30, 2013. The increase was primarily due to the increase of depreciation by $492,602 to $1,131,273 for the six months ended June 30, 2014 from depreciation of $638,671 for the six months ended June 30, 2013, and the increase of amortization by $80,565 to $1,056,859 for six months ended June 30, 2014 from amortization of $976,294 for the six months ended June 30, 2013.
In this respect, total depreciation and amortization amounted to $2,188,132 for the six months ended June 30, 2014, out of which amount $1,414,496 was booked under General and administration expenses and $773,636 was booked under cost of goods sold; whereas total depreciation and amortization was at $1,614,965 for the six months ended June 30, 2013 and out of which amount, $1,048,307 was booked under General and Administration expenses and $566,658 was booked under cost of goods sold.
| - 26 - |
Part D. MD & A on Unaudited Consolidated Balance Sheet of Continued Operations for the Six months ended June 30 2014(Q2 2014) compared to the six months ended June 30 2013
| ASSETS | $ | $ | $ | |||||||||||||
| Current assets | ||||||||||||||||
| Cash and cash equivalents | 3,631,566 | 9,391,449 | (5,759,883 | ) | B | |||||||||||
| Inventories | 25,937,918 | 18,887,433 | 7,050,485 | 9 | ||||||||||||
| Costs and estimated earnings in excess of billings on uncompleted contracts | 757,303 | 1,286,775 | (529,472 | ) | ||||||||||||
| Deposits and prepaid expenses | 93,203,999 | 52,091,997 | 41,112,002 | 10 | ||||||||||||
| Accounts receivable | 117,184,211 | 82,373,870 | 34,810,341 | 11 | ||||||||||||
| Other receivables | 11,026,053 | 6,374,272 | 4,651,781 | |||||||||||||
| Total current assests | 251,741,050 | 170,405,796 | 81,335,254 | |||||||||||||
| Property and equipment | ||||||||||||||||
| Property and equipment, net of accumulated depreciation | 50,081,031 | 21,019,253 | 29,061,778 | 12 | ||||||||||||
| Construction in progress | 72,395,107 | 38,089,142 | 34,305,965 | 13 | ||||||||||||
| Land use rights, net of accumulated amortization | 59,871,240 | 56,379,855 | 3,491,385 | 14 | ||||||||||||
| Total property and equipment | 182,347,378 | 115,488,250 | 66,859,128 | |||||||||||||
| Other assets | ||||||||||||||||
| Goodwill | 724,940 | 724,940 | - | |||||||||||||
| Proprietary technologies, net of accumulated amortization | 11,771,492 | 7,906,667 | 3,864,825 | 15 | ||||||||||||
| License rights | 1 | |||||||||||||||
| Total other assets | 12,496,432 | 8,631,608 | 3,864,824 | |||||||||||||
| Total assets | 446,584,860 | 294,525,654 | 152,059,206 | |||||||||||||
| Current liabilities | 16 | |||||||||||||||
| Accounts payable and accrued expenses | 19,783,024 | 8,368,834 | 11,414,190 | |||||||||||||
| Billings in excess of costs and estimated earnings on uncompleted contracts | 3,521,421 | 922,375 | 2,599,046 | |||||||||||||
| Due to a director | 3,762,108 | 3,257,085 | 505,023 | |||||||||||||
| Dividends payable | 3,146,987 | 3,146,987 | ||||||||||||||
| Other payables | 11,660,708 | 10,259,178 | 1,401,530 | |||||||||||||
| Short term bank loan | 4,063,059 | 2,265,849 | 1,797,210 | |||||||||||||
| Total current liabilities | 45,937,307 | 28,220,308 | 17,716,999 | |||||||||||||
| Non-current liabilities | ||||||||||||||||
| Bonds payable | 1,725,000 | - | 1,725,000 | |||||||||||||
| Long term debts | 2,616,610 | 178,031 | 2,438,579 | |||||||||||||
| Total non-current liabilities | 4,341,610 | 178,031 | 4,163,579 | |||||||||||||
| Stockholders equity | ||||||||||||||||
| Preferred stock | ||||||||||||||||
| Series A preferred stock | - | - | - | |||||||||||||
| Series B convertible preferred stock | 7,000 | 7,000 | - | |||||||||||||
| Series F Non-convertible preferred stock | - | - | - | 17 | ||||||||||||
| Common stock | 160,198 | 120,174 | 40,024 | |||||||||||||
| Additional paid-in capital | 118,369,556 | 100,615,051 | 17,754,505 | |||||||||||||
| Retained earnings | 221,945,794 | 134,574,019 | 87,371,775 | |||||||||||||
| Accumulated other comprehensive income | 5,600,438 | 5,139,044 | 461,394 | |||||||||||||
| Treasury stock | (1,250,000 | ) | (1,250,000 | ) | - | |||||||||||
| Total SIAF Inc. and subsidaries' equity | 344,832,986 | 239,205,288 | 105,627,698 | |||||||||||||
| Non-controlling interest | 51,472,857 | 26,922,027 | 24,550,830 | |||||||||||||
| Total stockholders' equity | 396,305,843 | 266,127,315 | 130,178,528 | |||||||||||||
| Total liabilities and stockholders' equity | 446,584,760 | 294,525,654 | 152,059,106 |
| - 27 - |
Income Taxes
The Company is incorporated in the State of Nevada, in the United States of America. The Company has no trading operations in United States of America and no US corporate tax has been provided for in the consolidated financial statements of the Company.
Undistributed Earnings of Foreign Subsidiaries
The Company intends to use the remaining accumulated and future earnings of foreign subsidiaries to expand operations outside the United States and accordingly, undistributed earnings of foreign subsidiaries are considered to be indefinitely reinvested outside the United States and no provision for U.S. Federal and State income tax or applicable dividend distribution tax has been provided thereon.
The Company failed to file US tax returns for the years ended December 31, 2007 through December 31, 2012 in compliance with US Treasury Internal Revenue Service Code. The Company has reviewed its tax position with the assistance US tax professionals and believes that there will be no taxes and no penalties assessed by the Internal Revenue Service in the United States of America. The Company has appointed US tax professionals to assist in filing these income tax returns. In this respect we filed our Tax returns with the IRS in July, 2014.
No EIT has been provided in the financial statements of SIAF, CA, JHST, JHMC, JFD, HSA , QZH and SJAP since they are exempt from EIT for the six months ended June 30, 2014 and 2013 as they are within the agriculture, dairy and fishery sectors.
CA, CS and CH are international business companies incorporated in Belize, and are exempt from corporate tax in Belize.
No Hong Kong profits tax has been provided in the consolidated financial statements, since TRW did not earn any assessable profits arising in Hong Kong for the six months ended June 30, 2014 and 2013.
No Macau Corporate income tax has been provided in the consolidated financial statements, since APWAM and MEIJI did not earn any assessable profits for the six months ended June 30, 2014 and 2013.
No Sweden Corporate income tax has been provided in the consolidated financial statements, since SIAFS incurred a tax loss for the six months ended June 30, 2014.
No deferred tax assets and liabilities are of June 30, 2014 and December 31, 2013 since there was no difference between the financial statements carrying amounts and the tax bases of assets and liabilities using enacted tax rates in effect in the period in which the differences are expected to reverse.
Off Balance Sheet Arrangements:
None.
Liquidity and Capital Resources
As of June 30, 2014, unrestricted cash and cash equivalents amounted to $3,631,566 (see notes to the consolidated financial statements), and our working capital as of June 30, 2014 was $205,803,643.
.
| Contractual Obligations | Less than 1 year | 1-3years | 3-5 years | More than 5 years | Total | |||||||||||||||
| Short Term Bank Loan | 4,063,059 | 4,063,059 | ||||||||||||||||||
| Bonds payable | 1,725,000 | 1,725,000 | ||||||||||||||||||
| Long Term Debts | 2,616,610 | 2,616,610 | ||||||||||||||||||
| Promissory Notes | 1,944,125 | 1,944,125 | ||||||||||||||||||
| Issued to third parties | - | |||||||||||||||||||
As of June 30 2014, our total long-term debts are as follows:
Cash provided by operating activities amounted to $19,132,816 for the six months ended June 30, 2014. This compares with cash provided by operating activities totaled $16,120,653 for the six months ended June 30, 2013. The increase in cash flows from operations primarily resulted from the increase of other payables of 10,406,922 for the six months ended June 30, 2014 from $3,608,856 for the six months ended June 30, 2013.
Cash used in investing activities totaled $19,028,527 for the six months ended June 30, 2014.This compares with cash used in investing activities totaling $14,086,955 for the six months ended June 30, 2014. The increase in cash flows used in investing activities primarily resulted from payment for construction of $15,655,682 for the six months ended June 30, 2014 from $13,596,632 for the six months ended June 30, 2013.
Cash provided by financing activities totaled $2,436,193 for the six months ended June 30, 2014. This compares with cash used in financing activities totaling $951,308 for the six months ended June 30, 2013. The increase cash provided by financing activities due to the increase of long term loan advance of $2,436,193.
| - 28 - |
Acquisition of SFJVC’s and further acquisition plan:
An SFJVC agreement typically contains an option clause for further investment. Initially, the China Developer of project companies invite us to invest in their venture. If management feels compelled it carries out an in-depth study of the target company including legal due diligence, business plan, budget and projected financial information. The final decision is made through the resolution of the Company’s Board of Directors. If the decision is made to proceed with an investment, there is first formed an SFJVC, within which in turn the Company acquires further equity interest. The acquisition price of such interest is determined in accordance to the book value of the SFJVC as of the acquisition date. Consideration generally consists in part of cash and in part of contract against trade debts owed by the China Developer due to Consulting & Services fees charged to the China Developer by the Company in accordance with the Consulting & Services agreement. Project companies’ record development cost as construction in progress and treat the amount due to us as partial investment in new SFJVC.
The Company’s expenditures as the consulting and service provider providing turnkey services to the China Developer for the development of the project include (i) administrative and operational expenses provided for and incurred in the project (charged and recorded under general and administrative operation expenses), billable to the China Developer, (ii) other development expenditures (inclusive of subcontractors’ and sub-suppliers’ cost plus mark-up) billable to the Developer, as well. Consulting & Services fees are exclusively billed to the 3rdparty China Developer, and not to the future SFJVC companies.
We plan to acquire further SFJVC’s at the time they will be formed officially after their approval by relevant Chinese Authorities with details shown in the Table below:
| Acquisition by which subsidiary | Estimated time of SFJVC being formed | Estimated time of completion of acquisition | Estimated Total consideration | Deposit paid up to date | Deposit paid is equivalent to % of equity | Estimated time of progress payments | ||||||||
| Enping Prawn PF1 | CA | June 2014 | August 2014 | $20.94m | $14.45 m | 56% | Q1 to Q2 2014 | |||||||
| Zhongshan Prawn PF2 | CA | Phase 3 Work still in progress, targeting completion Q3 2014 | August 2015 | $26.20 m | $9.88 m | 33% | Q4 2013 & all year round 2014 | |||||||
| Fish & eel Farm 2 | CA | Phase 3 & 4 work are in progress targeting completion Q4 2015 | August. 2016 | $26.22 m | $6.0 m | 23% | Q4 2013 & all year round 2014 & 2015 | |||||||
| Cattle Farm 2 | MEIJI | Final work is still in progress | August 2014 | $15.88 m | $5.58 m | 35% | On or before June 30 2014 | |||||||
| WXC businesses | SIAF | Work is in progress until end 2015 | Not yet determined | Not fully determined | $4.08 m | Not yet know | Partially in 2014. | |||||||
| NaWei wholesale centers | SIAF | Work is in progress until end 2015 | Phase (1) March 2014, new Phases are pending | Not fully determined | $1.03 m | Not yet know | Partially in 2014. |
In accordance with our contract, prior to the official formation of the SFJVC’s the Company will pay an initial deposit and additional deposits as pre-payments to the developer (or owner) of the project as consideration toward future acquisition of the SFJVC upon its official formation.
The total consideration for each purchase of SFJVC is based on its book value at that time of official formation having injected all of the related project’s development assets and liabilities into the SFJVC. As such the required acquisition cost is funded partly by cash and partly by the set-off receivable due on the consulting and service fee.
| - 29 - |
CRITICAL ACCOUNTING POLICIES
BASIS OF PRESENTATION
The unaudited consolidated financial statements for the six months ended June 30, 2014 are prepared in accordance with generally accepted accounting principles in the United States of America (“US GAAP”).
The unaudited quarterly financials for the six months ended June 30, 2014 results are for the six months then ended and do not necessarily indicate the results for a full year. The information included in this interim report should be read in conjunction with the information included in the Company’s annual report on Form 10-K for the fiscal year ended December 31, 2013.
BASIS OF CONSOLIDATION
The consolidated financial statements include the financial statements of SIAF, its subsidiaries Capital Award, CS, CH, TRW, MEIJI, JHST, JFD, JHMC, HSA, APWAM, SIAFS and its variable interest entities SJAP and QZH. All material inter-company transactions and balances have been eliminated in consolidation. The results of companies acquired or disposed of during the year are included in the consolidated Financial Statements from the effective date of acquisition.
BUSINESS COMBINATIONS
The Company adopted the accounting pronouncements relating to business combinations (primarily contained in ASC Topic 805 “Business Combinations”), including assets acquired and liabilities assumed arising from contingencies. These pronouncements established principles and requirements for how the acquirer of a business recognizes and measures in its financial statements the identifiable assets acquired, the liabilities assumed, and any non-controlling interest in the acquire as well as provides guidance for recognizing and measuring the goodwill acquired in the business combination and determines what information to disclose to enable users of the financial statements to evaluate the nature and financial effects of the business combination. In addition, these pronouncements eliminate the distinction between contractual and non-contractual contingencies, including the initial recognition and measurement criteria and require an acquirer to develop a systematic and rational basis for subsequently measuring and accounting for acquired contingencies depending on their nature. Our adoption of these pronouncements will have an impact on the manner in which we account for any future acquisitions.
NON - CONTROLLING INTEREST IN CONSOLIDATED FINANCIAL STATEMENTS
The Company adopted the accounting pronouncement on non-controlling interests in consolidated financial statements, which establishes accounting and reporting standards for the non-controlling interest in a subsidiary and for the deconsolidation of a subsidiary. This guidance is primarily contained in ASC Topic “Consolidation”. It clarifies that a non-controlling interest in a subsidiary is an ownership interest in the consolidated financial statements. The adoption of this standard has not had material impact on our consolidated financial statements.
USE OF ESTIMATES
The preparation of consolidated financial statements in conformity with accounting principles generally accepted in the United States requires management to make assumptions and estimates that affect the reported amounts of assets and liabilities and disclosure of contingent assets and liabilities at the dates of the consolidated financial statements and the reported amounts of revenues and expenses during the reporting periods covered thereby. Actual results could differ from these estimates. Judgments and estimates of uncertainties are required in applying the Company’s accounting policies in certain areas. The following are some of the areas requiring significant judgments and estimates: determinations of the useful lives of assets, estimates of allowances for doubtful accounts, cash flow and valuation assumptions in performing asset impairment tests of long-lived assets, estimates of the reliability of deferred tax assets and inventory reserves.
REVENUE RECOGNITION
The Company’s revenue recognition policies are in compliance with ASC 605. Sales revenue is recognized when all of the following have occurred: (i) persuasive evidence of an arrangement exists, (ii) delivery has occurred or services have been rendered, (iii) the price is fixed or determinable, and (iv), the ability to collect is reasonably assured. These criteria are generally satisfied at the time of shipment when risk of loss and title passes to the customer. Service revenue is recognized when services have been rendered to a buyer by reference to the stage of completion. License fee income is recognized on the accrual basis in accordance with the underlying agreements.
| - 30 - |
Government grants are recognized upon (i) the Company has substantially accomplished what we must be done pursuant to the terms of the policies and terms of the grant that are established by the local government; and (ii) the Company receives notification from the local government that the Company has satisfied all of the requirements to receive the government grants; and or (iii) the amounts are received.
Multiple-Element Arrangements
To qualify as a separate unit of accounting under ASC 605-25“Multiple Element Arrangements”, the delivered item must have value to the customer on a standalone basis. The significant deliverables under the Company’s multiple-element arrangements are consulting and service under development contract, commission and management service.
Revenues from the Company's fishery development services contract are performed under fixed-price contracts. Revenues under long-term contracts are accounted for under the percentage-of-completion method of accounting in accordance with the Financial Accounting Standards Board (“FASB”) Accounting Standards Codification (“ASC”) Topic 605, Revenue Recognition (“ASC 605”). Under the percentage-of-completion method, the Company estimates profit as the difference between total estimated revenue and total estimated cost of a contract and recognized that profit over the contract term. The percentage of costs incurred determines the amount of revenue to be recognized. Payment terms are generally defined by the installation contract and as a result may not match the timing of the costs incurred by the Company and the related recognition of revenue. Such differences are recorded as either costs or estimated earnings in excess of billings on uncompleted contracts or billings in excess of costs and estimated earnings on uncompleted contracts.
The Company determines a customer’s credit worthiness at the time an order is accepted. Sudden and unexpected changes in a customer’s financial condition could put recoverability at risk.
The percentage of completion method requires the ability to estimate several factors, including the ability of the customer to meet its obligations under the contract, including the payment of amounts when due. If the Company determines that collectability is not assured, we will defer revenue recognition and use methods of accounting for the contract such as the completed contract method until such time as the Company determines that collectability is reasonably assured or through the completion of the project.
For fixed-price contracts, the Company uses the ratio of costs incurred to date on the contract (excluding uninstalled direct materials) to management's estimate of the contract's total costs, to determine the percentage of completion on each contract. This method is used as management considers expended costs to be the best available measure of progression of these contracts. Contract costs included all direct material, subcontract and labor costs and those indirect costs related to contract performance, such as supplies, tool repairs and depreciation. The Company accounts for maintenance and repair services under the guidance of ASC 605 as the services provided relate to construction work. Contract costs incurred to date and expected total contract costs are continuously monitored during the term of the contract. Changes in job performance, job conditions, and estimated profitability arising from contract penalty, change orders and final contract settlements may result in revisions to the estimated profitability during the contract. These changes, which include contracts with estimated costs in excess of estimated revenues, are recognized as contract costs in the period in which the revisions are determined. Profit incentives are included in revenues when their realization is reasonably assured. At the point the Company anticipates a loss on a contract, the Company estimates the ultimate loss through completion and recognizes that loss in the period in which the possible loss was identified.
The Company does not provide warranties to customers on a basis customary to the industry; however, the customers can claim warranty directly from product manufacturers for defects in equipment or products. Historically, the Company has experienced no warranty claims.
The Company’s fishery development consultancy services revenues are recognized when the relevant services are rendered, and are subject to a Chinese business tax at a rate of 0% of the gross fishery development contract service income approved by the Chinese local government.
COST OF GOODS SOLD AND SERVICES
Cost of goods sold consists primarily of direct purchase cost of merchandise goods, and related levies. Cost of services consists primarily of direct cost and indirect cost incurred to date for development contracts and provision for anticipated losses on development contracts.
SHIPPING AND HANDLING
Shipping and handling costs related to cost of goods sold are included in general and administrative expenses, which totaled $4,316, $7,542, $10,582 and $10,850 for the three months and for the six months ended June 30, 2014 and 2013, respectively.
| - 31 - |
ADVERTISING
Advertising costs are included in general and administrative expenses, which totaled $952,924, $542, $953,054 and $542 for the three months ended and the six months ended June 30, 2014 and 2013, respectively.
CASH AND CASH EQUIVALENTS
The Company considers all highly liquid securities with original maturities of three months or less when acquired to be cash equivalents. Cash and cash equivalents kept with financial institutions in People’s Republic of China (“P.R.C”) are not insured or otherwise protected. Should any of those institutions holding the Company’s cash become insolvent, or the Company is unable to withdraw funds for any reason, the Company could lose the cash on deposit on that institution.
ACCOUNTS RECEIVABLE
The Company maintains reserves for potential credit losses on accounts receivable. Management reviews the composition of accounts receivable and analyzes historical bad debts, customer concentrations, customer credit worthiness, current economic trends and changes in customer payment patterns to evaluate the adequacy of these reserves. Terms of the sales vary. Reserves are recorded primarily on a specific identification basis.
The standard credit period of the Company’s most of customers is three months. Any amount that has an extended settlement date of over one year is classified as a long term receivable. Management evaluates the collectability of the receivables at least quarterly. There were no bad debts written off for the six months ended June 30, 2014 or June 30, 2013.
INVENTORIES
Inventories are valued at the lower of cost (determined on a weighted average basis) and net realizable value. Costs incurred in bringing each product to its location and conditions are accounted for as follows:
| • | raw materials - purchase cost on a weighted average basis; |
| • | manufactured finished goods and work-in-progress - cost of direct materials and labor and a proportion of manufacturing overhead based on normal operation capacity but excluding borrowing costs; and |
| • | retail and wholesale merchandise finished goods - purchase cost on a weighted average basis. |
Net realizable value is the estimated selling price in the ordinary course of business, less estimated costs of completion and the estimated costs necessary to make the sale.
PROPERTY AND EQUIPMENT
Property and equipment are stated at cost less accumulated depreciation and any accumulated impairment losses. Such costs include the cost of replacing parts that are eligible for capitalization when the cost of replacing the parts is incurred. The assets’ residual values, useful lives and depreciation methods are reviewed, and adjusted if appropriate, at the end of each year.
Depreciation is calculated on a straight-line basis over the estimated useful life of the assets.
| Milk cows | 10 years | |
| Plant and machinery | 5 - 10 years | |
| Structure and leasehold improvements | 10 -20 years | |
| Mature seed and herbage cultivation | 20 years | |
| Furniture, fixtures and equipment | 2.5 - 10 years | |
| Motor vehicles | 5 -10 years |
An item of property and equipment is removed from the accounts upon disposal or when no future economic benefits are expected to arise from the continued use of the asset. Any gain or loss arising on disposal of the asset (calculated as the difference between the net disposal proceeds and the carrying amount of the item) is included in the consolidated statements of income in the period the item is disposed.
| - 32 - |
GOODWILL
Goodwill is an asset representing the fair economic benefits arising from other assets acquired in a business combination that are not individually identified and separately recognized. Goodwill is tested for impairment on an annual basis at the end of the company’s fiscal year, or when impairment indicators arise. The Company uses a fair-value based approach to test for impairment at the level of each reporting unit. The Company directly acquired MEIJI which is engaged in Hu Plantation. As a result of this acquisition, the Company recorded goodwill in the amount of $724,940. This goodwill represents the fair value of the assets acquired in these acquisitions over the cost of the assets acquired.
PROPRIETARY TECHNOLOGIES
The Company has determined that technological feasibility is established at the time a working model of products is completed. Master license of stock feed manufacturing technology was acquired and the costs of acquisition were capitalized as proprietary technologies when technological feasibility had been established. Proprietary technologies are intangible assets of finite lives. Proprietary technologies are amortized using the straight line method over their estimated lives of 25 years.
An aromatic cattle-feeding formula was acquired and the costs of acquisition are capitalized as proprietary technologies when technological feasibility has been established. Cost of acquisition on aromatic cattle-feeding formula is amortized using the straight-line method over its estimated life of 25 years.
The cost of sleep cod breeding technology license is capitalized as proprietary technologies when technological feasibility has been established. Cost of granting sleep cod breeding technology license is amortized using the straight-line method over its entitled life of 25 years.
Bacterial cellulose technology license and related trademark are capitalized as proprietary technologies when technological feasibility has been established. Cost of license and related trademark is amortized using the straight-line method over its estimated life of 20 years.
Management evaluates the recoverability of proprietary technologies on an annual basis of the end of the company’s fiscal year, or when impairment indicators arise. As required by ASC Topic 350 “Intangible - Goodwill and Other”, the Company uses a fair-value based approach to test for impairment.
CONSTRUCTION IN PROGRESS
Construction in progress represents direct costs of construction as well as acquisition and design fees incurred. Capitalization of these costs ceases and the construction in progress is transferred to property and equipment when substantially all the activities necessary to prepare the assets for their intended use are completed. No depreciation is provided until construction is completed and the asset is ready for its intended use.
LAND USE RIGHTS
Land use rights represent acquisition of land use right rights of agriculture land from farmers and are amortized on the straight line basis over the respective lease periods. The lease period of agriculture land is in the range from 10 years to 60 years. Land use rights purchase prices were determined in accordance with the P.R.C Government’s minimum lease payments of agriculture land and mutually agreed between the company and the vendors. No independent professional appraiser performed a valuation of land use rights at the balance sheet dates.
CORPORATE JOINT VENTURE
A corporation formed, owned, and operated by two or more businesses (ventures) as a separate and discrete business or project (venture) for their mutual benefit is considered to be a corporate joint venture. Investee entities, in which the company can exercise significant influence, but not control, are accounted for under the equity method of accounting. Under the equity method of accounting, the company’s share of the earnings or losses of these companies is included in net income.
A loss in value of an investment that is other than a temporary decline is recognized as a charge to operations. Evidence of a loss in value might include, but would not necessarily be limited to absence of an ability to recover the carrying amount of the investment or inability of the investee to sustain an earnings capacity that would justify the carrying amount of the investment.
VARIABLE INTEREST ENTITY
An entity (investee) in which the investor has obtained less than a majority-owned interest, according to the Financial Accounting Standards Board (FASB). A variable interest entity (VIE) is subject to consolidation if a VIE is an entity meeting one of the following three criteria as elaborated in ASC Topic 810-10, Consolidation.
| - 33 - |
| (a) | equity-at-risk is not sufficient to support the entity's activities |
| (b) | as a group, the equity-at-risk holders cannot control the entity; or |
| (c) | the economics do not coincide with the voting interest. |
If a firm is the primary beneficiary of a VIE, the holdings must be disclosed on the balance sheet. The primary beneficiary is defined as the person or company with the majority of variable interests
TREASURY STOCK
Treasury stock consists of a Company’s own stock which has been issued, but is subsequently reacquired by the Company. Treasury stock does not reduce the number of shares issued but does reduce the number of shares outstanding. These shares are not eligible to receive cash dividends. Accounting for excesses and deficiencies on treasury stock transactions is governed by ASC 505-30-30.
State laws and federal agencies closely regulate transactions involving a company’s own capital stock, so the purchase of outstanding shares and converting them into treasury shares must have a legitimate purpose. Some of the most common reasons for purchasing outstanding shares are as follows:
(i) to meet additional stock needs for various reasons, including newly implemented stock option plans, the issuance stock for convertible bonds or convertible preferred stock, or a stock dividend;
(ii) to eliminate the ownerships interests of a stockholder;
(iii) to increase the market price of the stock that returns capital to shareholders; and
(iv) to potentially increase earnings per share of the stock by decreasing the shares outstanding on the same earnings.
The cost method of accounting for treasury stock shares has been adopted by the Company. The purchase of outstanding shares is treated as a temporary reduction in shareholders’ equity in view of the expectation to reissue the shares instead of retiring them. When the Company reissues the treasury shares, the temporary account is eliminated. The cost of treasury stock shares reacquired is charged to a contra account, in this case a contra equity account that reduces the stockholder equity balance.
INCOME TAXES
The Company accounts for income taxes under the provisions of ASC 740 “Accounting for Income Taxes”. Under ASC 740, deferred tax assets and liabilities are determined based on the difference between the financial statement carrying amounts and the tax bases of assets and liabilities using enacted tax rates in effect in the years in which the differences are expected to reverse.
The provision for income tax is based on the results for the year as adjusted for items, which are non-assessable or disallowed. It is calculated using tax rates that have been enacted or substantively enacted at the balance sheet date. Deferred taxes area accounted for using the balance sheet liability method in respect of temporary differences arising from differences between the carrying amount of assets and liabilities in the financial statements and the corresponding tax basis used in the computation of assessable tax profit. In principle, deferred tax liabilities are recognized for all taxable temporary differences, and deferred tax assets are recognized to the extent that it is probable that taxable profit will be available against which deductible temporary differences can be utilized.
Deferred income taxes are calculated at the tax rates that are expected to apply to the period when the asset is realized or the liability is settled. Deferred tax is charged or credited in the income statement, except when it relates to items credited or charged directly to equity, in which case the deferred tax is also adjusted in the equity accounts. Deferred tax assets and liabilities are offset when they relate to income taxes levied by the same taxation authority and the Company intends to settle its current tax assets and liabilities on a net basis. ASC 740 also prescribes a more-likely-than-not threshold for financial statement recognition and measurement of a tax position taken, or expected to be taken, in a tax return. ASC 740 also provides guidance related to, among other things, classification, accounting for interest and penalties associated with tax positions, and disclosure requirements. Any interest and penalties accrued related to unrecognized tax benefits will be recorded in tax expense.
POLITICAL AND BUSINESS RISK
The Company's operations are carried out in the PRC. Accordingly, the Company's business, financial condition and results of operations may be influenced by the political, economic and legal environment in the PRC, and by the general state of the PRC's economy. The Company's operations in the PRC are subject to specific considerations and significant risks not typically associated with companies in North America and Western Europe. The Company's results may be adversely affected by changes in governmental policies with respect to laws and regulations, anti-inflationary measures, currency conversion and remittance abroad, and rates and methods of taxation, among other things.
| - 34 - |
IMPAIRMENT OF LONG-LIVED ASSETS AND INTANGIBLE ASSETS
In accordance with ASC 360, “Property, Plant and Equipment”, long-lived assets to be held and used are analyzed for impairment whenever events or changes in circumstances indicate that the related carrying amounts may not be recoverable. The Company reviews the carrying amount of its long-lived assets, including intangibles, for impairment, at the end of each fiscal year. An asset is considered impaired when estimated future cash flows are less than the carrying amount of the asset. In the event the carrying amount of such asset is considered not recoverable, the asset is adjusted to its fair value. Fair value is generally determined based on discounted future cash flow. As of June 30, 2014 and December 31, 2013, the Company determined no impairment losses were necessary.
EARNINGS PER SHARE
As prescribed in ASC Topic 260 “Earning per Share”, Basic Earnings per Share (“EPS”) is computed by dividing net income available to common stockholders by the weighted average number of common stock shares outstanding during the year. Diluted EPS is computed by dividing net income available to common stockholders by the weighted-average number of common stock shares outstanding during the year plus potential dilutive instruments such as stock options and warrants. The effect of stock options on diluted EPS is determined through the application of the treasury stock method, whereby proceeds received by the Company based on assumed exercises are hypothetically used to repurchase the Company’s common stock at the average market price during the period.
For the three months ended June 30, 2014 and 2013, basic earnings per share attributable to Sino Agro Food, Inc. and subsidiaries common stockholders amount to $0.15 and $0.13, respectively. For the six months ended June 30, 2014 and 2013, basic earnings per share attributable to Sino Agro Food, Inc. and subsidiaries common stockholders amount to $0.29 and $0.28, respectively.
For the three months ended June 30, 2014 and 2013, diluted earnings per share attributable to Sino Agro Food, Inc. and its subsidiaries’ common stockholders amounted to $0.14 and $0.12, respectively. For the six months ended June 30, 2014 and 2013, diluted earnings per share attributable to Sino Agro Food, Inc. and its subsidiaries’ common stockholders amounted to $0.28 and $0.27, respectively.
FOREIGN CURRENCY TRANSLATION
The reporting currency of the Company is the U.S. dollar. The functional currency of the Company is the Chinese Renminbi (RMB). For those entities whose functional currency is other than the U.S. dollars, all assets and liabilities are translated into U.S. dollars at the exchange rate on the balance sheet date; shareholder equity is translated at historical rates and items in the statements of income and of cash flows are translated at the average rate for the period.
Because cash flows are translated based on the weighted average translation rate, amounts related to assets and liabilities reported in the statements of cash flows will not necessarily agree with changes in the corresponding balances in the balance sheets. Translation adjustments resulting from this process are included in accumulated other comprehensive income in the consolidated statements of equity.
For the six months ended June 30, 2013
Translation gains and losses that arise from exchange rate fluctuations on transactions denominated in a currency other than the functional currency are included in the statements of income and comprehensive income as incurred. The balance sheet amounts with the exception of equity as of June 30, 2013 and December 31, 2012 were translated at RMB 6.18 to $1.00 and RMB 6.29 to $1.00, respectively. The average translation rates applied to the consolidated statements of income and comprehensive income and of cash flows for the six months ended June 30, 2013 and June 30, 2012 were RMB 6.24 to $1.00 and RMB 6.14 to $1.00, respectively.
For the six months ended June 30, 2014
Translation gains and losses that arise from exchange rate fluctuations on transactions denominated in a currency other than the functional currency are included in the statements of income and comprehensive income as incurred. The balance sheet amounts with the exception of equity as of June 30, 2014 and December 31, 2013 were translated at RMB 6.15 to $1.00 and RMB 6.10 to $1.00, respectively. The average translation rates applied to the consolidated statements of income and comprehensive income and of cash flows for the six months ended June 30, 2014 and June 30, 2013 were RMB 6.13 to $1.00 and RMB 6.24 to $1.00, respectively.
ACCUMULATED OTHER COMPREHENSIVE INCOME
ASC Topic 220 “Comprehensive Income” establishes standards for reporting and displaying comprehensive income and its components in financial statements. Comprehensive income is defined as the change in stockholders’ equity of a business enterprise during a period from transactions and other events and circumstances from non-owner sources. The comprehensive income for all periods presented includes both the reported net income and net change in cumulative translation adjustments.
| - 35 - |
RETIREMENT BENEFIT COSTS
PRC state managed retirement benefit programs are defined contribution plans and the payments to the plans are charged as expenses when employees have rendered service entitling them to the contribution.
STOCK-BASED COMPENSATION
The Company adopts both ASC Topic 718, “Compensation - Stock Compensation” and ASC Topic 505-50,”Equity-Based Payments to Non-Employees” using the fair value method in which an entity issues its equity instruments to acquire goods and services from employees and non-employees. Stock compensation for stock granted to non-employees has been determined in accordance with this accounting standard and the accounting standard regarding accounting for equity instruments that are issued to other than employees for acquiring, or in conjunction with selling goods or services, as the fair value of the consideration received or the fair value of equity instruments issued, whichever is more reliably measured. This accounting standard allows the “simplified” method to determine the term of employee options when other information is not available. Under ASC Topic 718 and ASC Topic 505-50, stock compensation expenses is measured at the grant date on the value of the option or restricted stock and is recognized as expenses, less expected forfeitures, over the requisite service period, which is generally the vesting period.
FAIR VALUE OF FINANCIAL INSTRUMENTS
The Company follows paragraph 825-10-50-10 of the FASB Accounting Standards Codification for disclosures about fair value of its financial instruments and paragraph 820-10-35-37 of the FASB Accounting Standards Codification (“Paragraph 820-10-35-37”) to measure the fair value of its financial instruments. Paragraph 820-10-35-37 establishes a framework for measuring fair value in accounting principles generally accepted in the United States of America (U.S. GAAP), and expands disclosures about fair value measurements. To increase consistency and comparability in fair value measurements and related disclosures, Paragraph 820-10-35-37 establishes a fair value hierarchy which prioritizes the inputs to valuation techniques used to measure fair value into three (3) broad levels. The fair value hierarchy gives the highest priority to quoted prices (unadjusted) in active markets for identical assets or liabilities and the lowest priority to unobservable inputs. The three (3) levels of fair value hierarchy defined by Paragraph 820-10-35-37 are described below:
Level 1 Quoted market prices available in active markets for identical assets or liabilities as of the reporting date.
Level 2 Pricing inputs other than quoted prices in active markets included in Level 1, which are either directly or indirectly observable as of the reporting date.
Level 3 Pricing inputs that are generally observable inputs and not corroborated by market data.
The carrying amounts of the Company’s financial assets and liabilities, such as cash and accrued expenses, approximate their fair values because of the short maturity of these instruments.
The carrying amounts of the Company’s financial assets and liabilities, such as cash and accrued expenses, approximate their fair values because of the short maturity of these instruments. The Company does not have any assets or liabilities measured at fair value on a recurring or a non-recurring basis, consequently, the Company did not have any fair value adjustments for assets and liabilities measured at fair value as of June 30, 2014 or December 31, 2013, nor gains or losses are reported in the statements of income and comprehensive income that are attributable to the change in unrealized gains or losses relating to those assets and liabilities still held at the reporting date for the six months ended June 30, 2014 or 2013.
NEW ACCOUNTING PRONOUNCEMENTS
The Company does not expect any recent accounting pronouncements to have a material effect on the Company’s financial position, results of operations, or cash flows.
In February 2013, the FASB issued guidance on disclosure requirements for items reclassified out of Accumulated Other Comprehensive Income (“AOCI”).This new guidance requires entities to present (either on the face of the income statements or in the notes) the effects on the line items of the income statement for amounts reclassified out of AOCI. The new guidance will be effective for us beginning July 1, 2013. Other than requiring additional disclosures, we do not anticipate a material impact on the consolidated financial statements upon adoption.
In March 2013, the FASB issued guidance on a parent’s accounting for the cumulative translation adjustment upon de-recognition of a subsidiary or group of assets within a foreign entity. This new guidance requires that the parent releases any related cumulative translation adjustment into net income only if the sale or transfer results in the complete or substantially complete liquidation of the foreign entity in which the subsidiary or group of assets had resided. The new guidance will be effective for us beginning July 1, 2014. We do not anticipate a material impact on the consolidated financial statements upon adoption.
| - 36 - |
In July 2013, the FASB issued ASU 2013-11, “Presentation of an Unrecognized Tax Benefit When a Net Operating Loss Carry forward, a Similar Tax Loss, or a Tax Credit Carry forward Exists”. These amendments provide that an unrecognized tax benefit, or a portion thereof, should be presented in the financial statements as a reduction to a deferred tax asset for a net operating loss carry forward, a similar tax loss, or a tax credit carry forward, except to the extent that a net operating loss carry forward, a similar tax loss, or a tax credit carry forward is not available at the reporting date to settle any additional income taxes that would result from disallowance of a tax position, or the tax law does not require the entity to use, and the entity does not intend to use, the deferred tax asset for such purpose, then the unrecognized tax benefit should be presented as a liability. For public entities, the amendments are effective for fiscal years, and interim periods within those years, beginning after December 15, 2013. The adoption of ASU 2013-11 is not expected to have a material impact on the Company’s consolidated financial statements.
In May 2014, the Financial Accounting Standards Board issued guidance related to revenue from contracts with customers. Under this guidance, revenue is recognized when promised goods or services are transferred to customers in an amount that reflects the consideration that is expected to be received for those goods or services. The updated standard will replace most existing revenue recognition guidance under GAAP when it becomes effective and permits the use of either the retrospective or cumulative effect transition method. Early adoption is not permitted. The updated standard will be effective for us in the first quarter of 2017. We have not yet selected a transition method and we are currently evaluating the effect that the updated standard will have on our consolidated financial statements and related disclosures.
Other accounting standards that have been issued or proposed by FASB that do not require adoption until a future date are not expected to have a material impact on the consolidated financial statements upon adoption.
PROGRESS REPORTS AND SUBSEQUENT EVENTS.
Table (PS 1) below shows the progress reports and subsequent events on operational affairs of each subsidiary as at Q2 2014:
Name of subsidiaries |
Operating divisions | Description | ||
| SJAP | ||||
| Cattle farming & fattening | During the first half of 2014, just fewer than 10,000 head of cattle were fattened between our cooperative farmers and sold by the Company, slightly behind our targeted rate to fatten up to 25,000 head of cattle in 2014. However, this figure already represents what had been produced in 2013 (full year), essentially doubling the fattening capacity in one year. | |||
| Fertilizer | Since cropland has increased by 17% from 46,000 Mu in 2013 to almost 54,000 Mu in 2014, most of the fertilizer being produced is being applied to this area, curtailing the sale of fertilizer until such time as further expansion of existing production facilities can be expanded. | |||
| Bulk live stock feed | Yields from cropland (biennial rotation) have been maintained at 3.5 MT / Mu, providing sufficient bulk livestock-feed to fatten up to 25,000 head of cattle per year with excess supplies sold to the regional farmers. | |||
| Concentrated stockfeed | This quarter up to 85% of concentrated feed is being used by our fattening operation facilities and our cooperative farmers with the balance sold to regional farmers. | |||
| Slaugther house | As of July 31, 2014, 75% of the slaughterhouse has been completed, allowing operations at the facility to get underway while work in progress continues on completing the final 25%. During Q2 2014, 158 head of cattle had been slaughtered for processing at the facility. | |||
| Deboning & processing | This division is fully operational and managed to debone 88 MT of meat during Q2 2014, however, improvements and adjustments are ongoing to its new marbled beef equipment and plant operations to reach ultimate efficiency. | |||
| Others | External concrete and road work surrounding the slaughter house and de-boning factory is scheduled to be completed by August 15, 2014 while additional road work (2 Km) leading to the complex will be completed on or before end of Q3 2014 to allow better access to the facility. | |||
| The first beef / mutton shop is scheduled to open at Tesco by August 15, 2014, and in preparation, SJAP is preparing 60 different cuts of beef and mutton products to be sold at this location. The second store, which will reflect the prototype for our stores going forward (i.e., signature outlets), is expected to open at a different Tesco location sometime on or before September 15, 2014. The aim is to market all locations under the banner ad, “We guarantee the highest in quality and food safety on every cut of meat you buy from one of our Tesco locations,” in an effort to help strengthen the beef market as compared to what the pork and mutton industries have enjoyed until now in China. | ||||
| * Please refer to the pictures below for some of SJAP's development in progress. | ||||
| HSA | ||||
| Fertilizer | HSA progressed nicely during Q2 2014, manufacturing and selling more than 9,000 MT of all-purpose fertilizer to lake fish farmers and grape growers, and trading over 3,600 MT of general fertilizer with other farmers. Currently, it is constructing and developing additional fermentation facilities and areas aiming to improve its overall production capacity on or before year end 2014, while having completed the installation of an additional production line during Q2 2014. | |||
| Cattle farming | There was progress made on developing a cattle farm during Q2 2014, except for the construction of building structures, which require a change in land use rights from a primary to a secondary agriculture designation; the process of which is underway. As of July 31, 2014, the Government authority has accepted the Company's payment for changing the land use right, typically indicating that official approval is nearing completion. | |||
| Crop plantation | Yellow grass planted early in the season is expected to provide a good harvest during Q3 2014, exceeding expectations of 7,500 MT, which should provide sufficient livestock feed initially in 2014 for its cattle operation. | |||
| Others | * Please refer to the pictures below for some of HSA's development in progress. |
Table (PS 2) below shows the progress reports and subsequent events on operational affairs of each subsidiary (continued):
| - 37 - |
SJAP: The Slaughterhouse &Deboning facility, Deboning and Marbled Meat Processing Lines
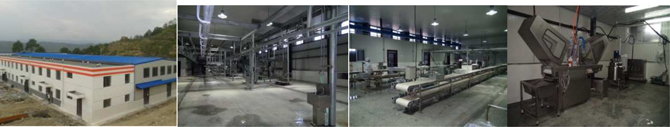

The Logo to be displayed in our Tesco Supermarket locations

A mockup of our first meat counter at Tesco

| - 38 - |
HSA: The hill next to the Fertilizer factory cut and leveled into flat land of 70 Mu (about 46,200 m2) in preparation for the cattle farm that will house up to 2,000 head, initially
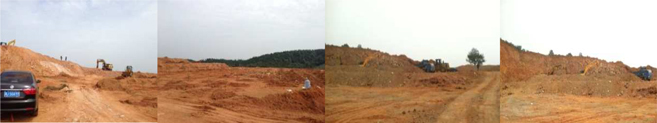
The additional fertilizer production line completed during Q2 2014
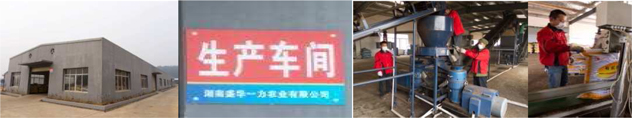
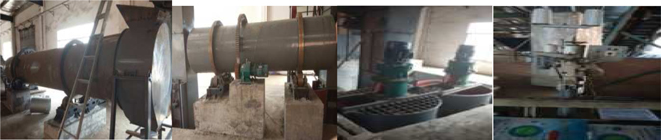

| - 39 - |
| l | Table (PS 2) below shows the progress reports and subsequent events on operational affairs of each subsidiary (continued) |
| Subsidiary | Operating Division |
Description | ||
JHST (HU Plantation) |
Immortal Vegetables |
As at June 30 2014, JHST harvested over 21.7 MT of fresh Immortal Vegetables from 10 Mu of its plantation averaging 2.17 MT / Mu producing around 2.17 MT of dried product at a ratio of 10 Kg fresh produce to 1 Kg of dried product. The dried product is packed into gift boxes, each box containing 900 grams distributed by JHST sales agents to over 200 retail shops. | ||
| HU Flowers | The heavy rainy season continues to affect the recovery of the HU Plants from plant diseases that were introduced in 2012 and 2013, however, JHST managed to harvest just under 9 million pieces of flowers during this quarter representing an increased yield by more than 20% compared to same period in 2013. Thus, JHST is expecting higher yields in 2014 than its 2013 season. However it was due to the impact of the wet season there was no fresh flowers being brought from regional growers for drying, but the Company is expecting improvement later part of the season. | |||
Drying & Processing |
The application to Government authorities to convert 50 Mu of agriculture land into industrial land is pending approval to allow construction of additional drying and production facilities. At this time, there is no further indication as to when the application will be approved. | |||
| Others | New staff quarters are completed, and work is in progress on completing its new storage, office and associated facilities within Q3 2014. | |||
| * Please refer to pictures below showing the HU and Immortal Vegetable plantation this season and the new staff quarters. | ||||
| * Please visit our website (www.sinoagrofood.com) to see our latest video promoting the sale of Immortal Vegetables. |
The HU Plantation
The Immortal Vegetable Plantation
Matured Immortal Vegetable plants with flowers
| - 40 - |
Table (PS 3) below shows the progress reports and subsequent events on operational affairs of each subsidiary: (Continued)

| - 41 - |
Table (PS 4) below shows the progress reports and subsequent events on operational affairs of each subsidiary: (Continued)
| Subsidiary | Operation division |
Description | ||
| CA (Fishery) | (Existing Projects) | |||
| Fish Farm (1) or (JFD) | The production capacity of prawn improved during the month of June producing over 5 million pieces instead of the earlier months' average of 1.3 million pieces, plus they garnered a handsome gross profit margin just above 70% due to strong market prices (at average of US$11.8 / kg of live prawns for sizes of 60 pieces / Kg) and demand. During the past months the following factors were discovered to influence ultimate yields of "Big Giant Prawns" (BGP) in the APM tanks | |||
| * The breed quality of prawn fingerlings is extremely important, i.e. fingerlings from inbred brood stocks possess a much slower growth rate. It was also discovered that the population ratio of female fingerlings beyond a certain threshold results in poorer yields. However, we have not encountered any disease problem with BGP grown in APM tanks. | ||||
| * Periodic grading is essential, thus we have observed that best results can be achieved if prawn are graded at 3-week intervals. As such, the design in our new Zhongshan Prawn Project and the extension of PF(1) will incorporate APM tanks configured to grade prawns from one tank to another when they reach both 3 and 6 weeks of age. Grading machines have been invented to separate a certain ratio of female and male prawns when they reach 7 weeks, 10 weeks, and 12 weeks of age, during which times the graded female prawns will be sold, and the male prawns retained until desired market sizes have been attained. | ||||
| * Providing sufficient compartments in tanks for the prawns to hide out when shedding their shells increases survival rate, thus increasing overall yield rates. | ||||
| Fish Farm (2) | There was little development and construction work being done at FF(2) during Q2 2014. FF(2) is carrying out a number of grow-out contracts on sleepy cods and eels using its RAS open dams constructed during Q1 2014. FF(2) anticipates doubling its grow-out production with these new RAS open dams. | |||
| Prawn Farm (1) | During Q2 2014, PF(1) has completed associated facilities (i.e., extra staff quarters, showroom, storage room, etc.) and is now doing construction work on additional APM tanks increasing its prawn production capacity from around 250 MT / year to 600 MT / year. Adjacent to this extension, PF(1) is going to build the Company's first demonstration hydroponic farm intending to use all prawn solid waste residue to demonstrate the environmentally friendly aspects of the overall development. | |||
| Prawn Farm (2) | Development and construction work to convert 6 x 10 Mu and 3 x 20 Mu open dams into semi-enclosed RAS dams are in progress, and as at July 31, 2014 most of the infrastructure and underground works were completed awaiting the semi-enclosed buildings to be installed by the end of August 2014. Upon completion, it is expected that PF(2) will produce prawn, fish and eel all year round targeting to capture the higher prices of live-seafood during the cold weather months from November to April. | |||
| R & D station | Heavy activity took place at the R&D station during Q2 2014 as it focused on the breeding and development of 6 / 7 different imported table-fish species intending to capitalize on the nascent market in China. | |||
| * Please refer to the pictures below showing the current status of FF(1), PF(1), and PF(2), as well as the new fish species being studied at the R&D Station. |
The Fish Farm (1) Harvest

| - 42 - |
Prawn Farm (1): Experimental hydroponic farm set up to test the application of the solid wastes from PF(1)

Prawn Farm (1): Pictures showing PF(1) at Enping, the constructed additional showroom, storage and staff quarters
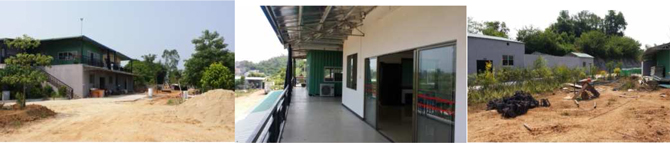
Prawn Farm (1): Construction on the extension of APM tanks
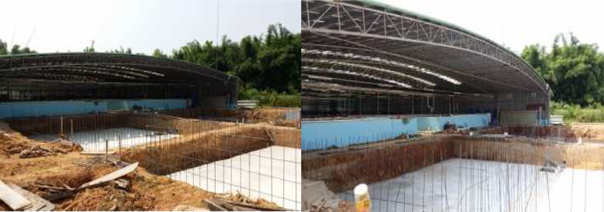
| - 43 - |


Prawn Farm (2): Construction of the covered water holding dams and RAS Dams (Semi-covered)
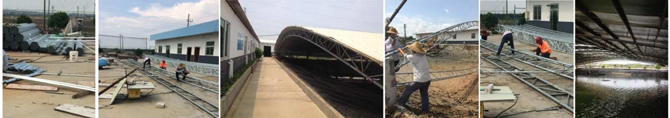
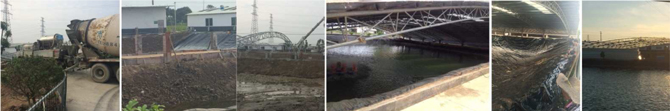
Prawn Farm (2): Construction of the semi-covered outdoor RAS Dams
R & D Station: The new species of fish that are being studied at the R&D Station
眼斑三间 Cichlaocellaris |
巴西亚 Basia |
蓝帆五间 Notropischrosomus |
粗线银板 Metynnishypsauchen |
 | |||
| - 44 - |
红尾战船 台湾—巨龙泥鳅巴西亚—金老虎(鲈科)湄公河—成吉思汗
| Osphronemusgoramy | Taiwanese Dragon eels | Cichla Ocellaris PanggasiusIamaudil |
| - 45 - |
Table (PS 5) below shows the progress reports and subsequent events on operational affairs of each subsidiary: (Continued)
| Subsidiary | Operating division |
Description | ||
| CA (Fishery) | Zhangshan New Prawn Project | * Electric service and potable water sources have been connected and are being supplied to the property. | ||
| * An all-season 6 Km road encircling the project site was completed during Q2 2014. Going forward, there will be a total of approximately 12 Km of internal roads subdividing segments of development that will be completed as needed. | ||||
| * A complex consisting of offices, staff quarters, conference room, storage, staff canteen and parking areas, as well as landscaping encompassing a total built-up area of over 2,000 m2 at the front entrance of the property is slated to be completed by August 15, 2014. Upon completion, it will have the capacity to house enough personnel and provide working space to administer Phase (1) of the development. As such, each phase / segment of the development hereafter will have similar facilities constructed to handle the additional load. | ||||
| * Land clearing, leveling, and soil consolidation has been completed on 200 Mu in preparation for the building and construction of APM farms. Pending final arrangements with some subcontractors, construction & development of the first group of APM farms is slated to begin on or before August 15, 2014. | ||||
| * In conjunction with developing the APM farms, another 200 Mu section of land adjacent to the office complex that is not suitable for development of APM farms because the block is situated below high tensile power lines is temporarily being developed into RAS open dams to grow-out the new fish species being tested as part of the research and development activity. Stocking of fish and trials are slated to begin within August 2014. | ||||
| * Please refer to the pictures below showing the latest developments of the new Zhongshan Prawn project (ZSNPP). | ||||
| * Please visit our website to review the latest ZSNPP brochure providing further details on its development. |
Zhongshan New Prawn Farm Project: Finishing the construction of the office, staff quarters, canteen, etc.
| - 46 - |
Table (PS 6) below shows the progress reports and subsequent events on operational affairs of each subsidiary: (Continued)
| Subsidiary | Operating division |
Description | ||
| SIAF (Corporate & Trading) | Consulting & Services | The following work was carried out during Q2 2014: | ||
| * An expansion to accommodate an additional seating capacity of 150 patrons at the Zhongshan HingZhung Shopping Complex Restaurant (#4), due to overwhelming demand within 5-months of its opening, has gotten underway with a targeted completion date by December 15, 2014 just in time for the high-season period (December through March). Currently, the restaurant is at a 100-seat capacity. | ||||
| * 95% of the new renovation and extension work at Restaurant (1) has been completed, remodeled into a western-style specialty steakhouse including increasing its seating capacity from 120 to 260, capitalizing on rising middle class demand. Grand opening of the renovated facility is scheduled during August 2014 once training of its expanded staff has been completed. | ||||
| * A Steak-kitchen was added to Restaurant (2) in combination with its current Chinese-oriented food-prep area to increase productivity. Since it is cost prohibitive to increase floor space, i.e. additional seating capacity due to the high-rent area, the idea is to attain faster (food-prep) service times providing greater turnover. Restaurant (2) should be able to gauge the effect this has had on sales / turnover within the next two months. | ||||
| * Design / layout of Restaurant (6), also in Zhnongshan City, is underway targeting construction to begin in September 2014. | ||||
| * Construction on a frozen-meat wholesale / retail shop (~500 m2) at the Central Frozen Goods and Wholesale Market in Guangzhou City is scheduled to be completed for opening in August 2014. The Company believes this to be an ideal / prime location for its sale of frozen beef and lamb products. | ||||
| Imported goods | * The Company has imported a great amount of live seafood from Madagascar (i.e., crabs and eels) and expects the import of live crayfish in-season starting in September 2014. | |||
| * The Company has begun importing beef and lamb from Australia to enhance our (competitive) ability to meet the rising demand for these products coming from both the upper and lower ends of the China market. | ||||
| Others | * Please visit our website for access to videos showing our new Madagascar packaging facility, as well as the collection of crabs and crayfish from that region. |
| - 47 - |
ITEM 3. QUANTITATIVE AND QUALITATIVE DISCLOSURES ABOUT MARKET RISK.
Not Applicable
ITEM 4. CONTROLS AND PROCEDURES
Evaluation of Disclosure Controls and Procedures
We maintain “disclosure controls and procedures,” as such term is defined in Rule 13a-15(e) under the Securities Exchange Act of 1934 (the “Exchange Act”), that are designed to ensure that information required to be disclosed in our Exchange Act reports is recorded, processed, summarized and reported within the time periods specified in the Securities and Exchange Commission rules and forms, and that such information is accumulated and communicated to our management, including our Chief Executive Officer and Chief Financial Officer, as appropriate, to allow timely decisions regarding required disclosure. We conducted an evaluation (the “Evaluation”), under the supervision and with the participation of our Chief Executive Officer (“CEO”) and Chief Financial Officer (“CFO”), of the effectiveness of the design and operation of our disclosure controls and procedures (“Disclosure Controls”) as of the end of the period covered by this report pursuant to Rule 13a-15 of the Exchange Act. Based on this Evaluation, our CEO and CFO concluded that our Disclosure Controls were effective as of the end of the period covered by this report.
Changes in Internal Control over Financial Reporting
We have also evaluated our internal control over financial reporting, and there has been no change in our internal control over financial reporting that occurred during the three months ended June 30, 2014 that has materially affected, or is reasonably likely to materially affect, our internal control over financial reporting
| - 48 - |
Limitations on the Effectiveness of Controls
Our management, including our CEO and CFO, does not expect that our Disclosure Controls and internal controls will prevent all errors and all fraud. A control system, no matter how well conceived and operated, can provide only reasonable, not absolute, assurance that the objectives of the control system are met. Further, the design of a control system must reflect the fact that there are resource constraints, and the benefits of controls must be considered relative to their costs. Because of the inherent limitations in all control systems, no evaluation of controls can provide absolute assurance that all control issues and instances of fraud, if any, within the Company have been detected. These inherent limitations include the realities that judgments in decision-making can be faulty, and that breakdowns can occur because of a simple error or mistake. Additionally, controls can be circumvented by the individual acts of some persons, by collusion of two or more people, or by management or board override of the control.
The design of any system of controls also is based in part upon certain assumptions about the likelihood of future events, and there can be no assurance that any design will succeed in achieving its stated goals under all potential future conditions; over time, controls may become inadequate because of changes in conditions, or the degree of compliance with the policies or procedures may deteriorate. Because of the inherent limitations in a cost-effective control system, misstatements due to error or fraud may occur and not be detected.
None
Not applicable
ITEM 2. UNREGISTERED SALES OF EQUITY SECURITIES AND USE OF PROCEEDS
During the period covered by this quarterly report, we issued an aggregate of 10,686,001 shares of our common stock to 24 Chinese persons. The shares were issued pursuant to the exemption from registration under the Securities Act provided by its Section 4(a)(2). The shares were issued in consideration for extinguishment of debt in the aggregate amount of $3,555,875, payments for workers entitlement of $646,310 and payments for professional service consultants for $487,521.
ITEM 3. DEFAULTS UPON SENIOR SECURITIES
None
ITEM 4. MINE SAFETY DISCLOSURES
Not applicable.
None
| 31.1 | Section 302 Certification of Principal Executive Officer+ | |
| 31.2 | Section 302 Certification of Principal Financial Officer+ | |
| 32.1 | Section 906 Certification of Principal Executive Officer and Principal Financial Officer * | |
| 101.INS | XBRL Instance Document + | |
| 101.SCH | XBRL Taxonomy Extension Schema Document + | |
| 101.CAL | XBRL Taxonomy Calculation Linkbase Document + | |
| 101.LAB | XBRL Taxonomy Labels Linkbase Document + | |
| 101.PRE | XBRL Taxonomy Presentation Linkbase Document + | |
| 101.DEF | XBRL Definition Linkbase Document + |
+filed herewith
* submitted herewith
| - 49 - |
Pursuant to the requirements of Section 13 or 15(d) of the Securities Exchange Act of 1934, the registrant has duly caused this Report to be signed on its behalf by the undersigned, thereunto duly authorized.
| SINO AGRO FOOD, INC. | ||
| August 14, 2014 | By: | /s/ LEE YIP KUN SOLOMON |
| Lee Yip Kun Solomon | ||
| Chief Executive Officer | ||
| (Principal Executive Officer) |
Pursuant to the requirements of the Securities Exchange Act of 1934, this Report has been signed below by the following persons on behalf of the registrant and in the capacities and on the dates indicated.
| August 14, 2014 | By: | /s/ LEE YIP KUN SOLOMON |
| Lee Yip Kun Solomon | ||
| Chief Executive Officer, Director | ||
| (Principal Executive Officer) |
| August 14, 2014 | By: | /s/ OLIVIA LAI |
| Olivia Lai | ||
| Chief Financial Officer | ||
| (Principal Financial Officer) |
| August 14, 2014 | By: | /s/ TAN POAY TEIK |
| Tan Poay Teik | ||
| Chief Marketing Officer and Director | ||
| August 14, 2014 | By: | /s/ CHEN BOR HANN |
| Chen Bor Hann | ||
| Corporate Secretary and Director |
| August 14, 2014 | By: | /s/ YAP KOI MING |
| Yap Koi Ming | ||
| Director |
| August 14, 2014 | By: | /s/ NILS ERIK SANDBERG |
| Nils Erik Sandberg | ||
| Director |
| August 14, 2014 | By: | /s/ DANIEL RITCHEY |
| Daniel Ritchey | ||
| Director |
| August 14, 2014 | By: | /s/ SOH LIM CHANG |
| Soh Lim Chang | ||
| Director |