Attached files
| file | filename |
|---|---|
| 8-K - 8-K - Starwood Waypoint Homes | d773642d8k.htm |
| EX-99.1 - EX-99.1 - Starwood Waypoint Homes | d773642dex991.htm |
 SECOND QUARTER
2014 Supplemental Operating & Financial Data
Exhibit 99.2
Starwood Waypoint Residential Trust (“SWAY”)
acquires,
renovates,
leases,
maintains
and
manages
single
family
homes.
We also invest in non-performing loans to supplement growth and seek optimal resolutions
for each loan. Our mission is to reinvent the home rental experience
by providing quality homes, great service and rewarding lease programs
that offer valuable benefits to our residents while generating attractive returns for our
investors. |
 Table of
Contents Pages
ABOUT SWAY
1-6
FINANCIAL INFORMATION
Selected Financial & Other Information
7
Consolidated Balance Sheets
8
Consolidated Statements of Operations
9
FFO & Core FFO
10
NOI
11
CAPITAL MARKETS
12
PORTFOLIO INFORMATION
Total Rental Homes Portfolio
13-14
Leasing Statistics
15
Non-Performing Loan Portfolio
16
TRANSACTION ACTIVITY
17
DEFINITIONS AND RECONCILIATIONS
18-19 |
 1
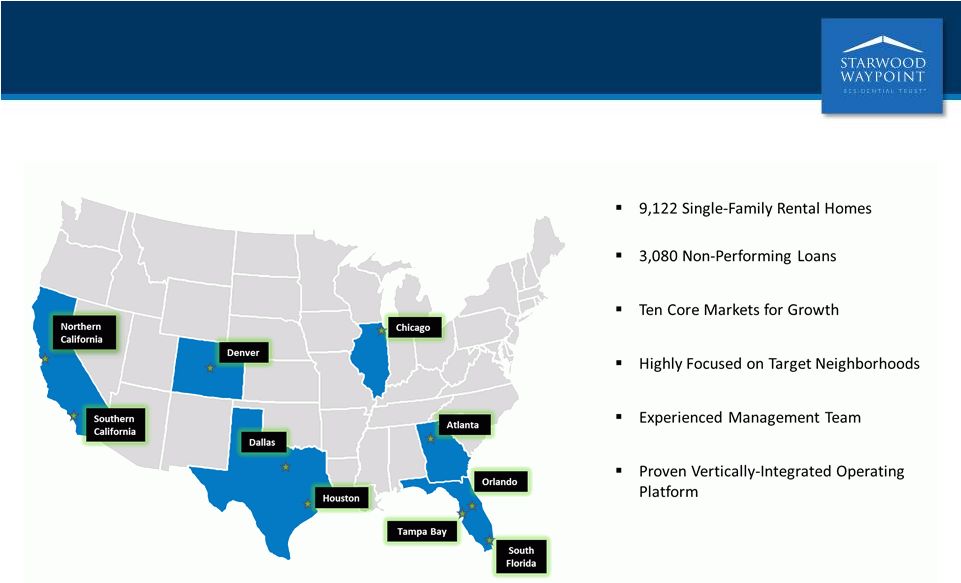
ABOUT SWAY
Attractive Markets for Growth |
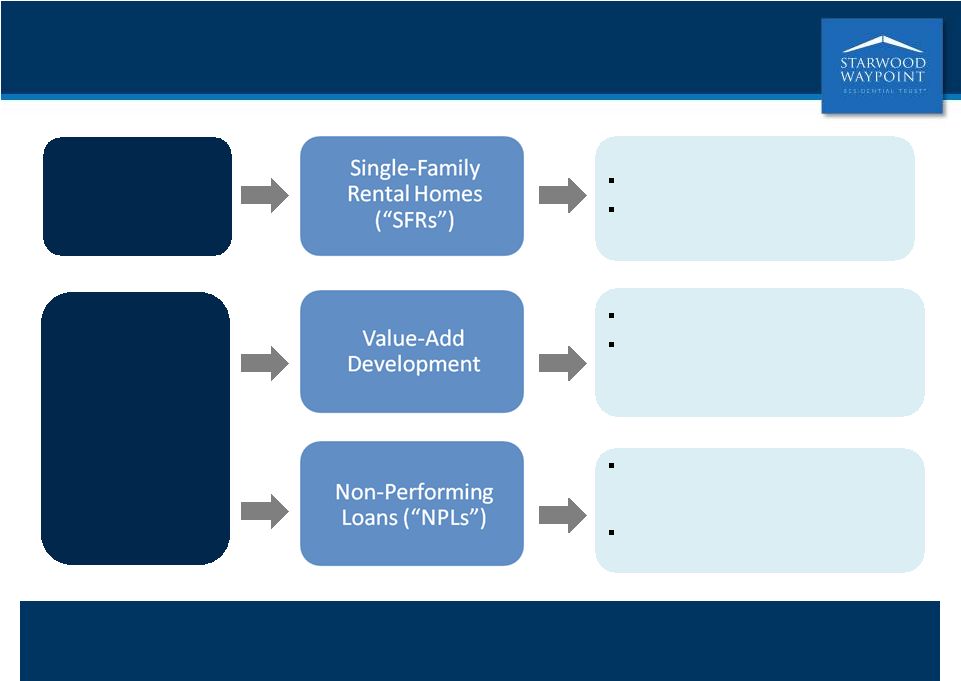 ABOUT
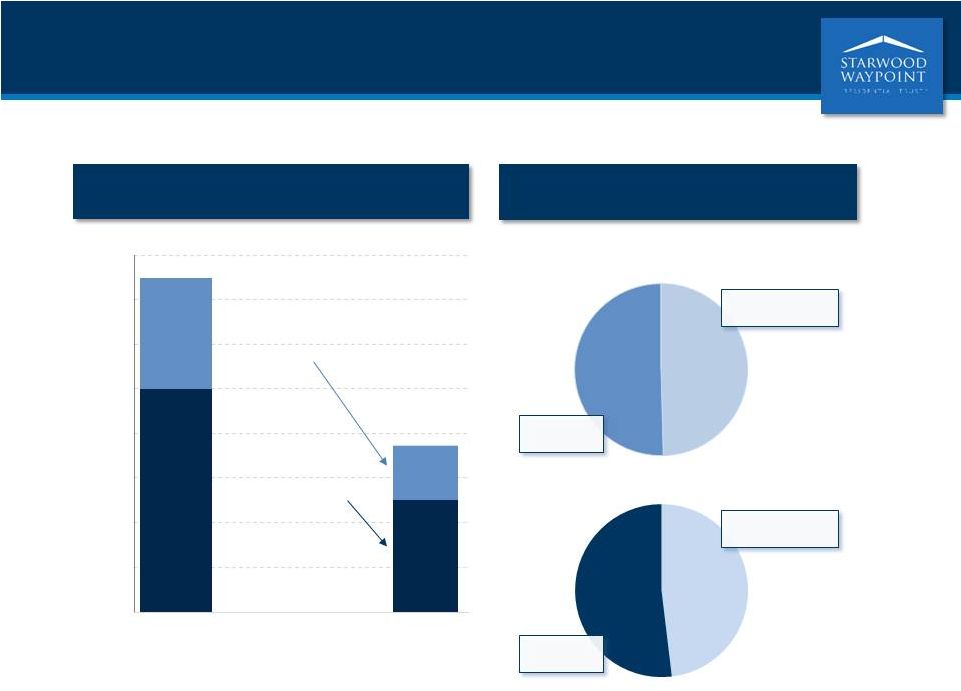
SWAY Hybrid Business Model
Stable cash flow from a growing SFR portfolio and income generated from our NPL business
supports our Board’s approval of an initial dividend.
2
Stability
Growth
Growing book of cash-flowing assets
Fully supports $0.14 per share dividend
Homes in renovation and lease-up phase
Provides meaningful upside
opportunities to enhance value and
downstream cash flow
Attractive channel to acquire SFRs at 20%-
30%
discount to broker price opinion
(“BPO”)
Alternative resolutions have potential for
high return on equity |
 3
SFRs (77% of portfolio)
(1)
NPLs (23% of portfolio)
(1)
Number of Homes
(2)
9,122
Aggregate Investment ($mm)
(4)
$1,345
Aggregate Investment per Home
(4)
$147,434
Average Monthly Rent per Leased
Home
(5)
$1,416
Percent of Total Homes That Are
Leased (%)
77.5%
Percent of Homes Owned 180 Days or
Longer That Are Leased (%)
(7)
94.9%
Percent of 90+ Days Rent Ready
Homes That Are Leased (%)
(7)
98.8%
Number of Loans
(3)
3,080
Total Purchase Price ($mm)
$397.0
Total Unpaid Principal Balance (“UPB”) ($mm)
$681.7
Total BPO ($mm)
$635.3
Weighted Average Loan-to-Value (“LTV”)
(6)
135.8%
Purchase Price as a Percentage of UPB
58.2%
Purchase Price as a Percentage of BPO
62.5%
SWAY has a high quality and diverse portfolio of SFRs and NPLs
ABOUT SWAY
Portfolio Overview
Note: As of June 30, 2014.
(1)
(2)
(3)
(4)
(5)
(6)
(7)
Excludes 277 unsecured, second and third liens with an aggregate purchase price of $1.9
million. Based on
aggregate investment for SFRs and purchase price for NPLs. Excludes
285
homes
that
we
did
not
intend
to
hold
for
the
long
term.
Includes acquisition costs and actual and estimated upfront renovation costs. Actual renovation
costs may exceed estimated renovation costs, and we may acquire homes in the future with different characteristics that result
in higher renovation costs.
Represents average monthly contractual cash rent as of June 30, 2014. Average monthly
cash rent is presented before rent concession and credits (“Waypoints”). To date, rent concessions and Waypoints have been utilized
on a limited basis and have not had a significant impact on our average monthly rent. If
the use of rent concessions and Waypoints or other leasing incentives increases in the future, they may have a greater impact by
reducing the average monthly rent we receive from leased homes.
Weighted average LTV is based on the ratio of UPB to BPO weighted by UPB as of the respective
acquisition dates. References
to
“rent
ready
homes”
refer
to
homes
that
have
both
completed
renovations
and
been
deemed,
pursuant
to
an
inspection
from
one
of
our
agents,
to
be
in
a
condition
to
be
rented.
Our
policy
is
to
have
the
agent perform this inspection promptly after the renovations have been completed.
|
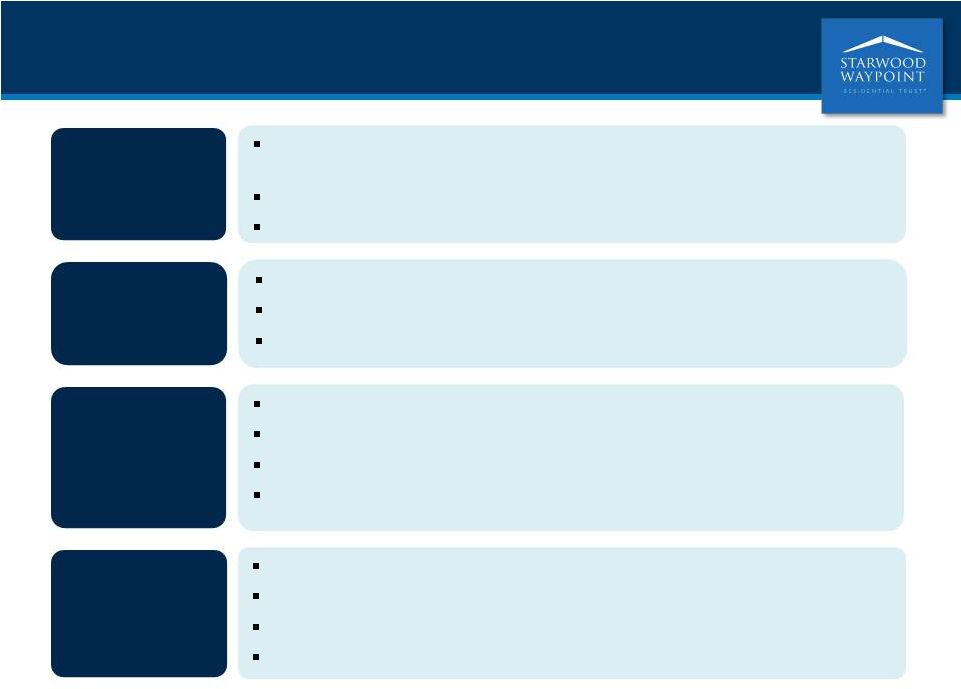 4
ABOUT SWAY
Q2 Highlights and Recent Developments
(1)
Portfolio
Growth
Increased SFR portfolio by 27% to 9,122 homes
Acquired a $117 million portfolio of 1,441 NPLs at 68.2% of BPO
Purchased 1,294 NPLs in August for $202 million at 72.2% of BPO
Estimated Net Asset Value (“NAV”) per share increased to $31.84; book value
per share of $27.97 as of June 30, 2014
Leasing
Momentum
180-Day Owned Portfolio: 94.9% up from 90.4% in Q1
90-Day Rent-Ready Portfolio: 98.8% up from 96.3% in Q1
Portfolio-wide lease percentage: 77.5% up from 76.6% in Q1
Grew SFR revenue 74% quarter-over-quarter
Expanded
Capacity
Upsized our two credit facilities by a total of $650 million in Q2
Raised $230 million in gross proceeds from convertible note offering (July)
Total
financing
capacity
now
$1.73
billion
with
convertible
debt
as
of
July
2014
Positive
Results
Achieved positive Q2 Core Funds from Operations (“FFO”) of $3.0 million or
$0.08 per share, an $8.5 million or $0.22 per share increase over reported Q1
SWAY Board approves initial dividend of $0.14 per share
Achieved stabilized net operating income (“NOI”) margin of 65.1%
(1)
Core FFO, NOI and Estimated NAV are non-GAAP measures. For a definition of
these non-GAAP measures, please refer to pages 18 and 19. |
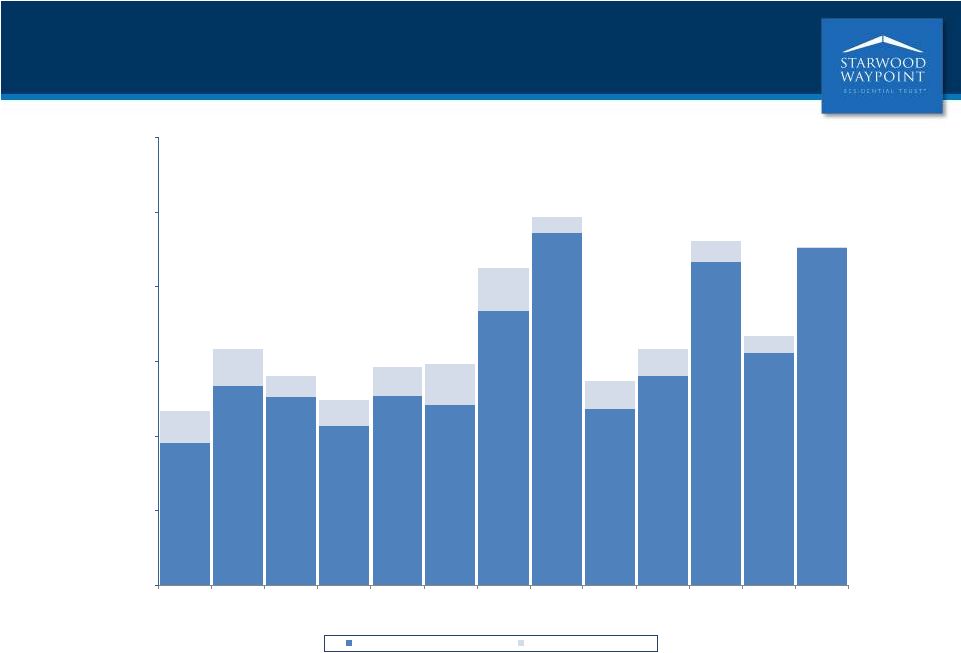
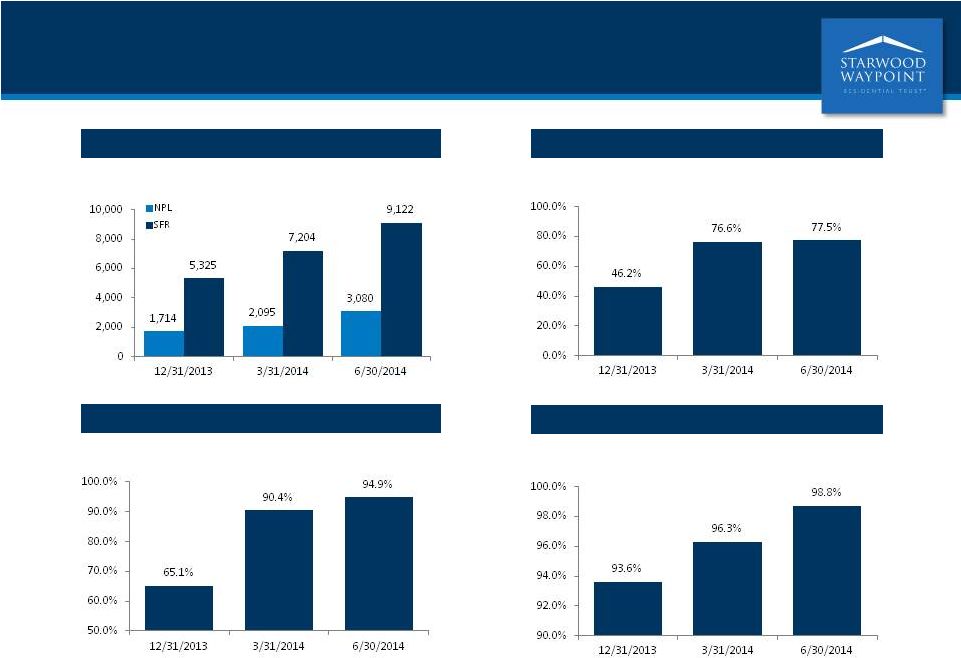 Total SFRs and NPLs
(1),(2)
% Leased: Total Rental Portfolio
5
ABOUT SWAY
Robust Growth, Well Executed
(1)
Excludes 285, 154, and 146 homes that we did not intend to hold for the long term as of June
30, 2014, March 30, 2014 and December 31, 2013, respectively. (2)
Excludes 277 unsecured, second and third liens as of June 30, 2014.
% Leased: Homes Owned 180 Days or Longer
% Leased: Homes 90 Days Past Rent Ready |
 ABOUT
SWAY Financing Overview
Added $650 million of capacity, with $729
million undrawn as of June 30, 2014
2014 Financing Activity
(1)
Capacity
(1)
($ in millions)
Total
Capacity
Drawn NPL:
$252
million
Undrawn NPL:
$248
million
$519
$252
6
SFR Drawn:
$519
million
Undrawn SFR:
$481
million
(1)
As of June 30, 2014.
NPL
SFR
Upsized SFR Credit
Facility by $500 million
in Q2 to total capacity
of $1 billion
Upsized NPL Credit
Facility by $150 million
in Q2 to total capacity
of $500 million
$500
$1,000
$0
$200
$400
$600
$800
$1,000
$1,200
$1,400
$1,600
Drawn |
 7
FINANCIAL INFORMATION
Selected Financial & Other Information
(1)
Please refer to page 18 for a definition of Core FFO. Core FFO is a non-generally
accepted accounting principle (“GAAP”) measure. For a reconciliation of Core FFO to net loss
attributable to common shareholders determined in accordance with GAAP, please refer to page
10. (2)
Stabilized portfolio NOI margin and Leased home portfolio NOI are non-GAAP measures. For a
reconciliation of stabilized portfolio NOI margin and leased home portfolio NOI to net
loss attributable to common shareholders determined in accordance with GAAP, please refer to
page 19. (3)
Please refer to page 18 for a definition of stabilized homes.
(4)
Excludes 285, 154, and 146 homes that we did not intend to hold for the long term as of June
30, 2014, March 30, 2014 and December 31, 2013, respectively. (5)
Three Months Ended
Six Months Ended
($ in thousands, except share and per share data)
June 30, 2014
June 30, 2014
(unaudited)
(unaudited)
Total revenues
34,332
$
55,833
$
Net loss attributable to common
shareholders (12,116)
$
(27,424)
$
Core FFO
(1)
2,978
$
(2,734)
$
Per
common
share
-
diluted
Net earnings attributable to common shareholders
(0.31)
$
(0.70)
$
Core FFO
(1)
0.08
$
(0.07)
$
Weighted Average Shares
Outstanding, Basic and Diluted 39,079,365
39,091,796
(2)
65.1%
62.3%
(2)
66.0%
63.9%
June 30, 2014
March 31, 2014
December 31, 2013
Home Count:
(3)
7,076
5,142
2,666
Non-stabilized homes
2,046
2,062
2,659
Total
Homes
(4)
9,122
7,204
5,325
Leased Percentages
(5)
95.0%
96.4%
91.6%
Homes 90 days past rent ready
98.8%
96.3%
93.6%
Homes owned 180 days or longer
94.9%
90.4%
65.1%
(4)
77.5%
76.6%
46.2%
As of
Stabilized homes
SWAY targets leased percentages on stabilized homes to be in the range of 94% to 96%.
Leased Home Portfolio NOI Margin
Stabilized Portfolio NOI Margin
Stabilized homes
Total rental portfolio |
 8
FINANCIAL INFORMATION
Consolidated Balance Sheets
($ in thousands)
June 30, 2014
December 31, 2013
(unaudited)
ASSETS
Investments in real estate
Land
272,610
$
140,076
$
Building and improvements
1,170,016
604,839
Total investment in properties
1,442,626
744,915
Less: accumulated depreciation
(17,525)
(5,730)
Investment in real estate properties, net
1,425,101
739,185
Real estate held for sale, net
13,383
10,168
Total investments in real estate, net
1,438,484
749,353
Non-performing loans
178,311
214,965
Non-performing loans (fair value option)
218,797
-
Resident and other receivables, net
8,029
1,261
Cash and cash equivalents
17,151
44,613
Restricted cash
35,261
3,331
Deferred financing costs, net
13,318
-
Other assets
22,709
4,885
Total assets
1,932,060
$
1,018,408
$
LIABILITIES AND EQUITY
Liabilities:
Credit facilities
770,541
$
-
$
Accounts payable and accrued expenses
58,199
22,434
Resident security deposits and prepaid rent
11,742
3,918
Total liabilities
840,482
26,352
Equity:
Shareholders' equity:
Common shares, at par
391
-
Additional paid-in capital
1,117,026
1,018,267
Accumulated deficit
(26,503)
(27,848)
Total shareholders' equity
1,090,914
990,419
Non-controlling interests
664
1,637
Total equity
1,091,578
992,056
Total liabilities and equity
1,932,060
$
1,018,408
$
As of |
 9
FINANCIAL INFORMATION
Consolidated Statements of Operations
($ in thousands, except share and per share data)
2014
2013
2014
2013
Revenues:
Rental revenues
23,602
$
2,889
$
37,367
$
4,013
$
Other property
revenues 890
64
1,369
105
Realized gain on non-performing loans, net
3,357
1,114
5,200
1,473
Realized
gain on loan conversions, net 6,483
-
11,897
-
Total revenues
34,332
4,067
55,833
5,591
Expenses:
Property operating and maintenance
7,791
1,161
13,823
1,711
Real
estate taxes and insurance 4,468
720
7,611
1,343
Mortgage
loan servicing costs 5,139
2,378
10,021
2,378
Non-performing loan management fees and expenses
1,871
1,575
4,286
2,425
General
and administrative 4,444
3,834
9,814
5,645
Share-based compensation
2,130
-
2,459
-
Investment management fees
3,993
-
6,750
-
Separation costs
-
-
3,543
-
Acquisition fees expensed and property management engagement costs
186
290
447
588
Interest expense, including amortization
5,191
-
6,691
-
Depreciation and amortization
7,243
767
12,716
1,424
Finance
related expenses and write-off of loan costs 5,441
-
5,441
-
Impairment of real estate
1,233
192
2,067
247
Total expenses
49,130
10,917
85,669
15,761
Loss before other income,
income tax expense and non-controlling interests (14,798)
(6,850)
(29,836)
(10,170)
Other income (expense)
Realized (loss) gain on sales of investments in real estate, net
(56)
578
(201)
665
Unrealized gain on non-performing loans, net
3,641
-
3,641
-
Loss on derivative financial instruments, net
(470)
-
(470)
-
Total other income (expense)
3,115
578
2,970
665
Loss before income tax expense and non-controlling interests
(11,683)
(6,272)
(26,866)
(9,505)
Income tax
expense 350
46
485
208
Net loss
(12,033)
(6,318)
(27,351)
(9,713)
Net (income) loss
attributable to non-controlling interests (83)
10
(73)
16
Net loss attributable to common shareholders
(12,116)
$
(6,308)
$
(27,424)
$
(9,697)
$
Net loss per share - basic
and diluted (0.31)
$
(0.16)
$
(0.70)
$
(0.25)
$
Number of shares
used in per share computations - basic and diluted 39,079,365
39,110,969
39,091,796
39,110,969
Six Months Ended June 30,
Three Months Ended June 30,
(unaudited)
(unaudited) |
 10
FINANCIAL INFORMATION
FFO & Core FFO
(1)
(1)
Please refer to page 18 for definitions of FFO and Core FFO. Commencing with the three
months ended June 30, 2014, we have changed our definition of Core FFO to include
adjustments related to share-based compensation and exclude adjustments related to
acquisition pursuit costs. ($ in thousands, except share and per share data)
2014
2013
2014
2013
Reconciliation of net loss to FFO
Net loss attributable to common shareholders
(12,116)
$
(6,308)
$
(27,424)
$
(9,697)
$
Add (deduct) adjustments to net loss to
get to FFO: Depreciation and amortization on real estate assets
7,243
767
12,716
1,424
Non-controlling interests
83
(10)
73
(16)
Subtotal - FFO
(4,790)
(5,551)
(14,635)
(8,289)
Add (deduct) adjustments to
FFO to get to Core FFO: Share-based compensation
2,130
-
2,459
-
Separation costs
-
-
3,543
-
Acquisition fees expensed and property management engagement costs
186
290
447
588
Write-off of loan costs
5,032
-
5,032
-
Loss on derivative financial instruments, net
470
-
470
-
Amortization of derivative financial instruments cost
(50)
-
(50)
-
Core FFO
2,978
$
(5,261)
$
(2,734)
$
(7,701)
$
Core FFO per share - basic
and diluted 0.08
$
(0.13)
$
(0.07)
$
(0.20)
$
Weighted average shares
- basic and diluted 39,079,365
39,110,969
39,091,796
39,110,969
Six Months Ended June 30,
Three Months Ended June 30,
(unaudited)
(unaudited) |
 11
FINANCIAL INFORMATION
NOI
(1)
(1)
Total Stabilized Portfolio NOI, Total Non-Stabilized Portfolio NOI, Total NPL NOI,
Total NOI and Total Leased Home Portfolio NOI are non-GAAP measures. For a reconciliation of these
non-GAAP measures to net loss attributable to common shareholders determined in accordance
with GAAP, please refer to Page 19.
(2)
Allowance for doubtful accounts (“bad debt”) is included in property operating and
maintenance in the consolidated statements of operations in accordance with GAAP. However,
we believe bad debt represents revenue lost and not an operating expense to the portfolio so
for purposes of calculating margins we treat bad debt as a reduction of revenue.
(3)
Property operating expenses is defined as property operating and maintenance expense plus real
estate taxes and insurance less bad debt.
(4)
Margin is calculated as total stabilized portfolio NOI or total leased home portfolio NOI
divided by total rental revenues.
($ in thousands, unaudited)
Stabilized
Portfolio
Non-Stabilized
Portfolio
NPL
Total
Stabilized
Portfolio
Non-Stabilized
Portfolio
NPL
Total
Revenues
Rental revenues
23,602
$
-
$
-
$
23,602
$
37,367
$
-
$
-
$
37,367
$
Less: Allowance for doubtful accounts
(2)
(614)
-
-
(614)
(1,123)
-
-
(1,123)
Total rental revenues
22,988
-
-
22,988
36,244
-
-
36,244
Other property revenues
890
-
-
890
1,369
-
-
1,369
Realized gain on non-performing loans, net
-
-
3,357
3,357
-
-
5,200
5,200
Realized gain on loan conversions, net
-
-
6,483
6,483
-
-
11,897
11,897
Unrealized gain on non-performing loans, net
-
-
3,641
3,641
-
-
3,641
3,641
Total revenues as adjusted
23,878
-
13,481
37,359
37,613
-
20,738
58,351
Expenses
Property operating expenses
(3)
8,919
2,726
-
11,645
15,022
5,289
-
20,311
Mortgage loan servicing costs
-
-
5,139
5,139
-
-
10,021
10,021
Total expenses
8,919
2,726
5,139
16,784
15,022
5,289
10,021
30,332
Total NOI
14,959
$
(2,726)
$
8,342
$
20,575
$
22,591
$
(5,289)
$
10,717
$
28,019
$
Stabilized portfolio NOI margin
(4)
65.1%
62.3%
Leased Home
Portfolio
Leased Home
Portfolio
Total stabilized portfolio NOI
14,959
$
22,591
$
Add: Property operating expenses on vacant stabilized homes
221
576
Total leased home portfolio NOI
15,180
$
23,167
$
Leased home portfolio NOI margin
(4)
66.0%
63.9%
Three Months Ended June 30, 2014
SFR
Six Months Ended June 30, 2014
SFR |
 12
Capital Markets
(1)
Maturity dates include extension terms.
(2)
Please refer to page 18 for a definition of enterprise value.
As of June 30, 2014 ($ in thousands, except share and per share data)
Debt Maturities
(1)
Credit
Facility -
SFR
Credit
Facility -
NPL
Total
Security
Shares
Price
Value
2014
-
$
-
$
-
$
Common shares
39,007,239
26.21
$
1,022,380
$
2015
-
-
-
2016
-
251,599
251,599
2017
-
-
-
2018
518,942
-
518,942
Total debt to enterprise value
(2)
43.4%
Thereafter
-
-
-
Total debt to total assets
39.9%
Total
518,942
$
251,599
$
770,541
$
Weighted average interest rate
3.14%
3.15%
3.14%
Weighted average remaining maturity in years
3.6
2.2
3.1
Market equity
Debt
Debt Metrics |
 13
PORTFOLIO INFORMATION
Total Rental Homes Portfolio –
June 30, 2014
(1)
Excludes 285 homes that we did not intend to hold for the long-term.
(2)
Includes acquisition costs and actual and estimated upfront renovation costs. Actual
renovation costs may exceed estimated renovation costs, and we may acquire homes in the
future with different characteristics that result in higher renovation costs.
Markets
Stabilized
Homes
Non-
Stabilized
Homes
Total
Homes
(1)
Total Homes
Leased (%)
Average
Acquisition
Cost per Home
Average
Investment
per Home
(2)
Aggregate
Investment
($ in millions)
Average
Home Size
(sq. ft.)
Weighted
Average
Age (year)
Average
Monthly Rent
Per Leased
Home
(3)
Atlanta
1,698
601
2,299
71.1%
95,551
$
117,265
$
269.6
$
1,909
22
1,155
$
South Florida
1,429
320
1,749
82.1%
133,741
$
158,740
$
277.7
1,588
44
1,557
$
Houston
959
190
1,149
79.5%
126,273
$
140,974
$
162.0
2,060
28
1,489
$
Tampa
763
209
972
83.2%
106,884
$
124,699
$
121.2
1,476
40
1,250
$
Dallas
662
253
915
70.5%
127,312
$
146,091
$
133.7
2,050
22
1,457
$
Chicago
316
139
455
76.0%
121,385
$
148,162
$
67.4
1,555
41
1,662
$
Denver
211
130
341
63.9%
183,932
$
212,859
$
72.6
1,512
31
1,708
$
Southern California
267
73
340
82.9%
235,913
$
247,210
$
84.1
1,617
36
1,791
$
Orlando
264
63
327
83.8%
118,158
$
137,110
$
44.8
1,644
37
1,295
$
Phoenix
206
42
248
83.9%
140,329
$
158,213
$
39.2
1,543
39
1,190
$
Northern California
218
26
244
89.3%
216,462
$
230,903
$
56.3
1,494
45
1,727
$
Las Vegas
42
-
42
95.2%
155,717
$
167,481
$
7.0
1,966
27
1,296
$
California Valley
41
-
41
100.0%
226,226
$
227,085
$
9.3
1,728
25
1,612
$
Total/Average
7,076
2,046
9,122
77.5%
127,087
$
147,434
$
1,344.9
$
1,760
32
1,416
$
Status
Total
Homes
(1)
Total Homes
Leased (%)
Average
Acquisition
Cost
Average
Investment
per Home
(2)
Aggregate
Investment
($ in millions)
Average
Home Size
(sq. ft.)
Weighted
Average Age
(year)
Leased
Rent
Stabilized
7,076
95.0%
127,126
$
146,053
$
1,033.5
1,746
32
1,413
$
Non-Stabilized
2,046
16.6%
126,952
$
152,210
$
311.4
1,811
32
1,482
$
Total/Average
9,122
77.5%
127,087
$
147,434
$
1,344.9
$
1,760
32
1,416
$
(3)
Represents average monthly contractual cash rent. Average monthly cash rent is presented
before rent concession and Waypoints. To date, rent concessions and Waypoints
have been utilized on a limited basis and have not had a significant impact on our average
monthly rent. If the use of rent concessions and Waypoints or other leasing incentives
increases in the future, they may have a greater impact by reducing the average monthly rent
we receive from leased homes.
$ |
 14
PORTFOLIO INFORMATION
Total Rental Homes Portfolio –
June 30, 2014 (cont’d)
$95.6
$133.7
$126.3
$106.9
$127.3
$121.4
$183.9
$235.9
$118.2
$140.3
$216.5
$155.7
$226.2
$21.7
$25.0
$14.7
$17.8
$18.8
$26.8
$29.0
$11.3
$18.9
$17.9
$14.4
$11.8
$0.9
$117.3
$158.7
$141.0
$124.7
$146.1
$148.2
$212.9
$247.2
$137.1
$158.2
$230.9
$167.5
$227.1
$0.0
$50.0
$100.0
$150.0
$200.0
$250.0
$300.0
Atlanta
South
Florida
Houston
Tampa
Dallas
Chicago
Denver
Southern
California
Orlando
Phoenix
Northern
California
Las Vegas
California
Valley
Average Investment per Home ($ in thousands)
Average Acquisition Cost per Home
Estimated Renovation Costs |
 Average
Total
Monthly
Monthly
Number of
Number of
Percent
Rent per
Number of
Percent
Rent per
Markets
Homes
(1)
Homes
Leased
Leased Home
(2)
Homes
Leased
Leased Home
(2)
Atlanta
2,299
1,292
97.6%
1,140
$
1,213
93.0%
1,138
$
South Florida
1,749
1,143
99.4%
1,552
$
1,430
94.0%
1,553
$
Houston
1,149
759
99.1%
1,478
$
823
94.5%
1,470
$
Tampa
972
573
99.1%
1,229
$
654
95.2%
1,218
$
Dallas
915
481
99.6%
1,436
$
484
96.7%
1,422
$
Chicago
455
278
97.8%
1,653
$
261
95.0%
1,651
$
Denver
341
149
99.3%
1,700
$
161
97.5%
1,704
$
Southern California
340
230
96.5%
1,799
$
231
95.7%
1,814
$
Orlando
327
199
100.0%
1,308
$
222
98.6%
1,314
$
Phoenix
248
176
100.0%
1,181
$
152
97.4%
1,186
$
Northern California
244
192
100.0%
1,714
$
195
97.9%
1,706
$
Las Vegas
42
36
100.0%
1,309
$
42
95.2%
1,296
$
California Valley
41
37
100.0%
1,589
$
41
100.0%
1,612
$
Total/Average
9,122
5,545
98.8%
1,406
$
5,909
94.9%
1,413
$
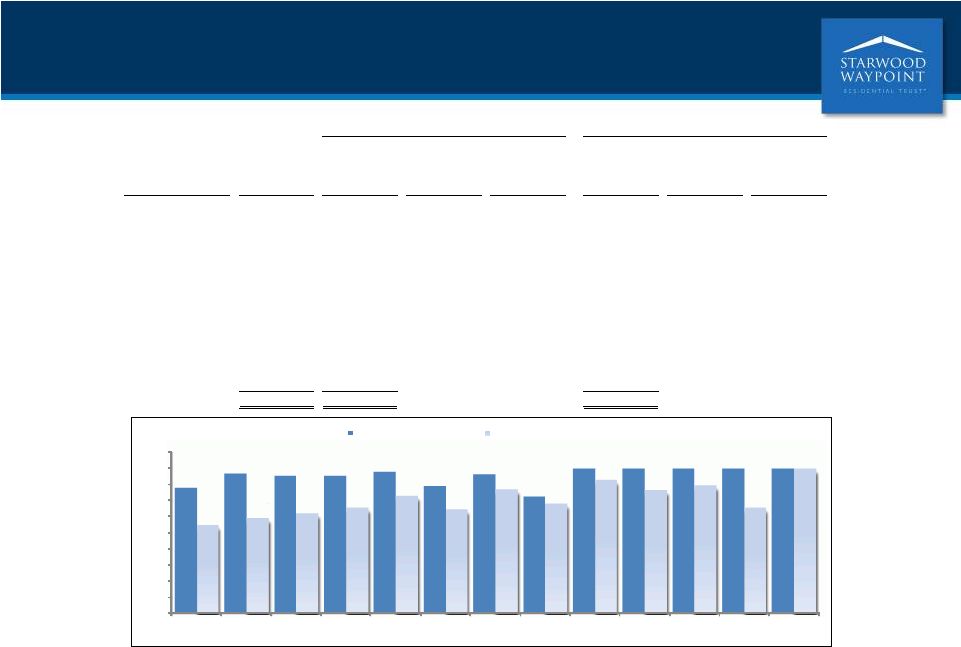
Homes 90 Days Past Rent Ready
Homes Owned 180 Days or Longer
15
PORTFOLIO INFORMATION
Leasing Statistics –
June 30, 2014
97.6%
99.4%
99.1%
99.1%
99.6%
97.8%
99.3%
96.5%
100.0%
100.0%
100.0%
100.0%
100.0%
93.0%
94.0%
94.5%
95.2%
96.7%
95.0%
97.5%
95.7%
98.6%
97.4%
97.9%
95.2%
100.0%
82.0%
84.0%
86.0%
88.0%
90.0%
92.0%
94.0%
96.0%
98.0%
100.0%
102.0%
Atlanta
South Florida
Houston
Tampa
Dallas
Chicago
Denver
Southern
California
Orlando
Phoenix
Northern
California
Las Vegas
California
Valley
Homes 90 Days Past Rent Ready
Homes Owned 180 Days or Longer
(1)
Excludes 285 homes that we did not intend to hold for the long-term. (2)
Represents average monthly contractual cash rent. Average monthly cash
rent is presented before rent concession and Waypoints. To date, rent concessions and Waypoints have
been utilized on a limited basis and have not had a significant impact on our average monthly
rent. If the use of rent concessions and Waypoints or other leasing incentives increases
in the future, they may have a greater impact by reducing the average monthly rent we receive
from leased homes.
|
 16
PORTFOLIO INFORMATION
Non-Performing Loan Portfolio –
June 30, 2014
Total
Loan
Purchase Price
Total UPB
Total BPO
Purchase Price
Purchase Price
Weighted
State
Count
(1),(2)
($ in millions)
($ in millions)
($ in millions)
as % of UPB
as % of BPO
Average LTV
(3)
Florida
762
94.4
$ 187.5
149.0
50.3%
63.3%
152.9%
Illinois
373
47.8
76.0
74.3
62.8%
64.3%
141.0%
Arizona
230
19.9
33.8
29.4
58.7%
67.5%
198.0%
Wisconsin
207
17.4
24.2
27.7
71.6%
62.8%
114.0%
New York
165
32.6
62.8
64.6
51.8%
50.4%
114.0%
California
148
42.9
60.8
68.6
70.6%
62.6%
100.4%
Indiana
152
10.8
15.1
17.1
71.9%
63.5%
109.8%
New Jersey
144
20.7
44.0
37.7
47.2%
54.9%
141.6%
Maryland
100
17.9
31.3
26.6
57.1%
67.1%
132.3%
Pennsylvania
74
6.9
11.7
10.5
58.8%
65.2%
137.7%
Georgia
65
8.0
13.2
12.2
60.8%
66.0%
131.0%
Other
660
77.7
121.3
117.6
64.1%
66.0%
124.4%
Total/Average
3,080
397.0
$ 681.7
635.3
58.2%
62.5%
135.8%
Total
Loan
Purchase Price
Total UPB
Total BPO
Purchase Price
Purchase Price
Weighted
Status
Count
(1),(2)
($ in millions)
($ in millions)
($ in millions)
as % of UPB
as % of BPO
Average LTV
(3)
Foreclosure
2,146
$ 285.5
$ 506.5
$ 457.2
56.4%
62.4%
137.4%
Delinquent
557
61.8
95.9
96.4
64.5%
64.1%
144.4%
Performing
377
49.7
79.3
81.7
62.6%
60.8%
115.3%
Total/Average
3,080
$ 397.0
$ 681.7
$ 635.3
58.2%
62.5%
135.8%
(1)
Represents first liens on 2,920 homes and 160 parcels of land. (2)
Excludes 277 unsecured, second and third liens with an aggregate purchase price
of $1.9 million.
(3)
Weighted average LTV is based on the ratio of UPB to BPO weighted by UPB for each state as of
the respective acquisition dates.
$
$
$
$ |
 17
TRANSACTION ACTIVITY
Acquisitions –
Three Months Ended June 30, 2014
(1)
Includes acquisition costs and actual and estimated upfront renovation costs. Actual
renovation costs may exceed estimated renovation costs, and we may acquire homes in the
future with different characteristics that result in higher renovation costs. (2)
Estimated average monthly rent per home represents (1) for vacant homes,
management’s estimates of what rent would be generated if such homes were leased based on rents
estimated by examining multiple rent data sources (such as realized rents for comparable homes
in neighborhood, a proprietary rent setting algorithm, third-party vendors, etc.) and
using localized knowledge to establish rent for a given property and (2) for leased homes,
average monthly contractual rent. No assurance can be given that these estimates will
prove to be accurate, and you should not place undue reliance on them. Rental Homes:
Markets
Homes
Average Home
Size (sq. ft.)
Average
Acquisition
Cost per Home
Average
Estimated
Upfront
Renovation
Cost per Home
Average
Estimated
Investment
per Home
(1)
Aggregate
Investment
($ in millions)
Estimated
Average
Monthly
Rent per Home
(2)
Atlanta
514
2,013
104,084
$
24,404
$
128,489
$
66.0
$
1,220
$
Dallas
298
2,198
138,546
$
21,444
$
159,990
$
47.7
1,594
$
South Florida
272
1,685
149,994
$
32,316
$
182,310
$
49.6
1,730
$
Houston
219
2,044
126,776
$
22,095
$
148,872
$
32.6
1,572
$
Tampa
200
1,486
106,847
$
19,773
$
126,619
$
25.3
1,297
$
Denver
120
1,703
206,201
$
31,644
$
237,845
$
28.5
1,781
$
Chicago
109
1,528
114,382
$
35,399
$
149,781
$
16.3
1,664
$
Orlando
86
1,422
101,497
$
23,979
$
125,476
$
10.8
1,241
$
Southern California
52
1,649
225,980
$
18,514
$
244,494
$
12.7
1,888
$
Phoenix
45
1,475
128,498
$
28,740
$
157,237
$
7.1
1,202
$
Northern California
28
1,525
226,929
$
18,552
$
245,481
$
7.0
1,866
$
Total/Average
1,943
1,843
131,007
$
25,224
$
156,231
$
303.6
$
1,490
$
Non-Performing Loans:
Total
Purchase
Purchase
Purchase Price
Total UPB
Total BPO
Price as %
Price as %
Number of Loans
($ in millions)
($ in millions)
($ in millions)
of UPB
of BPO
1,441
$ 117.0
$
189.4
$ 171.6
61.8%
68.2% |
 18
Definitions and Reconciliations
($ in thousands, except share and per share data)
Amount
Per Share
Investments in real estate properties, gross
1,442,626
$
36.98
$
Less: Accumulated depreciation
(17,525)
(0.44)
Add: Real estate held for sale,
net 13,383
0.34
Investments in real estate,
net 1,438,484
36.88
Add: Increase in estimated fair value of
investments in real estate 250,459
6.42
Less: Estimated renovation
reserve (155,551)
(3.99)
Estimated SFR Value
1,533,392
39.31
Non-performing loans
178,311
4.57
Non-performing loans
(fair value option) 218,797
5.61
Add: Increase in estimated
fair value of non-performing loans 56,076
1.44
Estimated NPL Value
453,184
11.62
Estimated SFR & NPL Value
1,986,576
$
50.93
$
Total shareholders' equity
1,090,914
$
27.97
$
Less: Investments in real estate, net
(1,438,484)
(36.88)
Less: Non-performing loans
(178,311)
(4.57)
Less: Non-performing loans
(fair value option) (218,797)
(5.61)
Add: Estimated SFR & NPL
Value 1,986,576
50.93
Estimated NAV
1,241,898
$
31.84
$
Number of Shares
39,007,239
June 30, 2014
(unaudited)
or as measures of profitability or liquidity. Further, not all real estate investment trusts
(“REITs”) compute the same non-GAAP measure; therefore, there can be no
assurance that our basis for computing this non- GAAP measure is comparable with
that of other REITs. Funds From Operations (“FFO”) and Core FFO.
FFO is used by industry analysts and investors as a supplemental performance measure of an
equity REIT. FFO is defined by the National Association of Real Estate Investment
Trusts (“NAREIT”) as net income or loss (computed in accordance with GAAP)
excluding gains or losses from sales of previously depreciated real estate assets,
plus depreciation and amortization of real estate assets and adjustments for
unconsolidated partnerships and joint ventures.
We believe that FFO is a meaningful supplemental measure of the operating performance of our
single- family home business because historical cost accounting for real estate
assets in accordance with GAAP assumes that the value of real estate assets diminishes
predictably over time, as reflected through depreciation. Because real estate values
have historically risen or fallen with market conditions, management considers FFO an
appropriate supplemental performance measure because it excludes historical cost
depreciation, as well as gains or losses related to sales of previously depreciated homes,
from GAAP net income. By excluding depreciation and gains or losses on sales of real estate,
management uses FFO to measure returns on its investments in real estate assets.
However, because FFO excludes depreciation and amortization and captures neither the
changes in the value of the homes that result from use or market conditions nor the
level of capital expenditures to maintain the operating performance of the homes, all
of which have real economic effect and could materially impact our results from operations,
the utility of FFO as a measure of our performance is limited.
We believe that Core FFO is a meaningful supplemental measure of our operating performance
for the same reasons as FFO and adjusting for non-routine items that when excluded
allows for more comparable periods. Our Core FFO begins with FFO as defined by the
NAREIT White Paper and is adjusted for: share- based compensation,
non-recurring costs associated with the separation, acquisition fees expensed and
property management engagement costs, write-off of loan costs, loss on derivative
financial instruments, amortization of derivative financial instruments cost and
other non-comparable items as applicable. Management also believes that FFO/Core FFO, combined with the required GAAP presentations, is
useful to investors in providing more meaningful comparisons of the operating
performance of a company’s real estate between periods or as compared to other
companies. FFO/Core FFO does not represent net income or cash flows from operations as
defined by GAAP and is not intended to indicate whether cash flows will be sufficient
to fund cash needs. It should not be considered an alternative to net income as an indicator
of the REIT’s operating performance or to cash flows as a measure of liquidity. Our
FFO/Core FFO may not be comparable to the FFO of other REITs due to the fact that not
all REITs use the NAREIT or similar Core FFO definition. For a reconciliation of FFO
and Core FFO to net loss attributable to common shareholders determined in accordance
with GAAP, please refer to page 10.
occupancy or subsequent occupancy after a renovation. Homes are considered stabilized
even after subsequent resident turnover. However, homes may be removed from the
stabilized home portfolio and placed in the non-stabilized home
portfolio due to renovation during the home lifecycle.
We define Estimated NAV as the estimated value of all assets net of
liabilities. To calculate the Estimated NAV, the historical net investments in real estate and
NPLs at carrying value are deducted from total shareholders’ equity and the
Estimated SFR Value and NPL Value are added (see table below). The costs of
selling properties in the portfolio, including commissions and other related costs are
not deducted for the purpose of calculating the Estimated SFR Value and Estimated NAV.
Further, future promoted interests on the NPL portfolio are not deducted for the
purpose of calculating Estimated SFR & NPL Value and Estimated NAV. We consider
Estimated NAV to be an appropriate supplemental measure as it illustrates the estimated
imbedded value in our SFR portfolio and NPL portfolio that is carried on our balance
sheet primarily at cost. The Estimated SFR Value, Estimated NPL Value and Estimated NAV
are non-GAAP financial measures. However, they are provided for informational
purposes to be used by investors in assessing the value of the assets. A reconciliation
of total shareholders’ equity to Estimated NAV is provided below.
These metrics should be considered along with other available information in valuing and
assessing us, including our GAAP financial measures and other cash flow and yield
metrics. These metrics should not be viewed as a substitute for book value, net
investments in real estate, equity, net income or cash flows from operations prepared
in accordance with GAAP, non-controlling interests less cash and cash
equivalents. Enterprise Value. We define
enterprise value as market value of equity plus debt plus We define the stabilized home
portfolio to include homes from the first day of initial Stabilized Homes.
Estimated
NAV. |
 19
Definitions and Reconciliations (cont’d)
Total NOI, Total NPL NOI, Total Non-Stabilized Portfolio NOI, Total Stabilized Portfolio
NOI and Total Leased Home Portfolio NOI. We define Total NOI as
total revenues less property operating and maintenance expenses and real
estate taxes and insurance expenses (“property operating expenses”) and
mortgage loan servicing costs. We define Total NPL Portfolio NOI as gains on NPLs, net
and gains on loan conversions, net less mortgage loan servicing costs. We define Total Non-
Stabilized Portfolio NOI as total revenues on the non-stabilized portfolio less property
operating expenses on the non-stabilized portfolio. We define Total
Stabilized Portfolio NOI as total revenues on the stabilized portfolio less property
operating expenses on the stabilized portfolio. We define Total Leased Home Portfolio
NOI as the Total Stabilized Portfolio NOI less property operating expenses on vacant
stabilized homes. We consider these NOI measures to be appropriate supplemental
measures of operating performance to net income attributable to common shareholders
because they reflect the operating performance of our homes without allocation of
corporate level overhead or general and administrative costs and reflect the operations
of the segments and sub-segments of our business. A reconciliation of net loss
attributable to common shareholders to these NOI measures is provided below:
These NOI measures should not be considered alternatives to net loss or net cash flows from
operating activities, as determined in accordance with GAAP, as indications of our
performance or as measures of liquidity. Although we use these non-GAAP measures
for comparability in assessing their performance against other REITs, not all REITs
compute the same non-GAAP measures. Accordingly, there can be no assurance that
our basis for computing these non-GAAP measures are comparable with that of other
REITs. Total Rental Portfolio. We define total
rental portfolio to exclude homes designated as non-rental.
Non-rental homes are homes we do not intend to hold for the long term.
Three Months Ended
Six Months Ended
($ in thousands, unaudited)
June 30, 2014
June 30, 2014
Reconciliation of net loss to stabilized portfolio NOI and leased home
portfolio NOI
Net loss attributable to common shareholders
$
(12,116) $
(27,424)
Add (deduct) adjustments to get to total NOI
Non-performing loan management fees and expenses
1,871
4,286
General and administrative
4,444
9,814
Shared-based compensation
2,130
2,459
Investment management fees
3,993
6,750
Separation costs
-
3,543
Acquisition fees expensed and property management engagement costs
186
447
Interest expense, including amortization
5,191
6,691
Depreciation and amortization
7,243
12,716
Finance related expenses and write-off of loan costs
5,441
5,441
Impairment of real estate
1,233
2,067
Realized loss (gain) on sales of investments in real estate, net
56
201
Loss on derivative financial instruments, net
470
470
Income tax expense
350
485
Net income attributable to non-controlling interests
83
73
Total NOI
20,575
28,019
Add (deduct) adjustments to get to total stabilized home portfolio NOI
NPL portfolio NOI components:
Realized gain on non-performing loans, net
(3,357)
(5,200)
Realized gain on loan conversions, net
(6,483)
(11,897)
Mortgage loan servicing costs
5,139
10,021
Unrealized gain on non-performing loans, net
(3,641)
(3,641)
Deduct: Total NPL portfolio NOI
(8,342)
(10,717)
Non-stabilized portfolio NOI components:
Property operating expenses on non-stabilized homes
2,726
5,289
Add: Total Non-stabilized portfolio NOI
2,726
5,289
Total stabilized portfolio NOI
14,959
22,591
Add (deduct) adjustments to get to total leased home portfolio NOI
Property operating expenses on vacant stabilized homes
221
576
Total leased home portfolio NOI
15,180
$
23,167
$
|
 Forward-Looking Statements
The statements herein that are not historical facts are forward-looking statements within
the meaning of Section 27A of the Securities Act of 1933, as amended, and Section 21E
of the Securities Exchange Act of 1934, as amended. These forward-looking statements involve significant risks and
uncertainties, which are difficult to predict, and are not guarantees of future performance.
Such statements can generally be identified by words such as “anticipates,”
“expects,” “intends,” “will,” “could,” “believes,” “estimates,” “continue,” and similar expressions. Forward-looking statements are
based on certain assumptions, discuss future expectations, describe future plans and
strategies, contain financial and operating projections or state other
forward-looking information. Our ability to predict results or the actual effect of future events, actions, plans or strategies is inherently
uncertain. Although we believe that the expectations reflected in such forward-looking
statements are based on reasonable assumptions, our actual results and performance
could differ materially from those set forth in, or implied by, the forward-looking statements. Factors that could materially
and adversely affect our business, financial condition, liquidity, results of operations and
prospects, as well as our ability to make distributions to our shareholders, include,
but are not limited to: expectations regarding the timing of generating revenues; changes in our business and growth
strategies; volatility in the real estate industry, interest rates and spreads, the debt or
equity markets, the economy generally or the rental home market specifically; events or
circumstances that undermine confidence in the financial markets or otherwise have a broad impact on financial
markets; declines in the value of homes, and macroeconomic shifts in demand for, and
competition in the supply of, rental homes; the availability of attractive investment
opportunities in homes that satisfy our investment objective and business and growth strategies; the impact of changes to the
supply of, value of and the returns on distressed and non-performing residential mortgage
loans; our ability to convert the homes and distressed and non-performing
residential mortgage loans we acquire into rental homes generating attractive returns; our ability to successfully modify or otherwise
resolve distressed and non-performing residential mortgage loans; our ability to lease or
re-lease our rental homes to qualified residents on attractive terms or at all; the
failure of residents to pay rent when due or otherwise perform their lease obligations; our ability to manage our portfolio of rental
homes; the concentration of credit risks to which we are exposed; the availability, terms and
deployment of short-term and long-term capital; the adequacy of our cash
reserves and working capital; our relationships with Starwood Capital Group and our manager and their ability to retain
qualified personnel; potential conflicts of interest; unanticipated increases in financing and
other costs; our expected leverage; changes in governmental regulations, tax laws and
rates and similar matters; limitations imposed on our business and our ability to satisfy complex rules in order
for us to qualify as a REIT for U.S. federal income tax purposes; and estimates relating to
our ability to make distributions to our shareholders in the future. You should not
place undue reliance on any forward-looking statement and should consider all of the uncertainties and risks described above,
as well as those more fully discussed in reports and other documents filed by us with the
Securities and Exchange Commission from time to time. Furthermore, except as required
by law, we are under no duty to, and we do not intend to, update any of our forward-looking statements appearing
herein, whether as a result of new information, future events or otherwise.
|