Attached files
| file | filename |
|---|---|
| 8-K - MIDWAY GOLD CORP. - 8-K - Midway Gold Corp | midway8k08132014.htm |

MIDWAY ANNOUNCES SIGNIFICANT UPGRADE IN RESOURCE
AND 2014 BUDGET INCREASE AT SPRING VALLEY PROJECT, NEVADA
August 12, 2014
Denver, Colorado – Midway Gold Corp. ("Midway" or the "Company") (MDW:TSX, MDW:NYSE-MKT) announces substantial resource growth at its Spring Valley project, located in Pershing County, Nevada (“the Project”). The Company has updated the mineral resource estimate to include the 2011-2013 drill results. Midway’s independent consulting engineers, Gustavson Associates, have determined that this drilling has resulted in a 102% increase in Measured & Indicated (“M&I”) ounces to 4.37 million ounces, as well as a 20% increase in the M&I gold grade. In addition, the drilling has resulted in an inferred resource now totaling 1.07 million ounces. Midway also announces its decision to become a 25% joint venture partner, to be carried to production by Barrick free of any additional payments or capital outlays.
“We are thoroughly impressed with the continued growth and the significant quality upgrade at Spring Valley,” said Ken Brunk, President and CEO of Midway. “The accelerated progress on the project continues to give us confidence that Spring Valley has the potential to be a world-class gold mine in the near future. The three drill rigs on site continue to be focused on in-fill drilling and will likely have an even greater future impact on ounce quality as we move forward to completion of a pre-feasibility study in the fall of 2015. The $9 million drilling program and the $8.4 million commitment currently being spent on all of the various engineering and permitting activities speaks to the merits of the project. We are happy to have Barrick as our joint venture partner and pleased to see 2014’s major progress.”
Table 1. Spring Valley Resource Growth
| 2011 MINERAL RESOURCE ESTIMATE1 | à | 2014 MINERAL RESOURCE ESTIMATE2 | |||||
| RESOURCES | TONNES | GRADE | CONTAINED | TONNES | GRADE | CONTAINED | |
| (‘000s) | (g/t) | (‘000s oz) | (‘000s) | (g/t) | (‘000s oz) | ||
| Measured | 59,032 | 0.48 | 931 | 83,000 | 0.60 | 1,590 | |
| Indicated | 85,793 | 0.45 | 1,229 | 162,500 | 0.53 | 2,780 | |
| M&I | 144,825 | 0.46 | 2,160 | 245,500 | 0.55 | 4,370 | |
| Inferred | 103,935 | 0.59 | 1,971 | 71,100 | 0.47 | 1,070 | |
Note: The tonnage and total ounces of gold for resources were determined from the statistical block model. Average grades were calculated from the tonnage and total ounces and then rounded to the significant digits shown. Calculations based on this table may differ due to the effect of rounding.
1Resources as per Independent NI 43-101 Technical Report by Gustavson Associates, LLC (May, 2011). The calculation uses a cutoff grade of 0.14 g/t. An updated report “Updated NI 43-101 Technical Report on the Spring Valley Project, Pershing County, Nevada” dated November 29, 2012 was filed to clarify responsibilities of the Qualified Persons and to clarify language regarding capping, density, and cut-off values. This updated report made no changes to the resource estimate.
2The Mineral Resource Estimate was prepared by Gustavson Associates, LLC (“Gustavson”) of Lakewood, Colorado. The estimate uses a cutoff grade of 0.14 g/t. A NI 43-101 technical report summarizing the Estimate will be filed on SEDAR within 45 days. Gustavson completed the open pit mineral resources, with Zachery Black and Donald E. Hulse acting as the Qualified Persons.
![]()
| August 12, 2014 |  |
Resource Growth
The updated resource estimate for Spring Valley incorporates drill results from 2010-2013. Infill drilling has resulted in a significant increase in resource confidence through the conversion of Inferred ounces into the M&I categories, as well as nearly a 20% increase (from 0.46 g/t to 0.55 g/t) in the M&I gold grade. Gustavson performed the updated resource from all of the drill data, geologic controls from the main rock types, and from implicit grade shells with an Ordinary Kriging algorithm. Prior to statistical treatment, the data was verified by using original third party lab assay certificates.
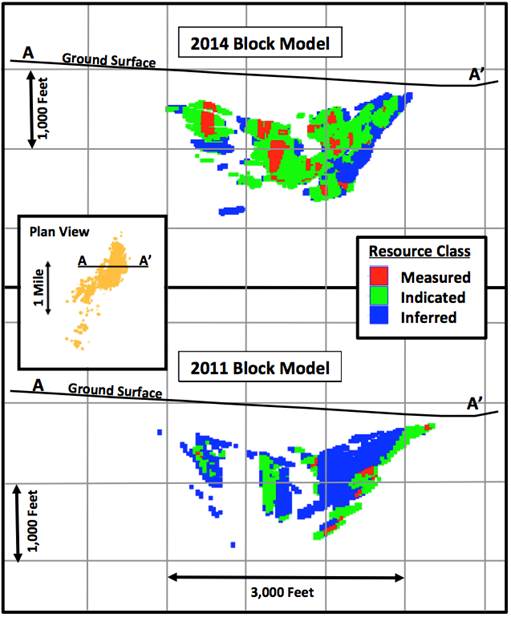
Table 1 compares the previous 2011 Gustavson resource estimate, to the updated 2014 Gustavson resource estimate. In the M&I resource category, tonnage increased by 70%, grade increased by 20%, and contained ounces increased by 102%. The increase in the 2014 estimate from the previous 2011 estimate is largely due to excellent infill drilling results. The cross section in Figure 1 illustrates the upgrade by resource class from 2011 to 2014.
Drilling at Spring Valley has occurred within an area approximately 10,500 feet long in a N20E-S20W direction and up to 3,000 feet wide. The defined gold resource lies within an area 7,500 feet in strike length by 2,300 feet wide. Table 2 lists the amount of drilling completed to date on the Spring Valley project, including the number of meters completed since the 2011 Resource Estimate. In 2011, 519 drill holes were used to calculate a resource estimate, and in 2014, an additional 153 holes (for a total of 672) were available to calculate the new estimate.
Table 2. Drill Data from 2011 to 2014
| 2011 Resource | New Drilling | 2014 Resource | |
| RC Holes | 443 | 88 | 531 |
| RC Meters | 127,856 | 33,231 | 161,087 |
| Core Holes | 76 | 64 | 140 |
| Core Meters | 27,668 | 25,066 | 52,734 |
| Total Drill Holes | 519 | 153 | 672 |
| Total Drill Meters | 125,044 | 58,973 | 184,017 |
Project Development
Barrick’s 2014 project budget is $17.4 million, which includes $9 million for continued in-fill drilling and $8.4 million for preparation of an internal pre-feasibility study and other related project development expenditures. Planned development activities will include additional metallurgical studies, hydrological studies, environmental baseline studies, and geotechnical wall rock stability studies required for mine planning.
Exploration Potential
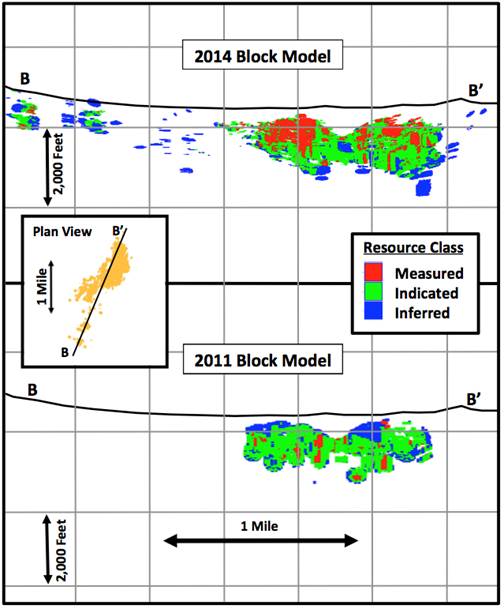
Beyond the resources added by the infill program, Spring Valley has excellent growth potential and exploration upside. The current resource remains open to the south, to the northwest and at depth. A cross-section shown in Figure 2 provides a view of this growth potential by showing an extended lateral resource growth achieved through step-out drilling between 2011 and 2014. Looking west, this cross-section illustrates the growth in the resource to the north and to the south since the 2011 resource estimate.
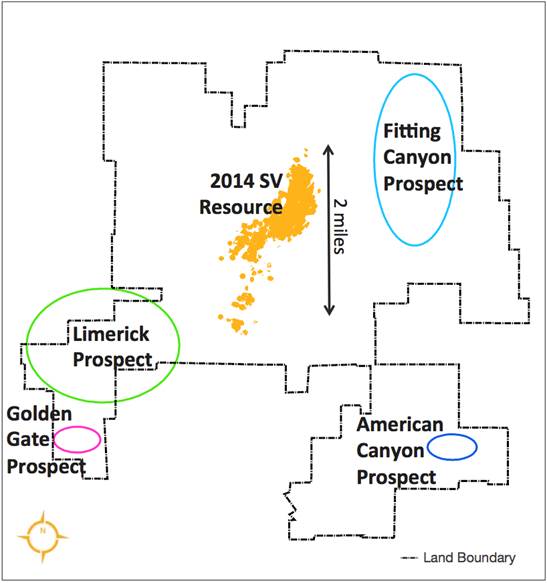
Additionally, a number of high potential drill targets outside of the current resource area have been identified. These targets are based on soil and rock sampling, analysis of geophysical data, detailed geological mapping and historic wide-spaced drill hole data. The map in Figure 3 outlines potential drill targets in relation to the current Spring Valley resource.
| August 12, 2014 | |
Figure 1. East-West Cross-Sections (A-A’) Looking North
Showing 2014 Upgrades in M&I and Inferred Resources
| August 12, 2014 | |
Figure 2. North-South Cross-Sections (B-B’) Looking Northwest
Showing Lateral Growth Achieved Through Step-Out Drilling
| August 12, 2014 | |
Figure 3. Exploration Drill Targets at Spring Valley
| August 12, 2014 | |
Whittle Pit-Defined Spring Valley Resources
The 2014 mineral resource estimate was further analyzed by a Whittle pit optimization program to determine the portion of the resource which has the potential to be mined by open pit methods based upon the current level of resource development. Open pit models were generated at gold prices ranging between $1,100/oz and $1,700/oz in $200/oz increments. The results are listed below in Table 3. The $1,500/oz pit model was selected as the base case due to a 3-year trailing average gold price of $1,543.83/oz.
Table 3. Whittle Pit Shell Mineral Resources at Various Gold Prices at a 0.21 g/t Au Cutoff
| MEASURED | INDICATED | M&I | INFERRED | |||||||||
| PIT | Tonnes | Grade | Contained | Tonnes | Grade | Contained | Tonnes | Grade | Contained | Tonnes | Grade | Contained |
| ($/oz) | (‘000s) | (g/t) | (‘000s oz) | (‘000s) | (g/t) | (‘000s oz) | (‘000s) | (g/t) | (‘000s oz) | (‘000s) | (g/t) | (‘000s oz) |
| $1,100 | 37,600 | 0.99 | 1,200 | 63,200 | 0.81 | 1,640 | 100,800 | 0.88 | 2,840 | 17,200 | 0.67 | 370 |
| $1,300 | 45,400 | 0.97 | 1,410 | 72,200 | 0.80 | 1,860 | 117,600 | 0.86 | 3,270 | 19,600 | 0.73 | 460 |
| $1,500 | 49,400 | 0.94 | 1,490 | 79,900 | 0.79 | 2,030 | 129,300 | 0.84 | 3,510 | 20,700 | 0.74 | 490 |
| $1,700 | 56,000 | 0.86 | 1,550 | 83,100 | 0.79 | 2,120 | 139,000 | 0.82 | 3,660 | 21,200 | 0.73 | 500 |
Note: The mineral resource was estimated using Leap Frog Kriging Grade Shell Estimation routine for domain definition and the Ordinary Kriging estimation algorithm. Whittle pit optimization was used to determine potentially mineable tonnage. Measured, indicated and inferred mineral classification was determined by the variography of each mineral domain. A complete description of the modeling method, environmental and other project risks can be found in the full technical report, which will be filed on Sedar within 45 days. Mineral resources are not mineral reserves; resources have no engineered economic viability and should not be considered economic to mine.
The economic parameters used for this analysis are based upon operating costs of similar sized mines currently operating in Nevada and upon estimated gold recoveries from metallurgical tests completed to date. Table 4 summarizes the estimated cost parameters.
Table 4. Economic Parameters Used for Whittle Pit Analysis
| Item | Cost/Rate | Units |
| Mining Cost | $1.68 | $ per Tonne |
| Processing Cost | $2.94 | $ per Tonne Ore |
| G&A | $0.42 | $ per Tonne Ore |
| Mining Recovery | 95% | |
| Mining Dilution | 5% | |
| Royalties | Up to 7% | |
| Gold Marketing Cost | $1.00 | $ per Troy Ounce |
Spring Valley Project, Nevada
Spring Valley is a large porphyry-hosted gold system located about 20 miles northeast of Lovelock in Pershing County, Nevada. Barrick achieved their earn-in by spending $38 million to earn a 70 percent interest in the project (see February 24, 2014 press release). The project is now run as a joint venture with Barrick as manager. Following today’s announcement, Midway has now converted its 30% interest into a 25% free-carried interest in Spring Valley and will be carried to production, at which point Midway will pay back its share of development capital from production.
About The Resource Estimate
| August 12, 2014 | |
The resource estimate was prepared by Gustavson Associates in accordance with the Canadian Securities Administrators (“CSA”) NI 43-101 and in compliance with the disclosure and reporting requirements set forth in Companion Policy 43-101 CP and Form 101-F1 (June 2011). Resources have been classified in accordance with standards as defined by the Canadian Institute of Mining, Metallurgy and Petroleum(CIM) “CIM Defintion Standards-For Mineral Resources and Mineral Reserves”, prepared by the CIM Standing Committee on Reserve Definitions and adopted by CIM Council on December 17, 2010.
The resource estimate was prepared for and on behalf of Midway Gold Corp and is not a work product of the Spring Valley Joint Venture.
ON BEHALF OF THE BOARD
“Kenneth A. Brunk”
Kenneth A. Brunk, Chairman, President and CEO
About Midway Gold Corp.
Midway Gold Corp. is a precious metals company with a vision to explore, design, build and operate gold mines in a manner accountable to all stakeholders while assuring return on shareholder investments. The Company’s business of mineral exploration has a high level of inherent risk. Although the Company is optimistic about the potential of many of its projects, there is no guarantee that any mineral deposits will be economically feasible and that these deposits will be put into production. The Company’s exploration and development activities may also be affected by a number of risks, including environmental, metallurgical, financing, permitting, approval, legislative and other government risks which are common to the industry and are referenced in greater detail in the Company’s annual report on Form 10-K.
This release has been reviewed and approved for Midway by David Mosch, Corporate Mining Engineer at Midway, and a "qualified person" as that term is defined in NI 43-101.
For more information about Midway, please visit our website at www.midwaygold.com or contact Jaime Wells, Investor Relations Analyst, at (877) 475-3642 (toll-free).
| August 12, 2014 | |
Neither the TSX its Regulation Services Provider (as that term is defined in the policies of the TSX ) nor the NYSE MKT accepts responsibility for the adequacy or accuracy of this release.
This press release contains forward-looking statements about the Company and its business. Forward looking statements are statements that are not historical facts and include, but are not limited to, statements about the Company's intended work plans and resource estimates, including plans for the further development of the Spring Valley Project and plans for a preliminary economic assessment in relation to the Spring Valley Project. Forward-looking statements are typically identified by words such as: “may”, “should”, “plan”, “believe”, “predict”, “expect”, “anticipate”, “intend”, “estimate”, postulate” and similar expressions or the negative of such expressions or which by their nature refer to future events. The forward-looking statements in this press release are subject to various risks, uncertainties and other factors that could cause the Company's actual results or achievements to differ materially from those expressed in or implied by forward looking statements. These risks, uncertainties and other factors include, without limitation, risks related to the timing and completion of the Company's intended work plans, risks related to fluctuations in gold prices; uncertainties related to raising sufficient financing to fund the planned work in a timely manner and on acceptable terms; changes in planned work resulting from weather, logistical, technical or other factors; the possibility that results of work will not fulfill expectations and realize the perceived potential of the Company's properties; uncertainties involved in the interpretation of drilling results and other tests and the estimation of gold resources and reserves; the possibility that required permits may not be obtained on a timely manner or at all; the possibility that capital and operating costs may be higher than currently estimated and may preclude commercial development or render operations uneconomic; the possibility that the estimated recovery rates may not be achieved; risk of accidents, equipment breakdowns and labor disputes or other unanticipated difficulties or interruptions; the possibility of cost overruns or unanticipated expenses in the work program; changes in interest and currency exchanges rates; local and community impacts and issues; environmental costs and risks; and other factors identified in the Company's SEC filings and its filings with Canadian securities regulatory authorities. Forward-looking statements are based on the beliefs, opinions and expectations of the Company's management at the time they are made, and other than as required by applicable securities laws, the Company does not assume any obligation to update its forward-looking statements if those beliefs, opinions or expectations, or other circumstances, should change. Although the Company believes that such forward-looking statements are reasonable, it can give no assurance that such expectations will prove to be correct. For the reasons set forth above, investors should not attribute undue certainty to or place undue reliance on forward-looking statements.
undue reliance on forward-looking statements.
Cautionary note to U.S. investors concerning estimates of reserves and resources: This press release and the documents referenced in this press release use the terms “reserve" and "mineral resource“, which are terms defined under Canadian National Instrument 43-101 and the Canadian Institute of Mining and Metallurgy Classification system. Such definitions differ from the definitions in U.S. Securities and Exchange Commission ("SEC") Industry Guide 7. Under SEC Industry Guide 7 standards, a "final" or "bankable" feasibility study is required to report reserves, the three-year historical average price is used in any reserve or cash flow analysis to designate reserves and the primary environmental analysis or report must be filed with the appropriate governmental authority. Mineral resources are not mineral reserves and do not have demonstrated economic viability. The SEC normally only permits issuers to report mineralization that does not constitute SEC Industry Guide 7 compliant "reserves" as in-place tonnage and grade without reference to unit measures. The references to a “resource” in this press release and the documents referenced in this press release are not normally permitted under the rules of the SEC. It cannot be assumed that all or any part of mineral deposits in any of the above categories will ever be upgraded to Guide 7 compliant reserves. Accordingly, disclosure in this press release and in the technical reports referenced in this press release may not be comparable to information from U.S. companies subject to the reporting and disclosure requirements of the SEC.