Attached files
| file | filename |
|---|---|
| EX-23.3 - EX-23.3 - Zayo Group Holdings, Inc. | d715611dex233.htm |
| EX-23.4 - EX-23.4 - Zayo Group Holdings, Inc. | d715611dex234.htm |
| EX-23.2 - EX-23.2 - Zayo Group Holdings, Inc. | d715611dex232.htm |
| EX-23.1 - EX-23.1 - Zayo Group Holdings, Inc. | d715611dex231.htm |
Table of Contents
As filed with the Securities and Exchange Commission on August 12, 2014
Registration No. 333-197215
UNITED STATES
SECURITIES AND EXCHANGE COMMISSION
Washington, D.C. 20549
Amendment No. 1
to
Form S-1
REGISTRATION STATEMENT
UNDER
THE SECURITIES ACT OF 1933
Zayo Group Holdings, Inc.
(Exact name of registrant as specified in its charter)
| Delaware | 4813 | 26-1398293 | ||
| (State or other incorporation or |
(Primary Standard Industrial Classification Code Number) |
(I.R.S. Employer Identification Number) |
1805 29th Street, Suite 2050
Boulder, CO 80301
(303) 381-4683
(Address, Including Zip Code, and Telephone Number, Including Area Code, of Registrant’s Principal Executive Offices)
Scott E. Beer, Esq.
General Counsel
Zayo Group Holdings, Inc.
1805 29th Street, Suite 2050
Boulder, CO 80301
(303) 381-4683
(Name, Address, Including Zip Code, and Telephone Number, Including Area Code, of Agents For Service)
| With a copy to: | ||
| Brian J. Lane, Esq. Andrew Fabens, Esq. Robyn E. Zolman, Esq. Gibson, Dunn & Crutcher LLP 1801 California Street, Suite 4200 Denver, Colorado 80202-2642 (303) 298-5700 |
James S. Scott, Sr. Esq. Shearman & Sterling LLP 599 Lexington Avenue New York, New York 10022-6069 (212) 848-4000 | |
Approximate date of commencement of proposed sale to the public: As soon as practicable after this registration statement becomes effective.
If the securities being registered on this Form are to be offered on a delayed or continuous basis pursuant to Rule 415 under the Securities Act of 1933 check the following box. ¨
If this Form is filed to register additional securities for an offering pursuant to Rule 462(b) under the Securities Act, please check the following box and list the Securities Act registration statement number of the earlier effective registration statement for the same offering. ¨
If this Form is a post-effective amendment filed pursuant to Rule 462(c) under the Securities Act, check the following box and list the Securities Act registration statement number of the earlier effective registration statement for the same offering. ¨
If this Form is a post-effective amendment filed pursuant to Rule 462(d) under the Securities Act, check the following box and list the Securities Act registration statement number of the earlier effective registration statement for the same offering. ¨
Indicate by check mark whether the registrant is a large accelerated filer, an accelerated filer, a non-accelerated filer, or a smaller reporting company. See the definitions of “large accelerated filer,” “accelerated filer” and “smaller reporting company” in Rule 12b-2 of the Exchange Act.
| Large accelerated filer ¨ | Accelerated filer ¨ | |||||
| Non-accelerated filer x | Smaller reporting company ¨ | |||||
| (Do not check if a smaller reporting company) | ||||||
The registrant hereby amends this registration statement on such date or dates as may be necessary to delay its effective date until the registrant shall file a further amendment which specifically states that this registration statement shall thereafter become effective in accordance with Section 8(a) of the Securities Act of 1933, or until the registration statement shall become effective on such date as the Commission, acting pursuant to said Section 8(a), may determine.
Table of Contents
The information in this preliminary prospectus is not complete and may be changed. We and the selling stockholders may not sell these securities until the registration statement filed with the Securities and Exchange Commission is effective. This preliminary prospectus is not an offer to sell these securities, and we are not soliciting offers to buy these securities in any state where the offer or sale is not permitted.
SUBJECT TO COMPLETION, DATED AUGUST 12, 2014
PROSPECTUS
Shares
Zayo Group Holdings, Inc.

Common Stock
This is Zayo Group Holdings, Inc.’s initial public offering. We are selling shares of our common stock, and the selling stockholders identified in this prospectus, including certain members of our senior management, are selling shares of our common stock. We will not receive any of the proceeds from the sale of shares to be offered by the selling stockholders. We expect the public offering price to be between $ and $ . Prior to this offering, there has been no public market for the shares.
We expect to apply to list our common stock on the under the symbol .
Investing in our common stock involves risks. See “Risk Factors” beginning on page 15 to read about factors you should consider before buying our common stock.
| Price to Public |
Underwriting Discounts and Commissions(1) |
Proceeds, before |
Proceeds, before expenses to the Selling Stockholders |
|||||||||||
| Per Share |
$ | $ | $ | $ | ||||||||||
| Total |
$ | $ | $ | $ | ||||||||||
| (1) | The underwriters will receive compensation in addition to the underwriting discount. See “Underwriting.” |
The underwriters have the option to purchase up to an additional shares from the selling stockholders, at the initial public offering price, less the underwriting discount.
Neither the Securities and Exchange Commission nor any state securities commission has approved or disapproved of these securities or passed upon the adequacy or the accuracy of this prospectus. Any representation to the contrary is a criminal offense.
The underwriters expect to deliver the shares of common stock to purchasers on or about , 2014.
| Morgan Stanley | Barclays | Goldman, Sachs & Co. |
| RBC Capital Markets | Citigroup | SunTrust Robinson Humphrey |
| Cowen and Company | Oppenheimer & Co. | Raymond James | Stephens Inc. | Wells Fargo Securities | William Blair |
Prospectus dated , 2014
Table of Contents
| Page |
||||
| 1 | ||||
| 8 | ||||
| 10 | ||||
| 15 | ||||
| 30 | ||||
| 31 | ||||
| 32 | ||||
| 33 | ||||
| 35 | ||||
| 36 | ||||
| MANAGEMENT’S DISCUSSION AND ANALYSIS OF FINANCIAL CONDITION AND RESULTS OF OPERATIONS |
38 | |||
| 78 | ||||
| 96 | ||||
| 103 | ||||
| 115 | ||||
| 118 | ||||
| 120 | ||||
| 121 | ||||
| 124 | ||||
| MATERIAL U.S. FEDERAL INCOME TAX CONSEQUENCES TO NON-U.S. HOLDERS OF OUR COMMON STOCK |
126 | |||
| 130 | ||||
| 136 | ||||
| 137 | ||||
| 138 | ||||
| F-1 | ||||
| G-1 | ||||
You should rely only upon the information contained in this prospectus or in any free writing prospectus prepared by or on behalf of us. None of us, the underwriters, or the selling stockholders have authorized anyone to provide you with additional or different information. If anyone provides you with additional, different or inconsistent information, you should not rely on it. If you are in a jurisdiction where offers to sell, or solicitations of offers to purchase, shares of our common stock are unlawful, or if you are a person to whom it is unlawful to direct these types of activities, then the offer presented in this document does not extend to you. You should assume the information appearing in this prospectus is accurate only as of the respective dates of such information. Our business, financial condition, results of operations, and prospects may have changed since those dates.
Market, Industry, and Other Data
In this prospectus, we rely on and refer to information and statistics regarding our industry, including papers produced by: Cisco Systems, Inc., entitled “Visual Networking Index (VNI) Global Mobile Data Traffic Forecast Update Feb-2014” and “VNI Global IP Traffic Forecast, 2013-2018;” Gartner, Inc., entitled “Forecast: The Internet of Things, Worldwide, 2013;” Nielsen, entitled “The Cross-Platform Report;” RightScale® Inc., entitled “State of the Cloud Report;” Sandvine, entitled “Global Internet Phenomena Report” (available at www.sandvine.com/trends/global-internet-phenomena); and Vertical Systems Group’s ENS (Emerging Networks Service) Research. We obtained this market data from independent industry publications or other publicly
i
Table of Contents
available information. Industry surveys, publications, consultant surveys, and forecasts generally state that the information contained therein has been obtained from sources believed to be reliable, but completeness of such information is not guaranteed. We take responsibility for compiling and extracting, but we have not ascertained the underlying economic assumptions relied upon therein. Forecasts are particularly likely to be inaccurate, especially over long periods of time. While we are not aware of any misstatements regarding market data, industry data, and forecasts presented herein, estimates in such information involve risks and uncertainties and are subject to change based on various factors, including those discussed under “Risk Factors” in this prospectus.
The Gartner Report described herein (the “Gartner Report”) represents data, research opinion or viewpoints published as part of a syndicated subscription service by Gartner, Inc. (“Gartner”), and are not representations of fact. The Gartner Report speaks as of its original publication date (and not as of the date of this prospectus) and the opinions expressed in the Gartner Report are subject to change without notice. The Gartner Report consists of “Forecast: The Internet of Things, Worldwide, 2013” published November 18, 2013 by Peter Middleton, Peter Kjeldsen, and Jim Tully.
Non-GAAP Financial Measures
We have included certain financial measures in this prospectus that are not defined under generally accepted accounting principles in the United States, or GAAP, including Adjusted EBITDA, Adjusted EBITDA Margin, levered free cash flow, and annualized revenue and annualized Adjusted EBITDA.
Adjusted EBITDA is defined as earnings from continuing operations before interest, income taxes, depreciation, and amortization (“EBITDA”), adjusted to exclude acquisition-related transaction costs, losses on extinguishment of debt, stock-based compensation, unrealized foreign currency translation gains on an intercompany loan, and impairment of cost method investment. Adjusted EBITDA Margin is defined as Adjusted EBITDA divided by revenue. Levered free cash flow is defined as net cash flows provided by operating activities minus purchases of property and equipment, net of stimulus grant. These measures are not measurements of our financial performance under GAAP and should not be considered in isolation or as alternatives to net income, net cash flows provided by operating activities, total net cash flows or any other performance measures derived in accordance with GAAP or as alternatives to net cash flows from operating activities or total net cash flows as measures of our liquidity.
We use Adjusted EBITDA to evaluate our operating performance and liquidity, and we use levered free cash flow as a measure to evaluate cash generated through normal operating activities. These metrics are among the primary measures used by management for planning and forecasting future periods. We believe the presentation of Adjusted EBITDA is relevant and useful for investors because it allows investors to view results in a manner similar to the method used by management and make it easier to compare our results with the results of other companies that have different financing and capital structures. We believe that the presentation of levered free cash flow is relevant and useful to investors because it provides a measure of cash available to pay the principal on our debt and pursue acquisitions of businesses or other strategic investments or uses of capital.
We also monitor Adjusted EBITDA because our subsidiaries have debt covenants that restrict their borrowing capacity that are based on a leverage ratio, which utilizes a modified EBITDA, as defined in our credit agreement and the indentures governing our notes. The modified EBITDA is consistent with our definition of Adjusted EBITDA; however, it includes the pro forma Adjusted EBITDA of and expected cost synergies from the companies acquired by us during the quarter for which the debt compliance certification is due. Adjusted EBITDA results, along with the quantitative and qualitative information, are also utilized by management and our Compensation Committee for purposes of determining bonus payments to employees.
ii
Table of Contents
Adjusted EBITDA has limitations as an analytical tool and should not be considered in isolation from, or as a substitute for, analysis of our results of operations and operating cash flows as reported under GAAP. For example, Adjusted EBITDA:
| • | does not reflect capital expenditures, or future requirements for capital and major maintenance expenditures or contractual commitments; |
| • | does not reflect changes in, or cash requirements for, our working capital needs; |
| • | does not reflect the significant interest expense, or the cash requirements necessary to service the interest payments, on our debt; and |
| • | does not reflect cash required to pay income taxes. |
Levered free cash flow has limitations as an analytical tool and should not be considered in isolation from, or as a substitute for, analysis of our results as reported under GAAP. For example, while it does include cash interest, levered free cash flow:
| • | does not reflect principal payments on debt; |
| • | does not reflect principal payments on capital lease obligations; |
| • | does not reflect any dividend payments, if any; and |
| • | does not reflect the cost of acquisitions. |
Our computation of Adjusted EBITDA and levered free cash flow may not be comparable to other similarly titled measures computed by other companies because all companies do not calculate these measures in the same fashion.
Because we have acquired numerous entities since our inception and incurred transaction costs in connection with each acquisition, borrowed money in order to finance our operations and acquisitions, and used capital and intangible assets in our business, and because the payment of income taxes is necessary if we generate taxable income after the utilization of our net operating loss carryforwards, any measure that excludes these items has material limitations. As a result of these limitations, these measures should not be considered as a measure of discretionary cash available to us to invest in the growth of our business or as a measure of our liquidity. See “Summary Consolidated Financial Information and Other Data” for a quantitative reconciliation of Adjusted EBITDA to net income/(loss) and for a quantitative reconciliation of levered free cash flow to net cash flows provided by operating activities.
Annualized revenue and annualized Adjusted EBITDA are derived by multiplying the total revenue and Adjusted EBITDA, respectively, for the most recent quarterly period by four. Our computations of annualized revenue and annualized Adjusted EBITDA may not be representative of our actual annual results.
iii
Table of Contents
This summary highlights some of the information contained in this prospectus. This summary may not contain all of the information that may be important to you. For a more complete understanding of our business and this offering, we encourage you to read this entire prospectus, including “Risk Factors,” “Management’s Discussion and Analysis of Financial Condition and Results of Operations,” the more detailed information regarding our Company and the common stock being sold in this offering, as well as our consolidated financial statements and the related notes appearing elsewhere in this prospectus, before deciding to invest in our common stock. Some of the statements in this prospectus constitute forward-looking statements. See “Forward-Looking Statements.”
A chart summarizing our corporate structure is on page 8 of this prospectus. Prior to the Restructuring (as described below under “—Restructuring”) and the consummation of this offering, Zayo Group Holdings, Inc. was a direct, wholly owned subsidiary of Communications Infrastructure Investments, LLC (“CII”). Unless the context otherwise requires, “we,” “us,” “our” and the “Company” refers to Zayo Group Holdings, Inc. and its consolidated subsidiaries, including Zayo Group, LLC (“ZGL”).
Our industry uses many terms and acronyms that may not be familiar to you. To assist you in reading this prospectus, we have provided definitions of some of these terms in the “Glossary of Terms” beginning on page G-1 of this prospectus.
OVERVIEW
We are a large and fast growing provider of bandwidth infrastructure in the United States and Europe. Our products and services enable mission-critical, high-bandwidth applications, such as cloud-based computing, video, mobile, social media, machine-to-machine connectivity, and other bandwidth-intensive applications. Key products include leased dark fiber, fiber to cellular towers and small cell sites, dedicated wavelength connections, Ethernet and IP connectivity and other high-bandwidth offerings. We provide our services over a unique set of dense metro, regional, and long-haul fiber networks and through our interconnect-oriented datacenter facilities. Our fiber networks and datacenter facilities are critical components of the overall physical network architecture of the Internet and private networks. Our customer base includes some of the largest and most sophisticated consumers of bandwidth infrastructure services, such as wireless service providers; telecommunications service providers; financial services companies; social networking, media, and web content companies; education, research, and healthcare institutions; and governmental agencies. We typically provide our bandwidth infrastructure services for a fixed monthly recurring fee under contracts that vary between one and twenty years in length. As of March 31, 2014, we had more than $4.3 billion in revenue under contract with a weighted average remaining contract term of 42 months. We operate our business with a unique focus on capital allocation and financial performance with the ultimate goal of maximizing equity value for our stockholders. Our core values center on partnership, alignment, and transparency with our three primary constituent groups—employees, customers, and stockholders. For the years ended June 30, 2012 and 2013, we generated revenue of $376 million and $1,004 million, Adjusted EBITDA of $188 million and $554 million, and a net loss of $1 million and $137 million, respectively. For the quarter ended March 31, 2014, we generated annualized revenue of $1,139 million and annualized Adjusted EBITDA of $662 million. See “Non-GAAP Financial Measures” and “Summary Consolidated Financial Information and Other Data” for a reconciliation of Adjusted EBITDA to net income (loss).
We were founded in 2007 with the investment thesis of building a bandwidth infrastructure platform to take advantage of the favorable Internet, data, and wireless growth trends driving the demand for bandwidth infrastructure, and to be an active participant in the consolidation of the industry. The growth of cloud-based computing, video, mobile and social media applications, machine-to-machine connectivity, and other bandwidth-intensive applications continues to drive rapidly increasing consumption of bandwidth on a global basis. Cisco estimates that, from 2013 to 2018, mobile data traffic will grow at an annual rate of 61% and that IP traffic will grow at an annual rate of 21% through 2018. Additionally, according to Gartner in its November 18, 2013 report,
1
Table of Contents
Forecast: The Internet of Things, Worldwide, 2013, “[t]he installed base of ‘things,’ excluding PCs, tablets and smartphones, will grow to 26 billion units in 2020, which is almost a 30-fold increase from 0.9 billion units in 2009.” As an early believer in the enduring nature of these trends, we assembled our asset base and built a business model specifically to provide high-bandwidth connectivity to customers whose businesses depend most on the continuous and growing demand for bandwidth. As a core tenet of our strategy for capitalizing on these industry trends, we have been a leading consolidator in the industry and have acquired 32 bandwidth infrastructure businesses and assets to date. Our owned, secure, and redundant fiber network and datacenters serve as the foundation for our bandwidth solutions and allow us to offer customers both physical infrastructure and lit services. We believe the continuous demand for additional bandwidth from service providers, enterprises and consumers, combined with our unique and dense metro, regional, and long-haul networks, position us as a mission-critical infrastructure supplier to the largest users of bandwidth.
Our network footprint includes both large and small metro geographies, the extended suburban regions of many cities, and the large rural, national and international links that connect our metro networks. We believe that our network assets would be difficult to replicate given the geographic reach, network density, and capital investment required. As of March 31, 2014, our fiber networks spanned over 77,000 route miles and 5,700,000 fiber miles (representing an average of 74 fibers per route), served 297 geographic markets in the United States and Europe, and connected to 14,490 buildings, including 3,838 cellular towers and 527 datacenters. We own fiber networks in almost 300 metro markets, including large metro areas, such as New York, Chicago, San Francisco, and London, as well as smaller metro areas, such as Allentown, Pennsylvania, Fargo, North Dakota, and Spokane, Washington. Our networks allow us to provide our high-bandwidth infrastructure services to our customers over redundant fiber facilities between key customer locations. As of March 31, 2014, we owned over 93% of our fiber miles, the remainder of which were operated by us under long-term IRU contracts with an average remaining contract term of 9 years. We believe our ownership and the location and density of our expansive network footprint allow us to more competitively service our target customers’ bandwidth infrastructure needs at the local, regional, national, and international level relative to other regional bandwidth infrastructure service providers or long-haul carriers. We also provide our network-neutral colocation and interconnection services utilizing our own datacenters located within major carrier hotels and other strategic buildings in 27 locations throughout the United States and, as of March 31, 2014, operate more than 200,000 square feet of billable colocation space.
The density and geographic reach of our network footprint allow us to provide tailored bandwidth infrastructure solutions on our own network (“on-net”) that address the current and future bandwidth needs of our customers. Our dense metro and regional networks have high fiber counts that enable us to provide both our physical infrastructure services (e.g., dark fiber) and our lit services (e.g., wavelengths and Ethernet). Our networks are deep and scalable, meaning we have spare fiber, conduit access rights and/or rights of way that allow us to continue to add capacity to our network as our existing and new customers’ demand for our services increases. In addition, many of our core network technologies provide capacity through which we can continue to add wavelengths to our network without consuming additional fiber. We also believe the density and diversity of our networks provide a strong and growing competitive barrier to protect our existing revenue base. We believe our networks provide significant opportunity to organically connect to new customer locations, datacenters, towers, or small cell locations to help us achieve an attractive return on our capital deployed. Since our founding, we have assembled a large portfolio of fiber networks and colocation assets through both acquisitions and customer demand-driven investments in property and equipment. From our inception to date, we have completed acquisitions with an aggregate purchase consideration, net of cash acquired, totaling approximately $3.9 billion. For the period from July 1, 2012 through March 31, 2014, we also invested an additional $598 million in capital expenditures primarily to expand the reach and capacity of our networks. As of March 31, 2014, our total debt (including capital lease obligations) was $2,990.2 million and was primarily incurred in connection with acquisitions.
Our business model focuses on providing on-net bandwidth infrastructure solutions to our customers, which results in what we refer to as “infrastructure economics.” Infrastructure economics are characterized by attractive
2
Table of Contents
revenue visibility, strong Adjusted EBITDA margins coupled with operating leverage for new revenue, success-based capital investments with low maintenance capital needs, and the ability to generate significant cash flow over time. For the nine month period ended March 31, 2014, over 98% of our revenue was recurring in nature with a weighted average remaining contract term of over 42 months. Our Adjusted EBITDA margin for the quarter ended March 31, 2014 was 58% due to our infrastructure-based, on-net strategy. Additionally, our Adjusted EBITDA margin on incremental revenue is approximately 70%, highlighting the operating leverage we achieve through our asset base and on-net focus. See “Non-GAAP Financial Measures.” Our capital expenditure investments are predominantly success-based, meaning that before we commit resources to expand our network, we have a signed customer contract that will provide us with an attractive return on the required capital. For the nine month period ended March 31, 2014, 77% of our total capital expenditures of $266 million were success-based, with customers providing up-front cash payments of $113 million, largely used to finance our network expansion. After committing capital to connect additional customer sites, our goal is to sell additional high-bandwidth connectivity on these new routes at a relatively low incremental cost, which further enhances the return we extract from our asset base. Finally, the combination of our scale and infrastructure economics results in the ability to generate meaningful free cash flow over time. For the nine month period ended March 31, 2014, we generated $135 million of levered free cash flow. See “Non-GAAP Financial Measures” and “Summary Consolidated Financial Information and Other Data” for a reconciliation of levered free cash flow to net cash flows provided by operating activities.
Our management is intensely focused on creating equity value for our stockholders. Our equity value creation philosophy includes regular and rigorous financial and operational measurement, financial transparency (both internally and externally), and clear alignment of interests among employees, management, and stockholders. Our real-time measurement and reporting system serves as the foundation for our decision making and our extensive financial and operational disclosure. We also believe in fostering an entrepreneurial culture that aligns the interests of our employees, management, and stockholders. Following this offering, assuming an initial public offering price at the midpoint of the estimated price range set forth on the cover of this prospectus, our management and employees are expected to own % of our shares. Additionally, following our initial public offering, most employees are expected to have a significant portion of their performance-based compensation paid in restricted stock that will be tied directly to the level of equity value created.
OUR COMPANY
We provide high-bandwidth infrastructure services over our extensive metro, regional, and long-haul fiber networks and through our interconnect-oriented datacenter facilities. We focus on customers who are very large consumers of bandwidth, including wireless and wireline carriers, media companies, Internet companies, governments, and very large enterprises. We provide two major types of products and services, which form the basis for our primary operating segments: Physical Infrastructure and Lit Services. Across our Physical Infrastructure and Lit Services units, we operate seven individual Strategic Product Groups. Each Strategic Product Group has financial accountability and decision-making authority, which promotes agility in the fast-moving markets we serve.
Physical Infrastructure. Through our Physical Infrastructure segment, we provide raw bandwidth infrastructure to customers that require more control of their internal networks. These services include dark fiber, mobile infrastructure (fiber-to-the-tower and small cell), and colocation and interconnection. Dark fiber is a physically separate and secure, private platform for dedicated bandwidth. We lease dark fiber pairs (usually two to 12 total fibers) to our customers, who “light” the fiber using their own optronics. Our mobile infrastructure services provide direct fiber connections to cell towers, small cells, hub sites, and mobile switching centers. Our datacenters offer colocation and interconnection services to our customers, who then house and power their computing and networking equipment for the purpose of aggregating and distributing data, voice, Internet, and video traffic. The contract terms in our Physical Infrastructure segment generally range from three to twenty years.
3
Table of Contents
Lit Services. Our Lit Services segment provides bandwidth infrastructure solutions over our metro, regional, and long-haul fiber networks where we use optronics to light the fiber and our customers pay us for access based on the amount and type of bandwidth they purchase. Our lit services include wavelength, Ethernet, IP, and SONET services. We target customers who require a minimum of 10G of bandwidth across their networks. The contract terms in this segment typically range from two to five years.
We also have an Other segment currently comprised of our eighth Strategic Product Group, Zayo Professional Services (“ZPS”). ZPS is our professional services business that provides network management and technical resources to our customers.
Our sales force of approximately 120 quota bearing representatives serves all of our Strategic Product Groups and is organized by customer. Our average sales representative generated approximately $15,000 of new monthly recurring revenue per month during the quarter ended March 31, 2014. Our sales force compensation includes both a base salary and a commission component. The commission plan is based on the net present value (“NPV”) of the total contract value sold less the required capital and certain operating expenses, which we believe aligns our sales force with the corporate objective of maximizing equity value created. We have recently launched a new on-line portal, “Tranzact,” which is designed to provide our sales people and customers the opportunity to evaluate and purchase bandwidth infrastructure services on demand using an integrated platform.
We utilize an integrated, custom-built cloud-based operating and reporting platform that is used universally across our Company. This system provides management the ability to monitor business activities, including quoting new business, order processing, installation planning, billing, and customer service. We believe our customized platform provides us a competitive advantage as it enables us to identify emerging trends in our business, constantly monitor the underlying economics of our contracts and capital plan, and provide our customers with commercial solutions and high-quality, responsive customer service. Each of the companies we acquire is rapidly integrated into our customized platform, which improves efficiency and helps drive the realization of cost synergies.
OUR MISSION STATEMENT
Our mission is to be the premier provider of bandwidth infrastructure services in the United States, Europe, and beyond for years and decades to come. We seek to accomplish this goal through our steadfast commitment to:
| • | Our Employees: Provide an environment where we are the employer of choice for highly skilled, entrepreneurial employees who want to build their careers in the transformational technology space while being key contributors to a winning organization. |
| • | Our Customers: Provide exceptional performance for customers, starting with the best purchasing and solution design experience and continuing through service activation, billing, and service management, thereby earning the role of trusted advisor and strategic partner. |
| • | Our Services: Offer innovative physical infrastructure (fiber, space and power, and mobile infrastructure) and lit services (Wavelengths, Ethernet, IP, and SONET) to customers who most depend on bandwidth for their business activities. |
| • | Our Network: Develop and manage network and colocation assets, the strategic underpinnings of our service offerings, through investments and acquisitions. |
| • | Our Stockholders: Deliver exceptional results to our stockholders supported by transparent and consistent measurement and disclosure of business performance, and a compensation philosophy that aligns the interests of management and employees with those of stockholders. |
4
Table of Contents
OUR BUSINESS STRATEGY
In pursuit of our mission, our Business Strategy includes the following key elements:
| • | Focus on Bandwidth Infrastructure. We expect that bandwidth needs for mobile applications, cloud-based computing, and machine-to-machine connectivity will continue to grow with the continued adoption of bandwidth-intensive devices, as well as the escalating demand for Internet-delivered video. We focus on providing high-bandwidth infrastructure solutions, which we believe are essential in the consumption and delivery of bandwidth-intensive applications and services by enterprise customers and communications service providers. We believe our disciplined approach to providing these critical services to our targeted customers enables us to offer a high level of customer service, while at the same time being responsive to changes in the marketplace. |
| • | Target Large Consumers of Bandwidth. Our asset base and product suite are geared for large consumers of bandwidth with high connectivity requirements. The majority of our customers require more than 10G of bandwidth; many of our customers require multiple terabytes of bandwidth. Our revenue base is generally characterized by customers with a high bandwidth spend, consisting of a large number of individual services and increasing bandwidth infrastructure service demand. Tailoring our operations around these products, services and customers allows us to operate efficiently and meet these large consumers’ requirements for mission-critical infrastructure. |
| • | Leverage Our Extensive Asset Base by Selling Services on Our Network. Targeting our sales efforts on services that utilize our existing fiber networks and datacenters enables us to limit our reliance on third-party service providers. We believe this in turn produces high incremental margins, which helps us expand consolidated margins, achieve attractive returns on the capital we invest, and realize significant levered free cash flow. We also believe this enables us to provide our customers with a superior level of customer service due to the relative ease in responding to customer service inquiries over one contiguous fiber network. Our existing networks enable us to sell additional bandwidth to our existing customers as their capacity needs grow. |
| • | Continue to Expand Our Infrastructure Assets. Our ability to rapidly add network capacity to meet the growing requirements of our customers is an important component of our value proposition. We will continue to seek opportunities to expand our network footprint where supporting customer contracts provide an attractive return on our investment. The expansion of our network footprint also provides the ancillary benefit of bringing other potential customer locations within reach. We design our networks with additional capacity so that increasing bandwidth capacity can be deployed economically and efficiently. A significant portion of our capital expenditures are success-based. |
| • | Leverage Our Existing Relationships and Assets to Innovate. We believe we possess a unique set of assets and management systems designed to deliver customer solutions tailored to specific trends we observe in the marketplace. Our high-energy, entrepreneurial culture fosters employee innovation on an ongoing basis in response to specific customer requirements. Furthermore, we plan to continue to commit capital to new lines of infrastructure businesses that leverage our existing assets. For example, we are expanding into small cell infrastructure services provided to wireless services providers. These services entail us providing dark fiber and related services from a small cell location back to a mobile switching center. We provide the fiber-based transport over our existing and/or newly constructed fiber networks. In addition, we provide network-neutral space and power for wireless service providers to co-locate their small cell antennas and ancillary equipment. |
| • | Intelligently Expand Through Acquisitions. We have made 32 acquisitions to date for an aggregate purchase price, net of cash, of $3.9 billion, and associated with these acquisitions, we have |
5
Table of Contents
| acquired approximately $400 million of Adjusted EBITDA based on the quarter prior to each acquisition’s close annualized. See “Business—Business Strategy” for an explanation of acquired Adjusted EBITDA. We believe we have consistently demonstrated an ability to acquire and effectively integrate companies, realize cost synergies, and organically grow revenue and Adjusted EBITDA post-acquisition. Acquisitions have the ability to increase the scale of our operations, which in turn affords us the ability to expand our operating leverage, extend our network reach, and broaden our customer base. To date, we have identified and planned, although not fully realized, cost synergies representing over $160 million in annual recurring cost savings. We believe that we have realized approximately 80% of our planned cost synergies to date. To achieve the remaining unrealized cost synergies, we expect to incur one-time costs of approximately $5 million, comprised of severance expense, and capital expenditures and early termination fees related to eliminating third party network expense. We believe our ability to realize significant cost synergies through acquisitions provides us with a competitive advantage in future consolidation opportunities within our industry. See “Business—Business Strategy” for an explanation of planned cost synergies. We will continue to evaluate potential acquisition opportunities and are regularly involved in acquisition discussions. We will evaluate these opportunities based on a number of criteria, including the quality of the infrastructure assets, the fit within our existing businesses, the opportunity to expand our network, and the opportunity to create value through the realization of cost synergies. |
OUR COMPETITIVE STRENGTHS
We believe the following are among our core competitive strengths and enable us to differentiate ourselves in the markets we serve:
| • | Unique Bandwidth Infrastructure Assets. We believe replicating our extensive metro, regional, and long-haul fiber assets would be difficult given the significant capital, time, permitting, and expertise required. As of March 31, 2014, our fiber spanned over 77,000 route miles and 5,700,000 fiber miles (representing an average of 74 fibers per route), served 297 geographic markets in the United States and Europe, and connected to 14,490 buildings. The majority of the markets that we serve and buildings to which we connect have few other networks capable of providing similar high-bandwidth infrastructure and connectivity solutions, which we believe provides us with a sustainable competitive advantage in these markets, and positions us as a mission-critical infrastructure supplier to the largest users of bandwidth. We believe that the vast majority of customers using our network, including our lit bandwidth, fiber-to-the-tower, and dark fiber customers, choose our services due to the quality and reach of our network, and the ability our network gives us to innovate and scale with their growing bandwidth needs. Additionally, we operate 27 datacenter facilities, which are located in eight of the most important carrier hotels in the U.S. This collective presence, combined with our high network density, creates a network effect that helps us retain existing customers and attract new customers. We believe the uniqueness of our network and our focus on investment in infrastructure assets provides us with the ability to enhance our high Adjusted EBITDA margin profile. From July 1, 2012 through March 31, 2014, exclusive of acquisitions, we have invested $598 million of capital in our networks, including expansion and maintenance expenditures. |
| • | Strong Revenue Growth, Visibility, and Durability. We have consistently grown our organic revenue, as gross installed revenue has exceeded churn processed in every quarter since we began reporting in March 2010. We believe our exposure to the enduring trend of increasing bandwidth consumption combined with our focused execution have allowed us to achieve this consistent growth. We typically provide our bandwidth infrastructure services for a fixed monthly recurring fee under multi-year contracts. Our contract terms range from one year to twenty years with a weighted average contract term of approximately 72 months for contracts entered into during the twelve months ended March 31, 2014. As of March 31, 2014, we had more than $4.3 billion in revenue under contract with a weighted average remaining contract life of 42 months. Our customers use our bandwidth infrastructure to support their mission-critical networks and applications. The switching costs and effort required to replace our services |
6
Table of Contents
| can be high, particularly for the services within our Physical Infrastructure segment, given the criticality of our services and the potential cost and disruption. We believe that increasing bandwidth needs combined with the mission-critical nature of our services provided under multi-year contracts create strong revenue growth, visibility, and durability, which support our decision-making abilities and financial stability. |
| • | Customer Service and Ability to Innovate for Our Customers. Our sales and product professionals work closely with potential and existing customers to design tailored high-bandwidth connectivity solutions across our eight Strategic Product Groups to meet specific, varying, and evolving customer needs. We are focused on delivering high-quality, reliable service to our customers. We achieve this by leveraging our contiguous network to expand with our customers as they seek to build scale, coverage, and/or performance. Additionally, our focus on serving the largest and most sophisticated users of bandwidth keeps our sales, engineering, and service organizations attuned to the latest technologies, architectures, and solutions that our customers may seek to implement. We believe our willingness to innovate for our customers and our dedication to customer service help establish our position as an important infrastructure supplier and allow us to attract new customers and businesses, sell an increasing amount of services to our existing customers, and reduce customer turnover. From March 31, 2013 through March 31, 2014, existing customers accounted for over 85% of newly installed monthly recurring revenue. |
| • | Strategic, Operational and Financial Transparency Excellence. As part of our strategy to serve the largest users of bandwidth, we have completed and integrated 32 acquisitions to date. Our acquired assets have been combined to create a contiguous network with the ability to provision and maintain local, regional, national, or international high-bandwidth connections across our eight Strategic Product Groups. Our entire network, sales and churn activity, installation pipeline, NPV commission plans, and all customer contracts are managed through an integrated operating and reporting platform, which gives management strong visibility into the business and improves our ability to drive return-maximizing decisions throughout the organization. We believe this approach creates efficiency, as evidenced by identified and planned, though not fully realized to date, cost synergies representing over $160 million in annual recurring cost savings from our 32 acquisitions to date. We also believe this approach allows for the integration of additional network assets whether through new builds or acquisitions. Our focus on operational and financial transparency not only allows us to be very nimble in attacking various market opportunities, but also provides us the ability to deliver disclosure that our stockholders and other stakeholders can use to accurately judge management’s performance from a capital allocation, financial, and operational perspective. |
| • | Financially Focused and Entrepreneurial Culture. Virtually all operational and financial decisions we make are driven by the standard of maximizing the value of our enterprise. Our sales commission plans use an NPV-based approach with the goal of encouraging the proper behavior within our sales force, and our eight Strategic Product Groups are held to group level equity internal rate of return (“IRR”) targets set by management. Additionally, to align individual behaviors with stockholder objectives, equity compensation is used throughout the Company, and our compensation plans include a larger equity component than we believe is standard in our industry. We expect that our employees will own % of our outstanding shares following this offering, assuming an initial public offering price at the midpoint of the estimated price range set forth on the cover of this prospectus, which we believe is a significantly higher percentage than other public peers. In addition to striving for industry-leading operational and growth outcomes to drive value creation, we are prepared to use debt capacity to enhance stockholder returns, but not at the expense of other stakeholders and only at levels we believe are in the long-term interests of the Company, our customers, and our stockholders. Finally, our owners’ manual, mission statement, and investor transparency all serve to enhance cultural alignment across the Company and our stockholders. |
7
Table of Contents
| • | Experienced Management with Unique Leadership Approach. We have assembled an experienced management team that we believe is well-qualified to lead our company and execute our strategy. Our management team has substantial industry experience in managing and designing fiber networks and network-neutral colocation and interconnection facilities and in selling and marketing bandwidth infrastructure services. In addition, our management team has significant experience in acquiring and integrating bandwidth infrastructure and assets. Our management team is a cohesive unit with a common history that in many cases precedes the Company’s founding. We also believe that our approach to leadership—operationally, financially, culturally—is unique in our industry and differentiates us from our competitors. |
RESTRUCTURING
The Company is currently wholly-owned by CII, which is owned by a number of private equity investors and individuals who are our current or former employees. Prior to this offering, we will engage in a reorganization involving CII as a result of which shares of our common stock (after giving effect to a :1 stock split) will be distributed to the members of CII in accordance with their distribution rights under the existing operating agreement of CII, and shares of our common stock will be retained to be subsequently distributed to the members of CII following resolution of contingent distributions among the members of CII. It is expected that after this offering, CII will own approximately shares, or %, of our outstanding common stock, which will be distributed to the unitholders of CII subsequent to this offering as described above. We refer to these transactions as our “Restructuring.”
Our principal executive office is located at 1805 29th Street, Suite 2050, Boulder, Colorado 80301. Our telephone number at that address is (303) 381-4683. Our website address is www.zayo.com. Information on our website is deemed not to be a part of this prospectus.
A simplified summary of our corporate structure following this offering appears below.
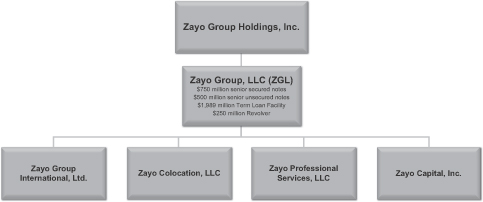
We are a Delaware corporation formed in 2007, and as of March 31, 2014, we had 1,421 employees. Our fiscal year ends June 30 each year, and we refer to the fiscal year ending June 30, 2014 as “Fiscal 2014,” the fiscal year ended June 30, 2013 as “Fiscal 2013,” the fiscal year ended June 30, 2012 as “Fiscal 2012,” and the fiscal year ended June 30, 2011 as “Fiscal 2011.”
8
Table of Contents
RISKS TO CONSIDER
We are subject to a number of risks, including risks that may prevent us from achieving our business objectives or that may adversely affect our business, financial condition, results of operations, cash flows, and prospects. You should carefully consider the following risks, including the risks discussed in the section entitled “Risk Factors,” before investing in our common stock:
| • | We have consistently generated net losses since our inception and expect such losses to continue for at least several years. |
| • | Since our inception, we have used more cash than we have generated from operations, and we may continue to do so. |
| • | We are highly dependent on our management team and other key employees, many of whom own equity that has been illiquid but will become liquid as a result of this offering. |
| • | Our revenue is relatively concentrated among a small number of customers, and the loss of any of these customers could significantly harm our business, financial condition, results of operations, and cash flows. |
| • | Future acquisitions are a component of our strategic plan, and will include integration and other risks that could harm our business. |
| • | We are growing rapidly and may not maintain or efficiently manage our growth. |
| • | Any failure of our physical infrastructure or services could lead to significant costs and disruptions. |
| • | We use franchises, licenses, permits, rights-of-way, conduit leases, fiber agreements, and property leases, which could be canceled or not renewed. |
| • | We are required to maintain, repair, upgrade, and replace our network and our facilities, the cost of which could materially impact our results and our failure to do so could irreparably harm our business. |
| • | Our debt level could negatively impact our financial condition, results of operations, cash flows, and business prospects and could prevent us from fulfilling our obligations under our outstanding indebtedness. In the future, we may incur substantially more indebtedness, which could further increase the risks associated with our leverage. |
| • | Our debt agreements contain restrictions on our ability to operate our business and to pursue our business strategies, and our failure to comply with these covenants could result in an acceleration of our indebtedness. |
| • | Our future tax liabilities are not predictable or controllable. If we become subject to increased levels of taxation, our financial condition and operations could be negatively impacted. |
| • | The international operations of our business expose us to risks that could materially and adversely affect the business. |
| • | We may be vulnerable to security breaches that could disrupt our operations and adversely affect our business and operations. |
9
Table of Contents
| Total common stock offered |
shares |
| Common stock offered by us |
shares |
| Common stock offered by the selling stockholders |
shares |
| Option to purchase additional shares |
shares |
| Common stock to be outstanding immediately after this offering |
shares |
| Use of proceeds |
We estimate that the net proceeds to us from this offering, after deducting the underwriting discount and estimated offering expenses payable by us, will be approximately $ million, assuming the shares are offered at $ per share (the midpoint of the estimated price range set forth on the cover of this prospectus). |
| We will not receive any proceeds from the sale of shares by the selling stockholders. |
| We intend to use the net proceeds from the sale of common stock by us in this offering for general corporate purposes, which may include some or all of the following: repayment of certain existing indebtedness, acquisitions, working capital, and capital expenditures, and to pay other fees and expenses incurred in connection with this offering. Although we are always evaluating attractive bandwidth infrastructure acquisitions, we have not at this time identified any acquisition candidate for which we intend to use a portion of the proceeds of this offering. See “Use of Proceeds.” |
| Principal stockholders |
Following the Restructuring and the completion of this offering, our five largest stockholders are expected to be: GTCR LLC, which will beneficially own approximately shares, or %, of our outstanding common stock, Oak Investment Partners XII, Limited Partnership, which will beneficially own approximately shares, or %, of our outstanding common stock, Columbia Capital, which will beneficially own approximately shares, or %, of our outstanding common stock, M/C Partners, which will beneficially own approximately shares, or %, of our outstanding common stock, and Charlesbank Capital Partners, which will beneficially own approximately shares, or %, of our outstanding common stock. |
None of our principal or other selling stockholders will receive any expense reimbursement or other fees in connection with this offering.
| Dividend policy |
We currently intend to retain all available funds and any future earnings for use in the operation of our business, and therefore we do |
10
Table of Contents
| not anticipate paying any cash dividends in the foreseeable future. Any future determination to pay dividends will be at the discretion of our board of directors and will depend upon our financial condition, results of operations, cash flows, capital requirements, and other factors that our board of directors deems relevant. We are a holding company, and substantially all of our operations are carried out by our subsidiary, ZGL, and its subsidiaries. ZGL’s ability to pay dividends to us is limited by its credit agreement and the indentures governing its outstanding notes, which may in turn limit our ability to pay dividends on our common stock. Our ability to pay dividends may also be restricted by the terms of any future credit agreement or any future debt or preferred securities of ours or of our subsidiaries. See “Dividend Policy.” |
| Risk factors |
Investing in our common stock involves a high degree of risk. See “Risk Factors” beginning on page 15 of this prospectus for a discussion of factors you should carefully consider before deciding to invest in our common stock. |
Proposed symbol for trading on
Unless otherwise indicated, all information in this prospectus relating to the number of shares of our common stock to be outstanding immediately after this offering:
| • | excludes shares reserved for future grants under our equity compensation plans; |
| • | assumes an initial public offering price of $ per share (the midpoint of the estimated price range set forth on the cover of this prospectus); and |
| • | assumes no exercise by the underwriters of their option to purchase up to additional shares from the selling stockholders. |
11
Table of Contents
SUMMARY CONSOLIDATED FINANCIAL INFORMATION AND OTHER DATA
The following table summarizes our historical consolidated financial information for the periods and as of the dates indicated. The selected historical consolidated financial information as of June 30, 2012 and 2013 and for the years ended June 30, 2011, 2012 and 2013 is derived from, and qualified by reference to, our audited consolidated financial statements included elsewhere in this prospectus. The selected historical consolidated financial information as of June 30, 2011 is derived from our audited consolidated financial statements not included in this prospectus. The selected historical consolidated financial information as of March 31, 2014 and for the nine months ended March 31, 2013 and 2014 is derived from, and qualified by reference to, our unaudited consolidated financial statements included elsewhere in this prospectus. The selected historical consolidated financial information as of March 31, 2013 is derived from our unaudited consolidated financial statements not included in this prospectus. Our unaudited consolidated financial statements have been prepared on the same basis as our audited consolidated financial statements and, in our opinion, reflect all adjustments, consisting only of normal and recurring adjustments, necessary for a fair presentation of such financial statements in all material respects.
The financial data set forth in the following tables should be read in conjunction with our historical consolidated financial statements and related notes and “Management’s Discussion and Analysis of Financial Condition and Results of Operations,” each included elsewhere in this prospectus. The results for any interim period are not necessarily indicative of the results that may be expected for a full year or any future period.
| Year Ended June 30, | Nine Months Ended March 31, |
|||||||||||||||||||
| 2011 | 2012 | 2013 | 2013 | 2014 | ||||||||||||||||
| (unaudited) | (unaudited) | |||||||||||||||||||
| Consolidated Statements of Operations Data (in thousands): |
||||||||||||||||||||
| Revenue |
$ | 282,143 | $ | 375,526 | $ | 1,004,354 | $ | 742,647 | $ | 826,537 | ||||||||||
|
|
|
|
|
|
|
|
|
|
|
|||||||||||
| Operating costs and expenses |
||||||||||||||||||||
| Operating costs, excluding depreciation and amortization |
70,978 | 82,083 | 145,877 | 110,032 | 110,634 | |||||||||||||||
| Selling, general and administrative expenses, excluding stock-based compensation expenses |
88,414 | 112,410 | 318,523 | 233,393 | 234,395 | |||||||||||||||
| Stock-based compensation |
24,310 | 26,253 | 105,849 | 67,913 | 165,134 | |||||||||||||||
|
|
|
|
|
|
|
|
|
|
|
|||||||||||
| Selling, general and administrative expenses |
112,724 | 138,663 | 424,372 | 301,306 | 399,529 | |||||||||||||||
| Depreciation and amortization |
60,463 | 84,961 | 324,532 | 243,880 | 246,922 | |||||||||||||||
|
|
|
|
|
|
|
|
|
|
|
|||||||||||
| Total operating costs and expenses |
244,165 | 305,707 | 894,781 | 655,218 | 757,085 | |||||||||||||||
|
|
|
|
|
|
|
|
|
|
|
|||||||||||
| Operating income |
37,978 | 69,819 | 109,573 | 87,429 | 69,452 | |||||||||||||||
|
|
|
|
|
|
|
|
|
|
|
|||||||||||
| Interest expense |
(33,414 | ) | (50,720 | ) | (202,464 | ) | (164,807 | ) | (150,905 | ) | ||||||||||
| Impairment of cost method investment |
— | (2,248 | ) | — | — | — | ||||||||||||||
| Other income/(expense), net |
(126 | ) | 123 | 326 | 302 | 1,266 | ||||||||||||||
| Loss on extinguishment of debt |
— | — | (77,253 | ) | (77,253 | ) | (1,911 | ) | ||||||||||||
|
|
|
|
|
|
|
|
|
|
|
|||||||||||
| Total other expenses, net |
(33,540 | ) | (52,845 | ) | (279,391 | ) | (241,758 | ) | (151,550 | ) | ||||||||||
|
|
|
|
|
|
|
|
|
|
|
|||||||||||
| Earnings/(loss) from continuing operations before income taxes |
4,438 | 16,974 | (169,818 | ) | (154,329 | ) | (82,098 | ) | ||||||||||||
| Provision/(benefit) for income taxes |
11,329 | 26,871 | (24,205 | ) | (33,549 | ) | 27,202 | |||||||||||||
|
|
|
|
|
|
|
|
|
|
|
|||||||||||
| Loss from continuing operations |
(6,891 | ) | (9,897 | ) | (145,613 | ) | (120,780 | ) | (109,300 | ) | ||||||||||
| Earnings from discontinued operations, net of income taxes |
5,331 | 8,673 | 8,396 | 7,488 | 3,655 | |||||||||||||||
|
|
|
|
|
|
|
|
|
|
|
|||||||||||
| Net loss |
$ | (1,560 | ) | $ | (1,224 | ) | $ | (137,217 | ) | $ | (113,292 | ) | $ | (105,645 | ) | |||||
|
|
|
|
|
|
|
|
|
|
|
|||||||||||
12
Table of Contents
| Year Ended June 30, | Nine Months Ended March 31, |
|||||||||||||||||||
| 2011 | 2012 | 2013 | 2013 | 2014 | ||||||||||||||||
| (unaudited) | (unaudited) | |||||||||||||||||||
| Consolidated Balance Sheet Data (at period end) (in thousands): |
||||||||||||||||||||
| Cash and cash equivalents |
$ | 25,394 | $ | 150,693 | $ | 91,313 | $ | 70,177 | $ | 254,607 | ||||||||||
| Property and equipment, net |
518,513 | 754,738 | 2,437,707 | 2,363,339 | 2,533,256 | |||||||||||||||
| Total assets |
849,396 | 1,442,055 | 4,251,240 | 4,166,825 | 4,561,816 | |||||||||||||||
| Long-term debt and capital lease obligations, including current portion |
365,588 | 701,339 | 2,843,872 | 2,850,919 | 2,990,241 | |||||||||||||||
| Total stockholder’s equity |
258,083 | 410,314 | 606,253 | 632,766 | 517,319 | |||||||||||||||
| Selected cash flow data (in thousands): |
||||||||||||||||||||
| Net cash flows provided by operating |
$ | 99,502 | $ | 167,630 | $ | 404,883 | $ | 268,265 | $ | 401,321 | ||||||||||
|
|
|
|
|
|
|
|
|
|
|
|||||||||||
| Purchases of property and equipment, net of stimulus grants(1) |
$ | (112,524 | ) | $ | (124,137 | ) | $ | (323,232 | ) | $ | (221,328 | ) | $ | (265,872 | ) | |||||
| Acquisitions |
$ | (183,666 | ) | $ | (351,273 | ) | $ | (2,480,738 | ) | $ | (2,473,675 | ) | $ | (101,009 | ) | |||||
| Net cash flows used in investing activities from continuing operations |
$ | (296,162 | ) | $ | (475,410 | ) | $ | (2,803,970 | ) | $ | (2,695,003 | ) | $ | (366,881 | ) | |||||
| Net cash flows provided by financing |
$ | 134,190 | $ | 433,079 | $ | 2,340,029 | $ | 2,346,803 | $ | 128,396 | ||||||||||
|
|
|
|
|
|
|
|
|
|
|
|||||||||||
| Other Financial Data and Operating Data: |
||||||||||||||||||||
| Adjusted EBITDA (in thousands)(2) |
$ | 123,490 | $ | 187,786 | $ | 554,429 | $ | 412,571 | $ | 482,619 | ||||||||||
| Levered free cash flow (in thousands)(3) |
135,449 | |||||||||||||||||||
| Customers |
986 | 1,292 | 4,091 | 3,910 | 4,276 | |||||||||||||||
| Total revenue under contract ($ in millions)(4) |
$ | 1,098 | $ | 1,874 | $ | 3,521 | $ | 3,388 | $ | 4,363 | ||||||||||
| Weighted average remaining contract term (in months)(5) |
38 | 46 | 37 | 36 | 42 | |||||||||||||||
| Route miles |
24,251 | 46,504 | 75,839 | 74,325 | 77,113 | |||||||||||||||
| Fiber miles |
1,008,205 | 2,054,118 | 5,442,780 | 5,404,310 | 5,723,984 | |||||||||||||||
| On-net buildings |
4,393 | 6,055 | 12,222 | 11,740 | 14,490 | |||||||||||||||
| Reconciliation of Adjusted EBITDA: |
||||||||||||||||||||
| Net loss |
$ | (1,560 | ) | $ | (1,224 | ) | $ | (137,217 | ) | $ | (113,292 | ) | $ | (105,645 | ) | |||||
| Earnings from discontinued operations, net of income taxes |
5,331 | 8,673 | 8,396 | 7,488 | 3,655 | |||||||||||||||
|
|
|
|
|
|
|
|
|
|
|
|||||||||||
| Net loss from continuing operations |
(6,891 | ) | (9,897 | ) | (145,613 | ) | (120,780 | ) | (109,300 | ) | ||||||||||
| Add back non-adjusted EBITDA items included in loss from continuing operations: |
||||||||||||||||||||
| Depreciation and amortization |
60,463 | 84,961 | 324,532 | 243,880 | 246,922 | |||||||||||||||
| Interest expense |
33,414 | 50,720 | 202,464 | 164,807 | 150,905 | |||||||||||||||
| Provision/(benefit) for income taxes |
11,329 | 26,871 | (24,205 | ) | (33,549 | ) | 27,202 | |||||||||||||
| Stock-based compensation |
24,310 | 26,253 | 105,849 | 67,913 | 165,134 | |||||||||||||||
| Loss on extinguishment of debt |
— | — | 77,253 | 77,253 | 1,911 | |||||||||||||||
| Impairment of cost method investment |
— | 2,248 | — | — | — | |||||||||||||||
| Unrealized foreign currency translation gains(6) |
— | — | (55 | ) | (42 | ) | (944 | ) | ||||||||||||
| Transaction costs(7) |
865 | 6,630 | 14,204 | 13,089 | 789 | |||||||||||||||
|
|
|
|
|
|
|
|
|
|
|
|||||||||||
| Adjusted EBITDA |
$ | 123,490 | $ | 187,786 | $ | 554,429 | $ | 412,571 | $ | 482,619 | ||||||||||
|
|
|
|
|
|
|
|
|
|
|
|||||||||||
13
Table of Contents
| Nine Months Ended March 31, |
||||
| 2014 | ||||
| Reconciliation of Levered Free Cash Flow (in thousands): |
||||
| Net cash flows provided by operating activities from continuing operations |
$ | 401,321 | ||
| Purchase of property and equipment, net of stimulus grant |
(265,872 | ) | ||
|
|
|
|||
| Levered Free Cash Flow |
$ | 135,449 | ||
|
|
|
|||
(1) See Note 2—Basis of Presentation and Significant Accounting Policies—n. Government Grants to our audited consolidated financial statements for an explanation of our stimulus grants.
(2) Adjusted EBITDA is not a financial measurement prepared in accordance with GAAP. We define Adjusted EBITDA as earnings from continuing operations before interest, income taxes, depreciation and amortization (“EBITDA”) adjusted to exclude acquisition-related transaction costs, losses on extinguishment of debt, stock-based compensation, unrealized foreign currency translation gains on an intercompany loan, and impairment of cost method investment. See “Non-GAAP Financial Measures.” The table above sets forth, for the periods indicated, a reconciliation of net loss to Adjusted EBITDA, as net loss is calculated in accordance with GAAP.
(3) Levered free cash flow is not a financial measurement prepared in accordance with GAAP. We define levered free cash flow as net cash flows provided by operating activities minus purchases of property and equipment, net of stimulus grants received. See “Non-GAAP Financial Measures.” The table sets forth, for the periods indicated, a reconciliation of net cash flows provided by operating activities to levered free cash flow.
(4) Monthly recurring revenue (“MRR”) and monthly amortized revenue (“MAR”) under contract multiplied by the remaining contract term in months as of the reporting date, with a deemed maximum original contract term of twenty years.
(5) The weighted average remaining contract term is equal to revenue under contract divided by the sum of MRR and MAR on last day of quarter and MRR and MAR associated with cumulative gross new sales (bookings) that have not yet become gross installed revenue (have not been activated or installed), excluding intercompany sales.
(6) Unrealized foreign currency translation gains result from the translation of an intercompany loan to a foreign subsidiary denominated in U.S. dollars to British pounds, the functional currency of the subsidiary.
(7) Transaction costs include expenses associated with professional services (i.e., legal, accounting, regulatory, etc.) rendered in connection with signed and/or closed acquisitions, travel expense, severance expense incurred on the date of acquisition, and other direct expenses incurred that are associated with such acquisitions.
14
Table of Contents
This offering and an investment in our common stock involve a high degree of risk. You should carefully consider the risks and uncertainties described below, together with the risks and uncertainties described elsewhere in this prospectus, including our consolidated financial statements and the related notes contained elsewhere in this prospectus, before you decide to purchase shares of our common stock. If any of the following risks or uncertainties actually occurs, our business, financial condition, results of operations, cash flow and prospects could be materially and adversely affected. As a result, the price of our common stock could decline and you could lose all or part of your investment in our common stock.
Risks Related to our Business
We have consistently generated net losses since our inception and expect such losses to continue for at least several years.
We have consistently generated net losses since our inception and expect such losses to continue for at least several years. These net losses primarily have been driven by significant depreciation, amortization, interest expense, and stock-based compensation. During the nine months ended March 31, 2014, we had depreciation and amortization expense of $246.9 million and interest expense of $150.9 million. At March 31, 2014, we had $2,990.2 million of total debt (including capital leases). We cannot assure you that we will generate net income in the future.
Since our inception, we have used more cash than we have generated from operations, and we may continue to do so.
Since our inception, we have consistently consumed our entire positive cash flow generated from operating activities with our investing activities. Our investing activities have consisted principally of the acquisition of businesses as well as material additions to property and equipment. We have funded the excess of cash used in investing activities over cash provided by operating activities with proceeds from equity contributions and debt issuances.
We intend to continue to invest in expanding our fiber network and our business and pursuing acquisitions that we believe provide an attractive return on our capital. These investments may continue to exceed the amount of capital available from operations after debt service requirements. To the extent that our investments exceed our cash flow from operations, we plan to rely on potential future debt or equity issuances, which could increase interest expense or dilute your interest as a stockholder, as well as cash on hand and borrowings under our revolving credit facility. We cannot assure you, however, that we will be able to obtain or continue to have access to sufficient capital to successfully grow our business.
We are highly dependent on our management team and other key employees, many of whom own equity that has been illiquid but will become liquid as a result of this offering.
We expect that our continued success will largely depend upon the efforts and abilities of members of our management team and other key employees. Our success also depends upon our ability to identify, attract, develop, and retain qualified employees. None of the executive management team except for Mr. Caruso is bound by an employment agreement with us. If we lost members of our management team or other key employees, it would likely have a material adverse effect on our business.
All of our officers and many of our key management and employees have had a significant portion of their compensation paid in equity. Our employees, including members of our senior management, will offer a total of shares for sale in this offering. While subject to the underwriters’ lock-up agreement and other restrictions on trading (including continued vesting), a substantial portion of management and employee equity will be vested at the time of this offering and is expected to become tradable after the expiration of the 180-day
15
Table of Contents
lock-up agreement with the underwriters. This liquidity will in many cases represent material wealth of our officers and key management employees that may impact retention and focus of existing key employees.
Our revenue is relatively concentrated among a small number of customers, and the loss of any of these customers could significantly harm our business, financial condition, results of operations, and cash flows.
Our largest single customer accounted for approximately 7% of our revenue during the year ended June 30, 2013, and total revenues from our top ten customers accounted for approximately 30% of our revenue during the year ended June 30, 2013. We currently depend, and expect to continue to depend, upon a relatively small number of customers for a significant percentage of our revenue. Many of these customers are also competitors for some or all of our service offerings. Our customer contracts typically have terms of one to twenty years. Our customers may elect not to renew these contracts. Furthermore, our customer contracts are terminable for cause if we breach a material provision of the contract. We may face increased competition and pricing pressure as our customer contracts become subject to renewal. Our customers may negotiate renewal of their contracts at lower rates, for fewer services or for shorter terms. Many of our customers are in the telecommunications industry, which is undergoing consolidation. To the extent that two or more of our customers combine, they may be able to use their greater size to negotiate lower prices from us and may purchase fewer services from us, especially if their networks overlap. If we are unable to successfully renew our customer contracts on commercially acceptable terms, or if our customer contracts are terminated, our business could suffer.
We are also subject to credit risk associated with the concentration of our accounts receivable from our key customers. If one or more of these customers were to become bankrupt, insolvent or otherwise were unable to pay for the services provided by us, we may incur significant write-offs of accounts receivable or incur impairment charges.
We have numerous customer orders for connections, including contracts with multiple national wireless carriers to build out additional towers. If we are unable to satisfy new orders or build our network according to contractually specified deadlines, we may incur penalties or suffer the loss of revenue.
Future acquisitions are a component of our strategic plan, and will include integration and other risks that could harm our business.
We intend to continue to acquire complementary businesses and assets, and some of these acquisitions may be large or in new geographic areas where we do not currently operate. This exposes us to the risk that when we evaluate a potential acquisition target we over-estimate the target’s value and, as a result, pay too much for it. We also cannot be certain that we will be able to successfully integrate acquired assets or the operations of the acquired entity with our existing operations. We may engage in large acquisitions, which could be much more difficult to integrate. Difficulties with integration could cause material customer disruption and dissatisfaction, which could in turn increase churn and reduce new sales. Additionally, we may not be able to integrate acquired businesses in a manner that permits us to realize the cost synergies we anticipate in the time, manner, or amount we currently expect, or at all. Our actual cost synergies, cost savings, growth opportunities, and efficiency and operational benefits resulting from any acquisition may be lower and may take longer to realize than we currently expect.
We may incur additional debt or issue additional equity to assist in the funding of these potential transactions, which may increase our leverage and/or dilute your interest as a stockholder. Further, additional transactions could cause disruption of our ongoing business and divert management’s attention from the management of daily operations to the closing and integration of the acquired business. Acquisitions also involve other operational and financial risks such as:
| • | increased demand on our existing employees and management related to the increase in the size of the business and the possible distraction from our existing business due to the acquisition; |
| • | loss of key employees and salespeople of the acquired business; |
16
Table of Contents
| • | liabilities of the acquired business, both unknown and known at the time of the consummation of the acquisition; |
| • | discovery that the financial statements we relied on to buy a business were incorrect; |
| • | expenses associated with the integration of the operations of the acquired business; |
| • | the possibility of future impairment, write-downs of goodwill and other intangibles associated with the acquired business; |
| • | finding that the services and operations of the acquired business do not meet the level of quality of those of our existing services and operations; and |
| • | recognizing that the internal controls of the acquired business were inadequate. |
We are growing rapidly and may not maintain or efficiently manage our growth.
We have rapidly grown our company through acquisitions of companies and assets as well as expansion of our own network and the acquisition of new customers through our own sales efforts. We also intend to continue to grow our company, including through acquisitions, some of which may be large. Customers can be reluctant to switch providers of bandwidth services because it can involve substantial expense and technical difficulty. That can make it harder for us to acquire new customers through our own sales efforts. Our expansion may place strains on our management and our operational and financial infrastructure. Our ability to manage our growth will be particularly dependent upon our ability to:
| • | expand, develop, and retain an effective sales force and other qualified personnel; |
| • | maintain the quality of our operations and our service offerings; |
| • | attract customers to switch from their current providers to us in spite of the costs associated with switching providers; |
| • | maintain and enhance our system of internal controls to ensure timely and accurate reporting; and |
| • | expand our operational information systems in order to support our growth, including integrating new customers without disruption. |
Service level agreements in our customer agreements could subject us to liability or the loss of revenue.
Our contracts with customers typically contain service guarantees (including network availability) and service delivery date targets, which could enable customers to claim credits and, under certain conditions, terminate their agreements. Our inability to meet our service level guarantees could adversely affect our revenue. In Fiscal 2013, lost revenue from failure to meet service level guarantees was approximately $335,000. While we typically have carve-outs for force majeure events, many events, such as fiber cuts, equipment failure and third-party vendors being unable to meet their underlying commitments with us, could impact our ability to meet our service level agreements.
Any failure of our physical infrastructure or services could lead to significant costs and disruptions.
Our business depends on providing customers with highly reliable service. The services we provide are subject to failure resulting from numerous factors, including:
| • | human error; |
| • | power loss; |
17
Table of Contents
| • | improper building maintenance by the landlords of the buildings in which our datacenters are located; |
| • | physical or electronic security breaches; |
| • | fire, earthquake, hurricane, flood, and other natural disasters; |
| • | water damage; |
| • | the effect of war, terrorism, and any related conflicts or similar events worldwide; and |
| • | sabotage and vandalism. |
Problems within our network or our datacenters, whether within our control or the control of our landlords or other third-party providers, could result in service interruptions or equipment damage. In the past, we have experienced disruptions in our network attributed to equipment failure and power outages. Although such disruptions have been remedied and the network has been stabilized, there can be no assurance that similar disruptions will not occur in the future. Given the service level agreement obligations we typically have in our customer contracts, such disruptions could result in customer credits; however, we cannot assume that our customers will accept these credits as compensation in the future, and we may face additional liability.
We use franchises, licenses, permits, rights-of-way, conduit leases, fiber agreements, and property leases, which could be canceled or not renewed.
We must maintain rights-of-way, franchises, and other permits from railroads, utilities, state highway authorities, local governments, transit authorities, and others to operate our owned fiber network. We cannot be certain that we will be successful in maintaining these rights-of-way agreements or obtaining future agreements on acceptable terms. Some of these agreements are short-term or revocable at will, and we cannot assure you that we will continue to have access to existing rights-of-way after they have expired or terminated. If a material portion of these agreements are terminated or are not renewed, we might be forced to abandon our networks. In order to operate our networks, we must also maintain fiber leases and IRU agreements that we have with public and private entities. There is no assurance that we will be able to renew those fiber routes on favorable terms, or at all. If we are unable to renew those fiber routes on favorable terms, we may fact increased costs or reduced revenues.
In order to expand our network to new locations, we often need to obtain additional rights-of-way, franchises, and other permits. Our failure to obtain these rights in a prompt and cost-effective manner may prevent us from expanding our network, which may be necessary to meet our contractual obligations to our customers and could expose us to liabilities.
If we lose or are unable to renew key real property leases where we have located our POPs, it could adversely affect our services and increase our costs, as we would be required to restructure our network and move our POPs.
We are required to maintain, repair, upgrade, and replace our network and our facilities, the cost of which could materially impact our results and our failure to do so could irreparably harm our business.
Our business requires that we maintain, repair, upgrade, and periodically replace our facilities and networks. This requires management time and capital expenditures. In the event that we fail to maintain, repair, upgrade, or replace essential portions of our network or facilities, it could lead to a material degradation in the level of service that we provide to our customers. Our networks can be damaged in a number of ways, including by other parties engaged in construction close to our network facilities. In the event of such damage, we will be required to incur expenses to repair the network. We could be subject to significant network repair and replacement expenses in the event a terrorist attack or a natural disaster damages our network. Further, the operation of our network requires the coordination and integration of sophisticated and highly specialized hardware and software. Our failure to maintain or properly operate this can lead to degradations or interruptions in customer service. Our failure to provide proper customer service could result in claims from our customers, early termination of contracts, and damage our reputation.
18
Table of Contents
Our debt level could negatively impact our financial condition, results of operations, cash flows, and business prospects and could prevent us from fulfilling our obligations under our outstanding indebtedness. In the future, we may incur substantially more indebtedness, which could further increase the risks associated with our leverage.
As of March 31, 2014, our total debt (including capital lease obligations) was $2,990.2 million, primarily consisting of ZGL’s $750.0 million of 8.125% Senior Secured Notes due 2020 (the “Senior Secured Notes”) and $500.0 million of 10.125% Senior Unsecured Notes due 2020 (together with the Senior Secured Notes, the “Notes”), its $1,720.7 million senior secured term loan facility (the “Term Loan Facility”) and $19.5 million in capital lease obligations. In addition, ZGL has a $250.0 million senior secured revolving credit facility (the “Revolver,” and collectively with the Term Loan Facility, the “Credit Facilities”), of which $243.6 million was available at such date. Subject to the limitations set forth in the indentures (the “Indentures”) governing the Notes and the agreement governing the Credit Facilities (the “Credit Agreement”), ZGL may incur additional indebtedness (including additional first lien obligations) in the future.
Our level of debt could have important consequences, including the following:
| • | making it more difficult for us to satisfy our obligations under our debt agreements; |
| • | requiring us to dedicate a substantial portion of our cash flow from operations to required payments on debt, thereby reducing the availability of cash flow for working capital, capital expenditures, and other general business activities; |
| • | limiting our ability to obtain additional financing in the future for working capital, capital expenditures, acquisitions, and general corporate and other activities; |
| • | limiting our flexibility in planning for, or reacting to, changes in our business and the industry in which we operate; |
| • | increasing our vulnerability to both general and industry-specific adverse economic conditions; |
| • | placing us at a competitive disadvantage relative to less leveraged competitors; and |
| • | preventing us from raising the funds necessary to repurchase the Notes tendered to ZGL upon the occurrence of certain changes of control, which would constitute a default under the Indentures. |
Cash payments for interest, net of capitalized interest, which are reflected in our cash flows from operating activities, during the nine months ended March 31, 2014 were $160.2 million and represented 40% of our cash flows from operating activities before interest expense. We also made cash payments related to principal payments on our debt obligations of $19.8 million, which are reflected in our cash flows from financing activities, and represent 5% of our cash flows from operating activities.
We may not be able to generate enough cash flow to meet our debt obligations.
Our future cash flow may be insufficient to meet our debt obligations and commitments. Any insufficiency could negatively impact our business. A range of economic, competitive, business, regulatory, and industry factors will affect our future financial performance, and, as a result, our ability to generate cash flow from operations and to pay our debt. Many of these factors, such as economic and financial conditions in our industry and the global economy, or competitive initiatives of our competitors, are beyond our control.
If we do not generate enough cash flow from operations to satisfy our debt obligations, we may have to undertake alternative financing plans, such as:
| • | reducing or delaying capital investments; |
19
Table of Contents
| • | raising additional capital; |
| • | refinancing or restructuring our debt; and |
| • | selling assets. |
We cannot assure you that we would be able to implement alternative financing plans, if necessary, on commercially reasonable terms, or at all, or that implementing any such alternative financing plans would allow us to meet our debt obligations.
If ZGL is unable to meet its debt service obligations, it would be in default under the terms of the Indentures and the Credit Agreement, permitting acceleration of the amounts due on the Notes and under the Credit Agreement and eliminating our ability to draw on the Revolver. If the amounts outstanding under the Credit Facilities, the Notes, or other future indebtedness were to be accelerated, we could be forced to file for bankruptcy.
Our debt agreements contain restrictions on our ability to operate our business and to pursue our business strategies, and our failure to comply with these covenants could result in an acceleration of our indebtedness.
The Indentures and the Credit Facilities each contain, and agreements governing future debt issuances may contain, covenants that restrict ZGL’s ability to, among other things:
| • | incur additional indebtedness and issue preferred stock; |
| • | pay dividends or make other distributions with respect to any equity interests or make certain investments or other restricted payments; |
| • | create liens; |
| • | sell or otherwise dispose of assets, including capital stock of subsidiaries; |
| • | incur restrictions on the ability of its restricted subsidiaries to pay dividends or make other payments to it; |
| • | consolidate or merge with or into other companies or transfer all, or substantially all, of its assets; |
| • | engage in transactions with affiliates; |
| • | engage in business other than telecommunications; and |
| • | enter into sale and leaseback transactions. |
As a result of these covenants, we are limited in the manner in which we may conduct our business, and as a result we may be unable to engage in favorable business activities or finance future operations or capital needs. The ability to comply with some of the covenants and restrictions contained in the Credit Agreement and the Indentures may be affected by events beyond our control. If market or other economic conditions deteriorate, our ability to comply with these covenants may be impaired. A failure to comply with the covenants, ratios, or tests in the Credit Agreement, the Indentures, or any future indebtedness could result in an event of default under the Credit Facilities, the Indentures or our future indebtedness.
In addition, the Credit Facilities require ZGL to comply with specified financial ratios, including ratios regarding total leverage, secured leverage and fixed charge coverage. Our ability to comply with these ratios may be affected by events beyond our control. These restrictions limit our ability to plan for or react to market conditions, meet capital needs, or otherwise constrain our activities or business plans. They also may adversely affect our ability to finance our operations, enter into acquisitions, or engage in other business activities that would be in our interest.
20
Table of Contents
A breach of any of the covenants contained in the Credit Agreement, in any future credit agreement or the Indentures or our inability to comply with the financial ratios could result in an event of default, which would allow the lenders to declare all borrowings outstanding to be due and payable or to terminate the ability to borrow under the Revolver. If the amounts outstanding under the Credit Facilities, the Notes or other future indebtedness were to be accelerated, we cannot assure that our assets would be sufficient to repay in full the money owed, including the Notes. In such a situation, we could be forced to file for bankruptcy.
Our future tax liabilities are not predictable or controllable. If we become subject to increased levels of taxation, our financial condition and operations could be negatively impacted.
We provide telecommunication and other services in multiple jurisdictions across the United States and Europe and are, therefore, subject to multiple sets of complex and varying tax laws and rules. We cannot predict the amount of future tax liabilities to which we may become subject. Any increase in the amount of taxation incurred as a result of our operations or due to legislative or regulatory changes would be adverse to us. In addition, we may become subject to income tax audits by many tax jurisdictions throughout the world. It is possible that certain tax positions taken by us could result in tax liabilities for us. While we believe that our current provisions for taxes are reasonable and appropriate, we cannot assure you that these items will be settled for the amounts accrued or that we will not identify additional exposures in the future.
We cannot assure you whether, when or in what amounts we will be able to use our net operating losses, or when they will be depleted.
At March 31, 2014, we had approximately $1,376.3 million of federal net operating losses (“NOLs”), which relate primarily to prior acquisitions. Under certain circumstances, these NOLs can be used to offset our future federal and certain taxable income. If we experience an “ownership change,” as defined in Section 382 of the Internal Revenue Code and related Treasury regulations at a time when our market capitalization is below a certain level, our ability to use the NOLs could be substantially limited. This limit could impact the timing of the usage of the NOLs, thus accelerating cash tax payments or causing NOLs to expire prior to their use, which could affect the ultimate realization of the NOLs.
Furthermore, transactions that we enter into, as well as transactions by existing or future 5% stockholders that we do not participate in, could cause us to incur an “ownership change,” which could prevent us from fully utilizing our NOLs to reduce our federal income taxes. These limitations could cause us not to pursue otherwise favorable acquisitions and other transactions involving our capital stock, or could reduce the net benefits to be realized from any such transactions. Despite this, we expect to use substantially all of these NOLs and certain other deferred tax attributes as an offset to our federal future taxable income, although the timing of that use will depend upon our future earnings and future tax circumstances. If and when our NOLs are fully utilized, we expect that the amount of our cash flow dedicated to the payment of federal taxes will increase substantially.
We may be subject to interest rate risk and increasing interest rates may increase our interest expense.
Borrowings under each of the Credit Facilities bear, and our future indebtedness may bear, interest at variable rates and expose us to interest rate risk. If interest rates increase, our debt service obligations on the variable rate indebtedness would increase even though the amount borrowed remained the same, and our net income and cash available for servicing our indebtedness would decrease.
The international operations of our business expose us to risks that could materially and adversely affect the business.
We have operations and investments outside of the United States, as well as rights to undersea cable capacity extending to other countries, that expose us to risks inherent in international operations. These include:
| • | general economic, social and political conditions; |
21
Table of Contents
| • | the difficulty of enforcing agreements and collecting receivables through certain foreign legal systems; |
| • | tax rates in some foreign countries may exceed those in the U.S.; |
| • | foreign currency exchange rates may fluctuate, which could adversely affect our results of operations and the value of our international assets and investments; |
| • | foreign earnings may be subject to withholding requirements or the imposition of tariffs, exchange controls or other restrictions; |
| • | difficulties and costs of compliance with foreign laws and regulations that impose restrictions on our investments and operations, with penalties for noncompliance, including loss of licenses and monetary fines; |
| • | difficulties in obtaining licenses or interconnection arrangements on acceptable terms, if at all; and |
| • | changes in U.S. laws and regulations relating to foreign trade and investment. |
We may as part of our expansion strategy increase our exposure to international investments and operations.
Our international operations are subject to the laws and regulations of the U.S. and many foreign countries, including the U.S. Foreign Corrupt Practices Act and the U.K. Bribery Act.
We are subject to a variety of laws regarding our international operations, including the U.S. Foreign Corrupt Practices Act and the U.K Bribery Act of 2010, and regulations issued by U.S. Customs and Border Protection, the U.S. Bureau of Industry and Security, the U.S. Treasury Department’s Office of Foreign Assets Control (“OFAC”) and various foreign governmental agencies. We cannot predict the nature, scope or effect of future regulatory requirements to which our international operations might be subject or the manner in which existing laws might be administered or interpreted. Actual or alleged violations of these laws could lead to enforcement actions and financial penalties that could result in substantial costs.
The U.S. Foreign Corrupt Practices Act, the U.K. Bribery Act and similar anti-bribery laws in other jurisdictions generally prohibit companies and their intermediaries from making improper payments for the purpose of obtaining or retaining business. Recent years have seen a substantial increase in anti-bribery law enforcement activity with more frequent and aggressive investigations and enforcement proceedings by both the Department of Justice and the U.S. Securities and Exchange Commission, increased enforcement activity by non-U.S. regulators and increases in criminal and civil proceedings brought against companies and individuals. We are in the process of creating and implementing a program for compliance with anti-bribery laws. Because our anti-bribery internal control policies and procedures have been recently implemented, we may have increased exposure to reckless or criminal acts committed by our employees or third-party intermediaries. Violations of these anti-bribery laws may result in criminal or civil sanctions, which could have a material adverse effect on our business, financial condition, and results of operations.
Our international operations expose us to currency risk.
We conduct a portion of our business using the British Pound Sterling and the Euro. Appreciation of the U.S. Dollar adversely affects our consolidated revenue. Since we tend to incur costs in the same currency in which those operations realize revenue, the effect on operating income and operating cash flow is largely mitigated. However, if the U.S. Dollar appreciates significantly, future revenues, operating income and operating cash flows could be materially affected.
22
Table of Contents
We may be vulnerable to security breaches that could disrupt our operations and adversely affect our business and operations.
Despite security measures and business continuity plans, our information technology networks and infrastructure may be vulnerable to damage, disruptions, or shutdowns due to unauthorized access, computer viruses, cyber-attacks, distributed denial of service, and other security breaches. An attack on or security breach of our network could result in interruption or cessation of services, our inability to meet our service level commitments, and potentially compromise customer data transmitted over our network. We cannot guarantee that our security measures will not be circumvented, resulting in network failures or interruptions that could impact our network availability and have a material adverse effect on our business, financial condition, and operational results. We may be required to expend significant resources to protect against such threats. If an actual or perceived breach of our security occurs, the market perception of the effectiveness of our security measures could be harmed, and we could lose customers. Any such events could result in legal claims or penalties, disruption in operations, misappropriation of sensitive data, damage to our reputation, and/or costly response measures, which could adversely affect the our business.
Risks Related to Our Industry
We could face increased competition from companies in the telecommunications and media industries that currently do not focus on bandwidth infrastructure.
Many of our competitors in the bandwidth infrastructure space are other focused bandwidth infrastructure providers that operate on a regional or local basis. In some cases we also compete with communications service providers who also own certain infrastructure assets and make them available to customers as an infrastructure service. These communication service providers include ILECs, such as AT&T and Verizon, and cable television companies, such as Comcast.
Some of these competitors have greater financial, managerial, sales and marketing, and research and development resources than we do and are able to promote their brands with significantly larger budgets. Most of them are also our customers. If ILECs and cable television companies focus on providing bandwidth infrastructure, it could have a material adverse effect on us. A few of these competitors also have significant fiber assets that they principally employ in the provision of their communications services. If any of these competitors with greater resources and/or significant fiber assets chose to focus those resources on bandwidth infrastructure, our ability to compete in the bandwidth infrastructure industry could be negatively impacted. To the extent that communication service providers, cable television companies, and other media companies choose to distribute their content over their own networks, that could reduce demand for our services. Additionally, significant new entrants into the bandwidth services industry would increase supply, which could cause prices for our services to decline.
Consolidation among companies in the telecommunications and cable television industries could further strengthen our competitors and adversely impact our business.
The telecommunications and cable television industries are intensely competitive and continue to undergo significant consolidation. There are many reasons for consolidation in these industries, including the desire for communications and cable television companies to acquire network assets in regions where they currently have no or insufficient amounts of owned network infrastructure. The consolidation within the industry may cause customers to disconnect services to move them to their own networks, or consolidate buying with other bandwidth infrastructure providers. Additionally, consolidation in the industry could further strengthen our competitors, give them greater financial resources and geographic reach, and allow them to put additional pressure on prices for bandwidth infrastructure services.
23
Table of Contents
Certain of our services are subject to regulation that could change or otherwise impact us in an adverse manner.
Communications services are subject to domestic and international regulation at the federal, state, and local levels. These regulations affect our business and our existing and potential competitors. In addition, in the United States, both the Federal Communications Commission (“FCC”) and the state public utility commissions or similar regulatory authorities (the “State PUCs”) typically require us to file periodic reports, pay various regulatory fees and assessments, and to comply with their regulations. Such compliance can be costly and burdensome and may affect the way we conduct our business. Delays in receiving required regulatory approvals (including approvals relating to acquisitions or financing activities or for interconnection agreements with other carriers), the enactment of new and adverse international or domestic legislation or regulations (including those pertaining to broadband initiatives and net-neutrality), or the denial, modification or termination by a regulator of any approval or authorization, could have a material adverse effect on our business. Further, the current regulatory landscape is subject to change through judicial review of current legislation and rulemaking by the FCC and other domestic and international rulemaking bodies. These bodies regularly consider changes to their regulatory framework and fee obligations. Changes in current regulation may make it more difficult to obtain the approvals necessary to operate our business, significantly increase the regulatory fees to which we are subject, or have other adverse effects on our future operations in the United States and Europe.
Unfavorable general global economic conditions could negatively impact our operating results and financial condition.
Unfavorable general global economic conditions could negatively affect our business. Although it is difficult to predict the impact of general economic conditions on our business, these conditions could adversely affect the affordability of, and customer demand for, our services, and could cause customers to delay or forgo purchases of our services. One or more of these circumstances could cause our revenue to decline. Also, our customers may not be able to obtain adequate access to credit, which could affect their ability to purchase our services or make timely payments to us. The current economic conditions, including federal fiscal and monetary policy actions, may lead to inflationary conditions in our cost base, particularly in our lease and personnel related expenses. This could harm our margins and profitability if we are unable to increase prices or reduce costs sufficiently to offset the effects of inflation in our cost base. For these reasons, among others, if challenging economic conditions persist or worsen, our operating results and financial condition could be adversely affected.
Disruptions in the financial markets could affect our ability to obtain debt or equity financing or to refinance our existing indebtedness on reasonable terms or at all.
Disruptions in the financial markets could impact our ability to obtain debt or equity financing, or lines of credit, in the future as well as impact our ability to refinance our existing indebtedness on reasonable terms or at all, which could affect our strategic operations and our financial performance and force modifications to our operations.
Changes in our traffic patterns or industry practice could result in increasing peering costs for our IP network.
Peering agreements with other ISPs have allowed us to access the Internet and exchange traffic with these providers. In most cases, we peer with these ISPs on a payment-free basis, referred to as settlement-free peering. We plan to continue to leverage this settlement-free peering. If other providers change the terms upon which they allow settlement-free peering or if changes in Internet traffic patterns, including the ratio of inbound to outbound traffic, cause us to fall below the criteria that these providers use in allowing settlement-free peering, the costs of operating our Internet backbone will likely increase. Any increases in costs could have an adverse effect on our margins and our ability to compete in the IP market.
24
Table of Contents
Terrorism and natural disasters could adversely impact our business.
The ongoing threat of terrorist activity and other acts of war or hostility have had, and may continue to have, an adverse effect on business, financial and general economic conditions. Effects from these events and any future terrorist activity, including cyber terrorism, may, in turn, increase our costs due to the need to provide enhanced security, which would adversely affect our business and results of operations. Terrorist activity could damage or destroy our Internet infrastructure and may adversely affect our ability to attract and retain customers, raise capital, and operate and maintain our network access points. We are particularly vulnerable to acts of terrorism because of our large datacenter presence in New York. We are also susceptible to other catastrophic events such as major natural disasters, extreme weather, fires, or similar events that could affect our headquarters, other offices, our network, infrastructure, or equipment, all of which could adversely affect our business.
Risks Related to this Offering and Ownership of Our Common Stock
There is no existing market for our common stock, and we do not know if one will develop. Even if a market does develop, the stock prices in the market may not exceed the offering price.
Prior to this offering, there has not been a public market for our common stock or any of our equity interests. We cannot predict the extent to which investor interest in our company will lead to the development of an active trading market on the , or how liquid that market may become. An active public market for our common stock may not develop or be sustained after the offering. If an active trading market does not develop or is not sustained, you may have difficulty selling any shares that you buy.
The initial public offering price for the common stock will be determined by negotiations among us and the representatives of the underwriters and may not be indicative of prices that will prevail in the open market following this offering. Consequently, you may not be able to sell shares of our common stock at prices equal to or greater than the price you pay in this offering.
Our stock price may be volatile or may decline regardless of our operating performance and you may not be able to resell your shares at or above the initial public offering price, if at all.
The market price of our common stock may fluctuate significantly in response to numerous factors, many of which are beyond our control. In addition to the other risk factors described herein, these factors include:
| • | actual or anticipated fluctuations in our revenue and other operating results; |
| • | announcements by us or our competitors of significant technical innovations, acquisitions, strategic partnerships, joint ventures or capital commitments; |
| • | changes in operating performance and stock market valuations of other companies in our industry; |
| • | the addition or loss of significant customers; |
| • | fluctuations in the trading volume of our common stock or the size of our public float; |
| • | announcements by us with regard to the effectiveness of our internal controls and our ability to accurately report our financial results; |
| • | price and volume fluctuations in the overall stock market, including as a result of trends in the economy as a whole; |
| • | general economic, legal, regulatory and market conditions unrelated to our performance; |
| • | lawsuits threatened or filed against us; and |
25
Table of Contents
| • | other events or factors, including those resulting from war, incidents of terrorism or responses to these events. |
If the market price of our common stock after this offering does not exceed the initial public offering price, you may not realize any return on your investment in our common stock and may lose some or all of your investment. In addition, the stock markets have experienced extreme fluctuations in price and trading volume that have caused and will likely continue to cause the stock prices of many telecommunications companies to fluctuate in a manner unrelated or disproportionate to the operating performance of those companies. In the past, stockholders have instituted securities class action litigation following periods of declining stock prices. If we were to become involved in securities litigation, we could face substantial costs and be forced to divert resources and the attention of management from our business, which could adversely affect our business.
If securities or industry analysts do not publish, continue to publish, or publish inaccurate or unfavorable research about our business, our stock price and trading volume could decline.
The trading market for our common stock depends on the research and reports that securities or industry analysts publish about us or our business. Certain securities and industry analysts currently publish research reports with respect to certain of our debt securities; however, they are currently not publishing reports on our equity securities. If they fail to pick up coverage of our equity securities, fail to publish reports about us or our securities regularly, or otherwise cease to cover our Company, demand for our stock could decrease and the trading price of our stock could decline. A downgrade of our stock or the publication of inaccurate or unfavorable research about our business would likely cause our stock price to decline.
Sales of substantial amounts of our common stock in the public market, or the perception that they might occur, could reduce the price that our common stock might otherwise attain.
The price of our common stock could decline if there are substantial sales of our common stock, particularly sales by our directors, executive officers and significant stockholders, or if there is a large number of shares of our common stock available for sale. After this offering, we will have a small public float relative to the total number of shares of our common stock issued and outstanding, and a substantial majority of our issued and outstanding shares will be restricted as a result of securities laws, lock-up agreements or other contractual provisions that restrict transfers.
After this offering, there will be outstanding shares of our common stock. This includes the shares that we or the selling stockholders are selling in this offering, which may be resold in the public market immediately. Certain of the remaining outstanding shares after this offering are subject to lock-up agreements, as more fully described in “Underwriting.” These lock-up restrictions will expire 180 days after the date of this prospectus, subject to extension in some circumstances. Shares held by directors, executive officers and other affiliates will be subject to volume limitations under Rule 144 under the Securities Act of 1933 (the “Securities Act”) and various vesting agreements in some cases.
After this offering, the holders of an aggregate of shares of our common stock outstanding will have rights, subject to some conditions, to require us to file registration statements covering their shares or to include their shares in registration statements that we may file for ourselves or our stockholders. For a more detailed description of these registration rights, see “Description of Capital Stock—Registration Rights.” All of these shares are subject to market standoff or lock-up agreements restricting their sale for 180 days after the date of this prospectus, subject to extension in some circumstances. We also intend to file registration statements covering the shares of common stock that we have issued and may issue under our employee equity incentive plans. Once these registration statements are filed, these shares will be able to be sold freely in the public market upon issuance, subject to existing market standoff or lock-up agreements. Morgan Stanley & Co. LLC and Barclays Capital Inc. acting together may, in their sole discretion, permit our officers, directors, employees and current stockholders who are subject to the contractual lock up to sell shares prior to the expiration of the lock-up agreements. See “Underwriting” for more information.
26
Table of Contents
Following this offering, there will be shares available for issuance under our stock incentive plan, and we could also make equity compensation grants outside of our stock incentive plan. The shares issuable under our stock incentive plan will be registered pursuant to a registration statement on Form S-8.
We may issue shares of our common stock or securities convertible into our common stock from time to time in connection with financings, acquisitions, investments, or otherwise. Any such issuance could result in ownership dilution to you as a stockholder, and cause the trading price of our common stock to decline.
Delaware law and our amended and restated certificate of incorporation and bylaws contain provisions that could delay or discourage takeover attempts that our stockholders may consider favorable.
Provisions in our amended and restated certificate of incorporation and amended and restated bylaws may have the effect of delaying or preventing a change of control or changes in our management. These provisions include the following:
| • | our board of directors is divided into three classes serving staggered three-year terms; |
| • | our board of directors has the right to elect a director to fill a vacancy created by the expansion of the board of directors or due to the resignation or departure of an existing board member; |
| • | our directors are not elected by cumulative voting, which would allow less than a majority of stockholders to elect director candidates; |
| • | advance notice of nominations for election to the board of directors or for proposing matters that can be acted upon at a stockholders meeting is required; |
| • | our board of directors may alter our bylaws without obtaining stockholder approval; |
| • | our board of directors may issue, without stockholder approval, up to shares of preferred stock with terms set by the board of directors, certain rights of which could be senior to those of our common stock; |
| • | stockholders do not have the right to call a special meeting of stockholders and to take action by written consent in lieu of a meeting; |
| • | approval of at least two thirds of the shares entitled to vote at an election of directors is required to amend or repeal, or adopt any provision inconsistent with, our amended and restated bylaws or the provisions of our amended and restated certificate of incorporation regarding, among other items, the election and removal of directors; and |
| • | directors may be removed from office for only for cause. |
In addition, because we are incorporated in Delaware, we are governed by the provisions of Section 203 of the Delaware General Corporation Law (the “DGCL”). In general, Section 203 prohibits a publicly-held Delaware corporation from engaging in a “business combination” with an “interested stockholder” for three years following the time that such stockholder becomes an interested stockholder, unless the business combination is approved in a prescribed manner. A “business combination” includes, among other things, a merger, asset or stock sale or other transaction resulting in a financial benefit to the interested stockholder. An “interested stockholder” is a person who, together with affiliates and associates, owns, or did own, within three years prior to the determination of interested stockholder status, 15% or more of a corporation’s voting stock.
These provisions may prohibit large stockholders, particularly those owning 15% or more of our outstanding voting stock, from merging or combining with us. These provisions in our amended and restated certificate of incorporation and our amended and restated bylaws and the DGCL could discourage potential takeover attempts,
27
Table of Contents
could reduce the price that investors are willing to pay for shares of our common stock in the future and could potentially result in the market price of our common stock being lower than it otherwise would be.
In addition, our debt agreements may require very significant payments if we have a change of control, which reduces the possibility that such an event will occur.
Our directors, executive officers, and principal stockholders will collectively own approximately % of our outstanding common stock after this offering and will continue to have substantial control over the company.
Upon completion of this offering, assuming an initial public offering price at the midpoint of the estimated price range set forth on the cover of this prospectus, our directors, executive officers, and holders of more than 5% of our common stock, together with their affiliates, will beneficially own, in the aggregate, approximately % of our outstanding common stock. As a result, these stockholders, acting together, would have the ability to control the outcome of matters submitted to our stockholders for approval, including the election of directors and any merger, consolidation or sale of all or substantially all of our assets. In addition, these stockholders, acting together, would have the ability to control our management and affairs. Accordingly, this concentration of ownership might harm the market price of our common stock by:
| • | delaying, deferring or preventing a change in control; |
| • | impeding a merger, consolidation, takeover or other business combination involving us; or |
| • | discouraging a potential acquirer from making a tender offer or otherwise attempting to obtain control. |
We do not intend to pay dividends for the foreseeable future.
We have never declared or paid cash dividends on our common stock. ZGL’s ability to pay dividends to us is limited by its Credit Agreement and its Indentures, which may in turn limit our ability to pay dividends on our common stock. Our ability to pay dividends may also be restricted by the terms of any future credit agreement or any future debt or preferred securities of ours or of our subsidiaries. We currently intend to retain any future earnings to finance the operation and expansion of our business, and we do not expect to declare or pay any dividends in the foreseeable future. As a result, you may only receive a return on your investment in our common stock if the market price of our common stock increases.
If you purchase shares of our common stock in this offering, you will experience substantial and immediate dilution.
The initial public offering price of our common stock will be substantially higher than the pro forma net tangible book value per share of our outstanding common stock following this offering. Therefore, if you purchase shares of our common stock in this offering, you will experience immediate dilution of $ per share, the difference between the price per share you pay for our common stock and the pro forma net tangible book value per share as of March 31, 2014, after giving effect to the issuance of shares of our common stock in this offering. See “Dilution.” This dilution is due in large part to the fact that our earlier investors paid substantially less than the initial public offering price when they purchased their shares of our capital stock.
We will incur increased costs as a result of being a publicly-traded company.
After the completion of this offering, we will be subject to the reporting requirements of the Securities Exchange Act of 1934 (the “Exchange Act”), the Sarbanes-Oxley Act of 2002 (the “Sarbanes-Oxley Act”), the Dodd-Frank Wall Street Reform and Consumer Protection Act of 2010 and the rules and regulations of the stock market on which our common stock is traded. Being subject to these rules and regulations will result in legal, accounting and financial compliance costs, will make some activities more difficult, time-consuming and costly and may also place significant strain on our personnel, systems and resources.
28
Table of Contents
If we do not timely satisfy the requirements of Section 404 of the Sarbanes-Oxley Act of 2002, the trading price of our common stock could be adversely affected.
The Sarbanes-Oxley Act requires, among other things, that we test the effectiveness of our internal control over financial reporting in accordance with an established internal control framework and report on our conclusion as to the effectiveness of our internal control over financial reporting. Any delays or difficulty in satisfying the requirements of the Sarbanes-Oxley Act could, among other things, cause investors to lose confidence in, or otherwise be unable to rely on, the accuracy of our reported financial information, which could adversely affect the trading price of our common stock.
As a public company, we will be required to maintain internal control over financial reporting and to report any material weaknesses in such internal control. We are in the process of designing, implementing, and testing our internal control over financial reporting required to comply with this obligation, which is a time-consuming, costly, and complicated process.
29
Table of Contents
Information contained in this prospectus that is not historical by nature constitutes “forward-looking statements,” which can be identified by the use of forward-looking terminology such as “believes,” “expects,” “plans,” “intends,” “estimates,” “projects,” “could,” “may,” “will,” “should,” or “anticipates” or the negatives thereof, other variations thereon, or comparable terminology, or by discussions of strategy. No assurance can be given that future results expressed or implied by the forward-looking statements will be achieved, and actual results may differ materially from those contemplated by the forward-looking statements. Such statements are based on management’s current expectations and beliefs and are subject to a number of risks and uncertainties that could cause actual results to differ materially from those expressed or implied by the forward-looking statements. These risks and uncertainties include, but are not limited to:
| • | We have consistently generated net losses since our inception and expect such losses to continue for at least several years. |
| • | Since our inception, we have used more cash than we have generated from operations, and we may continue to do so. |
| • | We are highly dependent on our management team and other key employees, many of whom own equity that has been illiquid but will become liquid as a result of this offering. |
| • | Our revenue is relatively concentrated among a small number of customers, and the loss of any of these customers could significantly harm our business, financial condition, results of operations, and cash flows. |
| • | Future acquisitions are a component of our strategic plan, and will include integration and other risks that could harm our business. |
| • | We are growing rapidly and may not maintain or efficiently manage our growth. |
| • | Any failure of our physical infrastructure or services could lead to significant costs and disruptions. |
| • | We use franchises, licenses, permits, rights-of-way, conduit leases, fiber agreements, and property leases, which could be canceled or not renewed. |
| • | We are required to maintain, repair, upgrade, and replace our network and our facilities, the cost of which could materially impact our results and our failure to do so could irreparably harm our business. |
| • | Our debt level could negatively impact our financial condition, results of operations, cash flows, and business prospects and could prevent us from fulfilling our obligations under our outstanding indebtedness. In the future, we may incur substantially more indebtedness, which could further increase the risks associated with our leverage. |
| • | Our debt agreements contain restrictions on our ability to operate our business and to pursue our business strategies, and our failure to comply with these covenants could result in an acceleration of our indebtedness. |
| • | Our future tax liabilities are not predictable or controllable. If we become subject to increased levels of taxation, our financial condition and operations could be negatively impacted. |
| • | The international operations of our business expose us to risks that could materially and adversely affect the business. |
| • | We may be vulnerable to security breaches that could disrupt our operations and adversely affect our business and operations. |
| • | The other risks described above in “Risk Factors.” |
30
Table of Contents
We estimate that the net proceeds to us from this offering, after deducting the underwriting discount and estimated offering expenses payable by us, will be approximately $ million, assuming the shares are offered at $ per share (the midpoint of the estimated price range set forth on the cover of this prospectus). We will not receive any proceeds from the sale of shares by the selling stockholders.
Each $1.00 increase or decrease in the assumed initial public offering price of $ per share (the midpoint of the estimated price range set forth on the cover of this prospectus) would increase or decrease, as applicable, the net proceeds we receive from this offering by approximately $ million, assuming the number of shares offered by us, as set forth on the cover of this prospectus, remains the same and after deducting the underwriting discount and estimated offering expenses.
We intend to use the net proceeds from the sale of common stock by us in this offering for general corporate purposes, which may include some or all of the following: repayment of certain existing indebtedness, acquisitions, working capital, and capital expenditures, and to pay other fees and expenses incurred in connection with this offering of approximately $ . Although we are always evaluating attractive bandwidth infrastructure acquisitions, we have not at this time identified any acquisition candidate for which we intend to use a portion of the proceeds of this offering.
Pending use of the net proceeds from this offering described above, we intend to invest the net proceeds in short-term, investment-grade instruments, such as U.S. Treasury bonds or money market securities.
31
Table of Contents
We currently intend to retain all available funds and any future earnings for use in the operation of our business, and therefore we do not anticipate paying any cash dividends in the foreseeable future. Any future determination to pay dividends will be at the discretion of our board of directors and will depend upon our financial condition, results of operations, cash flows, capital requirements, and other factors that our board of directors deems relevant. We are a holding company, and substantially all of our operations are carried out by our subsidiary, ZGL, and its subsidiaries. ZGL’s ability to pay dividends to us is limited by the Credit Agreement and Indentures, which may in turn limit our ability to pay dividends on our common stock. Our ability to pay dividends may also be restricted by the terms of any future credit agreement or any future debt or preferred securities.
32
Table of Contents
The following table sets forth our cash and cash equivalents and capitalization as of March 31, 2014:
| • | on an actual basis from continuing operations; and |
| • | on a pro forma, as adjusted basis to give effect to the following transactions as if they occurred on March 31, 2014: |
| ¡ | the Restructuring; |
| ¡ | the sale of shares of our common stock in this offering by us at an assumed initial public offering price of $ per share (the midpoint of the estimated price range set forth on the cover of this prospectus) after deducting the underwriting discount and estimated offering expenses payable by us and the intended application of the net proceeds therefrom as described in “Use of Proceeds”; |
| ¡ | the effectiveness of our amended and restated certificate of incorporation included as an exhibit to the registration statement of which this prospectus forms a part, which we will adopt prior to the completion of this offering; |
| ¡ | no exercise by the underwriters of their option to purchase up to additional shares from the selling stockholders; and |
| ¡ | the use of $ million of the estimated net proceeds of this offering to pay other fees and expenses incurred in connection with this offering. |
You should read the following table in conjunction with the sections entitled “Use of Proceeds,” “Selected Historical Consolidated Financial Information” and “Management’s Discussion and Analysis of Financial Condition and Results of Operations” and our consolidated financial statements and related notes included elsewhere in this prospectus.
| As of March 31, 2014 | ||||||||
| Actual (unaudited) |
Pro Forma as Adjusted (unaudited) |
|||||||
| (in thousands, except share and per share data) |
||||||||
| Cash and cash equivalents |
$ | 254,607 | $ | |||||
|
|
|
|
|
|||||
| Long-term debt and capital lease obligations: |
||||||||
| Revolving credit facility |
$ | — | $ | |||||
| Term loan facility |
1,720,711 | |||||||
| Senior secured notes |
750,000 | |||||||
| Senior unsecured notes |
500,000 | |||||||
| Capital lease obligations |
19,531 | |||||||
|
|
|
|
|
|||||
| Total debt |
2,990,242 | |||||||
|
|
|
|
|
|||||
33
Table of Contents
| As of March 31, 2014 | ||||||||
| Actual (unaudited) |
Pro Forma as Adjusted (unaudited) |
|||||||
| (in thousands, except share and per share data) |
||||||||
| Stockholders’ Equity: |
||||||||
| Common stock, $0.001 par value per share, 1,000 shares authorized, 1,000 shares issued and outstanding, actual; $0.001 par value per share, shares authorized, shares issued and outstanding, pro forma as adjusted |
||||||||
| Preferred stock, $0.001 par value per share, no shares authorized, issued or outstanding, actual; $0.001 par value per share, shares authorized, no shares issued or outstanding, pro forma as adjusted |
||||||||
| Additional paid-in capital |
778,431 | |||||||
|
|
|
|
|
|||||
| Total stockholders’ equity |
517,319 | |||||||
|
|
|
|
|
|||||
| Total capitalization |
$ | 3,762,168 | $ | |||||
|
|
|
|
|
|||||
34
Table of Contents
If you invest in our common stock, your interest will be immediately diluted to the extent of the difference between the initial public offering price per share of our common stock and the pro forma as adjusted net tangible book value per share of our common stock immediately after this offering.
Historical net tangible book value (deficit) per share is our historical net tangible book value, divided by the number of outstanding shares. The historical net tangible book deficit of our common stock as of March 31, 2014 was $881.1 million, or $881,140 per share. Historical net tangible book value (deficit) is the amount of our total tangible assets less our total liabilities.
The pro forma net tangible book deficit of our common stock as of March 31, 2014 was $881.1 million, or $ per share. Pro forma net tangible book value (deficit) and pro forma net tangible book value (deficit) per share give effect to the Restructuring.
Pro forma as adjusted net tangible book value (deficit) gives effect to (i) the Restructuring, (ii) the sale of shares of common stock in this offering at the initial public offering price of $ per share, the midpoint of the estimated price range set forth on the cover of this prospectus, and after deducting the underwriting discount and estimated offering expenses payable by us, and (iii) the application of the net proceeds received by us as described under “Use of Proceeds.” As of March 31, 2014, our pro forma as adjusted net tangible book deficit would have been $ million, or $ per share. This represents an immediate decrease in pro forma net tangible book deficit of $ per share to our existing stockholders and an immediate dilution of $ per share to investors purchasing common stock in this offering.
The following table illustrates this dilution on a per share basis to new investors:
| Initial public offering price per share |
$ | |||||
| Pro forma net tangible book deficit per share as of March 31, 2014, before giving effect to this offering |
$ | |||||
| Decrease in pro forma net tangible book deficit per share attributable to new investors in this offering |
||||||
| Pro forma as adjusted net tangible book deficit per share after giving effect to this offering |
||||||
| Dilution per share to new investors purchasing shares in this offering |
If the underwriters exercise their option to purchase additional shares of our common stock in full, the pro forma as adjusted net tangible book deficit per share will be $ per share, the decrease in pro forma net tangible book deficit per share to existing stockholders will be $ per share and the dilution per share to new investors purchasing shares in this offering will be $ per share.
The table below summarizes as of March 31, 2014, on a pro forma as adjusted basis described above, the number of shares of our common stock, the total consideration, and the average price per share (i) paid to us by our existing stockholders and (ii) to be paid by new investors purchasing our common stock in this offering (assuming no exercise of the underwriters’ option to purchase additional shares), before deducting the underwriting discount and estimated offering expenses payable by us.
| Shares Purchased | Total Cash Consideration | Average Price Per Share |
||||||||||||||||
| Number | Percent | Amount | Percent | |||||||||||||||
| Existing stockholders |
% | $ | % | $ | ||||||||||||||
| New investors |
% | % | ||||||||||||||||
|
|
|
|
|
|
|
|
|
|
||||||||||
| Total |
% | $ | % | $ | ||||||||||||||
|
|
|
|
|
|
|
|
|
|
||||||||||
If the underwriters’ option to purchase additional shares in this offering is exercised in full, the percentage of shares of our common stock held by existing stockholders will be reduced to % of the total number of shares of our common stock outstanding after this offering, and the number of shares held by new investors will increase to shares, or % of the total number of shares of our common stock outstanding after this offering.
35
Table of Contents
SELECTED HISTORICAL CONSOLIDATED FINANCIAL INFORMATION
The following tables present selected historical consolidated financial information of the Company for the periods and as of the dates indicated. The selected historical consolidated financial information as of June 30, 2012 and 2013 and for the years ended June 30, 2011, 2012 and 2013 is derived from, and qualified by reference to, our audited consolidated financial statements included elsewhere in this prospectus. The selected historical consolidated financial information as of June 30, 2011 is derived from our audited consolidated financial statements not included in this prospectus. The selected historical consolidated financial information as of June 30, 2009 and 2010 and for the years ended June 30, 2009 and 2010 is derived from our unaudited consolidated financial statements not included in this prospectus. The selected historical consolidated financial information as of March 31, 2014 and for the nine months ended March 31, 2013 and 2014 is derived from, and qualified by reference to, our unaudited consolidated financial statements included elsewhere in this prospectus. The selected historical consolidated financial information as of March 31, 2013 is derived from our unaudited consolidated financial statements not included in this prospectus. Our unaudited consolidated financial statements have been prepared on the same basis as our audited consolidated financial statements and, in our opinion, reflect all adjustments, consisting only of normal and recurring adjustments, necessary for a fair presentation of such financial statements in all material respects.
The financial data set forth in the following tables should be read in conjunction with our historical consolidated financial statements and related notes and “Management’s Discussion and Analysis of Financial Condition and Results of Operations,” each included elsewhere in this prospectus. The results for any interim period are not necessarily indicative of the results that may be expected for a full year or any future period.
| Year Ended June 30, | Nine Months Ended March 31 |
|||||||||||||||||||||||||||
| 2009 | 2010 | 2011 | 2012 | 2013 | 2013 | 2014 | ||||||||||||||||||||||
| (unaudited) | (unaudited) | (unaudited) | (unaudited) | |||||||||||||||||||||||||
| Consolidated Statements of Operations Data (in thousands, except for share data): |
||||||||||||||||||||||||||||
| Revenue |
$ | 125,339 | $ | 197,889 | $ | 282,143 | $ | 375,526 | $ | 1,004,354 | $ | 742,647 | $ | 826,537 | ||||||||||||||
|
|
|
|
|
|
|
|
|
|
|
|
|
|
|
|||||||||||||||
| Operating costs and expenses |
||||||||||||||||||||||||||||
| Operating costs, excluding depreciation and amortization |
37,792 | 62,513 | 70,978 | 82,083 | 145,877 | 110,032 | 110,634 | |||||||||||||||||||||
| Selling, general and administrative expenses, excluding stock-based compensation expenses |
51,493 | 65,347 | 88,414 | 112,410 | 318,523 | 233,393 | 234,395 | |||||||||||||||||||||
| Stock-based compensation |
6,412 | 18,168 | 24,310 | 26,253 | 105,849 | 67,913 | 165,134 | |||||||||||||||||||||
|
|
|
|
|
|
|
|
|
|
|
|
|
|
|
|||||||||||||||
| Selling, general and administrative expenses |
57,905 | 83,515 | 112,724 | 138,663 | 424,372 | 301,306 | 399,529 | |||||||||||||||||||||
| Depreciation and amortization |
26,554 | 38,738 | 60,463 | 84,961 | 324,532 | 243,880 | 246,922 | |||||||||||||||||||||
|
|
|
|
|
|
|
|
|
|
|
|
|
|
|
|||||||||||||||
| Total operating costs and expenses |
122,251 | 184,766 | 244,165 | 305,707 | 894,781 | 655,218 | 757,085 | |||||||||||||||||||||
|
|
|
|
|
|
|
|
|
|
|
|
|
|
|
|||||||||||||||
| Operating income |
3,088 | 13,123 | 37,978 | 69,819 | 109,573 | 87,429 | 69,452 | |||||||||||||||||||||
|
|
|
|
|
|
|
|
|
|
|
|
|
|
|
|||||||||||||||
| Interest expense |
(15,245 | ) | (18,692 | ) | (33,414 | ) | (50,720 | ) | (202,464 | ) | (164,807 | ) | (150,905 | ) | ||||||||||||||
| Impairment of cost method investment |
— | — | — | (2,248 | ) | — | — | — | ||||||||||||||||||||
| Other income/(expense), net |
234 | 1,526 | (126 | ) | 123 | 326 | 302 | 1,266 | ||||||||||||||||||||
| Loss on extinguishment of debt |
— | (5,881 | ) | — | — | (77,253 | ) | (77,253 | ) | (1,911 | ) | |||||||||||||||||
|
|
|
|
|
|
|
|
|
|
|
|
|
|
|
|||||||||||||||
| Total other expenses, net |
(15,011 | ) | (23,047 | ) | (33,540 | ) | (52,845 | ) | (279,391 | ) | (241,758 | ) | (151,550 | ) | ||||||||||||||
|
|
|
|
|
|
|
|
|
|
|
|
|
|
|
|||||||||||||||
| Earnings/(loss) from continuing operations before income taxes |
(11,923 | ) | (9,924 | ) | 4,438 | 16,974 | (169,818 | ) | (154,329 | ) | (82,098 | ) | ||||||||||||||||
| Provision/(benefit) for income taxes |
(2,321 | ) | 4,549 | 11,329 | 26,871 | (24,205 | ) | (33,549 | ) | 27,202 | ||||||||||||||||||
|
|
|
|
|
|
|
|
|
|
|
|
|
|
|
|||||||||||||||
| Loss from continuing operations |
(9,602 | ) | (14,473 | ) | (6,891 | ) | (9,897 | ) | (145,613 | ) | (120,780 | ) | (109,300 | ) | ||||||||||||||
| Earnings from discontinued operations, net of income taxes |
7,355 | 6,761 | 5,331 | 8,673 | 8,396 | 7,488 | 3,655 | |||||||||||||||||||||
|
|
|
|
|
|
|
|
|
|
|
|
|
|
|
|||||||||||||||
| Net loss |
$ | (2,247 | ) | $ | (7,712 | ) | $ | (1,560 | ) | $ | (1,224 | ) | $ | (137,217 | ) | $ | (113,292 | ) | $ | (105,645 | ) | |||||||
|
|
|
|
|
|
|
|
|
|
|
|
|
|
|
|||||||||||||||
| Weighted-average shares used to compute net loss per share: |
||||||||||||||||||||||||||||
| Basic and diluted |
1,000 | 1,000 | 1,000 | 1,000 | 1,000 | 1,000 | 1,000 | |||||||||||||||||||||
| Loss from continuing operations per share: |
||||||||||||||||||||||||||||
| Basic and diluted |
$ | (9,602 | ) | $ | (14,473 | ) | $ | (6,891 | ) | $ | (9,897 | ) | $ | (145,613 | ) | $ | (120,780 | ) | $ | (109,300 | ) | |||||||
| Income from discontinued operations per share: |
||||||||||||||||||||||||||||
| Basic and diluted |
7,355 | 6,761 | 5,331 | 8,673 | 8,396 | 7,488 | 3,655 | |||||||||||||||||||||
| Pro forma net loss per share (unaudited)(1): |
||||||||||||||||||||||||||||
| Basic and diluted |
||||||||||||||||||||||||||||
36
Table of Contents
| Year Ended June 30, | Nine Months Ended March 31 |
|||||||||||||||||||||||||||
| 2009 | 2010 | 2011 | 2012 | 2013 | 2013 | 2014 | ||||||||||||||||||||||
| (unaudited) | (unaudited) | (unaudited) | (unaudited) | |||||||||||||||||||||||||
| Consolidated Balance Sheet Data (at period end) (in thousands): |
||||||||||||||||||||||||||||
| Cash and cash equivalents |
$ | 38,019 | $ | 87,864 | $ | 25,394 | $ | 150,693 | $ | 91,313 | $ | 70,177 | $ | 254,607 | ||||||||||||||
| Property and equipment, net |
211,864 | 297,889 | 518,513 | 754,738 | 2,437,707 | 2,363,339 | 2,533,256 | |||||||||||||||||||||
| Total assets |
415,333 | 605,474 | 849,396 | 1,442,055 | 4,251,240 | 4,166,825 | 4,561,816 | |||||||||||||||||||||
| Long-term debt and capital lease obligations, including current portion |
151,487 | 259,786 | 365,588 | 701,339 | 2,843,872 | 2,850,919 | 2,990,241 | |||||||||||||||||||||
| Total stockholder’s equity |
213,076 | 243,323 | 258,083 | 410,314 | 606,253 | 632,766 | 517,319 | |||||||||||||||||||||
| Selected cash flow data (in thousands): |
||||||||||||||||||||||||||||
| Net cash flows provided by operating activities from continuing operations |
$ | 24,667 | $ | 58,200 | $ | 99,502 | $ | 167,630 | $ | 404,883 | $ | 268,265 | $ | 401,321 | ||||||||||||||
|
|
|
|
|
|
|
|
|
|
|
|
|
|
|
|||||||||||||||
| Purchases of property and equipment, net of stimulus grants(2) |
$ | (61,614 | ) | $ | (58,751 | ) | $ | (112,524 | ) | $ | (124,137 | ) | $ | (323,232 | ) | $ | (221,328 | ) | $ | (265,872 | ) | |||||||
| Acquisitions |
$ | (11,508 | ) | $ | (96,571 | ) | $ | (183,666 | ) | $ | (351,273 | ) | $ | (2,480,738 | ) | $ | (2,473,675 | ) | $ | (101,009 | ) | |||||||
| Net cash flows used in investing activities from continuing operations |
$ | (73,122 | ) | $ | (155,322 | ) | $ | (296,162 | ) | $ | (475,410 | ) | $ | (2,803,970 | ) | $ | (2,695,003 | ) | $ | (366,881 | ) | |||||||
| Net cash flows provided by financing activities from continuing operations |
$ | 67,921 | $ | 135,446 | $ | 134,190 | $ | 433,079 | $ | 2,340,029 | $ | 2,346,803 | $ | 128,396 | ||||||||||||||
|
|
|
|
|
|
|
|
|
|
|
|
|
|
|
|||||||||||||||
| Other Financial Data: |
||||||||||||||||||||||||||||
| Adjusted EBITDA (in thousands)(3) |
$ | 37,007 | $ | 72,854 | $ | 123,490 | $ | 187,786 | $ | 554,429 | $ | 412,571 | $ | 482,619 | ||||||||||||||
|
|
|
|
|
|
|
|
|
|
|
|
|
|
|
|||||||||||||||
| Reconciliation of Adjusted EBITDA (in thousands): |
||||||||||||||||||||||||||||
| Net loss |
$ | (2,247 | ) | $ | (7,712 | ) | $ | (1,560 | ) | $ | (1,224 | ) | $ | (137,217 | ) | $ | (113,292 | ) | $ | (105,645 | ) | |||||||
| Earnings from discontinued operations, net of income taxes |
7,355 | 6,761 | 5,331 | 8,673 | 8,396 | 7,488 | 3,655 | |||||||||||||||||||||
|
|
|
|
|
|
|
|
|
|
|
|
|
|
|
|||||||||||||||
| Loss from continuing operations |
(9,602 | ) | (14,473 | ) | (6,891 | ) | (9,897 | ) | (145,613 | ) | (120,780 | ) | (109,300 | ) | ||||||||||||||
| Add back non-adjusted EBITDA items included in loss from continuing operations: |
||||||||||||||||||||||||||||
| Depreciation and amortization |
26,554 | 38,738 | 60,463 | 84,961 | 324,532 | 243,880 | 246,922 | |||||||||||||||||||||
| Interest expense |
15,245 | 18,692 | 33,414 | 50,720 | 202,464 | 164,807 | 150,905 | |||||||||||||||||||||
| Provision/(benefit) for income taxes |
(2,321 | ) | 4,549 | 11,329 | 26,871 | (24,205 | ) | (33,549 | ) | 27,202 | ||||||||||||||||||
| Stock-based compensation |
6,412 | 18,168 | 24,310 | 26,253 | 105,849 | 67,913 | 165,134 | |||||||||||||||||||||
| Loss on extinguishment of debt |
— | 5,881 | — | — | 77,253 | 77,253 | 1,911 | |||||||||||||||||||||
| Impairment of cost method investment |
— | — | — | 2,248 | — | — | — | |||||||||||||||||||||
| Unrealized foreign currency translation gains(4) |
— | — | — | — | (55 | ) | (42 | ) | (944 | ) | ||||||||||||||||||
| Transaction costs(5) |
719 | 1,299 | 865 | 6,630 | 14,204 | 13,089 | 789 | |||||||||||||||||||||
|
|
|
|
|
|
|
|
|
|
|
|
|
|
|
|||||||||||||||
| Adjusted EBITDA |
$ | 37,007 | $ | 72,854 | $ | 123,490 | $ | 187,786 | $ | 554,429 | $ | 412,571 | $ | 482,619 | ||||||||||||||
|
|
|
|
|
|
|
|
|
|
|
|
|
|
|
|||||||||||||||
(1) Pro forma basic and diluted net loss per share were computed to give effect to (i) the Restructuring and (ii) the issuance of shares of common stock by us in this offering as if they had occurred on July 1, 2013.
(2) See Note 2—Basis of Presentation and Significant Accounting Policies—n. Government Grants to our audited consolidated financial statements for an explanation of our stimulus grants.
(3) Adjusted EBITDA is not a financial measurement prepared in accordance with GAAP. We define Adjusted EBITDA as earnings from continuing operations before interest, income taxes, depreciation and amortization (“EBITDA”) adjusted to exclude acquisition-related transaction costs, losses on extinguishment of debt, stock-based compensation, unrealized foreign currency translation gains on an intercompany loan, and impairment of cost method investment. See “Non-GAAP Financial Measures.” The table above sets forth, for the periods indicated, a reconciliation of net loss to Adjusted EBITDA, as net loss is calculated in accordance with GAAP.
(4) Unrealized foreign currency gain results from the translation of an intercompany loan to a foreign subsidiary denominated in U.S. dollars to British pounds, the functional currency of the subsidiary.
(5) Transaction costs include expenses associated with professional services (i.e., legal, accounting, regulatory, etc.) rendered in connection with signed and/or closed acquisitions, travel expense, severance expense incurred on the date of acquisition, and other direct expenses incurred that are associated with such acquisitions.
37
Table of Contents
MANAGEMENT’S DISCUSSION AND ANALYSIS OF FINANCIAL CONDITION
AND RESULTS OF OPERATIONS
The following discussion and analysis should be read together with our audited consolidated financial statements and the related notes appearing elsewhere in this prospectus. In addition to historical consolidated financial information, the following discussion contains forward-looking statements that reflect our plans, estimates and beliefs. Our actual results could differ materially. Factors that could cause or contribute to these differences include those discussed below and elsewhere in this prospectus, particularly in “Risk Factors.” Unless the context otherwise requires, “we,” “us,” “our,” and the “Company” refer to Zayo Group Holdings, Inc. and its consolidated subsidiaries, including Zayo Group, LLC (“ZGL”).
Amounts presented are rounded. As such, rounding differences could occur in period-over-period changes and percentages reported throughout this discussion and analysis.
Overview
We are a large and fast growing provider of bandwidth infrastructure in the United States and Europe. Our products and services enable mission-critical, high-bandwidth applications, such as cloud-based computing, video, mobile, social media, machine-to-machine connectivity, and other bandwidth-intensive applications. Key products include leased dark fiber, fiber to cellular towers and small cell sites, dedicated wavelength connections, Ethernet and IP connectivity and other high-bandwidth offerings. We provide our services over a unique set of dense metro, regional, and long-haul fiber networks and through our interconnect-oriented datacenter facilities. Our fiber networks and datacenter facilities are critical components of the overall physical network architecture of the Internet and private networks. Our customer base includes some of the largest and most sophisticated consumers of bandwidth infrastructure services, such as wireless service providers; telecommunications service providers; financial services companies; social networking, media, and web content companies; education, research, and healthcare institutions; and governmental agencies. We typically provide our bandwidth infrastructure services for a fixed monthly recurring fee under contracts that vary between one and twenty years in length. As of March 31, 2014, we had more than $4.3 billion in revenue under contract with a weighted average remaining contract term of 42 months. We operate our business with a unique focus on capital allocation and financial performance with the ultimate goal of maximizing equity value for our stockholders. Our core values center on partnership, alignment, and transparency with our three primary constituent groups—employees, customers, and stockholders.
Prior to the Restructuring and consummation of this offering, Zayo Group Holdings, Inc. was a direct, wholly owned subsidiary of Communications Infrastructure Investments, LLC (“CII”). Our fiscal year ends June 30 each year, and we refer to the fiscal year ending June 30, 2014 as “Fiscal 2014,” the fiscal year ended June 30, 2013 as “Fiscal 2013,” the fiscal year ended June 30, 2012 as “Fiscal 2012” and the fiscal year ended June 30, 2011 as “Fiscal 2011.”
Our Segments
We use the management approach to determine the segment financial information that should be disaggregated and presented. The management approach is based on the manner by which management has organized the segments within the Company for making operating decisions, allocating resources, and assessing performance. As of March 31, 2014, we have three reportable segments as described below:
| • | Physical Infrastructure. Through our Physical Infrastructure segment, we provide raw bandwidth infrastructure to customers that require more control of their internal networks. These services include dark fiber, mobile infrastructure (fiber-to-the-tower and small cell), and colocation and interconnection. Dark fiber is a physically separate and secure, private platform for dedicated bandwidth. We lease dark fiber pairs (usually two to 12 total fibers) to our customers, who “light” the fiber using their own optronics. Our mobile infrastructure services provide direct fiber connections to cell towers, small cells, hub sites, and mobile switching centers. Our datacenters offer colocation and interconnection services to our |
38
Table of Contents
| customers, who then house and power our computing and networking equipment for the purpose of aggregating and distributing data, voice, Internet, and video traffic. The contract terms in our Physical Infrastructure segment generally range from three to twenty years. |
| • | Lit Services. Our Lit Services segment provides bandwidth infrastructure solutions over our metro, regional, and long-haul fiber networks where we use optronics to light the fiber and our customers pay us for access based on the amount and type of bandwidth they purchase. Our lit services include wavelength, Ethernet, IP, and SONET services. We target customers who require a minimum of 10G of bandwidth across their networks. The contract terms in this segment typically range from two to five years. |
| • | Other. Our Other segment currently consists of our eighth Strategic Product Group, Zayo Professional Services (“ZPS”). ZPS is our professional services business that provides network management and technical resources to our customers. |
Factors Affecting Our Results of Operations
Business Acquisitions
We were founded in 2007 with the investment thesis of building a bandwidth infrastructure platform to take advantage of the favorable Internet, data, and wireless growth trends driving the demand for bandwidth infrastructure, and to be an active participant in the consolidation of the industry. These trends have continued in the years since our founding, despite volatile economic conditions, and we believe that we are well positioned to continue to capitalize on those trends. We have built a significant portion of our network and service offerings through 32 acquisitions to date.
As a result of the growth of our business from these acquisitions, and capital expenditures and the increased debt used to fund those investing activities, our results of operations for the respective periods presented and discussed herein are not comparable.
Significant Acquisitions
AboveNet, Inc. (“AboveNet”)
On July 2, 2012, we acquired 100% of the outstanding capital stock of AboveNet, a public company listed on the New York Stock Exchange, for total consideration of approximately $2,210.0 million in cash, net of $141.6 million of cash acquired. At the closing, each outstanding share of AboveNet common stock was converted into the right to receive $84 in cash.
AboveNet was a provider of bandwidth infrastructure and network-neutral colocation and interconnection services, primarily to large corporate enterprise clients and communication carriers, including Fortune 1000 and FTSE 500 companies in the United States and Europe. AboveNet’s commercial strategy was consistent with ours, which was to focus on leveraging its infrastructure assets to provide bandwidth infrastructure services to a select set of customers with high-bandwidth demands. AboveNet provided physical infrastructure and lit services over its dense metropolitan, regional, national, and international fiber networks. It also operated a Tier 1 IP network with direct and indirect (through peering arrangements) connectivity in many of the most important bandwidth centers and peering exchanges in the U.S. and Europe. Its product set was highly aligned with our own, consisting primarily of dark fiber, wavelengths, Ethernet, IP, and colocation services. AboveNet had also built a very strong base of business with enterprise clients, particularly within the financial services sector.
The acquisition of AboveNet added approximately 20,600 new route miles and approximately 2,500,000 fiber miles to our network and added connections to approximately 4,000 on-net buildings, including more than 2,600 enterprise locations, many of which housed some of the largest corporate users of network services in the world. AboveNet’s metropolitan networks typically contained 432, and in some cases 864, fiber strands in each cable. This high fiber count allowed AboveNet to add new customers in a timely and cost-effective manner by focusing
39
Table of Contents
incremental construction and capital expenditures on the laterals that connect to the customer premises. AboveNet’s metropolitan networks served 17 markets in the U.S., with strong network footprints in a number of the largest metro markets, including Boston, Chicago, Los Angeles, New York, Philadelphia, San Francisco, Seattle, and Washington, D.C. It also served four metro markets in Europe: London, Amsterdam, Frankfurt, and Paris. These locations also included many private datacenters and hub locations that were important for AboveNet’s customers. AboveNet used under-sea capacity on the Trans-Atlantic undersea telecommunications network and other trans-Atlantic cables to provide connectivity from the U.S. to Europe.
The results of the acquired AboveNet business are included in our operating results beginning July 2, 2012.
360networks Holdings (USA) Inc. (“360networks”)
On December 1, 2011, we acquired 100% of the equity of 360networks. We paid the purchase price of approximately $317.9 million, net of approximately $0.7 million in cash acquired and net of an assumed working capital deficiency of approximately $26.4 million.
The acquired 360networks business operated 19,789 route miles of intercity and metropolitan fiber network across 21 states and British Columbia. 360networks’ intercity network interconnected over 70 markets across the central and western United States. In addition to its intercity network, 360networks operated over 800 route miles of metropolitan fiber networks across 25 markets, including Seattle, Denver, Colorado Springs, Omaha, Sacramento, and Salt Lake City.
The results of the acquired 360networks business are included in our operating results beginning December 1, 2011.
Geo Networks Limited (“Geo”)
On May 16, 2014, we acquired all of the outstanding shares of Geo, a London-based dark fiber provider. The purchase price of £175 million ($294.3 million based on the foreign currency exchange rate on that date) was paid with a combination of cash on hand and available funds drawn on our $250 million revolving credit facility.
Geo owns and operates a high capacity fiber network in the United Kingdom, providing dark fiber and co-location services to a variety of high-bandwidth sectors including media companies, service providers, financial services, datacenters, and gaming organizations. The acquisition added over 2,100 route miles to our European network and connectivity to 587 on-net buildings.
The results of the acquired Geo business are not included in our operating results presented herein, as the acquisition closed on May 16, 2014.
40
Table of Contents
Summary of Business Acquisitions
The table below summarizes the dates and purchase prices (which are net of cash acquired and includes assumption of debt and capital leases) of all acquisitions and asset purchases through June 30, 2014.
| Acquisition |
Date | Acquisition Cost | ||||||
| (In thousands) | ||||||||
| Memphis Networx |
July 31, 2007 | $ | 9,173 | |||||
| PPL Telecom |
August 24, 2007 | 46,301 | ||||||
| Indiana Fiber Works |
September 28, 2007 | 22,601 | ||||||
| Onvoy |
November 7, 2007 | 69,962 | ||||||
| Voicepipe |
November 7, 2007 | 2,800 | ||||||
| Citynet Fiber Networks |
February 15, 2008 | 99,238 | ||||||
| Northwest Telephone |
May 30, 2008 | 5,181 | ||||||
| CenturyTel Tri-State Markets |
July 22, 2008 | 2,700 | ||||||
| Columbia Fiber Solutions |
September 30, 2008 | 12,091 | ||||||
| CityNet Holdings Assets |
September 30, 2008 | 3,350 | ||||||
| Adesta Assets |
September 30, 2008 | 6,430 | ||||||
| Northwest Telephone California |
May 26, 2009 | 15 | ||||||
| FiberNet |
September 9, 2009 | 96,571 | ||||||
| AGL Networks |
July 1, 2010 | 73,666 | ||||||
| Dolphini Assets |
September 20, 2010 | 235 | ||||||
| American Fiber Systems |
October 1, 2010 | 114,141 | ||||||
| 360networks |
December 1, 2011 | 317,891 | ||||||
| MarquisNet |
December 31, 2011 | 13,581 | ||||||
| Arialink |
May 1, 2012 | 17,129 | ||||||
| AboveNet |
July 2, 2012 | 2,210,043 | ||||||
| FiberGate |
August 31, 2012 | 118,335 | ||||||
| USCarrier |
October 1, 2012 | 16,092 | ||||||
| FTS |
December 14, 2012 | 109,700 | ||||||
| Litecast |
December 31, 2012 | 22,160 | ||||||
| Core NAP |
May 31, 2013 | 7,080 | ||||||
| Corelink |
August 1, 2013 | 1,889 | ||||||
| Access |
October 1, 2013 | 40,068 | ||||||
| FiberLink |
October 2, 2013 | 43,137 | ||||||
| CoreXchange |
March 4, 2014 | 17,503 | ||||||
| Geo |
May 16, 2014 | 294,228 | ||||||
| Less portion of acquisition costs allocated to the discontinued operations of Onvoy |
(62,823 | ) | ||||||
|
|
|
|||||||
| Total |
$ | 3,730,468 | ||||||
|
|
|
|||||||
We completed each of the acquisitions described above, with the exception of Voicepipe and Corelink, with cash raised through combinations of equity issuances and the incurrence of debt. We acquired Voicepipe from certain existing CII equity holders in exchange for CII preferred units, and we acquired Corelink with a combination of cash and CII preferred units.
Recently Closed Acquisitions
On July 1, 2014, we acquired Neo Telecoms (“Neo”), a Paris-based bandwidth infrastructure company, for a purchase price of €58 million ($79.3 million based on the foreign currency exchange rate on that date). The purchase price was funded with cash on hand available from the proceeds of the Sixth Amendment to our Term Loan Facility. The acquisition of Neo added over 300 route miles of owned Paris metro fiber and approximately 540 on-net buildings to our network. Neo also operates nine colocation centers across France, offering more than 36,000 square feet of datacenter space. The Paris and regional network throughout France will be integrated into our existing European network connecting London, Frankfurt, and Amsterdam and the U.S.
41
Table of Contents
The results of the acquired Neo business are not included in our operating results presented herein, as the acquisition closed July 1, 2014.
On July 1, 2014, we acquired Colo Facilities Atlanta (“AtlantaNAP”), a data center and managed services provider in Atlanta, for a purchase price of $52.5 million. The purchase price was paid with cash on hand. The acquisition of AtlantaNAP added over 72,000 square feet of total data center space, including 42,000 square feet of conditioned colocation space.
The results of the acquired AtlantaNAP business are not included in our operating results presented herein, as the acquisition closed July 1, 2014.
Spin-Off of Business
In connection with certain business combinations, we have acquired assets and liabilities that support products outside of our primary focus of providing bandwidth infrastructure services. On June 13, 2014, we spun off all of our equity interest in Onvoy, LLC (“Onvoy”), a business that provides voice and managed services, by a cashless distribution to CII. The results of operations of Onvoy are presented as discontinued operations. See Note 4—Spin-off of Business to our audited consolidated financial statements.
Substantial Indebtedness
We had total indebtedness (excluding capital lease obligations) of $2,970.7 million and $2,830.7 million as of March 31, 2014 and June 30, 2013, respectively. As of March 31, 2014, our indebtedness consisted of $750.0 million aggregate principal amount of 8.125% senior secured first-priority notes due 2020 issued by ZGL (the “Senior Secured Notes”), $500.0 million of 10.125% senior unsecured notes due 2020 issued by ZGL (the “Senior Unsecured Notes,” and together with the Senior Secured Notes, the “Notes”), and a $1,720.7 million senior secured term loan facility of ZGL (the “Term Loan Facility”). The interest rate on the Term Loan Facility is floating based on LIBOR (subject to a floor of 1.0%) and was 4.00% as of March 31, 2014 and 4.50% as of June 30, 2013. ZGL also has a $250 million senior secured revolving credit facility (the “Revolver”), which was undrawn as of March 31, 2014. On May 16, 2014, we entered into a Sixth Amendment (the “Sixth Amendment”) to the credit agreement governing the Term Loan Facility and Revolver (the “Credit Agreement”). The Sixth Amendment increased the Company’s Term Loan Facility by $275.0 million. Term Loan Facility borrowings bear interest at the existing rate of LIBOR plus 3.0%, with a minimum LIBOR rate of 1.0%. The $275 million add-on was priced at 99.5%. No other terms of the Credit Agreement were amended.
In August 2012, we entered into interest rate swap agreements with an aggregate notional value of $750.0 million and a maturity date of June 30, 2017. The contracts state that we pay a 1.67% fixed rate of interest for the term of the agreement beginning June 30, 2013. The counterparties pay to us the greater of actual LIBOR or 1.25%. We entered into the swap arrangements to reduce the risk of increased interest costs associated with potential future increases in LIBOR rates. As of March 31, 2014, the fair value of the interest rate swaps was estimated as an asset of $0.7 million.
Substantial Capital Expenditures
During Fiscal 2013, 2012, and 2011 and nine months ended March 31, 2014, we invested, net of stimulus grant reimbursements, $323.2 million, $124.1 million, $112.5 million, and $265.9 million, respectively, in capital expenditures primarily to expand our fiber network to support new customer contracts. We expect to continue to make significant capital expenditures in future periods. During Fiscal 2013, 2012, and 2011, the Company received a total of $9.3 million, $22.8 million, and $3.5 million, respectively, in grant money from the National Telecommunications and Information Administration’s Broadband Technology Opportunities Program (“BTOP”) for reimbursement of property and equipment expenditures. We did not receive any grant money during the nine months ended March 31, 2014. The BTOP program is intended to support the deployment of broadband infrastructure, encourage sustainable adoption of broadband service, and develop and maintain a
42
Table of Contents
nationwide public map of broadband service capability and availability, under which recipients are required to comply with certain operational and reporting requirements as it relates to these broadband infrastructure assets. The Company has accounted for these funds as a reduction of the cost of its fiber optic network.
Debt and Equity Financings
In connection with the AboveNet acquisition, on July 2, 2012, ZGL issued the Notes and entered into the Credit Agreement. In addition, CII concluded the sale of preferred units of CII pursuant to certain securities purchase agreements with new private investment funds, as well as certain existing owners of CII and other investors. The total value of the preferred units issued pursuant to the securities purchase agreements was approximately $470.3 million, net of $2.0 million in costs associated with raising the additional capital. $133.2 million of the net proceeds from the equity raised were contributed to us in June 2012, and the remaining $337.1 million was contributed to us in July 2012.
A portion of the proceeds from the equity contribution, together with (i) the net proceeds from the Notes and the Term Loan Facility and (ii) cash on hand, were used to refinance ZGL’s then-existing indebtedness and to pay the cash consideration for the AboveNet acquisition and associated fees and expenses. In connection with the Notes offering and the Term Loan Facility, we recorded an original issue discount of $30.0 million and incurred debt issuance costs of $85.2 million.
On October 5, 2012 and February 27, 2013, we amended the Credit Agreement to reduce the interest rate on the Term Loan Facility and Revolver and removed the senior secured and total leverage maintenance covenants and increased the total leverage ratio required to be met in order to incur certain additional indebtedness.
In connection with the Fiscal 2013 refinancing transactions discussed above, we recognized an expense of $77.3 million during the year ended June 30, 2013, associated with debt extinguishment costs. The loss on extinguishment of debt associated with these transactions includes a portion of early call premiums paid to non-consenting creditors, non-cash expense associated with the write-off of unamortized debt issuance costs and issuance discounts on the debt balances accounted for as an extinguishment and certain fees paid to third parties involved in the debt refinancing transactions.
On November 26, 2013, we entered into a Fifth Amendment (the “Fifth Amendment”) to the Credit Agreement that increased the Term Loan Facility by $150.0 million to $1,749.8 million, and reduced the interest rate on the Term Loan Facility to LIBOR plus 3.0%, with a minimum LIBOR rate of 1.0%. The interest rate on the Revolver was also amended to LIBOR plus 2.75% (based on the current leverage ratio of ZGL). We recognized debt extinguishment expense in November 2013 of $1.9 million related to the Fifth Amendment and incurred an additional $1.5 million in debt issuance costs. We did not incur a re-pricing premium.
Background for Review of Our Results of Operations
Revenue
Our revenue is comprised predominately of monthly recurring revenue (“MRR”). MRR is related to an ongoing service that is generally fixed in price and paid by the customer on a monthly basis. We also report monthly amortized revenue (“MAR”), which represents the amortized portion of previously collected upfront charges to customers. Upfront charges are typically related to IRUs structured as pre-payments rather than monthly recurring payments (though we structure IRUs as both prepaid and recurring, largely dependent on the customers’ preference) and installation fees. The last category of revenue we report is other revenue. Other revenue includes credits and adjustments, termination revenue, construction services, and equipment sales.
43
Table of Contents
Our consolidated reported revenue in any given period is a function of our beginning revenue under contract and the impact of organic growth and acquisition activity. Our organic activity is driven by net new sales (“bookings”), gross installed revenue (“installs”) and churn processed (“churn”) as further described below.
| • | Net New Sales. Bookings are the dollar amount of orders recorded as MRR and MAR in a period that have been signed by the customer and accepted by our service delivery organization. The dollar value of bookings is equal to the monthly recurring price that the customer will pay for the services and/or the monthly amortized amount of the revenue that we will recognize for those services. To the extent a booking is cancelled by the customer prior to it being installed, it is subtracted from the total bookings number in the period that it is cancelled. Bookings do not immediately impact revenue until they are installed (gross installed revenue). |
| • | Gross Installed Revenue. Installs are the amount of MRR and MAR for services that have been installed, tested, accepted by the customer, and entered into the billing system in a given period. Installs include new services, price increases, and upgrades. |
| • | Churn Processed. Churn is any negative change to MRR and MAR. Churn includes disconnects, negative price changes, and disconnects associated with upgrades or replacement services. For each period presented, disconnects associated with attrition and upgrades are the drivers of churn, accounting for more than 80% of negative changes in MRR and MAR while price changes account for less than 20%. Monthly churn is also presented as a percentage of MRR and MAR (“churn percentage”). |
Given the size and amount of acquisitions we have completed, we have estimated the revenue growth rate associated with our organic activity in each period reported. Our estimated organic growth rate is calculated by adding an estimate of the acquired companies’ revenue for the reporting period prior to the date of inclusion in our results of operations, and then calculating the growth rate between the two reported periods. The estimate of acquired annual revenue is based on the acquired companies’ revenues for the most recent quarter prior to close (including estimated purchase accounting adjustments) multiplied by four, except in the case of AboveNet, which is based upon publicly reported revenue for the full period from June 30, 2011 to June 30, 2012. If, in calculating our estimated organic growth rates, we were to use the actual revenue results for the four quarters preceding the closing of each of our acquisitions, including AboveNet, our estimated organic growth rates would be higher than the estimated organic growth rates presented below. If we were to use acquired annual revenue, calculated by taking each acquired company’s revenues for the most recent quarter prior to the closing of such acquisition and multiplying by four, including for AboveNet, our estimated organic growth rates would be lower than the estimated organic growth rates presented below.
Operating Costs
Our operating costs consist primarily of third-party network service costs and colocation facility costs. Third-party network service costs result from our leasing of certain network facilities, primarily leases of circuits and dark fiber, from carriers to augment our owned infrastructure, for which we are generally billed a fixed monthly fee. Our colocation facility costs include rent and license fees paid to the landlords of the buildings in which our zColo business operates, along with the utility costs to power those facilities. While increases in demand for our services will drive additional operating costs in our business, consistent with our strategy of leveraging our owned infrastructure assets, we expect to primarily utilize our existing network infrastructure or build new network infrastructure to meet the demand. In limited circumstances, we will augment our network with additional circuits or services from third-party providers. Third-party network service costs include the upfront cost of the initial installation of such circuits. We have excluded depreciation and amortization expense from our operating costs.
44
Table of Contents
Selling, General, and Administrative Expenses
Our selling, general, and administrative (“SG&A”) expenses include compensation and benefits expenses, network operations expenses, other SG&A expenses, transaction costs and stock-based compensation.
Compensation and benefits expenses include salaries, wages, incentive compensation (bonus and commissions) and benefits. Employee-related costs that are directly associated with network construction, service installations and development of business support systems are capitalized rather than expensed in SG&A.
After compensation and benefits and stock-based compensation, network operations expenses are the largest components of our SG&A expenses. Network operations expenses include all of the non-personnel related expenses of maintaining our network infrastructure, including contracted maintenance fees, right-of-way costs, rent for cellular towers and other places where fiber is located, pole attachment fees, and relocation expenses.
Other SG&A expenses include expenses such as property tax, franchise fees, travel, office expense, and maintenance expense on colocation facilities.
Transaction costs include expenses associated with professional services (i.e., legal, accounting, regulatory, etc.) rendered in connection with acquisitions, travel expense, severance expense incurred on the date of acquisition, and other direct expenses incurred that are associated with signed and/or closed acquisitions.
Our stock-based compensation expense contains two components, common unit awards classified as liabilities and, to a lesser extent, preferred unit awards classified as equity. For the CII common units granted to employees and directors, we recognize an expense equal to the fair value of all of those common units that vest during the period plus the change in fair value of previously vested units, and record a liability in respect of those amounts. When the CII preferred units are initially granted, we recognize no expense. We use the straight line method, over the vesting period, to amortize the fair value of those units, as determined on the date of grant. Subsequent changes in the fair value of the preferred units granted to members of management and directors do not affect the amount of expense we recognize.
Refer to “Selected Historical Consolidated Financial Information” for additional financial information for the indicated periods.
Nine Months Ended March 31, 2014 Compared to the Nine Months Ended March 31, 2013
Revenue
| Nine Months ended March 31, | ||||||||||||||||
| 2014 | 2013 | $ Variance | % Variance | |||||||||||||
| (in thousands) | ||||||||||||||||
| Segment and consolidated revenue: | ||||||||||||||||
| Physical Infrastructure |
$ | 361,691 | $ | 304,894 | $ | 56,797 | 19 | % | ||||||||
| Lit Services |
454,292 | 425,021 | 29,271 | 7 | % | |||||||||||
| Other |
19,705 | 21,020 | (1,315 | ) | (6 | )% | ||||||||||
| Corp/eliminations |
(9,151 | ) | (8,288 | ) | (863 | ) | 10 | % | ||||||||
|
|
|
|
|
|
|
|
|
|||||||||
| Consolidated |
$ | 826,537 | $ | 742,647 | $ | 83,890 | 11 | % | ||||||||
|
|
|
|
|
|
|
|
|
|||||||||
Our total revenue increased by $83.9 million, or 11%, from $742.6 million for the nine months ended March 31, 2013 to $826.5 million for the nine months ended March 31, 2014. The increase in revenue was driven by our organic growth as well as Fiscal 2013 and 2014 acquisitions.
45
Table of Contents
We estimate that the period-over-period organic growth was approximately 6%. Our organic growth was driven by installs that exceeded churn over the course of both periods, resulting from continued strong demand for bandwidth infrastructure services broadly across our service territory and customer verticals. Further underlying revenue drivers included:
| • | Bookings grew significantly, increasing from $12.8 million to $15.7 million in combined MRR and MAR. This growth was driven by increased customer demand for our services, our growing fiber and datacenter footprint (from both organic investments and acquisitions), and our salesforce’s improved effectiveness in selling on this base of assets. The total contract value associated with this period’s bookings was approximately $1.2 billion. |
| • | Installs grew by approximately $0.8 million between the two periods, but lagged the increase in bookings, which included more infrastructure-related services with longer booking to install time intervals. Examples included several FTT sales and a large dark fiber sale to tw telecom. |
| • | Monthly churn percentage increased slightly between the two periods, from 1.3% to 1.4%, representing an increase in total churn from $9.8 million to $11.1 million. |
We estimate that the period-over-period acquisition-related revenue growth was approximately 5%. Multiple Fiscal 2013 and Fiscal 2014 acquisitions impacted revenue growth between the two periods. The six Fiscal 2013 acquisitions were completed at various times throughout the year, although the largest (AboveNet) closed on July 2, 2012 and was fully included in the nine month results for the period ended March 31, 2013 and therefore was not a contributor to the period-over-period acquisition growth. The others had partial impacts on the nine months ended March 31, 2013 compared to a full impact for the nine months ended March 31, 2014. The four Fiscal 2014 acquisitions were completed on August 1, 2013, October 1, 2013, October 2, 2013 and March 4, 2014 and were included in our nine months ended March 31, 2014 results for approximately eight, six, six and one month(s), respectively. The Fiscal 2014 acquisitions represented smaller acquisitions of dark fiber and colocation-only providers.
Physical Infrastructure. Revenue from our Physical Infrastructure segment increased by $56.8 million, or 19%, from $304.9 million to $361.7 million for the nine months ended March 31, 2013 and 2014, respectively.
We estimate that organic revenue growth for the Physical Infrastructure segment between the two comparative nine month periods was approximately 7%. Dark fiber is the largest Strategic Product Group within the segment and benefited from continuing growth in infrastructure demand. Our FTT and zColo products also contributed to the segment’s growth. Bookings of MRR and MAR for the nine months ended March 31, 2014 were $7.7 million (with a total contract value of approximately $930 million), nearly double the $4.6 million in bookings for the comparative prior nine month period. Installs were $6.1 million, an increase from $4.8 million from the comparative prior nine month period. The monthly churn percentage remained consistent between the two periods at 0.9%, while total churn was $2.8 million and $3.2 million for the nine month periods ended March 31, 2013 and 2014, respectively. All of the Fiscal 2014 acquisitions impacted the Physical Infrastructure segment revenues, with FiberLink (dark fiber) and CoreLink and CoreXchange (both colocation) being Physical Infrastructure-only businesses.
Lit Services. Revenue from our Lit Services segment increased by $29.3 million, or 7%, from $425.0 million to $454.3 million for the nine months ended March 31, 2013 and 2014, respectively.
We estimate that organic revenue growth for the Lit Services segment between the two comparative nine month periods was approximately 5%. Growth was strongest in the segment’s Ethernet and IP Strategic Product Groups, driven by customer demand and increased effectiveness in marketing these products. Wavelength revenue growth was dampened by churn, including price concessions we proactively offered in exchange for customer contract extensions. SONET is a legacy product; its revenue declined between the two periods, consistent with our expectations. Bookings of MRR and MAR decreased slightly from $8.2 million to
46
Table of Contents
$8.0 million between the two periods, with a total contract value of approximately $270 million, for the nine month period ended March 31, 2014. Installs were $8.4 million for the nine months ended March 31, 2014, compared to $8.9 million for the comparative prior year period. The monthly churn percentage increased slightly from 1.6% to 1.7% over the two periods, with total churn increasing from $6.9 million to $7.6 million. The Lit Services period-over-period revenue results were only influenced by the carryover impacts from the Fiscal 2013 acquisitions as the Fiscal 2014 acquisitions all related only to Physical Infrastructure.
Other. Revenue from our Other segment, consisting of Zayo Professional Services, declined by 6% ($1.3 million) for the nine months ended March 31, 2014 versus the comparative prior year period. The decline was largely driven by a reduction in equipment sales, which occur infrequently. The Other segment represented approximately 2% of our total revenue.
The following table reflects the stratification of our revenue during these periods. While MRR continued to represent the vast majority of our revenue, MAR increased as a percentage of total revenue as a result of Physical Infrastructure installs with large upfront payments to offset capital expenditures and two Fiscal 2014 acquisitions with significant deferred revenue balances.
| Nine months ended March 31, | ||||||||||||||||
| 2014 | 2013 | |||||||||||||||
| (in thousands) | ||||||||||||||||
| Monthly recurring revenue |
$ | 771,962 | 93 | % | $ | 701,640 | 94 | % | ||||||||
| Monthly amortized revenue |
40,605 | 5 | % | 31,186 | 4 | % | ||||||||||
| Other revenue |
13,970 | 2 | % | 9,821 | 1 | % | ||||||||||
|
|
|
|
|
|
|
|
|
|||||||||
| Total revenue |
$ | 826,537 | 100 | % | $ | 742,647 | 100 | % | ||||||||
|
|
|
|
|
|
|
|
|
|||||||||
Operating Costs, Excluding Depreciation and Amortization
| Nine Months ended March 31, | ||||||||||||||||
| 2014 | 2013 | $ Variance | % Variance | |||||||||||||
| (in thousands) | ||||||||||||||||
| Segment and consolidated operating costs, excluding depreciation and amortization: | ||||||||||||||||
| Physical Infrastructure |
$ | 32,456 | $ | 27,986 | $ | 4,470 | 16 | % | ||||||||
| Lit Services |
72,811 | 74,743 | (1,932 | ) | (3 | )% | ||||||||||
| Other |
9,813 | 10,755 | (942 | ) | 9 | % | ||||||||||
| Corp/eliminations |
(4,446 | ) | (3,452 | ) | (994 | ) | 29 | % | ||||||||
|
|
|
|
|
|
|
|
|
|||||||||
| Consolidated |
$ | 110,634 | $ | 110,032 | $ | 602 | 1 | % | ||||||||
|
|
|
|
|
|
|
|
|
|||||||||
| As a percentage of revenue |
13 | % | 15 | % | ||||||||||||
Our operating costs, which exclude depreciation and amortization, increased by $0.1 million, or 1%, from $110.0 million for the nine months ended March 31, 2013 to $110.6 million for the nine months ended March 31, 2014. The increase in consolidated operating costs was due to increased facility costs related to the zColo acquisitions offset by cost savings, as planned network related synergies were realized. Operating costs as a percentage of total revenue decreased from 15% to 13% as a result of cost reductions and because our incremental revenue typically has less third-party network service costs associated with it than the existing base of revenue.
Physical Infrastructure. Physical Infrastructure operating costs increased by $4.5 million, or 16%, from $28.0 million to $32.5 million for the nine months ended March 31, 2013 and 2014, respectively. The increase in operating costs was primarily a result of zColo’s acquisitions in Fiscal 2013 and during the nine months ended March 31, 2014.
47
Table of Contents
Lit Services. Lit Services operating costs decreased by $1.9 million, or 3%, from $74.7 million to $72.8 million for the nine months ended March 31, 2013 and 2014, respectively. The 3% decrease in operating costs was primarily due to realized network-related cost synergies related to our acquisitions, and, to a lesser extent, ongoing off-net circuit cost reduction projects.
Other. Other operating costs decreased by $1.0 million, or 9%, from $10.8 million to $9.8 million for the nine months ended March 31, 2013 and 2014, respectively. The reduction in other operating costs was primarily attributable to the reduction in equipment sales and corresponding decrease in equipment costs.
Selling, General, and Administrative Expenses
The table below sets forth the components of our selling, general, and administrative (“SG&A”) expenses during the nine months ended March 31, 2014 and 2013.
| Nine months ended March 31, | ||||||||||||||||
| 2014 | 2013 | $ Variance | % Variance | |||||||||||||
| (in thousands) | ||||||||||||||||
| Compensation and benefits expenses |
$ | 74,914 | $ | 78,783 | $ | (3,869 | ) | (5 | %) | |||||||
| Network operations expenses |
96,508 | 83,019 | 13,489 | 16 | % | |||||||||||
| Other SG&A expenses |
62,184 | 58,502 | 3,682 | 6 | % | |||||||||||
| Transaction costs |
789 | 13,089 | (12,300 | ) | (94 | %) | ||||||||||
| Stock-based compensation |
165,134 | 67,913 | 97,221 | 143 | % | |||||||||||
|
|
|
|
|
|
|
|
|
|||||||||
| Total SG&A expenses |
$ | 399,529 | $ | 301,306 | $ | 98,223 | 33 | % | ||||||||
|
|
|
|
|
|
|
|
|
|||||||||
| As a percentage of revenue |
48 | % | 41 | % | ||||||||||||
| As a percentage of revenue (excluding stock-based compensation) |
28 | % | 31 | % | ||||||||||||
Compensation and Benefits Expenses. Compensation and benefits expenses decreased by $3.9 million, or 5%, from $78.8 million to $74.9 million for the nine months ended March 31, 2013 and 2014, respectively.
The decrease reflected a reduction in bonus payout as the average payout in the nine months ended March 31, 2013 was approximately 140% of target as compared to approximately 100% of target in the nine months ended March 31, 2014. The nine months ended March 31, 2013 also included elevated compensation and benefits costs related to the acquisition and integration of AboveNet, including elevated severance and commission costs. Offsetting the reduction in compensation and benefits costs was the increase in headcount during the fourth quarter of Fiscal 2013 and the first three quarters of Fiscal 2014 to support our growing business, including certain employees retained from businesses acquired since March 31, 2013.
Headcount as of the end of the respective periods was:
| March 31, 2014 |
March 31, 2013 |
|||||||
| Physical Infrastructure |
821 | 510 | ||||||
| Lit Services |
571 | 553 | ||||||
| Other |
29 | 26 | ||||||
|
|
|
|
|
|||||
| Total |
1,421 | 1,089 | ||||||
|
|
|
|
|
|||||
Network Operations Expenses. Network operations expenses increased by $13.5 million, or 16%, from $83.0 million to $96.5 million for the nine months ended March 31, 2013 and 2014, respectively. Contributing to the increase was a $2.5 million expense associated with a third party imposed relocation of our network infrastructure during the nine months ended March 31, 2014. The increase also reflected the growth of our network assets and the related expenses of operating that expanded network.
48
Table of Contents
Other SG&A. Other SG&A expenses increased by $3.7 million, or 6%, from $58.5 million to $62.2 million for the nine months ended March 31, 2013 and 2014, respectively. The increase was principally a result of additional expenses attributable to our Fiscal 2013 and Fiscal 2014 acquisitions, which were partially offset by the receipt of $3.8 million in connection with an escrow settlement reached relating to the 360networks acquisition during the second quarter of Fiscal 2014.
Transaction Costs. Transaction costs decreased by $12.3 million, or 94%, from $13.1 million to $0.8 million for the nine months ended March 31, 2013 and 2014, respectively. The decrease was due to higher transaction-related costs in the first quarter of Fiscal 2013 associated with the AboveNet acquisition.
Stock-Based Compensation. Stock-based compensation expenses increased by $97.2 million, or 143%, from $67.9 million to $165.1 million during the nine months ended March 31, 2013 and 2014, respectively. The stock-based compensation expense associated with the common units is impacted by both the estimated value of the common units and the number of common units vesting during the period. The following table reflects the estimated fair value of the common units during the relevant periods impacting the stock-based compensation expense for the nine months ended March 31, 2014 and 2013.
| Estimated fair value as of | ||||||||||||||||
| Common Units |
March 31, 2014 |
June 30, 2013 |
March 31, 2013 |
June 30, 2012 |
||||||||||||
| (estimated value per unit) | ||||||||||||||||
| Class A |
$ | 2.17 | $ | 1.50 | $ | 1.32 | $ | 0.92 | ||||||||
| Class B |
1.93 | 1.34 | 1.16 | 0.81 | ||||||||||||
| Class C |
1.65 | 1.14 | 0.96 | 0.68 | ||||||||||||
| Class D |
1.60 | 1.10 | 0.93 | 0.65 | ||||||||||||
| Class E |
1.38 | 0.95 | 0.78 | 0.55 | ||||||||||||
| Class F |
1.22 | 0.75 | 0.68 | 0.49 | ||||||||||||
| Class G |
0.65 | 0.46 | 0.31 | n/a | ||||||||||||
| Class H |
0.53 | 0.38 | 0.24 | n/a | ||||||||||||
| Class I |
0.31 | n/a | n/a | n/a | ||||||||||||
| Class J |
0.22 | n/a | n/a | n/a | ||||||||||||
| ZPS Class A |
0.20 | 0.20 | n/a | n/a | ||||||||||||
The increase in the estimated value of the common units in the current period is primarily a result of our organic growth since March 31, 2013 and cost synergies realized (and expected to be realized) from our prior acquisitions.
Depreciation and Amortization
Depreciation and amortization expense increased by $3.0 million, or 1%, from $243.9 million for the nine months ended March 31, 2013 to $246.9 million for the nine months ended March 31, 2014. The increase was primarily the result of depreciation related to capital expenditures since March 31, 2013 and acquisition-related growth.
49
Table of Contents
Total Other Expenses, Net
The table below sets forth the components of our total other expenses, net for the nine months ended March 31, 2014 and 2013.
| Nine months ended March 31, | ||||||||
| 2014 | 2013 | |||||||
| (in thousands) | ||||||||
| Interest expense |
$ | (150,905 | ) | $ | (164,807 | ) | ||
| Loss on extinguishment of debt |
(1,911 | ) | (77,253 | ) | ||||
| Other income, net |
1,266 | 302 | ||||||
|
|
|
|
|
|||||
| Total other expenses, net |
$ | (151,550 | ) | $ | (241,758 | ) | ||
|
|
|
|
|
|||||
Interest Expense. Interest expense decreased by $13.9 million, or 8%, from $164.8 million to $150.9 million for the nine months ended March 31, 2013 and 2014, respectively. The decrease in interest expense was primarily the result of the amendment of our Credit Agreement during the second and third quarters of Fiscal 2013 to lower the interest rates on our Term Loan Facility and Revolver, in addition to quarterly principal payments on our Term Loan Facility, which reduced our outstanding debt obligations. Also contributing to the decrease in interest expense was the impact of changes in market value of our interest rate swap during the nine months ended March 31, 2014 as compared to the comparable period. We recorded additional interest expense of $1.9 million during the nine months ended March 31, 2014, as compared to additional $5.1 million of additional interest expense during the nine months ended March 31, 2013 to reflect the change in the fair value of our interest rate swaps, representing a change in interest expense of $3.2 million. The decrease was partially offset by additional interest expense related to the $150.0 million add-on to our Term Loan Facility during the second quarter of Fiscal 2014.
Loss on Extinguishment of Debt. In connection with the debt refinancing activities during the second quarter of Fiscal 2014, we recognized an expense of $1.9 million associated with debt extinguishment costs, including a cash expense of $0.9 million associated with the payment of third party costs and non-cash expenses of $1.0 million, consisting of $0.7 million associated with the write-off of unamortized debt issuance costs and $0.3 million associated with the write-off of the net unamortized discount on the extinguished debt balances.
In connection with the debt refinancing activities during the nine months ended March 31, 2013, we recognized an expense of $77.3 million associated with debt extinguishment costs, including a cash expense of $43.1 million associated with the payment of early redemption fees and other third party expenses on our previous indebtedness and non-cash expenses, including $34.2 million associated with the write-off of unamortized debt issuance costs and unamortized discounts.
Other Income, net. Other income, net during the nine months ended March 31, 2014 primarily related to an unrealized foreign currency translation gain on an intercompany loan. Our domestic subsidiaries have an intercompany loan denominated in U.S. dollars with our U.K. foreign subsidiary. The intercompany loan balance is eliminated in consolidation; however, the weakening of the British pound over the U.S. dollar during the nine months ended March 31, 2014 resulted in an unrealized foreign currency translation gain on the intercompany loan of $0.9 million at our foreign subsidiary.
Provision for Income Taxes
We recorded a provision for income taxes of $27.2 million during the nine months ended March 31, 2014 as compared to a benefit of $33.5 million during the nine months ended March 31, 2013. Our provision for income taxes included both the current provision and a provision for deferred income tax expense resulting from timing differences between tax and financial reporting accounting bases. We were unable to combine our NOLs for application to the income of our subsidiaries in some states and thus our state income tax expense was higher than the expected blended rate. In addition, as a result of our stock-based compensation and certain transaction costs not being deductible for income tax purposes, our effective tax rate was higher than the statutory rate.
50
Table of Contents
Our foreign operations have historically incurred operating losses. In the event that we have future positive earnings in foreign jurisdictions and repatriate these funds, we would be required to accrue and pay the appropriate income tax in the U.S. It is our intent that any current or future profits from foreign operations will be reinvested in those foreign jurisdictions.
The following table reconciles an expected tax provision based on the statutory federal tax rate applied to our earnings before income taxes to our actual provision/(benefit) for income taxes:
| Nine months ended March 31, | ||||||||
| 2014 | 2013 | |||||||
| (in thousands) | ||||||||
| Expected benefit at statutory rate |
$ | (28,559 | ) | $ | (54,021 | ) | ||
| Increase/(decrease) due to: |
||||||||
| Non-deductible stock-based compensation |
62,554 | 22,968 | ||||||
| State income taxes (benefit), net of federal benefit |
(3,928 | ) | (4,942 | ) | ||||
| Transactions costs not deductible for tax purposes |
201 | 970 | ||||||
| Foreign tax rate differential |
(62 | ) | (1,096 | ) | ||||
| Provision to return adjustment |
(514 | ) | — | |||||
| Release of accrual for uncertain tax position |
(2,600 | ) | — | |||||
| Other, net |
110 | 2,572 | ||||||
|
|
|
|
|
|||||
| Provision/(benefit) for income taxes |
$ | 27,202 | $ | (33,549 | ) | |||
|
|
|
|
|
|||||
Year Ended June 30, 2013 Compared to the Year Ended June 30, 2012
Revenue
| Year ended June 30, | ||||||||||||||||
| 2013 | 2012 | $ Variance | % Variance | |||||||||||||
| (in thousands) | ||||||||||||||||
| Segment and consolidated revenue: | ||||||||||||||||
| Physical Infrastructure |
$ | 415,454 | $ | 157,419 | $ | 258,035 | 164 | % | ||||||||
| Lit Services |
572,631 | 224,624 | 348,007 | 155 | % | |||||||||||
| Other |
27,775 | — | 27,775 | — | ||||||||||||
| Corp/eliminations |
(11,506 | ) | (6,517 | ) | (4,989 | ) | 77 | % | ||||||||
|
|
|
|
|
|
|
|
|
|||||||||
| Consolidated |
$ | 1,004,354 | $ | 375,526 | $ | 628,828 | 167 | % | ||||||||
|
|
|
|
|
|
|
|
|
|||||||||
Our total revenue increased by $628.8 million, or 167%, from $375.5 million for Fiscal 2012 to $1,004.4 million for Fiscal 2013. The increase in revenue was driven by our organic growth and Fiscal 2012 and 2013 acquisitions.
We estimate that we achieved an organic growth rate from Fiscal 2012 to Fiscal 2013 of approximately 6%. Our organic growth was driven by installs that exceeded churn in both periods, resulting from strong demand for bandwidth infrastructure services broadly across our geographic markets and customer verticals. Further underlying organic activity drivers during the period included:
| • | Bookings approximately doubled, increasing from $8.5 million to $17.7 million in combined MRR and MAR. This growth was primarily driven by the addition of the AboveNet fiber assets, select salespeople and customer relationships used to market our services across a broader set of assets. Our bookings grew over the course of Fiscal 2013, with each quarter’s results exceeding the prior. The total contract value associated with Fiscal 2013 bookings was approximately $1 billion. |
51
Table of Contents
| • | Installs more than doubled between the two periods from $7.4 million to $18.4 million, and were the primary driver of our organic revenue growth. This install activity was directly correlated to our bookings; however, there was a natural time lag between the booking and the associated install. We believe our ability to install bookings on a timely basis improved throughout the year as we completed the integration activities associated with the Fiscal 2012 acquisitions and substantially integrated the AboveNet acquisition. |
| • | The monthly churn percentage increased slightly from 1.3% to 1.4% between the two periods, with total churn increasing from $4.9 million to $13.6 million. This Fiscal 2013 churn percentage remained within our expected range. However, following our acquisition of AboveNet, we made a conscious and active effort to re-term former AboveNet customers in order to significantly extend the average remaining contract life of our services and revenue. These actions often required some price concession to our customers (which had a resulting churn impact) in exchange for a longer term. |
We estimate that the period-over-period acquisition-related revenue growth was approximately 161%. The three Fiscal 2012 acquisitions were completed on December 1, 2011, December 31, 2011 and May 1, 2012 and therefore were included in our results of operations for seven, six and two months, respectively, in Fiscal 2012 compared to a full twelve months in Fiscal 2013. The most significant acquisition in Fiscal 2012 was 360networks. The acquisition of 360networks added substantial metro and regional network assets in the Western U.S. The six Fiscal 2013 acquisitions were completed at various times throughout the year with the largest, AboveNet, closing on July 2, 2012 and being included in our Fiscal 2013 results of operations for the entire twelve month period. The AboveNet acquisition significantly expanded our metro fiber assets in some of largest U.S. metro markets plus London, and provided important new customer relationships and product capabilities that we applied across our combined networks. The acquisition of AboveNet had the impact of more than doubling our previous revenue run rate.
Physical Infrastructure. Revenues from our Physical Infrastructure segment increased by $258.0 million, or 164%, from $157.4 million to $415.5 million for Fiscal 2012 and Fiscal 2013, respectively.
We estimate that organic revenue growth for the Physical Infrastructure segment was approximately 12%. This was influenced by the increasing importance of bandwidth for our customers (in volume and criticality), and, in select cases, reflects a shift from lit services to physical infrastructure products. This is evidenced by strong bookings and install activity on large FTT projects for many of the major wireless carriers. Bookings of MRR and MAR during Fiscal 2013 totaled $6.3 million (with a total contract value of $610 million), compared to $5.3 million in Fiscal 2012. Installs were $6.5 million in Fiscal 2013, an increase from $3.5 million in the prior year. The monthly churn percentage improved from 1.1% to 0.9% between the two years; however, total churn grew from $1.7 million to $3.8 million in Fiscal 2013 as a result of the larger base of revenue. The six Fiscal 2013 acquisitions were disproportionately weighted towards Physical Infrastructure products, and therefore acquisitions had a larger impact on this segment. Each of our Fiscal 2012 acquisitions were heavily weighted towards dark fiber and colocation services.
Lit Services. Revenues from our Lit Services segment increased by $348.0 million, or 155%, from $224.6 million to $572.6 million for Fiscal 2012 and Fiscal 2013, respectively.
We estimate that organic revenue growth for the Lit Services segment was approximately 3%. This performance reflected higher churn related to proactively re-terming select Lit Services customer contracts in exchange for certain price concessions. Additionally, we experienced migration of select wavelength customers to dark fiber. Demand for Lit Services remained strong, as evidenced by $11.3 million of Fiscal 2013 bookings (totaling approximately $375 million in total contract value), versus $3.2 million in Fiscal 2012. This growth was supported by new geographies and routes, as well as enhanced Ethernet and IP capabilities that were acquired through the AboveNet acquisition. Installs were in line with bookings in Fiscal 2013, totaling $11.8 million of MRR and MAR. The monthly churn percentage increased from 1.5% to 1.7% between the two periods, resulting in total churn processed of $9.6 million, compared to $3.2 million in the prior fiscal year. AboveNet’s large base of wavelength and Ethernet customers was the primary contributor to the Lit Services inorganic growth.
52
Table of Contents
Other. Our Other segment, consisting of Zayo Professional Services, was a new addition in Fiscal 2013 through the acquisition of AboveNet. The Other segment represented approximately 3% of our total revenue in Fiscal 2013.
The following table reflects the stratification of our revenues during these periods. The substantial majority of our revenue continued to come from recurring payments from customers under contractual arrangements (MRR).
| Year ended June 30, | ||||||||||||||||
| 2013 | 2012 | |||||||||||||||
| (in thousands) | ||||||||||||||||
| Monthly recurring revenue |
$ | 941,076 | 94 | % | $ | 350,900 | 93 | % | ||||||||
| Monthly amortized revenue |
43,140 | 4 | % | 13,785 | 4 | % | ||||||||||
| Other revenue |
20,138 | 2 | % | 10,841 | 3 | % | ||||||||||
|
|
|
|
|
|
|
|
|
|||||||||
| Total revenue |
$ | 1,004,354 | 100 | % | $ | 375,526 | 100 | % | ||||||||
|
|
|
|
|
|
|
|
|
|||||||||
Operating Costs, Excluding Depreciation and Amortization
| Year ended June 30, | ||||||||||||||||
| 2013 | 2012 | $ Variance | % Variance | |||||||||||||
| (in thousands) | ||||||||||||||||
| Segment and consolidated operating costs, excluding depreciation and amortization: | ||||||||||||||||
| Physical Infrastructure |
$ | 37,146 | $ | 21,677 | $ | 15,469 | 71 | % | ||||||||
| Lit Services |
99,443 | 60,899 | 38,544 | 63 | % | |||||||||||
| Other |
14,377 | — | 14,377 | 100 | % | |||||||||||
| Corp/eliminations |
(5,089 | ) | (493 | ) | (6,140 | ) | 1245 | % | ||||||||
|
|
|
|
|
|
|
|
|
|||||||||
| Consolidated |
$ | 145,877 | $ | 82,083 | $ | 63,794 | 78 | % | ||||||||
|
|
|
|
|
|
|
|
|
|||||||||
| As a percentage of revenue |
15 | % | 22 | % | ||||||||||||
Our operating costs, excluding depreciation and amortization, increased by $63.8 million, or 78%, from $82.1 million for Fiscal 2012 to $145.9 million for Fiscal 2013. The increase in consolidated operating costs primarily related to our Fiscal 2012 and Fiscal 2013 acquisitions, and additional network costs incurred in order to support new customer contracts entered into subsequent to June 30, 2012. Operating costs as a percentage of total revenue decreased from 22% to 15% principally due to the shift in product mix (namely the increased percentage of dark fiber) associated with the July 2, 2012 acquisition of AboveNet. Also, as a result of the acquisition of AboveNet and its status as a Tier 1 settlement-free peering partner, we were able to eliminate IP transit costs that we previously incurred by the Company.
Physical Infrastructure. Physical Infrastructure operating costs increased by $15.5 million, or 71%, from $21.7 million to $37.1 million for Fiscal 2012 and Fiscal 2013, respectively. As a percentage of revenue physical infrastructure operating costs decreased materially reflecting the higher proportion of acquired dark fiber with little to no associated network costs.
Lit Services. Lit Services operating costs increased by $38.5 million, or 63%, from $60.9 million to $99.4 million for Fiscal 2012 and Fiscal 2013, respectively. As a percentage of revenue Lit Services operating costs also decreased significantly. While the acquired AboveNet Lit Services did have associated network expenses, the proportion of those expenses to revenue was lower for AboveNet than the Company.
Other. Other operating costs increased by $14.4 million, from $0.0 million to $14.4 million for Fiscal 2012 and Fiscal 2013, respectively. The increase was entirely the result of acquiring the ZPS strategic product group through the acquisition of AboveNet.
53
Table of Contents
Selling, General, and Administrative Expenses
The table below sets forth the components of our selling, general, and administrative (“SG&A”) expenses during the years ended June 30, 2013 and 2012.
| Year ended June 30, | ||||||||||||||||
| 2013 | 2012 | $ Variance | % Variance | |||||||||||||
| (in thousands) | ||||||||||||||||
| Compensation and benefits expenses |
$ | 101,955 | $ | 42,635 | $ | 59,320 | 139 | % | ||||||||
| Network operations expenses |
119,850 | 37,097 | 82,753 | 223 | % | |||||||||||
| Other SG&A expenses |
82,514 | 26,048 | 56,466 | 217 | % | |||||||||||
| Transaction costs |
14,204 | 6,630 | 7,574 | 114 | % | |||||||||||
| Stock-based compensation |
105,849 | 26,253 | 79,596 | 303 | % | |||||||||||
|
|
|
|
|
|
|
|
|
|||||||||
| Total SG&A expenses |
$ | 424,372 | $ | 138,663 | $ | 285,709 | 206 | % | ||||||||
|
|
|
|
|
|
|
|
|
|||||||||
| As a percentage of revenue |
42 | % | 37 | % | ||||||||||||
| As a percentage of revenue, excluding stock-based compensation |
32 | % | 30 | % | ||||||||||||
Compensation and Benefits Expenses. Compensation and benefits expenses increased by $59.3 million, or 139%, from $42.6 million to $102.0 million for Fiscal 2012 and Fiscal 2013, respectively.
The compensation and benefits increase reflects the increased number of employees resulting from the AboveNet acquisition and to a lesser extent employees hired during the year to support our growing business as well as employees retained from other Fiscal 2013 acquisitions. A majority of the increase to our headcount occurred on July 2, 2012 as a result of hiring certain former employees of AboveNet.
Head count as of the end of the respective periods was:
| June 30, 2013 |
June 30, 2012 |
|||||||
| Physical Infrastructure |
584 | 225 | ||||||
| Lit Services |
546 | 275 | ||||||
| Other |
30 | — | ||||||
|
|
|
|
|
|||||
| Total |
1,160 | 500 | ||||||
|
|
|
|
|
|||||
Network Operations Expenses. Network operations expenses increased by $82.8 million, or 223%, from $37.1 million to $119.9 million for Fiscal 2012 and Fiscal 2013, respectively. The increase principally reflected the growth of our network assets and the related expenses of operating that expanded network. Our total network route miles increased approximately 63% from 46,504 miles at June 30, 2012 to 75,839 miles at June 30, 2013 (largely related to the acquisition of AboveNet). Also contributing to the increase was a one-time charge of $6.6 million related to lease termination costs associated with exit activities initiated for unutilized technical facilities space recognized during the fourth quarter of Fiscal 2013.
Other SG&A. Other SG&A expenses increased by $56.5 million, or 217%, from $26.0 million to $82.5 million for the Fiscal 2012 and Fiscal 2013, respectively. The increase was principally a result of additional expenses attributable to our Fiscal 2013 and Fiscal 2012 acquisitions. In addition, during the fourth quarter of Fiscal 2013, we recognized a one-time charge of $3.6 million related to lease termination costs associated with exit activities initiated for unutilized office space.
Transaction Costs. Transaction costs increased by $7.6 million, or 114%, from $6.6 million to $14.2 million for Fiscal 2012 and Fiscal 2013, respectively. This increase was primarily due to the AboveNet acquisition.
54
Table of Contents
Stock-Based Compensation. Stock-based compensation expenses increased by $79.6 million, or 303%, from $26.3 million to $105.8 million for Fiscal 2012 and Fiscal 2013, respectively. The stock-based compensation expense associated with the common units was impacted by both the estimated value of the common units and the number of common units vesting during the period. The following table reflects the estimated fair value of the common units during the relevant periods impacting the stock-based compensation expense for the years ended June 30, 2013 and 2012.
| Estimated fair value as of June 30, | ||||||||||||
| Common Units |
2013 | 2012 | 2011 | |||||||||
| Class A |
$ | 1.50 | $ | 0.92 | $ | 0.81 | ||||||
| Class B |
1.34 | 0.81 | 0.58 | |||||||||
| Class C |
1.14 | 0.68 | 0.33 | |||||||||
| Class D |
1.10 | 0.65 | 0.31 | |||||||||
| Class E |
0.95 | 0.55 | 0.23 | |||||||||
| Class F |
0.75 | 0.49 | n/a | |||||||||
| Class G |
0.46 | n/a | n/a | |||||||||
| Class H |
0.38 | n/a | n/a | |||||||||
| ZPS Class A |
0.20 | n/a | n/a | |||||||||
The increase in the value of the common units in the current period was primarily a result of our organic growth since June 30, 2012, cost synergies realized and expected to be realized from our prior acquisitions and a reduction to the discount rate utilized in the Company’s valuation of the common units resulting from our reduced financing costs.
We recognize changes in the fair value of the common units through increases or decreases in stock-based compensation expense and adjustments to the related stock-based compensation liability. The stock-based compensation liability associated with the common units was $159.3 million and $54.4 million as of June 30, 2013 and June 30, 2012, respectively. The liability was impacted by changes in the estimated value of the common units, number of vested common units, and distributions made to holders of the common units.
In December 2011, CII and the preferred unit holders of CII authorized a non-liquidating distribution to common unit holders of up to $10.0 million. The eligibility for receiving proceeds from the distribution was determined by the liquidation preference of the unit holder. Receiving proceeds from the authorized distribution was at the election of the common unit holder. As a condition of the early distribution, common unit holders electing to receive an early distribution received 85% of the amount that they would otherwise be entitled to receive if the distribution were in connection with a liquidating distribution. The common unit holders electing to receive the early distribution retained all of their common units and are entitled to receive future distributions only to the extent such future distributions are in excess of the non-liquidating distribution, excluding the 15% discount. During the year ended June 30, 2012, $8.8 million was distributed to CII’s common unit holders. Common unit holders electing to receive the early distribution forfeited $1.6 million in previously recognized stock-based compensation, which was recorded as a reduction to the stock-based compensation liability during the year ended June 30, 2012.
Depreciation and Amortization
Depreciation and amortization expense increased by $239.6 million, or 282%, from $85.0 million for Fiscal 2012 to $324.5 million for Fiscal 2013. The increase was a result of the substantial increase to our property and equipment and intangible assets since June 30, 2012, principally a result of our Fiscal 2012 and Fiscal 2013 acquisitions and capital expenditures since June 30, 2012.
55
Table of Contents
Total Other Expenses, Net
The table below sets forth the components of our total other expenses, net for the years ended June 30, 2013 and 2012.
| Year ended June 30, | ||||||||
| 2013 | 2012 | |||||||
| (in thousands) | ||||||||
| Interest expense |
$ | (202,464 | ) | $ | (50,720 | ) | ||
| Loss on extinguishment of debt |
(77,253 | ) | — | |||||
| Impairment of cost method investment |
— | (2,248 | ) | |||||
| Other income, net |
326 | 123 | ||||||
|
|
|
|
|
|||||
| Total other expenses, net |
$ | (279,391 | ) | $ | (52,845 | ) | ||
|
|
|
|
|
|||||
Interest expense. Interest expense increased by $151.7 million, or 299%, from $50.7 million to $202.5 million for Fiscal 2012 and Fiscal 2013, respectively. The increase was a result of our increased indebtedness during Fiscal 2013 as compared to Fiscal 2012, partially offset by a decrease in our weighted-average interest rate from Fiscal 2012 to Fiscal 2013.
Loss on extinguishment of debt. In connection with the repayment of our previously existing term loan and revolver and redemption of our $350.0 million outstanding aggregate principal amount of previously issued notes in July 2012 (the “Debt Refinancing Activities”) and the subsequent re-pricing transactions completed during the second and third quarters of Fiscal 2013 related to our Term Loan Facility and Revolver (the “Second and Fourth Amendments”), we recorded a loss on extinguishment of debt totaling $77.3 million during the year ended June 30, 2013. In connection with the Debt Refinancing Activities, discussed above, we recognized an expense of $65.0 million associated with debt extinguishment costs, including a cash expense of $39.8 million associated with the payment of early redemption fees on our previous indebtedness and non-cash expenses of $17.0 million associated with the write-off of our unamortized debt issuance costs and $8.1 million associated with the write off of the net unamortized discount on the extinguished debt balances. In connection with the Second and Fourth Amendments, we recognized a loss on extinguishment of debt of $12.3 million. The loss consisted of a cash expense of $3.3 million associated with the payment of an early call premium paid to certain creditors and other third party expenses and $9.0 million associated with the write-off of unamortized debt issuance costs and discounts.
Impairment of cost method investment. In connection with the October 1, 2010 acquisition of American Fiber Systems, we acquired an ownership interest in USCarrier. As of June 30, 2012, we owned 55% of the outstanding Class A membership units and 34% of the outstanding Class B membership units. On August 15, 2012, we entered into an agreement to acquire the remaining equity interest in USCarrier. As a result of certain disputes with the board of managers of USCarrier, we were unable to exercise control or significant influence over USCarrier’s operating and financial policies and as a result we accounted for this investment utilizing the cost method of accounting from the date of the AFS acquisition, at which time the investment was recorded at fair value, through June 30, 2012. Based upon the agreed upon purchase price of the remaining equity interests, we determined the fair value of our ownership interest in USCarrier as of June 30, 2012 to be $12.8 million and recognized an impairment of $2.2 million during the quarter ended June 30, 2012.
Provision for Income Taxes
We recorded a benefit for income taxes of $24.2 million during Fiscal 2013 as compared to a provision for income taxes of $26.9 million during Fiscal 2012. Our provision for income taxes included both the current and deferred provision for income tax expense resulting from timing differences between tax and financial reporting accounting bases. We were unable to combine our net operating losses (“NOLs”) for application to the income of our subsidiaries in some states and thus our state income tax expense was higher than the expected blended rate. During the year ended June 30, 2013, we dissolved certain acquired legal entities, which resulted in the loss of state NOLs that were generated by those entities. The loss of these NOLs resulted in an increase to the provision
56
Table of Contents
for income taxes of $2.8 million during the year ended June 30, 2013. In addition, as a result of our stock-based compensation and certain transaction costs not being deductible for income tax purposes, our effective tax rate was higher than the statutory rate. The following table reconciles our expected tax provision based on the statutory federal tax rate applied to our earnings before income taxes to our actual provision/(benefit) for income taxes:
| Year ended June 30, | ||||||||
| 2013 | 2012 | |||||||
| (in thousands) | ||||||||
| Expected provision at statutory rate |
$ | (59,469 | ) | $ | 5,941 | |||
| Increase due to: |
||||||||
| Non-deductible stock-based compensation |
35,879 | 8,685 | ||||||
| State income taxes, net of federal benefit |
(2,243 | ) | 4,855 | |||||
| Transactions costs not deductible for tax purposes |
1,257 | 1,416 | ||||||
| Foreign tax rate differential |
(2,264 | ) | — | |||||
| Change in uncertain tax positions |
— | 5,808 | ||||||
| Change in effective tax rate |
— | 459 | ||||||
| State NOL adjustment |
2,788 | — | ||||||
| Other, net |
(153 | ) | (293 | ) | ||||
|
|
|
|
|
|||||
| Provision/(benefit) for income taxes |
$ | (24,205 | ) | $ | 26,871 | |||
|
|
|
|
|
|||||
Year Ended June 30, 2012 Compared to the Year Ended June 30, 2011
Revenue
| Year ended June 30, | ||||||||||||||||
| 2012 | 2011 | $ Variance | % Variance | |||||||||||||
| (in thousands) | ||||||||||||||||
| Segment and consolidated revenue: | ||||||||||||||||
| Physical Infrastructure |
$ | 157,419 | $ | 110,868 | $ | 46,551 | 42 | % | ||||||||
| Lit Services |
224,624 | 176,367 | 48,257 | 27 | % | |||||||||||
| Corp/eliminations |
(6,517 | ) | (5,092 | ) | (1,425 | ) | 28 | % | ||||||||
|
|
|
|
|
|
|
|
|
|||||||||
| Consolidated |
$ | 375,526 | $ | 282,143 | $ | 93,383 | 33 | % | ||||||||
|
|
|
|
|
|
|
|
|
|||||||||
Our total revenue increased by $93.4 million, or 33%, from $282.1 million for Fiscal 2011 to $375.5 million for Fiscal 2012. The increase in revenue was driven by our organic growth as well as our Fiscal 2011 and Fiscal 2012 acquisitions.
We estimate that we achieved an organic growth rate from Fiscal 2011 to Fiscal 2012 of approximately 9%. Our organic growth was driven by installs exceeding churn in both periods, resulting from strong demand for bandwidth infrastructure services across our growing geographic coverage area. Further underlying revenue drivers during the period included:
| • | Bookings increased from $6.3 million to $8.5 million in MRR and MAR. This growth was driven by our expansion from a regional to national provider of bandwidth infrastructure, as well as from expanding into two new product areas – dark fiber and IP services. The total contract value associated with Fiscal 2012 bookings was approximately $650 million. |
| • | Installs also grew, increasing from $5.8 million to $7.4 million between the two periods. |
| • | The monthly churn percentage increased slightly between the two periods, from 1.2% to 1.3%, resulting in total churn increasing from $3.5 million to $4.9 million. |
57
Table of Contents
We estimate that the period-over-period acquisition-related revenue growth was approximately 24%. We completed two acquisitions in Fiscal 2011. The first, AGL, was completed on July 1, 2010, and was included in our results of operations for all of Fiscal 2011 and Fiscal 2012 and therefore was not a contributor to the year-over-year revenue growth. AGL was notable in that it represented the Company’s first substantive move into providing dark fiber as a product and was the catalyst for forming our Dark Fiber Strategic Product Group. American Fiber Systems was completed on October 1, 2010 and was included in our results of operations for nine months of Fiscal 2011. American Fiber Systems contributed many of the Western U.S. metro markets that the 360networks acquisition later connected. Of the three Fiscal 2012 acquisitions, the most significant contributor to revenue growth was the acquisition of 360networks on December 1, 2011. The acquisition of 360networks added substantial metro and regional network assets in the Western U.S.
Physical Infrastructure. Revenues from our Physical Infrastructure segment increased by $46.6 million, or 42%, from $110.9 million to $157.4 million for Fiscal 2011 and Fiscal 2012, respectively.
We estimate that organic revenue growth for the Physical Infrastructure segment was approximately 21%, highlighting our focus on the business and customers’ growing need for infrastructure solutions. Our dark fiber product experienced growth in Fiscal 2012, its second fiscal year after its launch following the AGL acquisition, and benefited from the increasing customer demand and the additional American Fiber Systems and 360networks fiber assets. Our FTT product was a contributor to organic growth as well, as we were awarded and delivered on multiple large FTT deployments. Our colocation product grew as a result of our MarquisNet acquisition in Las Vegas. Bookings of MRR and MAR in Fiscal 2012 were $5.3 million (with a total contract value of approximately $540 million), compared to $2.9 million in Fiscal 2011. Installs were $3.5 million in Fiscal 2012, an increase from $2.7 million in the prior year. The monthly churn percentage was constant at 1.1% during the two periods, as total churn grew from $1.2 million to $1.7 million, in line with revenue growth. All of the Fiscal 2011 and Fiscal 2012 acquisitions impacted the Physical Infrastructure business, with AGL (dark fiber) and MarquisNet (colocation) being exclusively Physical Infrastructure transactions.
Lit Services. Revenues from our Lit Services segment increased by $48.3 million, or 27%, from $176.4 million to $224.6 million for Fiscal 2011 and Fiscal 2012, respectively.
We estimate that organic revenue growth for the Lit Services segment was approximately 3%. Demand for Lit Services continued to grow, supported by new metro and regional networks and routes as well as enhanced Ethernet and IP capabilities that were acquired through the 360networks transaction. Our wavelengths product performed strongly as customers increasingly sought out higher bandwidth solutions. Bookings in Fiscal 2012 were $3.2 million (with approximately $110 million in total contract value) versus $3.4 million in the prior fiscal year (boosted by a large individual sale). Installs were $3.9 million in Fiscal 2012, compared to $3.1 million in the prior fiscal year. The monthly churn percentage increased from 1.3% to 1.5% over the two periods, resulting in total churn of $3.3 million, compared to $2.4 million in the prior fiscal year. 360networks was the most significant acquisition in Fiscal 2012, contributing a material amount of wavelength, Ethernet and IP services revenue to the Lit Services segment.
Other. We did not operate any businesses or have any financial results in our Other segment during these periods.
58
Table of Contents
Other revenue increased as a percentage of total revenue over the two years primarily as a result of an increase in early termination related revenue. The following table reflects the stratification of our revenues during these periods. The substantial majority of our revenue continued to come from recurring payments from customers under contractual arrangements (MRR).
| Year ended June 30, | ||||||||||||||||
| 2012 | 2011 | |||||||||||||||
| (in thousands) | ||||||||||||||||
| Monthly recurring revenue |
$ | 350,900 | 93 | % | $ | 269,170 | 95 | % | ||||||||
| Monthly amortized revenue |
13,785 | 4 | % | 8,976 | 3 | % | ||||||||||
| Other revenue |
10,841 | 3 | % | 3,997 | 2 | % | ||||||||||
|
|
|
|
|
|
|
|
|
|||||||||
| Total revenue |
$ | 375,526 | 100 | % | $ | 282,143 | 100 | % | ||||||||
|
|
|
|
|
|
|
|
|
|||||||||
Operating Costs, Excluding Depreciation and Amortization
| Year ended June 30, | ||||||||||||||||
| 2012 | 2011 | $ Variance | % Variance | |||||||||||||
| (in thousands) | ||||||||||||||||
| Segment and consolidated operating costs, excluding depreciation and amortization: | ||||||||||||||||
| Physical Infrastructure |
$ | 21,677 | $ | 18,002 | $ | 3,675 | 20 | % | ||||||||
| Lit Services |
60,899 | 49,920 | 10,979 | 22 | % | |||||||||||
| Other |
||||||||||||||||
| Corp/eliminations |
(493 | ) | 3,056 | (3,549 | ) | (116 | %) | |||||||||
|
|
|
|
|
|
|
|
|
|||||||||
| Consolidated |
$ | 82,083 | $ | 70,978 | $ | 11,105 | 16 | % | ||||||||
|
|
|
|
|
|
|
|
|
|||||||||
| As a percentage of revenue |
22 | % | 25 | % | ||||||||||||
Our operating costs, excluding depreciation and amortization, increased by $11.1 million, or 16% from $71.0 million for Fiscal 2011 to $82.1 million for Fiscal 2012. The increase in consolidated operating costs primarily related to additional network costs incurred in order to support new customer contracts entered into subsequent to June 30, 2011 and additional costs assumed from our Fiscal 2011 and Fiscal 2012 acquisitions. Operating costs as a percentage of total revenue decreased from 25% to 22% as incremental revenue typically had less third-party network service cost associated with it than the existing base of revenue. We also benefited from operating cost savings as planned network-related cost synergies from prior acquisitions were realized.
Physical Infrastructure. Physical Infrastructure operating costs increased by $3.7 million, or 20%, from $18.0 million to $21.7 million for the years ended June 30, 2011 and 2012, respectively.
Lit Services. Lit Services operating costs increased by $11.0 million, or 22%, from $49.9 million to $60.9 million for the years ended June 30, 2011 and 2012, respectively.
59
Table of Contents
Selling, General and Administrative Expenses
The table below sets forth the components of our SG&A expenses during the years ended June 30, 2012 and 2011.
| Year ended June 30, | ||||||||||||||||
| 2012 | 2011 | $ Variance | % Variance | |||||||||||||
| (in thousands) | ||||||||||||||||
| Compensation and benefits expenses |
$ | 47,102 | $ | 39,640 | $ | 7,462 | 19 | % | ||||||||
| Network operations expenses |
37,097 | 27,560 | 9,537 | 35 | % | |||||||||||
| Other SG&A expenses |
21,581 | 20,349 | 1,232 | 6 | % | |||||||||||
| Transaction costs |
6,630 | 865 | 5,765 | 666 | % | |||||||||||
| Stock-based compensation |
26,253 | 24,310 | 1,943 | 8 | % | |||||||||||
|
|
|
|
|
|
|
|
|
|||||||||
| Total SG&A expenses |
$ | 138,663 | $ | 112,724 | $ | 25,939 | 23 | % | ||||||||
|
|
|
|
|
|
|
|
|
|||||||||
| As a percentage of revenue |
37 | % | 40 | % | ||||||||||||
| As a percentage of revenue, excluding stock-based compensation |
30 | % | 31 | % | ||||||||||||
Compensation and Benefits Expenses. Compensation and benefits expenses increased by $7.5 million, or 19%, from $39.6 million to $47.1 million for Fiscal 2011 and Fiscal 2012, respectively.
The increase in compensation and benefits reflected the increased number of employees, the largest component of which resulted from our acquisition of 360networks. Also contributing to the increase in compensation and benefits expenses was the increase in bonus payouts from approximately 100% of target in Fiscal 2011 to approximately 140% of target in Fiscal 2012.
Headcount as of the end of the respective periods was:
| June 30, 2012 |
June 30, 2011 |
|||||||
| Physical Infrastructure |
225 | 158 | ||||||
| Lit Services |
275 | 238 | ||||||
| Other |
— | — | ||||||
|
|
|
|
|
|||||
| Total |
500 | 396 | ||||||
|
|
|
|
|
|||||
Network Operations Expenses. Network operations expenses increased by $9.5 million, or 35%, from $27.6 million to $37.1 million for Fiscal 2011 and Fiscal 2012, respectively. The increase principally reflected the growth of our network assets and the related expenses of operating that expanded network. Our total network route miles increased approximately 92% from 24,251 miles at June 30, 2011 to 46,504 miles at June 30, 2012.
Other SG&A. Other SG&A expenses increased by $1.2 million, or 6%, from $20.3 million to $21.6 million for Fiscal 2011 and Fiscal 2012, respectively. The increase in other SG&A was primarily due to additional expenses associated with our acquisitions of 360networks and MarquisNet.
Transaction Costs. Transaction costs increased during Fiscal 2012 by $5.8 million as a result of costs associated with our acquisitions of 360networks, MarquisNet, Arialink, AboveNet, FiberGate, and USCarrier.
Stock-Based Compensation. Stock-based compensation expense increased by $1.9 million, or 8%, from $24.3 million to $26.3 million for Fiscal 2011 and Fiscal 2012, respectively.
60
Table of Contents
The stock-based compensation expense associated with the common units is impacted by both the estimated value of the common units and the number of common units vesting during the period. During the year ended June 30, 2012, an additional 9.4 million units vested as compared to the year ended June 30, 2011. The following table reflects the estimated fair value of the common units during the relevant periods impacting the stock-based compensation expense for the years ended June 30, 2012 and 2011.
| Estimated fair value as of June 30, | ||||||||||||
| Common Units of CII |
2012 | 2011 | 2010 | |||||||||
| Class A |
$ | 0.92 | $ | 0.81 | $ | 0.49 | ||||||
| Class B |
0.81 | 0.58 | 0.28 | |||||||||
| Class C |
0.68 | 0.33 | 0.03 | |||||||||
| Class D |
0.65 | 0.31 | n/a | |||||||||
| Class E |
0.55 | 0.23 | n/a | |||||||||
| Class F |
0.49 | n/a | n/a | |||||||||
Depreciation and Amortization
Depreciation and amortization expense increased by $24.5 million, or 41%, from $60.5 million for Fiscal 2011 to $85.0 million for Fiscal 2012. The increase was a result of the substantial increase to our property and equipment and intangible assets since June 30, 2011, principally a result of capital expenditures since June 30, 2011 and the increase to our property and equipment and intangible asset balance due to the American Fiber Systems acquisition on October 1, 2010, the 360networks acquisition on December 1, 2011, the Marquisnet acquisition on December 31, 2011, and the Arialink acquisition on May 1, 2012.
Total Other Expenses, Net
The table below sets forth the components of our total other expenses, net for the years ended June 30, 2012 and 2011.
| Year ended June 30, | ||||||||
| 2012 | 2011 | |||||||
| (in thousands) | ||||||||
| Interest expense |
$ | (50,720 | ) | $ | (33,414 | ) | ||
| Impairment of cost method investment |
(2,248 | ) | — | |||||
| Other income (expense), net |
123 | (126 | ) | |||||
|
|
|
|
|
|||||
| Total other expenses, net |
$ | (52,845 | ) | $ | (33,540 | ) | ||
|
|
|
|
|
|||||
Interest Expense. Interest expense increased by $17.3 million, or 52%, from $33.4 million to $50.7 million for Fiscal 2011 and Fiscal 2012, respectively. The increase was a result of our increased indebtedness during the year ended June 30, 2012 as compared to the year ended June 30, 2011. In connection with the 360networks acquisition, we entered into a $315.0 million term loan agreement on December 1, 2011, which accrued interest during the period at 7.0%. During the quarter ended March 31, 2012, we borrowed an additional $30.0 million against our then-existing revolving credit facility, which accrued interest at a floating rate ranging from 4.0% to 4.75% during the period.
Impairment of cost method investment. In connection with the American Fiber Systems acquisition, we acquired an ownership interest in USCarrier. As of June 30, 2012, we owned 55% of the outstanding Class A membership units and 34% of the outstanding Class B membership units. On August 15, 2012, we entered into an agreement to acquire the remaining equity interest in USCarrier. As a result of certain disputes with the board of managers of USCarrier, we were unable to exercise control or significant influence over USCarrier’s operating and financial policies and so we accounted for this investment utilizing the cost method of accounting from the date of the AFS acquisition, at which time the investment was recorded at fair value, through June 30, 2012. Based upon the agreed upon purchase price of the remaining equity interests, we determined the fair value of our ownership interest in USCarrier as of June 30, 2012 to be $12.8 million, and recognized an impairment of $2.2 million during the quarter ended June 30, 2012.
61
Table of Contents
Provision for Income Taxes
Income tax expense increased over the prior year by $15.6 million, from $11.3 million for Fiscal 2011 to $26.9 million for Fiscal 2012. Our provision for income taxes included both the current provision and a provision for deferred income tax expense resulting from timing differences between tax and financial reporting accounting bases. We were unable to combine our net operating losses (“NOLs”) for application to the income of our subsidiaries in some states and thus our state income tax expense was higher than the expected blended rate. In addition, as a result of our stock-based compensation and certain transaction costs not being deductible for income tax purposes, our effective tax rate was higher than the statutory rate.
The following table reconciles an expected tax provision based on a statutory federal tax rate applied to our earnings before income tax to our actual provision for income taxes.
| Year ended June 30, | ||||||||
| 2012 | 2011 | |||||||
| Expected provision at statutory rate |
$ | 5,941 | $ | 1,505 | ||||
| Increase due to: |
||||||||
| Non-deductible stock-based compensation |
8,685 | 7,824 | ||||||
| State income taxes, net of federal benefit |
4,855 | 1,412 | ||||||
| Transactions costs not deductible for tax purposes |
1,416 | 294 | ||||||
| Provision for uncertain tax provisions, net |
5,808 | — | ||||||
| Change in effective tax rate |
459 | — | ||||||
| Other, net |
(293 | ) | 294 | |||||
|
|
|
|
|
|||||
| Provision for income taxes |
$ | 26,871 | $ | 11,329 | ||||
|
|
|
|
|
|||||
Adjusted EBITDA
We define Adjusted EBITDA as earnings from continuing operations before interest, income taxes, depreciation and amortization (“EBITDA”) adjusted to exclude acquisition-related transaction costs, losses on extinguishment of debt, stock-based compensation, unrealized foreign currency translation gains on an intercompany loan, and impairment of cost method investment. We use Adjusted EBITDA to evaluate operating performance, and this financial measure is among the primary measures used by management for planning and forecasting for future periods. We believe that the presentation of Adjusted EBITDA is relevant and useful for investors because it allows investors to view results in a manner similar to the method used by management and facilitates comparison of our results with the results of other companies that have different financing and capital structures.
We also monitor Adjusted EBITDA because our subsidiaries have debt covenants that restrict their borrowing capacity that are based on a leverage ratio, which utilizes a modified EBITDA, as defined in our Credit Agreement and Indenture. The modified EBITDA is consistent with our definition of Adjusted EBITDA; however, it includes the pro forma Adjusted EBITDA of and expected cost synergies from the companies acquired by us during the quarter for which the debt compliance certification is due.
Adjusted EBITDA results, along with other quantitative and qualitative information, are also utilized by management and our compensation committee for purposes of determining bonus payouts to employees.
Adjusted EBITDA has limitations as an analytical tool and should not be considered in isolation from, or as a substitute for, analysis of our results from operations and operating cash flows as reported under GAAP. For example, Adjusted EBITDA:
| • | does not reflect capital expenditures, or future requirements for capital and major maintenance expenditures or contractual commitments; |
62
Table of Contents
| • | does not reflect changes in, or cash requirements for, our working capital needs; |
| • | does not reflect the significant interest expense, or the cash requirements necessary to service the interest payments, on our debt; and |
| • | does not reflect cash required to pay income taxes. |
Our computation of Adjusted EBITDA may not be comparable to other similarly titled measures computed by other companies because all companies do not calculate Adjusted EBITDA in the same fashion.
Reconciliations from segment and consolidated Adjusted EBITDA to net earnings/(loss) are as follows:
Reconciliation from segment and consolidated Adjusted EBITDA to net earnings/(loss)
| Nine months ended March 31, 2014 | ||||||||||||||||||||
| Physical Infrastructure |
Lit Services | Other | Corp/ eliminations |
Total | ||||||||||||||||
| Segment and consolidated Adjusted EBITDA |
$ | 237.1 | $ | 244.7 | $ | 5.6 | $ | (4.8 | ) | $ | 482.6 | |||||||||
| Interest expense |
(90.2 | ) | (60.7 | ) | — | — | (150.9 | ) | ||||||||||||
| Depreciation and amortization expense |
(149.3 | ) | (95.9 | ) | (1.7 | ) | — | (246.9 | ) | |||||||||||
| Transaction costs |
(0.6 | ) | (0.1 | ) | — | — | (0.8 | ) | ||||||||||||
| Stock-based compensation |
(115.3 | ) | (49.1 | ) | (0.7 | ) | — | (165.1 | ) | |||||||||||
| Loss on extinguishment of debt |
(1.1 | ) | (0.8 | ) | — | — | (1.9 | ) | ||||||||||||
| Unrealized foreign currency translation gains |
— | — | — | 0.9 | 0.9 | |||||||||||||||
|
|
|
|
|
|
|
|
|
|
|
|||||||||||
| Net earnings/(loss) from continuing operations before provision for income taxes |
$ | (119.4 | ) | $ | 38.0 | $ | 3.1 | $ | (3.8 | ) | $ | (82.1 | ) | |||||||
| Provision for income taxes |
— | — | — | (27.2 | ) | (27.2 | ) | |||||||||||||
| Earnings from discontinued operations, net of income taxes |
— | — | — | 3.7 | 3.7 | |||||||||||||||
| Net earnings/(loss) |
$ | (119.4 | ) | $ | 38.0 | $ | 3.1 | $ | (27.4 | ) | $ | (105.6 | ) | |||||||
|
|
|
|
|
|
|
|
|
|
|
|||||||||||
| Nine months ended March 31, 2013 | ||||||||||||||||||||
| Physical Infrastructure |
Lit Services | Other | Corp/ eliminations |
Total | ||||||||||||||||
| Segment and consolidated Adjusted EBITDA |
$ | 205.5 | $ | 207.3 | $ | 4.6 | $ | (4.8 | ) | $ | 412.6 | |||||||||
| Earnings from discontinued operations, net of income taxes |
— | — | — | (7.5 | ) | (7.5 | ) | |||||||||||||
| Interest expense |
(96.8 | ) | (68.0 | ) | — | — | (164.8 | ) | ||||||||||||
| Provision for income taxes |
— | — | — | (33.5 | ) | (33.5 | ) | |||||||||||||
| Depreciation and amortization expense |
(135.9 | ) | (106.6 | ) | (1.4 | ) | — | (243.9 | ) | |||||||||||
| Transaction costs |
(6.7 | ) | (6.4 | ) | — | — | (13.1 | ) | ||||||||||||
| Stock-based compensation |
(29.9 | ) | (37.5 | ) | (0.5 | ) | — | (67.9 | ) | |||||||||||
| Loss on extinguishment of debt |
(45.1 | ) | (32.2 | ) | — | — | (77.3 | ) | ||||||||||||
| Unrealized foreign currency translation gains |
— | — | — | — | — | |||||||||||||||
|
|
|
|
|
|
|
|
|
|
|
|||||||||||
| Net earnings/(loss) from continuing operations before provision for income taxes |
$ | (108.8 | ) | $ | (43.4 | ) | $ | 2.7 | $ | (4.8 | ) | $ | (154.3 | ) | ||||||
| Benefit for income taxes |
— | — | — | 33.5 | 33.5 | |||||||||||||||
| Earnings from discontinued operations, net of income taxes |
— | — | — | 7.5 | 7.5 | |||||||||||||||
| Net earnings/(loss) |
$ | (108.8 | ) | $ | (43.4 | ) | $ | 2.6 | $ | 36.2 | $ | (113.3 | ) | |||||||
|
|
|
|
|
|
|
|
|
|
|
|||||||||||
63
Table of Contents
| For the year ended June 30, 2013 | ||||||||||||||||||||
| Physical Infrastructure |
Lit Services | Other | Corp/ eliminations |
Total | ||||||||||||||||
| (in millions) | ||||||||||||||||||||
| Segment and consolidated Adjusted EBITDA |
$ | 275.7 | $ | 277.9 | $ | 6.2 | $ | (5.3 | ) | $ | 554.4 | |||||||||
| Interest expense |
(119.0 | ) | (83.5 | ) | — | — | (202.5 | ) | ||||||||||||
| Depreciation and amortization expense |
(183.6 | ) | (139.1 | ) | (1.9 | ) | — | (324.5 | ) | |||||||||||
| Transaction costs |
(7.2 | ) | (7.0 | ) | — | — | (14.2 | ) | ||||||||||||
| Stock-based compensation |
(46.4 | ) | (58.7 | ) | (0.8 | ) | — | (105.8 | ) | |||||||||||
| Loss on extinguishment of debt |
(45.1 | ) | (32.2 | ) | — | — | (77.3 | ) | ||||||||||||
| Unrealized foreign currency translation gains |
— | — | — | 0.1 | 0.1 | |||||||||||||||
|
|
|
|
|
|
|
|
|
|
|
|||||||||||
| Net earnings/(loss) from continuing operations before benefit for income taxes |
$ | (125.5 | ) | $ | (42.6 | ) | $ | 3.5 | $ | (5.2 | ) | $ | (169.8 | ) | ||||||
| Benefit for income taxes |
— | — | — | 24.2 | 24.2 | |||||||||||||||
| Earnings from discontinued operations, net of income taxes |
— | — | — | 8.4 | 8.4 | |||||||||||||||
| Net earnings/(loss) |
$ | (125.5 | ) | $ | (42.6 | ) | $ | 3.5 | $ | 27.4 | $ | (137.2 | ) | |||||||
|
|
|
|
|
|
|
|
|
|
|
|||||||||||
| For the year ended June 30, 2012 | ||||||||||||||||||||
| Physical Infrastructure |
Lit Services | Other | Corp/ eliminations |
Total | ||||||||||||||||
| (in millions) | ||||||||||||||||||||
| Segment and consolidated Adjusted EBITDA |
$ | 101.1 | $ | 92.1 | $ | — | $ | (5.4 | ) | $ | 187.8 | |||||||||
| Interest expense |
(23.2 | ) | (27.5 | ) | — | — | (50.7 | ) | ||||||||||||
| Depreciation and amortization expense |
(38.5 | ) | (46.4 | ) | — | — | (85.0 | ) | ||||||||||||
| Transaction costs |
(2.2 | ) | (4.4 | ) | — | — | (6.6 | ) | ||||||||||||
| Impairment of cost method investment |
— | (2.2 | ) | — | — | (2.2 | ) | |||||||||||||
| Stock-based compensation |
(13.6 | ) | (12.7 | ) | — | — | (26.3 | ) | ||||||||||||
|
|
|
|
|
|
|
|
|
|
|
|||||||||||
| Net earnings/(loss) from continuing operations before provision for income taxes |
$ | 23.5 | $ | (1.1 | ) | $ | — | $ | (5.4 | ) | $ | 17.0 | ||||||||
| Provision for income taxes |
— | — | — | (26.9 | ) | (26.9 | ) | |||||||||||||
| Earnings from discontinued operations, net of income taxes |
— | — | — | 8.7 | 8.7 | |||||||||||||||
| Net earnings/(loss) |
$ | 23.5 | $ | (1.1 | ) | $ | — | $ | (23.6 | ) | $ | (1.2 | ) | |||||||
|
|
|
|
|
|
|
|
|
|
|
|||||||||||
| For the year ended June 30, 2011 | ||||||||||||||||||||
| Physical Infrastructure |
Lit Services | Other | Corp/ eliminations |
Total | ||||||||||||||||
| (in millions) | ||||||||||||||||||||
| Segment and consolidated Adjusted EBITDA |
$ | 60.4 | $ | 66.4 | $ | — | $ | (3.3 | ) | $ | 123.5 | |||||||||
| Earnings from discontinued operations, net of income taxes |
— | — | — | (5.3 | ) | (5.3 | ) | |||||||||||||
| Interest expense |
(15.1 | ) | (18.3 | ) | — | — | (33.4 | ) | ||||||||||||
| Provision for income taxes |
— | — | — | 11.3 | 11.3 | |||||||||||||||
| Depreciation and amortization expense |
(24.5 | ) | (35.9 | ) | — | — | (60.5 | ) | ||||||||||||
| Transaction costs |
(0.2 | ) | (0.6 | ) | — | — | (0.9 | ) | ||||||||||||
| Stock-based compensation |
(8.3 | ) | (16.0 | ) | — | — | (24.3 | ) | ||||||||||||
|
|
|
|
|
|
|
|
|
|
|
|||||||||||
| Net earnings/(loss) from continuing operations before provision for income taxes |
$ | 12.2 | $ | (4.5 | ) | $ | — | $ | (3.3 | ) | $ | 4.4 | ||||||||
| Provision for income taxes |
— | — | — | (11.3 | ) | (11.3 | ) | |||||||||||||
| Earnings from discontinued operations, net of income taxes |
— | — | — | 5.3 | 5.3 | |||||||||||||||
| Net earnings/(Loss) |
$ | 12.2 | $ | (4.5 | ) | $ | — | $ | (9.3 | ) | $ | (1.6 | ) | |||||||
|
|
|
|
|
|
|
|
|
|
|
|||||||||||
64
Table of Contents
Liquidity and Capital Resources
Our primary sources of liquidity have been cash provided by operations, equity contributions, and incurrence of debt. Our principal uses of cash have been for acquisitions, capital expenditures, and debt service requirements. See “—Cash Flows,” below. We anticipate that our principal uses of cash in the future will be for acquisitions, capital expenditures, working capital, and debt service.
We have financial covenants under the Indentures governing our Notes and our Credit Agreement that, under certain circumstances, restrict our ability to incur additional indebtedness. The Indentures governing our Notes limit any increase in our secured indebtedness (other than certain forms of secured indebtedness expressly permitted under the Indentures) to a pro forma secured debt ratio of 4.5 times our previous quarter’s annualized modified EBITDA and limit our incurrence of additional indebtedness to a total indebtedness ratio of 5.25 times our previous quarter’s annualized modified EBITDA. The Credit Agreement similarly limits our incurrence of additional indebtedness. See Note 9—Long Term Debt—Debt Covenants to our audited consolidated financial statements for more information on our financial covenants.
As of March 31, 2014, we had $254.6 million in cash and cash equivalents and a working capital surplus of $174.9 million. Cash and cash equivalents consist of amounts held in bank accounts and highly-liquid U.S. treasury money market funds. Additionally, as of March 31, 2014, we had $243.6 million available under our Revolver.
Our capital expenditures, net of stimulus grants, increased by $199.1 million, or 160.4%, during the year ended June 30, 2013 as compared to the year ended June 30, 2012, from $124.1 million to $323.2 million, respectively. Our capital expenditures, net of stimulus grants, increased by $44.6 million, or 20%, for the nine months ended March 31, 2013 to the nine months ended March 31, 2014, from $221.3 million to $265.9 million. The increase in capital expenditures is a result of meeting the needs of our larger customer base resulting from our acquisitions and organic growth. We expect to continue to invest in our network for the foreseeable future. These capital expenditures, however, are expected to primarily be success-based; that is, in most situations, we will not invest the capital until we have an executed customer contract that supports the investment.
As part of our corporate strategy, we continue to be regularly involved in discussions regarding potential acquisitions of companies and assets. We expect to fund such acquisitions with cash from operations, debt (including available borrowings under our $250.0 million Revolver), equity contributions, and available cash on hand.
Cash Flows
We believe that our cash flow from operating activities, in addition to cash and cash equivalents currently on-hand, will be sufficient to fund our operating activities and capital expenditures for the foreseeable future, and in any event for at least the next 12 to 18 months. Given the generally volatile global economic climate, no assurance can be given that this will be the case.
We regularly consider acquisitions and additional strategic opportunities, including large acquisitions, which may require additional debt or equity financing.
The following table sets forth the components of our cash flow for the nine months ended March 31, 2014 and 2013 and the years ended June 30, 2013, 2012, and 2011.
| Nine Months Ended March 31, | Year Ended June 30, | |||||||||||||||||||
| 2014 | 2013 | 2013 | 2012 | 2011 | ||||||||||||||||
| (In thousands) |
||||||||||||||||||||
| Net cash provided by operating activities from continuing operations |
$ | 401,321 | $ | 268,265 | $ | 404,883 | $ | 167,630 | $ | 99,502 | ||||||||||
| Net cash used in investing activities from continuing operations |
(366,881 | ) | (2,695,003 | ) | (2,803,970 | ) | (475,410 | ) | (296,162 | ) | ||||||||||
| Net cash provided by financing activities from continuing operations |
128,396 | 2,346,803 | 2,340,029 | 433,079 | 134,190 | |||||||||||||||
65
Table of Contents
Cash Flows from Operating Activities from Continuing Operations
Net cash flows from operating activities increased by $133.0 million, or 50%, from $268.3 million to $401.3 million during the nine months ended March 31, 2013 and 2014, respectively.
Net cash flows from operating activities during the nine months ended March 31, 2014 represents the loss from continuing operations of $109.3 million, plus the add backs of non-cash items deducted in the determination of net loss, principally depreciation and amortization of $246.9 million, loss on extinguishment of debt of $1.9 million, stock-based compensation expense of $165.1 million, provision for bad debts of $1.6 million, additions to deferred revenue of $112.6 million, non-cash interest expense of $14.9 million and change in the deferred tax provision of $27.0 million, less amortization of deferred revenue of $40.6 million, minus the net change in working capital components.
Net cash flows from operating activities during the nine months ended March 31, 2013 represents our net loss from continuing operations of $120.8 million, plus the add back to our net loss of non-cash items deducted in the determination of net loss, principally depreciation and amortization of $243.9 million, loss on extinguishment of debt of $77.3 million, non-cash interest expense of $18.6 million, additions to deferred revenue of $27.2 million, provision for bad debts of $1.7 million, and non-cash stock-based compensation expense of $67.9 million, less amortization of deferred revenue of $30.7 million and change in the deferred tax provision of $32.3 million, plus the change in working capital components.
The increase in net cash flows from operating activities during the nine months ended March 31, 2014 as compared to the nine months ended March 31, 2013 is primarily a result of additional earnings from our organic growth, cost synergies realized from our acquisitions and interest expense savings from our refinancings.
Net cash flows from operating activities increased by $237.3 million, or 141%, from $167.6 million to $404.9 million during Fiscal 2012 and Fiscal 2013, respectively. Net cash flows from operating activities increased by $68.1 million, or 68%, from $99.5 million to $167.6 million during Fiscal 2011 and Fiscal 2012, respectively.
Net cash flows from operating activities during the year ended June 30, 2013 represents the loss from continuing operations of $145.6 million, plus the add backs of non-cash items deducted in the determination of net loss, principally depreciation and amortization of $324.5 million, stock-based compensation expense of $105.8 million, losses on extinguishment of debt of $77.3 million, additions to deferred revenue of $61.7 million and non-cash interest expense of $12.3 million, less amortization of deferred revenue of $43.1 million and the change in deferred tax provision of $27.8 million, plus the net change in working capital components.
Net cash flows from operating activities during the year ended June 30, 2012 represents our net loss from continuing operations of $9.9 million, plus the add back to our net loss of non-cash items deducted in the determination of net loss, principally depreciation and amortization of $85.0 million, additions to deferred revenue of $55.0 million, non-cash interest expense of $4.8 million, the change in deferred tax provision of $28.4 million and non-cash stock-based compensation expense of $26.3 million, less amortization of deferred revenue of $13.8 million, minus the change in working capital components.
Net cash flows from operating activities during the year ended June 30, 2011 represents our loss from continuing operations of $6.9 million, plus the add backs of non-cash items deducted in the determination of net loss, principally depreciation and amortization of $60.5 million, the deferred tax provision of $12.3 million and non-cash stock-based compensation expense of $24.3 million, less amortization of deferred revenue of $9.0 million, plus the net change in working capital components.
The increase in net cash flows from operating activities during the year ended June 30, 2013 as compared to the year ended June 30, 2012 and the year ended June 30, 2012 as compared to the year ended June 30, 2011, is primarily a result of additional earnings from our organic growth and cost synergies realized from our acquisitions.
66
Table of Contents
The increase in net cash flows from operating activities during the year ended June 30, 2012 as compared to the year ended June 30, 2011 is primarily a result of additional earnings and cost synergies realized from our acquisitions of AGL Networks, AFS, 360networks, Arialink, and MarquisNet and organic growth.
Cash Flows from Investing Activities from Continuing Operations
We used cash in investing activities of $366.9 million and $2,695.0 million during the nine months ended March 31, 2014 and 2013, respectively.
During the nine months ended March 31, 2014, our principal uses of cash for investing activities were $265.9 million in additions to property and equipment, $0.3 million for Corelink, $40.1 million for the acquisition of Access, $43.1 million for the acquisition of FiberLink, and $17.5 million for the acquisition of CoreXchange.
During the nine months ended March 31, 2013, our principal uses of cash for investing activities were $2,210.0 million for the acquisition of AboveNet, $118.3 million for the acquisition of FiberGate, $16.1 million for the acquisition of USCarrier, $109.7 million for the acquisition of First Telecom, $22.2 million for the acquisition of Litecast, and $221.3 million in additions to property and equipment, net of stimulus grant reimbursements. Partially offsetting the net cash used in investing activities during the nine months ended March 31, 2013 was purchase consideration of $2.7 million returned from our acquisitions of MarquisNet and Arialink.
We used cash in investing activities of $2,804.0 million, $475.4 million and $296.2 million during the years ended June 30, 2013, 2012 and 2011, respectively.
During the year ended June 30, 2013, our principal uses of cash for investing activities were $2,210.0 million for the acquisition of AboveNet, $118.3 million for the acquisition of FiberGate, $16.1 million for the acquisition of USCarrier, $109.7 million for the acquisition of First Telecom, $22.2 million for the acquisition of Litecast, $7.1 million for the acquisition of Core NAP, and $323.2 million in additions to property and equipment, net of stimulus grant reimbursements. Partially offsetting the net cash used in investing activities during the year ended June 30, 2013 was purchase consideration of $2.7 million returned from our acquisitions of MarquisNet and Arialink.
During the year ended June 30, 2012, our principal uses of cash for investing activities were $317.9 million for the acquisition of 360networks, $15.5 million for our acquisition of MarquisNet, $17.9 million for the acquisition of Arialink, and $124.1 million in additions to property and equipment, net of stimulus grant reimbursements.
During the year ended June 30, 2011, our principal uses of cash in investing activities were our $73.7 million purchase of AGL Networks, our $110.0 million acquisition of AFS, and $112.5 million in additions to property and equipment, net of stimulus grant reimbursements.
Cash Flows from Financing Activities from Continuing Operations
Our net cash provided by financing activities was $2,346.8 million during the nine months ended March 31, 2013 and net cash provided by financing activities was $128.4 million during the nine-months ended March 31, 2014.
Our cash flows from financing activities during the nine months ended March 31, 2014 primarily consist of $150.0 million from the proceeds of long-term borrowings. This cash inflow was partially offset by $12.9 million in principal payments on long-term debt, $6.9 million in principal repayments on capital lease obligations, $0.1 million in distributions to CII, and $1.7 million in payments of deferred debt issuance costs during the nine months ended March 31, 2014.
Our cash flows from financing activities during the nine months ended March 31, 2013 consist of $3,188.0 million from the proceeds from long-term borrowings, $342.8 million in equity contributions from CII, and a $22.7 million net transfers out of restricted cash accounts. This cash inflow was partially offset by $83.0 million
67
Table of Contents
in debt issuance costs, $1,050.5 million in principal repayments on long-term debt, $72.1 million in payments of early redemption fees on debt extinguished, and $1.1 million in principal payments on capital leases during the period.
Our net cash provided by financing activities was $2,340.0 million, $433.1 million and $134.2 million during the years ended June 30, 2013, 2012, and 2011, respectively.
Our cash flows from financing activities during the year ended June 30, 2013 primarily consist of $3,189.3 million from the proceeds from long-term debt, $343.8 million in equity contributions from CII and $22.7 million in net transfers of cash out of restricted cash accounts. These cash inflows were partially offset by $83.1 million in debt issuance costs, $1,058.6 million in principal repayments on long-term debt obligations, $72.1 million in early redemption fees on debt extinguishments, and $1.9 million in principal payments on capital leases during the year ended June 30, 2013.
Our cash flows from financing activities during the year ended June 30, 2012 consist of $335.6 million from the proceeds from long-term borrowings, and $134.8 million in equity contributions from CII. This cash inflow was partially offset by $11.7 million in debt issuance costs, $1.6 million in principal repayments on long-term debt obligations, $22.8 million in net transfers of cash to restricted cash accounts, and $1.2 million in principal payments on capital leases during Fiscal 2012.
Our cash flows from financing activities during the year ended June 30, 2011 primarily comprise $103.0 million in cash proceeds from our September 2010 notes offering and $36.5 million in equity contributions from CII. These cash inflows were offset by $4.1 million in deferred financing costs and $1.7 million in principal payments on capital leases during the Fiscal 2011.
Contractual Cash Obligations
The following table represents a summary of our estimated future payments under contractual cash obligations for continuing operations as of June 30, 2013. Changes in our business needs, cancellation provisions, changing interest rates and other factors may result in actual payments differing from these estimates. We cannot provide certainty regarding the timing and amounts of these future payments.
| Total | Less Than 1 Year |
1-3 Years | 3-5 Years | More Than 5 Years |
||||||||||||||||
| (in thousands) | ||||||||||||||||||||
| Long-term debt (principal and interest) |
$ | 4,052,464 | $ | 203,849 | $ | 407,854 | $ | 402,432 | $ | 3,038,329 | ||||||||||
| Operating leases |
523,773 | 85,441 | 122,965 | 91,447 | 223,920 | |||||||||||||||
| Purchase commitments |
93,164 | 93,164 | — | — | — | |||||||||||||||
| Capital leases (principal and interest) |
15,630 | 7,166 | 3,870 | 2,059 | 2,535 | |||||||||||||||
|
|
|
|
|
|
|
|
|
|
|
|||||||||||
| Total |
$ | 4,685,031 | $ | 389,620 | $ | 534,689 | $ | 495,938 | $ | 3,264,784 | ||||||||||
|
|
|
|
|
|
|
|
|
|
|
|||||||||||
Our operating leases and purchase commitments include expected payments for our operating facilities, network services and capacity, communications equipment, and maintenance obligations. Our purchase commitments are primarily success-based, meaning that before we commit resources to expand our network, we have a signed customer contract that will provide us with an attractive return on the required capital. The contractual long-term debt payments, above, include an estimate of future interest expense based on the interest rates in effect on our floating rate debt obligations as of the most recent balance sheet date.
Cash payments for interest, net of capitalized interest, which are reflected in our cash flows from operating activities, during the year ended June 30, 2013 were $143.5 million and represent 35% of our cash flows from operating activities before interest expense. We also made cash payments related to principal payments on our debt obligations of $16.2 million (exclusive of the impact of refinancing transactions), which are reflected in our cash flows from financing activities, and represent 4% of our cash flows from operating activities.
68
Table of Contents
Off-Balance Sheet Arrangements
We do not have any special purpose or limited purpose entities that provide off-balance sheet financing, liquidity, or market or credit risk support and we do not engage in leasing, hedging, or other similar activities that expose us to any significant liabilities that are not reflected in our audited consolidated financial statements, or disclosed in Note 15—Commitments and Contingencies to our audited consolidated financial statements, or in the Future Contractual Obligations table included above.
Recently Issued Accounting Pronouncements
Discontinued Operations
On April 10, 2014, the Financial Accounting Standards Board (“FASB”) issued Accounting Standards Update (“ASU”) 2014-08—Reporting Discontinued Operations and Disclosures of Disposals of Components of an Entity. The amendments in the ASU change the criteria for reporting discontinued operations for all public and nonpublic entities. The amendments also require new disclosures about discontinued operations and disposals of components of an entity that do not qualify for discontinued operations reporting. The ASU is effective prospectively for disposals (or classifications as held-for-sale) that occur within annual periods beginning on or after December 15, 2014, and interim periods within those annual periods, for public entities, with early adoption permitted for disposals (or classifications as held-for-sale) that have not been reported in financial statements previously issued or available for issuance. The Company has not yet adopted the guidance under this ASU.
Revenue Recognition
On May 28, 2014, the FASB issued ASU No. 2014-09, Revenue from Contracts with Customers, which requires an entity to recognize the amount of revenue to which it expects to be entitled for the transfer of promised goods or services to customers. The ASU will replace most existing revenue recognition guidance in U.S. GAAP when it becomes effective. The new standard is effective for us on or after July 1, 2017. Early application is not permitted. The standard permits the use of either the retrospective or cumulative effect transition method. We are evaluating the effect that ASU 2014-09 will have on our consolidated financial statements and related disclosures. We have not yet selected a transition method nor have we determined the effect of the standard on our ongoing financial reporting.
Critical Accounting Policies and Estimates
This discussion and analysis of our financial condition and results of operations are based upon our consolidated financial statements, which have been prepared in accordance with accounting principles generally accepted in the United States (“GAAP”). The preparation of these financial statements requires us to make estimates and judgments that affect the reported amounts of assets, liabilities, revenue, expenses and related disclosures. We base our estimates on historical results which form the basis for making judgments about the carrying values of assets and liabilities that are not readily apparent from other sources. We evaluate these estimates on an ongoing basis. Actual results may differ from these estimates under different assumptions or conditions.
We have accounting policies that involve estimates such as the allowance for doubtful accounts, revenue reserves, useful lives of long-lived assets, fair value of our common and preferred units issued as compensation, accruals for estimated tax and legal liabilities, accruals for exit activities associated with real estate leases, accruals for customer disputes and valuation allowance for deferred tax assets. We have identified the policies below, which require the most significant judgments and estimates to be made in the preparation of our consolidated financial statements, as critical to our business operations and an understanding of our results of operations.
69
Table of Contents
Revenue and Trade Receivables
We recognize revenue derived from leasing fiber optic telecommunications infrastructure and the provision of telecommunications and colocation services when the service has been provided and when there is persuasive evidence of an arrangement, the fee is fixed or determinable and collection of the receivable is reasonably assured. Taxes collected from customers and remitted to government authorities are excluded from revenue.
Approximately 98% of revenue is billed in advance on a fixed-rate basis. The remainder of revenue is billed in arrears on a transactional basis determined by customer usage. The Company often bills customers for upfront charges, which are non-refundable. These charges relate to down payments or prepayments for future services and are influenced by various business factors including how the Company and customer agree to structure the payment terms. If the upfront payment made by a customer provides no benefit to the customer beyond the contract term, the upfront charge is deferred and recognized as revenue ratably over the contract term. If the upfront payment provides benefit to the customer beyond the contract term, the charge is recognized as revenue over the estimated life of the customer relationship.
Revenue attributable to leases of dark fiber pursuant to IRUs are accounted for in the same manner as the accounting treatment for sales of real estate with property improvements or integral equipment. This accounting treatment typically results in the deferral of revenue for the cash that has been received and the recognition of revenue ratably over the term of the agreement (generally up to 20 years).
Revenue is recognized at the amount expected to be realized, which includes billing and service adjustments. During each reporting period, we make estimates for potential future sales credits to be issued in respect of current revenue, related to service interruptions and customer disputes, which are recorded as a reduction in revenue. We analyze historical credit activity when evaluating our credit reserve requirements. We reserve for known service interruptions as incurred. We review customer disputes and reserve against those we believe to be valid claims. The determination of the customer dispute credit reserve involves significant judgment, estimations and assumptions.
We defer recognition of revenue until cash is collected on certain components of revenue, principally contract termination charges and late fees.
We estimate the ability to collect our receivables by performing ongoing credit evaluations of our customers’ financial condition, and provide an allowance for doubtful accounts based on expected collection of our receivables. Our estimates are based on assumptions and other considerations, including payment history, credit ratings, customer financial performance, industry financial performance and aging analysis.
Stock-Based Compensation
We account for our stock-based compensation in accordance with the provisions of ASC 718—Compensation: Stock Compensation, which requires stock compensation to be recorded as either liability or equity awards based on the terms of the grant agreement. The CII common units granted to employees were considered to be stock-based compensation with terms that required the awards to be classified as liabilities due to cash settlement features. As such, we accounted for these awards as a liability and re-measured the liability to its fair value at each reporting date until the date of settlement, which requires the use of significant judgments and estimates. At each reporting period, we adjust the value of the vested portion of our liability awards to their fair value. The preferred units of CII granted to certain employees and directors were considered to be stock-based compensation with terms that required the awards to be classified as equity. As such, we accounted for these awards as equity, which required us to determine the fair value of the award on the grant date and amortize the related expense over the vesting period of the award.
We used a third party valuation firm to assist in the valuation of the CII common units at each reporting period and the CII preferred units when granted. In developing a value for these units, a two-step valuation
70
Table of Contents
approach was used. In the first step, we estimated the value of our equity through an analysis of valuations associated with various future potential liquidity scenarios. The second step involved allocating these values across our capital structure. The valuation was conducted in consideration of the guidance provided in the American Institute of Certified Public Accountants (“AICPA”) Practice Aid “Valuation of Privately-Held Company Equity Securities Issued as Compensation” and with adherence to the Uniform Standards of Professional Appraisal Practice (“USPAP”) set forth by the Appraisal Foundation.
We allocate value to each class of stock using the Probability Weighted Expected Return Method, or PWERM. The unit value was based on a probability-weighted present value of expected future proceeds to our shareholders, considering each potential liquidity scenario available to us as well as preferential rights of each security. The potential scenarios that we considered within the PWERM framework were remaining a private company with the same ownership, a sale or merger, and an initial public offering (“IPO”). The PWERM utilizes a variety of assumptions regarding the likelihood of a certain scenario occurring, if the event involves a transaction, the potential timing of such an event, and the potential valuation that each scenario might yield.
We more heavily weighted the valuation estimate associated with an IPO as compared to remaining a private entity with the same ownership, with the least weight applied to the company sale assumption.
Within the PWERM framework, management also considered various liquidation possibilities, including an IPO and a sale or merger. In each of these scenarios, a distribution is established around the estimated exit dates and valuations of each scenario. Future valuation figures are based upon corresponding market data for comparable companies in comparable scenarios. These include publicly-traded valuation statistics and acquisition valuation statistics for comparable companies in the IPO scenario and sale/merger scenario, respectively. Valuation statistics are combined with expectations regarding our future economic performance to produce future valuation estimates. Estimates are then discounted to the present using our estimated cost of equity as the discount rate.
In the scenario where the Company remains private, or status quo scenario, we estimated our total equity value using a discounted cash flow approach, which involved developing a projected free cash flow, estimating an appropriate risk adjusted present value discount rate, calculating the present value of our projected free cash flows, and calculating a terminal value. There were several inputs that were required to develop an estimate of the enterprise value under the status quo scenario, including forecasted earnings, discount rate, and the terminal multiple and/or the capitalization factor. We have developed a forecast of our revenues and EBITDA through March 31, 2019. Our forecasted revenues and EBITDA are based on our business operations as of the balance sheet date. If a material acquisition has occurred or has a high probability of occurring subsequent to the balance sheet date, the forecast utilized in the valuation reflects the pro forma results of operations of the combined entities. The next step in the income approach was to estimate a discount rate that most appropriately reflected our cost of capital, which we estimated to be 10.03% as of March 31, 2014. In determining this discount rate, we utilized a weighted average cost of capital (“WACC”) utilizing the Capital Asset Pricing Model (“CAPM”) build-up method. This method derived the cost of equity in part from the volatility (risk) statistics suggested by the Guideline Public Companies in the form of their five year historical betas. We included certain incremental risk premiums specific to us to account for the fact that we have historically depended on outside investment to operate and have a history of substantial volatility in earnings and cash flows. Based on our projections and estimated discount rate, we calculated the present value of our future cash flows. In order to estimate the enterprise value, we added to the estimated discounted cash flows an estimated terminal value. The H-Model reflected us as a going concern after the projection period by assuming that free cash flows grow at a supernormal rate starting in April 2019 and linearly taper to a long-term growth rate consistent with estimated inflation over a period of five years. These assumptions were used to construct a capitalization factor that was applied directly to the terminal year free cash flow, producing a terminal value specific to the H-Model Method. Both terminal values were converted into a present value through discounting by our WACC. The terminal value was estimated utilizing the “H-Model” method and “Observed Market Multiple” method. Next, the Observed Market Multiple method assumed we would be sold at the end of the forecast period. To develop a terminal multiple, we observed prevailing valuations associated with the Guideline Public Companies and the acquisitions of Guideline Public Companies. A terminal EBITDA multiple was selected
71
Table of Contents
to calculate the terminal value under this methodology. After adding the present value of free cash flows and terminal value for each scenario, we weighted the H-Model method at 75% and the Observed Market Multiple method at 25% to calculate a final enterprise value under the status quo scenario.
Based on these scenarios, management calculated the probability-weighted expected return to all of the equity holders. The resulting enterprise valuation was then allocated across our capital structure. Upon a liquidation of CII, or upon a non-liquidating distribution, the holders of common units would share in the proceeds after the CII preferred unit holders received their unreturned capital contributions and their priority return (6% per annum). After the preferred unreturned capital contributions and the priority return were satisfied, the remaining proceeds were allocated on a scale ranging from 85% to the Class A preferred unit holders and 15% to the common unit holders to 80% to the preferred unit holders and 20% to the common unit holders depending upon the return multiple to the preferred unit holders, also known as a waterfall allocation.
The value attributable to each class of shares was then discounted in order to account for the lack of marketability of the units. In determining the appropriate lack of marketability discount, we evaluated both empirical and theoretical approaches to arrive at a composite range that we believed indicated a reasonable spectrum of discounts for each of the valuation techniques utilized. The empirical methods we evaluated relied on datasets procured from observed transactions in interests in the public domain that are perceived to incorporate pricing information related to the marketability (or lack thereof) of the interest itself. These empirical methods included IPO Studies and Restricted Stock Studies. Theoretical models utilized in our analysis formed the primary basis for the discount for lack of marketability, and included the Finnerty Average-Strike Put, the Asian Protective Put and the Black-Scholes-Merton Protective Put.
The following table reflects the estimated value of the Class A, B, C D, E, F, G, H, I, and J common units and ZPS Class A common units as of June 30, 2013, 2012, 2011 and March 31, 2014 and 2013:
| Estimated fair value per unit as of | ||||||||||||||||||||
| Common Units |
March 31, 2014 | March 31, 2013 | June 30, 2013 | June, 30 2012 | June 30, 2011 | |||||||||||||||
| Class A |
$ | 2.17 | $ | 1.32 | $ | 1.50 | $ | 0.92 | $ | 0.81 | ||||||||||
| Class B |
1.93 | 1.16 | 1.34 | 0.81 | 0.58 | |||||||||||||||
| Class C |
1.65 | 0.96 | 1.14 | 0.68 | 0.33 | |||||||||||||||
| Class D |
1.60 | 0.93 | 1.10 | 0.65 | 0.31 | |||||||||||||||
| Class E |
1.38 | 0.78 | 0.95 | 0.55 | 0.23 | |||||||||||||||
| Class F |
1.22 | 0.68 | 0.75 | 0.49 | n/a | |||||||||||||||
| Class G |
0.65 | 0.31 | 0.46 | n/a | n/a | |||||||||||||||
| Class H |
0.53 | 0.24 | 0.38 | n/a | n/a | |||||||||||||||
| Class I |
0.31 | n/a | n/a | n/a | n/a | |||||||||||||||
| Class J |
0.22 | n/a | n/a | n/a | n/a | |||||||||||||||
| ZPS Class A |
0.20 | n/a | 0.20 | n/a | n/a | |||||||||||||||
Determining the fair value of share-based awards at the grant date and subsequent reporting dates required judgment. If actual results differ significantly from these estimates, stock-based compensation expense and the Company’s results of operations could be materially impacted.
Property and Equipment
We record property and equipment acquired in connection with a business combination at their estimated fair values on the acquisition date. See “—Critical Accounting Policies and Estimates: Acquisitions—Purchase Price Allocation.” Purchases of property and equipment are stated at cost, net of depreciation. Major improvements are capitalized, while expenditures for repairs and maintenance are expensed when incurred. Costs incurred prior to a capital project’s completion are reflected as construction-in-progress and are part of network infrastructure assets. Depreciation begins once the property and equipment is available and ready for use. Certain internal direct labor costs of constructing or installing property and equipment are capitalized. Capitalized direct labor reflects a
72
Table of Contents
portion of the salary and benefits of certain field engineers and other employees that are directly related to the construction and installation of network infrastructure assets. We have contracted with third party contractors for the construction and installation of the majority of our fiber network. Depreciation and amortization is provided on a straight-line basis over the estimated useful lives of the assets, with the exception of leasehold improvements, which are amortized over the lesser of the estimated useful lives or the term of the lease.
Estimated useful lives of our property and equipment in years are as follows:
| Land |
N/A | |||
| Buildings improvements and site improvements |
15 to 20 | |||
| Furniture, fixtures and office equipment |
3 to 7 | |||
| Computer hardware |
3 to 5 | |||
| Software |
3 | |||
| Machinery and equipment |
5 to 7 | |||
| Fiber optic equipment |
8 | |||
| Circuit switch equipment |
10 | |||
| Packet switch equipment |
5 | |||
| Fiber optic network |
15 to 20 | |||
| Construction in progress |
N/A |
We perform periodic internal reviews to estimate useful lives of our property and equipment. Due to rapid changes in technology and the competitive environment, selecting the estimated economic life of telecommunications property and equipment requires a significant amount of judgment. Our internal reviews take into account input from our network services personnel regarding actual usage, physical wear and tear, replacement history, and assumptions regarding the benefits and costs of implementing new technology that factor in the need to meet our financial objectives.
When property and equipment is retired or otherwise disposed of, the cost and accumulated depreciation is removed from the accounts, and resulting gains or losses are reflected in operating income.
From time to time, we are required to replace or re-route existing fiber due to structural changes such as construction and highway expansions, which is defined as a “relocation.” In such instances, we fully depreciate the remaining carrying value of network infrastructure removed or rendered unusable, and capitalize the new fiber and associated construction costs of the relocation placed into service, which is reduced by any reimbursements received for such costs. To the extent that the relocation does not require the replacement of components of our network and only involves the act of moving our existing network infrastructure, as-is, to another location, the related costs are expensed as incurred.
Interest costs are capitalized for all assets that require a period of time to get them ready for their intended use. This policy is based on the premise that the historical cost of acquiring an asset should include all costs necessarily incurred to bring it to the condition and location necessary for its intended use. In principle, the cost incurred in financing expenditures for an asset during a required construction or development period is itself a part of the asset’s historical acquisition cost. The amount of interest costs capitalized for qualifying assets is determined based on the portion of the interest cost incurred during the assets’ acquisition periods that theoretically could have been avoided if expenditures for the assets had not been made. The amount of interest capitalized in an accounting period is calculated by applying the capitalization rate to the average amount of accumulated expenditures for the asset during the period. The capitalization rates used to determine the value of interest capitalized in an accounting period is based on our weighted average effective interest rate for outstanding debt obligations during the respective accounting period.
We periodically evaluate the recoverability of our long-lived assets and evaluate such assets for impairment whenever events or circumstances indicate that the carrying amount of such assets may not be recoverable. Impairment is determined to exist if the estimated future undiscounted cash flows are less than the carrying value of such assets. We consider various factors to determine if an impairment test is necessary. The factors
73
Table of Contents
include: consideration of the overall economic climate, technological advances with respect to equipment, our strategy, and capital planning. Since our inception, no event has occurred nor has there been a change in the business environment that would trigger an impairment test for our property and equipment assets.
Deferred Tax Assets
Deferred tax assets arise from a variety of sources, the most significant being: tax losses that can be carried forward to be utilized against taxable income in future years; and expenses recognized in our income statement but disallowed in our tax return until the associated cash flow occurs.
We record a valuation allowance to reduce our deferred tax assets to the amount that is expected to be recognized. The amount of deferred tax assets recorded on our consolidated balance sheets is influenced by management’s assessment of our future taxable income with regard to relevant business plan forecasts, the reversal of deferred tax balances, and reasonable tax planning strategies. At each balance sheet date, existing assessments are reviewed and, if necessary, revised to reflect changed circumstances. In a situation where recent losses have been incurred, the relevant accounting standards require convincing evidence that there will be sufficient future taxable income.
In connection with several of our acquisitions, we have acquired significant net operating loss carryforwards (“NOLs”). The Tax Reform Act of 1986 contains provisions that limit the utilization of NOLs if there has been an “ownership change” as described in Section 382 of the Internal Revenue Code.
Upon acquiring a company that has NOLs, we prepare an assessment to determine if we have a legal right to use the acquired NOLs. In performing this assessment we follow the regulations within the Internal Revenue Code Section 382: Net Operating Loss Carryovers Following Changes in Ownership. Any disallowed NOLs acquired are written-off in purchase accounting.
A valuation allowance is required for deferred tax assets if, based on available evidence, it is more-likely-than-not that all or some portion of the asset will not be realized due to the inability to generate sufficient taxable income in the period and/or of the character necessary to utilize the benefit of the deferred tax asset. When evaluating whether it is more-likely-than-not that all or some portion of the deferred tax asset will not be realized, all available evidence, both positive and negative, that may affect the realizability of deferred tax assets is identified and considered in determining the appropriate amount of the valuation allowance. We continue to monitor our financial performance and other evidence each quarter to determine the appropriateness of our valuation allowance. If we are unable to meet our taxable income forecasts in future periods we may change our conclusion about the appropriateness of the valuation allowance which could create a substantial income tax expense in our consolidated statement of operations in the period such change occurs.
As of June 30, 2013, we had a cumulative NOL carryforward balance of $1,375.9 million. During the year ending June 30, 2013, we generated $90.6 million of NOL carryforwards that are available to offset future taxable income and we added $1,008.8 million to our NOL carryforward balance as a result of NOL carryforwards acquired from the AboveNet acquisition. Our NOL carryforwards, if not utilized to reduce taxable income in future periods, will expire in various amounts beginning in 2020 and ending in 2032. We utilized NOL carryforwards to offset income tax obligations during the year ended June 30, 2012. As a result of Internal Revenue Service regulations, we are currently limited to utilizing a maximum of $590.9 million of acquired NOL carryforwards during Fiscal 2014; however, to the extent that we do not utilize $590.9 million of our acquired NOL carryforwards during a fiscal year, the difference between the $590.9 million maximum usage and the actual NOLs usage is carried over to the next calendar year. Of our $1,375.9 million NOL carryforwards balance, $1,187.9 million of these NOL carryforwards were acquired in acquisitions. The deferred tax assets recognized at June 30, 2013 have been based on future profitability assumptions over a five-year horizon.
The analysis of our ability to utilize our NOL balance is based on our forecasted taxable income. The forecasted assumptions approximate our best estimates, including market growth rates, future pricing, market
74
Table of Contents
acceptance of our products and services, future expected capital investments, and discount rates. Although our forecasted income includes increased taxable earnings in future periods, flat earnings over the period in which our NOL carryfowards are available would result in full utilization of our current unreserved NOL carryforwards.
Goodwill and Purchased Intangibles
We review goodwill and indefinite-lived intangible assets for impairment at least annually in April, or more frequently if a triggering event occurs between impairment testing dates.
Intangible assets arising from business combinations, such as acquired customer contracts and relationships (collectively “customer relationships”), are initially recorded at fair value. We amortize customer relationships primarily over an estimated life of ten to twenty years using the straight-line method, as this method approximates the timing in which we expect to receive the benefit from the acquired customer relationship assets. Goodwill represents the excess of the purchase price over the fair value of the net identifiable assets acquired in a business combination.
Our impairment assessment begins with a qualitative assessment to determine whether it is more likely than not that the fair value of a reporting unit is less than its carrying value. The qualitative assessment includes comparing the overall financial performance of the reporting units against the planned results used in the last quantitative goodwill impairment test. Additionally, each reporting unit’s fair value is assessed in light of certain events and circumstances, including macroeconomic conditions, industry and market considerations, cost factors, and other relevant entity- and reporting unit-specific events. If it is determined under the qualitative assessment that it is more likely than not that the fair value of a reporting unit is less than its carrying value, then a two-step quantitative impairment test is performed. Under the first step, the estimated fair value of the reporting unit is compared with its carrying value (including goodwill). If the fair value of the reporting unit exceeds its carrying value, step two does not need to be performed. If the estimated fair value of the reporting unit is less than its carrying value, an indication of goodwill impairment exists for the reporting unit and the enterprise must perform step two of the impairment test (measurement). Under step two, an impairment loss is recognized for any excess of the carrying amount of the reporting unit’s goodwill over the implied fair value of that goodwill. The implied fair value of goodwill is determined by allocating the fair value of the reporting unit in a manner similar to a purchase price allocation in acquisition accounting. The residual fair value after this allocation is the implied fair value of the reporting unit goodwill. Fair value of the reporting unit under the two-step assessment is determined using a discounted cash flow analysis. The selection and assessment of qualitative factors used to determine whether it is more likely than not that the fair value of a reporting unit exceeds the carrying value involves significant judgments and estimates.
Intangible assets with finite useful lives are amortized over their respective estimated useful lives and reviewed for impairment whenever events or changes in circumstances indicate that the carrying amount of the asset may not be recoverable. We recorded no impairment charges for goodwill or intangibles during the years ended June 30, 2011, 2012, or 2013 or nine months ended March 31, 2014. We have not yet performed our qualitative assessment for Fiscal 2014.
Acquisitions—Purchase Price Allocation
We apply the acquisition method of accounting to account for business combinations. The cost of an acquisition is measured as the aggregate of the fair values at the date of exchange of the assets given, liabilities incurred, and equity instruments issued. Identifiable assets, liabilities, and contingent liabilities acquired or assumed are measured separately at their fair value as of the acquisition date. The excess of the cost of the acquisition over our interest in the fair value of the identifiable net assets acquired is recorded as goodwill. If our interest in the fair value of the identifiable net assets acquired in a business combination exceeds the cost of the acquisition, a gain is recognized in earnings on the acquisition date only after we have reassessed whether we have correctly identified all of the assets acquired and all of the liabilities assumed.
For certain of our larger acquisitions, we engage outside appraisal firms to assist in the fair value determination of identifiable intangible assets such as customer relationships, tradenames, property and
75
Table of Contents
equipment and any other significant assets or liabilities. We adjust the preliminary purchase price allocation, as necessary, after the acquisition closing date through the end of the measurement period (up to one year) as we finalize valuations for the assets acquired and liabilities assumed.
The determination and allocation of fair values to the identifiable assets acquired and liabilities assumed is based on various assumptions and valuation methodologies requiring considerable management judgment. The most significant variables in these valuations are discount rates, terminal values, the number of years on which to base the cash flow projections, and the assumptions and estimates used to determine cash inflows and outflows or other valuation techniques (such as replacement cost). We determine which discount rates to use based on the risk inherent in the related activity’s current business model and industry comparisons. Terminal values are based on the expected life of products, forecasted life cycle, and forecasted cash flows over that period. Although we believe that the assumptions applied in the determination are reasonable based on information available at the date of acquisition, actual results may differ from the estimated or forecasted amounts, and the difference could be material.
Quantitative and Qualitative Disclosure of Market Risks
Our exposure to market risk consists of changes in interest rates from time to time and market risk arising from changes in foreign currency exchange rates that could impact our cash flows and earnings.
As of March 31, 2014, we had outstanding approximately $750.0 million Senior Secured Notes, $500.0 million Senior Unsecured Notes, a balance of $1,720.7 million on the Term Loan Facility and $19.5 million of capital lease obligations. As of March 31, 2014, we had $243.6 million available for borrowing under the Revolver.
Based on current market interest rates for debt of similar terms and average maturities and based on recent transactions, we estimate the fair value of the Notes to be $1,298.6 million as of March 31, 2014. The Senior Secured Notes and Senior Unsecured Notes accrue interest at fixed rates of 8.125% and 10.125%, respectively.
Both the Revolver and the Term Loan Facility accrue interest at floating rates subject to certain conditions. As of March 31, 2014, the applicable interest rate on the Revolver was 3.0% and the rate on the Term Loan Facility was 4.0%. A hypothetical increase in the applicable interest rate on the Term Loan Facility of one percentage point would increase our annual interest expense by 0.23% or $4.0 million because the applicable interest rate as of March 31, 2014 was below the Credit Agreement’s 1.0% LIBOR floor. A hypothetical increase of one percentage point above the LIBOR floor would increase our annual interest expense by approximately $17.4 million before considering the offsetting effects of our interest rate swaps.
In August 2012, we entered into interest rate swap agreements with an aggregate notional value of $750.0 million and a maturity date of June 30, 2017. The contract states that we pay a 1.67% fixed rate of interest for the term of the agreement, beginning June 30, 2013. The counterparties pay to us the greater of actual LIBOR or 1.25%. We entered into the swap arrangements to reduce the risk of increased interest costs associated with potential future increases in LIBOR rates. A hypothetical increase in LIBOR rates of 100 basis points would increase the fair value of our interest rate swaps by approximately $19.6 million.
We are exposed to the risk of changes in interest rates if it is necessary to seek additional funding to support the expansion of our business and to support acquisitions. The interest rate that we may be able to obtain on future debt financings will be dependent on market conditions.
We have exposure to market risk arising from foreign currency exchange rates, primarily as it relates to the British pound. During the year ended June 30, 2013 and the nine month period ended March 31, 2014, our foreign activities accounted for 6.0% and 5.7% of our consolidated revenue, respectively. Due to the strengthening of the British pound compared to the U.S. dollar, the average translation rate for the nine month period ended March 31, 2014 increased 1.7%.
76
Table of Contents
We monitor foreign markets and our commitments in such markets to assess currency and other risks. To date, we have not entered into any hedging arrangement designed to limit exposure to foreign currencies. Because of our European expansion related to the AboveNet acquisition completed during Fiscal 2013, our level of foreign activities is expected to increase and if it does, we may determine that such hedging arrangements would be appropriate and will consider such arrangements to minimize our exposure to foreign exchange risk.
We do not have any material commodity price risk.
77
Table of Contents
Bandwidth Infrastructure Industry
We are a bandwidth infrastructure provider, and our services are a critical component of the broader $2 trillion global communications industry. Bandwidth infrastructure, consisting primarily of fiber networks and interconnect-oriented colocation facilities, plays a fundamental role in the communications value chain, similar to other types of infrastructure such as datacenters and cellular towers. Bandwidth infrastructure assets are a critical resource, connecting datacenters, cellular towers, and other carrier and private networks to support the substantial growth in global data, voice and video consumption by both business and individual consumers.
Industry History
Our industry has changed substantially over the past 15 years. The first phase of the bandwidth infrastructure industry occurred with the advent of the Internet and the ensuing dot com era in the late 1990s. This led to the first major wave of fiber network deployments as a number of companies of varying backgrounds invested billions of dollars in fiber network construction throughout the U.S. and Europe. These fiber network developers included companies with national and international plans (e.g., Level 3 Communications, Qwest Communications, Williams Communications) and more regional plans (e.g., 360networks, Progress Telecom, OnFiber). Following these network builds, many of the fiber companies struggled in the early 2000s due to the lack of sufficient demand for their high-bandwidth services. Bandwidth demand during this timeframe was limited by the fact that many bandwidth-intensive applications (e.g. streaming video, cloud, mobile broadband, big data analytics, etc.) were either not yet contemplated or still very early in their life cycle. Instead, the majority of traffic at the time was low-bandwidth services such as voice and dial-up modem connections. In addition, the similarity of the fiber routes deployed resulted in significant overcapacity and associated pricing pressure, leaving a “last mile” gap and heavy competition and overcapacity along these routes. These two primary factors combined to significantly limit the fiber network providers’ operating cash flows, resulting in the majority of these companies transitioning their business models, consolidating and/or seeking bankruptcy protection.
In the following years, a substantial expansion in computing power and bandwidth-intensive applications drove meaningful bandwidth traffic growth. This growth highlighted the need to address the “last mile” gap by bringing bandwidth capacity directly to both the consumer and business end user. The capacity and performance of the consumer last mile connection was primarily addressed by the expansion of cable networks and through mobile network development by wireless carriers (supported by cellular tower operators). The growing bandwidth demand of business end users was addressed by a number of focused fiber developers constructing new networks to directly connect to datacenters, cellular towers, government facilities, schools, hospitals and other locations with high-bandwidth needs. These fiber network companies were generally local or regional in nature, and were most often either survivors of the initial fiber development wave, subsidiaries of a utility parent, or owned by entrepreneurs. This period is also noted for increased financial discipline following the large speculative capital deployments of the dot com era. This is the timeframe and industry environment in which Zayo was founded.
The Industry Today
The acceleration in the development of bandwidth-intensive devices and applications has resulted in a significant need to further fill in the “last mile” gap, leading to substantial capital investments in fiber networks by bandwidth infrastructure providers. Bandwidth infrastructure service providers support applications such as high definition television broadcasting and video; online streaming video (Sandvine found that streaming video providers represent over 50% of North American downstream Internet traffic during peak hours); cloud applications replacing in-house enterprise software platforms (RightScale Inc. found that over 90% of organizations are running applications or experimenting with infrastructure-as-a-service); and explosive mobile data consumption (Cisco found that, in 2013, global mobile data traffic grew 81% and was nearly 18 times the
78
Table of Contents
size of the entire global Internet in 2000). Companies whose services require large amounts of bandwidth and enterprises that consume large amounts of bandwidth are struggling to adapt to this rapidly evolving landscape, and the bandwidth infrastructure industry is growing in economic importance as it addresses this critical need. In addition to these demand trends, there has been significant consolidation amongst the bandwidth infrastructure services providers, validating a core tenet of Zayo’s founding investment thesis. This has been most pronounced amongst fiber providers in the U.S., with over 60 transactions within the past 10 years (approximately half of which have been consummated by us), and to a lesser degree in Europe.
Industry Participants
We view the participants in today’s communications industry in two distinct categories:
| • | Providers of Infrastructure. Companies that own and operate infrastructure assets that are used to market and deliver infrastructure services. We believe these assets would be difficult to replicate given the significant capital, time, permitting, and expertise required. Providers of infrastructure typically enjoy long-term customer contracts, a highly visible and recurring revenue base, and attractive Adjusted EBITDA margins. We further categorize these providers of infrastructure as follows: |
| ¡ | Bandwidth Infrastructure Providers: Owners of bandwidth infrastructure assets comprised of fiber networks and interconnect-oriented colocation facilities. Bandwidth infrastructure services include dark fiber, lit services (wavelengths, Ethernet, IP, and SONET), and colocation and interconnection services for the purpose of transporting mission-critical traffic including data, voice, and video. |
| ¡ | Datacenter Providers: Owners of datacenter facilities that include raised floor, power and cooling infrastructure. These facilities house and support networking and computing equipment for carrier networks, enterprise cloud platforms, content distribution networks, and other mission-critical applications. |
| ¡ | Cellular Tower Providers: Owners of cellular towers, the physical infrastructure upon which antennas and associated equipment are co-located for the wireless carrier industry. |
| • | Users of Infrastructure. Users of infrastructure may purchase infrastructure services either to provide value-added services to their customers or for their own private network requirements. We further categorize these users of infrastructure as follows: |
| ¡ | Communications Service Providers. Communication service providers, such as wireless service providers, ILECs, CLECs, and ISPs, are companies that use infrastructure to package, market, and sell value-added communications services such as voice, Internet, data, video, wireless, and hosting solutions. |
| ¡ | End Users. End users are public sector entities and private enterprises that purchase infrastructure services for their own internal networks. Note that end users may also address their needs by purchasing value-added services from communications service providers. |
The Market Opportunity
The proliferation of smart devices and mobile broadband, real-time streaming video, social networks, online gaming, machine-to-machine connectivity, big data analytics, and cloud computing will continue to drive substantial consumer and business demand for bandwidth. As an example, while video streaming traffic represents 50% of peak hour downstream Internet traffic, Nielsen found that online viewing still only represents approximately 5% of the time viewers spend watching traditional TV, highlighting the significant potential demand and need for bandwidth. The Vertical Systems Group estimated that in 2013 61% of the U.S. enterprise
79
Table of Contents
buildings with 20 or more employees lacked fiber access facilities. Cisco estimates that, from 2013 to 2018, mobile data traffic will grow at an annual rate of 61% and that IP traffic will grow at an annual rate of 21% through 2018. Additionally, according to Gartner in its November 18, 2013 report, Forecast: The Internet of Things, Worldwide, 2013, “[t]he installed base of ‘things,’ excluding PCs, tablets and smartphones, will grow to 26 billion units in 2020, which is almost a 30-fold increase from 0.9 billion units in 2009.”
Communications service providers develop and deliver value-added solutions that are tailored to mass market residential and enterprise customers whose needs continue to grow and evolve as bandwidth trends expand. Given this rapid growth and the complexity and cost of building and maintaining networks, communications service providers are increasingly looking to bandwidth infrastructure providers to augment the reach and performance of their own networks support the delivery of the services their customers demand. As this dynamic continues, bandwidth infrastructure providers will become further entrenched as mission-critical partners to the communications service providers.
Similarly, end users such as private enterprises (e.g., media/content providers, financial institutions, and hospital systems) and public sector entities (e.g., governmental agencies and school districts) have experienced significant growth and change in the role that bandwidth plays within their organizations. As these needs continue to grow in both volume and criticality, end users will increasingly choose to directly procure bandwidth infrastructure services in order to gain more security, control and scale in their internal network operations. An example of this disintermediation is the trend of large school districts, adapting to e-education requirements, directly purchasing dark fiber as a replacement to more value-added solutions. We believe that as these dynamics play out across all industries, the number of end users directly seeking bandwidth infrastructure services will continue to expand.
By focusing on the reach, density, and performance of their physical networks, bandwidth infrastructure providers can deliver customized services to communications service providers and end users more quickly and with superior economics than these users could otherwise self-provide. Whether providing fiber connectivity to a wireless provider’s towers to enable mobile broadband, supplying a national communications service provider with a metro fiber footprint in new markets, providing a lit bandwidth connection to multiple enterprise datacenters for an industrial company, providing interconnection capabilities to a hosting company within a datacenter, or solving for the next society-impacting innovation, bandwidth infrastructure providers will continue to invest in and expand their infrastructure assets to meet this growing demand.
Given the natural economies of scale, there has been significant consolidation among bandwidth infrastructure providers, particularly in the U.S. We believe this consolidation trend will continue in the U.S. and is beginning in Europe. Combined with the barriers to new entrants, we foresee a decreasing number of bandwidth infrastructure providers against a backdrop of continued strong demand for their services.
Overview
We are a large and fast growing provider of bandwidth infrastructure in the United States and Europe. Our products and services enable mission-critical, high-bandwidth applications, such as cloud-based computing, video, mobile, social media, machine-to-machine connectivity, and other bandwidth-intensive applications. Key products include leased dark fiber, fiber to cellular towers and small cell sites, dedicated wavelength connections, Ethernet and IP connectivity and other high-bandwidth offerings. We provide our services over a unique set of dense metro, regional, and long-haul fiber networks and through our interconnect-oriented datacenter facilities. Our fiber networks and datacenter facilities are critical components of the overall physical network architecture of the Internet and private networks. Our customer base includes some of the largest and most sophisticated consumers of bandwidth infrastructure services, such as wireless service providers; telecommunications service providers; financial services companies; social networking, media, and web content companies; education, research, and healthcare institutions; and governmental agencies. We typically provide our bandwidth infrastructure services for a fixed monthly recurring fee under contracts that vary between one and twenty years in length. As of March 31, 2014, we had more than $4.3 billion in revenue under contract with a weighted average remaining contract term of
80
Table of Contents
42 months. We operate our business with a unique focus on capital allocation and financial performance with the ultimate goal of maximizing equity value for our stockholders. Our core values center on partnership, alignment, and transparency with our three primary constituent groups—employees, customers, and stockholders.
We were founded in 2007 with the investment thesis of building a bandwidth infrastructure platform to take advantage of the favorable Internet, data, and wireless growth trends driving the demand for bandwidth infrastructure, and to be an active participant in the consolidation of the industry. The growth of cloud-based computing, video, mobile and social media applications, machine-to-machine connectivity, and other bandwidth-intensive applications continues to drive rapidly increasing consumption of bandwidth on a global basis. Cisco estimates that, from 2013 to 2018, mobile data traffic will grow at an annual rate of 61% and that IP traffic will grow at an annual rate of 21% through 2018. Additionally, according to Gartner in its November 18, 2013 report, Forecast: The Internet of Things, Worldwide, 2013, “[t]he installed base of ‘things,’ excluding PCs, tablets and smartphones, will grow to 26 billion units in 2020, which is almost a 30-fold increase from 0.9 billion units in 2009.” As an early believer in the enduring nature of these trends, we assembled our asset base and built a business model specifically to provide high-bandwidth connectivity to customers whose businesses depend most on the continuous and growing demand for bandwidth. As a core tenet of our strategy for capitalizing on these industry trends, we have been a leading industry consolidator and have acquired 32 bandwidth infrastructure businesses and assets to date. Our owned, secure, and redundant fiber network and datacenters serve as the foundation for our bandwidth solutions and allow us to offer customers both physical infrastructure and lit services. We believe the continuous demand for additional bandwidth from service providers, enterprises and consumers, combined with our unique and dense metro, regional, and long-haul networks, position us as a mission-critical infrastructure supplier to the largest users of bandwidth.
Our network footprint includes both large and small metro geographies, the extended suburban regions of many cities, and the large rural, national and international links that connect our metro networks. We believe that our network assets would be difficult to replicate given the geographic reach, network density, and capital investment required. As of March 31, 2014, our fiber networks spanned over 77,000 route miles and 5,700,000 fiber miles (representing an average of 74 fibers per route), served 297 geographic markets in the United States and Europe, and connected to 14,490 buildings, including 3,838 cellular towers and 527 datacenters. We own fiber networks in almost 300 metro markets, including large metro areas, such as New York, Chicago, San Francisco, and London, as well as smaller metro areas, such as Allentown, Pennsylvania, Fargo, North Dakota, and Spokane, Washington. Our networks allow us to provide our high-bandwidth infrastructure services to our customers over redundant fiber facilities between key customer locations. As of March 31, 2014, we owned over 93% of our fiber miles, the remainder of which were operated by us under long-term IRU contracts with an average remaining contract term of 9 years. We believe our ownership and the location and density of our expansive network footprint allow us to more competitively service our target customers’ bandwidth infrastructure needs at the local, regional, national, and international level relative to other regional bandwidth infrastructure service providers or long-haul carriers. We also provide our network-neutral colocation and interconnection services utilizing our own datacenters located within major carrier hotels and other strategic buildings in 27 locations throughout the United States and, as of March 31, 2014, operate more than 200,000 square feet of billable colocation space.
The density and geographic reach of our network footprint allow us to provide tailored bandwidth infrastructure solutions on our own network (“on-net”) that address the current and future bandwidth needs of our customers. Our dense metro and regional networks have high fiber counts that enable us to provide both our physical infrastructure services (e.g., dark fiber) and our lit services (e.g., wavelengths and Ethernet). Our networks are deep and scalable, meaning we have spare fiber, conduit access rights and/or rights of way rights that allow us to continue to add capacity to our network as our existing and new customers’ demand for our services increases. In addition, many of our core network technologies provide capacity through which we can continue to add wavelengths to our network without consuming additional fiber. We also believe the density and diversity of our networks provide a strong and growing competitive barrier to protect our existing revenue base. We believe our networks provide significant opportunity to organically connect to new customer locations, datacenters, towers, or small cell locations to help us achieve an attractive return on our capital deployed. Since our founding, we have assembled a large portfolio of fiber networks and colocation assets through both
81
Table of Contents
acquisitions and customer demand-driven investments in property and equipment. From our inception to date, we have completed acquisitions with an aggregate purchase consideration, net of cash acquired, totaling approximately $3.9 billion. For the period from July 1, 2012 through March 31, 2014, we also invested $598 million in capital expenditures primarily to expand the reach and capacity of our networks. As of March 31, 2014, our total debt (including capital lease obligations) was $2,990.2 million and was primarily incurred in connection with acquisitions.
Our business model focuses on providing on-net bandwidth infrastructure solutions to our customers, which results in what we refer to as “infrastructure economics.” Infrastructure economics are characterized by attractive revenue visibility, strong Adjusted EBITDA margins coupled with operating leverage for new revenue, success-based capital investments with low maintenance capital needs, and the ability to generate significant cash flow over time. For the nine month period ended March 31, 2014, over 93% of our revenue was recurring in nature with an average remaining contract term of 42 months. Our Adjusted EBITDA margin for the quarter ended March 31, 2014 was 58% due to our infrastructure-based, on-net strategy. Additionally, our Adjusted EBITDA margin on incremental revenue is approximately 70%, highlighting the operating leverage we achieve through our asset base and on-net focus. See “Non-GAAP Financial Measures.” Our capital expenditure investments are predominantly success-based, meaning that before we commit resources to expand our network, we have a signed customer contract that will provide us with an attractive return on the required capital. For the nine month period ended March 31, 2014, 77% of our total capital expenditures of $266 million were success-based, with customers providing up-front cash payments of $113 million, largely used to finance our network expansion. After committing capital to connect additional customer sites, our goal is to sell additional high-bandwidth connectivity on these new routes at a relatively low incremental cost, which further enhances the return we extract from our asset base. Finally, the combination of our scale and infrastructure economics results in the ability to generate meaningful free cash flow over time. For the nine month period ended March 31, 2014, we generated $135 million of levered free cash flow. See “Non-GAAP Financial Measures” and “Selected Historical Consolidated Financial Information and Operating Data” for a reconciliation of levered free cash flow to net cash flows provided by operating activities.
Our management is intensely focused on creating equity value for our stockholders. Our equity value creation philosophy includes regular and rigorous financial and operational measurement, financial transparency (both internally and externally), and clear alignment of interests among employees, management, and stockholders. Our real-time measurement and reporting system serves as the foundation for our decision making and our extensive financial and operational disclosure. We also believe in fostering an entrepreneurial culture that aligns the interests of our employees, management, and stockholders. Following this offering, assuming an initial public offering price at the midpoint of the estimated price range set forth on the cover of this prospectus, our management and employees are expected to own % of our shares. Additionally, following our initial public offering, most employees are expected to have a significant portion of their performance-based compensation paid in restricted stock that will be tied directly to the level of equity value created.
We are a Delaware corporation headquartered in Boulder, Colorado. As of March 31, 2014, we had 1,421 employees.
Our Bandwidth Infrastructure Assets
Our bandwidth infrastructure assets consist of our fiber networks, the optronic equipment used to provide our lit services over our fiber networks, and our datacenters where we provide colocation and interconnection services.
Our Fiber Networks
Our fiber network footprint includes both large and small metro geographies, the extended suburban regions of many cities, and the large rural, national and international fiber links that connect our metro networks. Our network represents a collection of assets that we believe is difficult to replicate. As of March 31, 2014, our fiber networks spanned approximately 77,000 route miles and 5,700,000 fiber miles (representing an average of 74 fibers per
82
Table of Contents
route), served 297 geographic markets in the United States and Europe, and connected 14,490 buildings, including 3,838 cellular towers and 527 datacenters. Our networks allow us to provide our high-bandwidth infrastructure services to our customers over redundant fiber facilities between critical customer locations. As of March 31, 2014, we owned over 93% of our fiber miles, the remainder of which are secured via long-term IRU contracts with an average remaining contract term of approximately nine years. We believe the expansiveness and density of our fiber network footprint allow us to more competitively service our target customers’ bandwidth infrastructure needs at the local, regional, national, and international level relative to other regional or long-haul bandwidth infrastructure service providers. Our fiber networks also have the following key attributes:
| • | Extensive Coverage. Our fiber networks are located across large and small metro geographies, the extended metro and suburban regions of many cities, and traverse large rural areas to connect metro markets. This network coverage allows us to address our target customers’ needs in a variety of geographies and for a variety of applications, all while remaining “on-net” and maintaining infrastructure economics. |
| • | Scalable Network Architecture. Our networks are scalable, meaning we often have spare fiber, conduit access rights and/or rights of way that allow us to continue to add capacity to our network as our customers’ demand for our services increases. In addition, the majority of our core fiber network segments utilize DWDM systems, nearly all of which have spare capacity through which we can continue to add wavelengths to our network without consuming additional fiber. |
| • | Modern Fiber and Optronics. Our modern fiber networks support current generation optronic equipment including DWDM systems, carrier class Ethernet switches and IP routers. This equipment is used to provide our lit services. The vast majority of our networks are capable of supporting next generation technologies with minimal capital investment. |
Metro Fiber Networks. We use our metro fiber networks to provide bandwidth infrastructure services within the metro markets that we serve. Our metro networks are most commonly used in the following two scenarios: First, to provide service between on-net buildings that are located in the same geographic market. Second, to connect our on-net buildings within a metro market to another metro market via our regional and/or long-haul networks. We continue to expand our metro fiber networks within the metro geography and into the surrounding suburban areas as we extend to additional buildings to meet new demand on a success basis. Success-based expansion means that before we commit resources to expand our network, we have a signed customer contract that will provide us with an attractive return on required capital. In many of our metro markets, we have high count fiber cables (sometimes as many as 864 fibers per cable) and in some cases multiple spare conduits on our metro fiber routes. On individual segments where our fiber capacity becomes highly utilized, we seek to augment that capacity also on a success basis.
Regional and Long-haul Fiber Networks. We use our regional fiber networks to provide bandwidth infrastructure services between the metro markets that we serve. Our regional and long-haul networks are most commonly used in the following three scenarios: First, to provide service between on-net buildings that are located in different large markets (for example, Chicago and New York). Second, to connect our on-net buildings in small and mid-sized markets back to major datacenters, wireless switching centers, and carrier hotels in larger markets (for example, between Lima, Ohio and Cleveland, Ohio). Third, occasionally our networks provide service between on-net buildings in two different small or mid-sized markets located on various parts of our regional networks (for example, between Sioux Falls, South Dakota and Alexandria, Minnesota). We seek to continue to add new segments and markets to our regional and long-haul networks on a success basis, supported by a customer contract. We have deployed current generation DWDM technologies across the majority of our regional and long-haul networks, allowing a current maximum scaling to four Terabytes (i.e. 4,000G) of bandwidth and the ability to add capacity as demand for bandwidth increases. We expect that as technology continues to advance, we will augment and invest in our regional and long-haul networks accordingly.
83
Table of Contents
Fiber-to-the-Tower Networks. As of March 31, 2014, we operate fiber-to-the-tower networks in 51 distinct geographic areas across our footprint, and have FTT projects under construction in eight additional markets. We connect to 3,838 cellular towers and have contracts with multiple national wireless carriers to build out to 1,074 additional towers. These FTT networks provide our customers with bandwidth infrastructure services that offer significantly improved speed, scale, performance and service levels relative to legacy copper and microwave networks. Our FTT networks are scalable, which means that we can quickly and easily increase the amount of bandwidth that we provide to each of the towers as our customers’ wireless data networks grow. Our FTT markets are generally in areas where we already have dense fiber networks (either metro or regional), which affords us the ability to offer ring-protected mobile infrastructure services. We are increasingly providing dark fiber services on our FTT networks.
Through these fiber networks, we provide service to 14,490 on-net buildings and are continually making success-based capital investments to increase our on-net building footprint. On-net buildings are buildings that are directly connected via fiber to our long-haul, regional, metro, and FTT networks. Our customers generally purchase our bandwidth infrastructure services to transport their data, Internet, wireless and voice traffic between buildings directly connected to our network. The types of buildings connected to our network primarily consist of the following (statistics all as of March 31, 2014):
| • | Datacenters, Carrier Hotels and Central Offices. These buildings house multiple consumers of bandwidth infrastructure services, serving as telecommunications and content exchange points. Our fiber networks generally connect the most important of these buildings in the markets where we operate. We have 1,060 of these types of facilities connected to our network. |
| • | Single-Tenant, High-Bandwidth Locations. Generally these are other telecom, media or Internet content buildings that house a single large consumer of bandwidth infrastructure services. Examples of these buildings include video aggregation sites, mobile switching centers and carrier POPs. Our network is connected to these buildings only when the tenant is a customer. We currently have 1,610 single-tenant, high-bandwidth locations on-net. |
| • | Cellular Towers. We connect to cellular towers and other locations that house wireless antennas. We have 3,838 cellular towers on-net, and we are actively constructing fiber to an additional 1,074. Typically, towers have multiple tenants, which provide us with the opportunity to sell services to those additional tenants. |
| • | Enterprise Buildings. Our network extends to 7,982 enterprise buildings. This grouping contains a mix of single tenant and multi-tenant enterprise buildings and includes hospitals, corporate datacenters, schools, government buildings, research centers and other key corporate locations that require bandwidth infrastructure services. |
Our zColo Datacenters
Many of our zColo datacenter facilities are located in some of the most important carrier hotels in the United States, including 60 Hudson Street and 111 8th Avenue in New York; 165 Halsey Street in Newark; 401 N Broad Street in Philadelphia; 1 Summer Street in Boston; 1950 N. Stemmons Freeway and 2323 Bryan Street in Dallas; and 2001 6th Street in Seattle. zColo also has the exclusive right to operate and provide colocation and interconnection services in the Meet-Me Room at 60 Hudson Street. We also have colocation facilities located in Austin, Baltimore, Chicago, Cincinnati, Cleveland, Columbus, Las Vegas, Los Angeles, Memphis, Miami, Nashville, Phoenix, Pittsburgh, Minneapolis, and Washington, D.C. All of our facilities are network-neutral, and have ample power to meet customer needs, backup power in the form of batteries and generators, air conditioning, modern fire suppression equipment, 24/7 security and equipment monitoring, and redundant cooling capabilities. We have long-term leases with the owners of each of the buildings where we provide colocation services. As of March 31, 2014, our colocation facilities total approximately 200,000 square feet of billable colocation space.
84
Table of Contents
Rights-of-Way
We have the necessary right-of-way agreements and other required rights, including state and federal government authorization, to allow us to maintain and expand our fiber networks that are located on private property and public rights-of-way, including utility poles. When we expand our network, we obtain the necessary construction permits, license agreements, permits and franchise agreements. Certain of these permits, licenses and franchises are for a limited duration. When we need to use private property, our strategy is to obtain rights-of-way under long-term contracts.
Our Segments and Services
We provide two major types of products and services, which form the basis for two of our three operating segments: Physical Infrastructure and Lit Services. Our Other segment includes ZPS, our professional services business that provides network and technical resources to our customers. Across our segments, we operate eight individual Strategic Product Groups. Each Strategic Product Group has financial accountability and decision-making authority, which promotes agility in the fast-moving markets we serve.
| For the Three Months Ended March 31, 2014 |
||||||||
| $ in millions | Revenue | % of Total |
||||||
| Physical Infrastructure |
||||||||
| Dark Fiber |
$ | 85.5 | 31% | |||||
| Mobile Infrastructure Group |
20.4 | 7% | ||||||
| zColo |
19.7 | 7% | ||||||
|
|
|
|
|
|||||
| Sub-total |
125.6 | 45% | ||||||
|
|
|
|||||||
| Lit Services |
||||||||
| Wavelengths |
59.5 | 21% | ||||||
| Ethernet |
37.8 | 13% | ||||||
| SONET |
29.4 | 10% | ||||||
| IP |
25.6 | 9% | ||||||
|
|
|
|
|
|||||
| Sub-total |
152.3 | 53% | ||||||
|
|
|
|||||||
| Other |
||||||||
| ZPS |
6.4 | 2% | ||||||
|
|
|
|
|
|||||
| Sub-total |
6.4 | 2% | ||||||
| Corp/elimination |
0.5 | — | ||||||
|
|
|
|
|
|||||
| Total |
$ | 284.8 | 100% | |||||
|
|
|
|
|
|||||
Physical Infrastructure. Through our Physical Infrastructure segment, we provide raw bandwidth infrastructure to customers that require more control of their internal networks. These services include dark fiber, mobile infrastructure (fiber-to-the-tower and small cell), and colocation and interconnection. Dark fiber is a physically separate and secure, private platform for dedicated bandwidth. We lease dark fiber pairs (usually two to 12 total fibers) to our customers, who “light” the fiber using their own optronics. Our mobile infrastructure services provide direct fiber connections to cell towers, small cells, hub sites, and mobile switching centers. Our datacenters offer colocation and interconnection services to our customers, who then house and power our computing and networking equipment for the purpose of aggregating and distributing data, voice, Internet, and video traffic. Strategic Product Groups within the Physical Infrastructure segment include:
| • | Zayo Dark Fiber. Through our Dark Fiber Strategic Product Group, we provide dark fiber and related services on portions of our existing fiber network and/or newly constructed network segments. We provide dark fiber pairs to our customers, who then light the fiber using their own optronic equipment, allowing the customer to manage bandwidth according to their specific business needs. As part of our service offering, we manage and maintain the underlying fiber network for the customer. Other related |
85
Table of Contents
| services may include the installation and maintenance of building entrance fiber or riser fiber for distribution within a building. Customers include carriers and other communication service providers, ISPs, wireless service providers, major media and content companies, large enterprises, large school districts, government institutions, and other entities that have the expertise to operate their own optronics. We market and sell dark fiber-related services under long-term contracts, typically provided for terms between five and twenty years in length. Customers generally pay on a monthly basis for the fiber; however, some customers pay upfront (generally referred to as an IRU). Fiber maintenance (or O&M) services are generally billed on an annual or monthly recurring basis regardless of the timing of the payment for the fiber lease. Recurring payments are fixed, but often include automatic annual price escalators intended to compensate us for inflation. |
| • | Zayo Mobile Infrastructure (“MIG”). Our MIG Strategic Product Group provides two key services: FTT and small cell infrastructure. MIG customers are wireless carriers. Our FTT product consists of fiber-based backhaul from cellular towers to mobile switching centers. This service is generally provided via an Ethernet (in speeds of 50 Mb and above) or dark fiber service, and is used by wireless service providers to enable 3G and 4G mobile voice and data services to their customers. As of March 31, 2014, we had 3,838 cellular towers on-net, and we are actively constructing fiber to an additional 1,074. Typically, towers have multiple tenants, which provide us with the opportunity to sell services to those additional tenants. MIG’s small cell infrastructure services provide two separate sub-services. The first sub-service is neutral space and power at a small cell location (example: a light pole), similar to a tower provider. Wireless services providers purchase this service to have a physical location on which to mount their small cell antennas. The second sub-service is dark fiber backhaul from the antenna location to a mobile switching center or interim aggregation point (often a tower). Services are typically provided for terms between five and 20 years for a fixed recurring monthly fee and, in most cases, an additional upfront, non-recurring fee. Pricing is a function of the quantity of dark fiber or bandwidth consumed and the number of locations served. |
| • | Zayo Colocation (“zColo”). Through our zColo Strategic Product Group, we provide network-neutral colocation and interconnection services in 27 datacenter facilities across 21 markets throughout the United States. zColo manages approximately 200,000 square feet of billable colocation space as of March 31, 2014 within these 27 facilities. All of our facilities provide 24 hour per day, 365 days per year management and monitoring with physical security, fire suppression, power distribution, backup power, cooling and multiple redundant fiber connections to multiple network providers. The components of our network neutral colocation offering are: space, power, interconnection and remote technical services. We sell space in half-racks, racks, cabinets, cages, and private suites. We provide alternating current (“AC”) and direct current (“DC”) power at various levels. Our power product is supported by battery and generator back-up sources. As a network-neutral provider of colocation services, we provide our customers with interconnection services allowing customers to connect and deliver bandwidth between separate networks using fiber, Ethernet, and SONET services. We believe our interconnection offering is differentiated by our inter-building dark fiber infrastructure, allowing connectivity between and among multiple suites in major U.S. datacenters, and our Metro Interconnect product, which allows customers to interconnect to other important traffic exchange buildings within a metro market. We also offer datacenter customers outsourced technical resources through our “remote hands” product. Customers can vary by facility and include: domestic and foreign carriers, ISPs, cloud services providers, on-line gaming companies, content providers, media companies and other data-centric enterprises. Services are typically provided for terms between one and five years for a recurring monthly fee and, in many cases, an additional upfront, non-recurring fee. zColo is the exclusive operator of the Meet-Me Room at 60 Hudson Street in New York, which is one of the most critical carrier hotels in the world, with over 400 domestic and international networks interconnecting within this facility. |
Lit Services. Our Lit Services segment provides bandwidth infrastructure solutions over our metro, regional, and long-haul fiber networks where we use optronics to light the fiber and our customers pay us for access based on the amount and type of bandwidth they purchase. Our lit services include wavelength, Ethernet, IP, and
86
Table of Contents
SONET services. We target customers who require a minimum of 10G of bandwidth across their networks. Strategic Product Groups within the Lit Services segment include:
| • | Zayo Wavelength Services. Through our Wavelength Services Strategic Product Group, we provide lit bandwidth infrastructure services to customers by using optical wavelength technology. The service is provided by using DWDM optronic equipment to “multiplex” multiple channels (i.e., wavelengths) of dedicated capacity on a single fiber pair. The wavelength group provides its services in speeds of 1G, 2.5G, 10G, 40G, and 100G. Customers include carriers, financial services companies, healthcare, government institutions, education institutions and other enterprises. Services are typically provided for terms between one and five years for a fixed recurring monthly fee and in some cases an additional upfront, non-recurring fee. |
| • | Zayo Ethernet Services. Our Ethernet Services Strategic Product Group provides lit bandwidth infrastructure services to its customers utilizing Ethernet technology. Ethernet services are offered in metro markets as well as between metro areas (intercity) in point-to-point and multi-point configurations. Unlike data transmission over a dedicated wavelength network, information transmitted over Ethernet is transferred in a packet or frame across the network. The frame enables the data to navigate across a shared infrastructure in order to reach the customer required destination. Services are provided in speeds ranging from 10Mb to 10G. Customers include carriers, financial services companies, healthcare, government institutions, education institutions and other enterprises. Services are typically provided for terms between one and five years for a fixed recurring monthly fee and in some cases an additional upfront, non-recurring fee. |
| • | Zayo Internet Protocol Services. The Internet Protocol Strategic Product Group provides lit bandwidth infrastructure services to its customers utilizing Internet Protocol technology. IP technology transports data across multiple circuits over a shared infrastructure from the customer source to the customer required destination. Information leaving the source is divided into multiple packets and each packet traverses the network utilizing the most efficient path and means available, as determined by a network of IP routers. Packets of information may travel across different physical circuits or paths in order to reach the destination, at which point the packets are reassembled to form the complete communication. Services are generally used to exchange or access traffic on the public Internet. Services are provided in speeds ranging from 10Mb to 100G on a single customer port interface. Customers include regional telecommunications and cable carriers, ISPs, enterprises, educational institutions and content companies. Services are typically provided for terms between one and three years for a fixed recurring monthly fee and in some cases a usage-based and/or an additional upfront, non-recurring fee. Pricing is generally a function of bandwidth capacity and transport required to carry traffic from the customer location to a public Internet exchange. |
| • | Zayo SONET Services. Our SONET Strategic Product Group provides lit bandwidth infrastructure services to its customers utilizing SONET technology. SONET is a standardized protocol that transfers multiple digital bit streams over optical fiber using lasers. SONET technology is often used to support private line services. This protocol enables transmission of voice, data and video at high speeds. SONET networks are protected, which provides for virtually instantaneous restoration of service in the event of a fiber cut or equipment failure. Services are provided in speeds ranging from DS-1 (1.54Mb) to OC-192 (10G) of capacity. Customers in this group are largely carriers. Services are typically provided for terms between one and five years for a fixed recurring monthly fee and in some cases an additional upfront, non-recurring fee. SONET is generally a more legacy product that is gradually being replaced by Ethernet, wavelength and dark fiber services. As a result, the SONET Strategic Product Group generally manages its business to maximize cash generation and deploys minimal growth capital. |
Other. Our Other segment currently includes our ZPS Strategic Product Group.
| • | Zayo Professional Services. Through our professional services Strategic Product Group, we provide network and technical resources to customers who wish to leverage our expertise in designing, acquiring, |
87
Table of Contents
| and maintaining networks. Services are typically provided for a term of one year for a fixed recurring monthly fee in the case of network and on an hourly basis for technical resources (usage revenue). |
Our Operations
Network Management and Operations
Our primary network operating center (“NOC”) is located in Tulsa, Oklahoma and provides 24 hour per day, 365 days per year monitoring and network surveillance. As part of our business continuity plan, our primary NOC is backed up by several regional operations centers located in Washington, D.C.; Allentown, Pennsylvania; and Butte, Montana. We continually monitor for and proactively respond to any events that negatively impact or interrupt the services that we provide to our customers. Our NOC also responds to customer network inquiries via standard customer trouble ticket procedures. Our NOC coordinates and notifies our customers of maintenance activities and is the organization responsible for ensuring that we meet our service level agreements.
Information Technology
Our Information Technology systems have been designed and built specifically for the needs of a focused bandwidth infrastructure provider primarily leveraging the salesforce.com platform. This platform was adopted at our inception and has been enhanced over time to integrate all of our acquired companies and increase functionality in every area.
Our current systems’ capability is mature, and we view our application functionality as a competitive advantage in our industry. Our system is differentiated from the typical telecom industry technology solution consisting of separate and loosely integrated sales force automation, customer relationship management, provisioning, mapping, inventory, financial, provisioning and other systems with multiple, sometimes conflicting databases.
We have also developed within our salesforce.com platform a proprietary capability we call Tranzact. Tranzact is a set of tools and processes designed to enhance the speed and simplicity of procuring bandwidth infrastructure services. We believe Tranzact will further increase our competitive advantage in delivering bandwidth infrastructure solutions.
We have a fully implemented business continuity and disaster recovery plan that provides near real-time data access from physically diverse datacenters (Dallas and Washington, D.C.). We further protect our data with off-site data storage practices.
Our Sales and Marketing Organization
Our business primarily engages in direct sales through our sales organization, consisting of 118 sales representatives as of March 31, 2014. Each of these sales representatives is responsible for meeting a monthly bookings quota. The sales organization sells services across all eight Strategic Product Groups. The sales representatives are directly supported by sales management, engineering, solutions engineering and marketing staff.
The sales organization is organized into five direct sales channels that generally align around both region and customer (four direct outside sales channels and one direct inside sales channel). Each of these channels maintains dedicated sales and solutions engineering support resources. Two of the direct outside sales channels focus on target customers principally located in the eastern and western geographic regions of the United States, primarily supporting regional carriers and medium to large enterprise customers, particularly in the healthcare, education, media and financial sectors. A third direct outside sales channel focuses on similar European-based customers given geographic location. The fourth direct outside channel focuses exclusively on national wireline and wireless carriers across all geographies. In addition to the four direct outside channels, there is a direct inside channel team that performs inside sales across all geographies.
88
Table of Contents
In addition to the five direct channels discussed above, an indirect sales channel manages our channel partner program with various high value telecom sales agents. Finally, we have developed a group of sales overlay teams to focus on leveraging our infrastructure assets for the benefit of specific industry verticals and geographies.
Our direct salesforce is compensated through a unique system relative to typical industry practices. While salespeople receive a salary, the majority of their compensation is based on commission, which in turn is based upon the NPV of the contracted services sold. We believe that this compensation system best aligns the interests of our salespeople, management and our stockholders. It also is an example of the financial philosophy and culture that we have developed since our inception.
Separate from the sales groups, we have a corporate marketing group that is responsible for our web presence, customer facing mapping tools, marketing campaigns, and public relations. The sales organization is further supported by product management teams that are organized into the eight Strategic Product Groups.
Our Customers
Our customers generally have a significant and growing need for the bandwidth infrastructure services that we provide. Our customer base consists of wireless service providers, carriers and other communication service providers, media and content companies (including cable and satellite video providers), and other bandwidth-intensive businesses in the education, healthcare, financial services, governmental and technology entities. Our largest single customer accounted for approximately 7% of our revenue during the quarter ended March 31, 2014, and total revenues from our top ten customers accounted for approximately 30% of our revenue during the same period. These customers are multinational organizations with substantial liquidity and access to capital, and whose bandwidth needs are mission-critical to their own businesses and strategies. While these large customers generally have a finite set of master contracts with us, they procure a large volume of individual services with us, each of which has its own service detail and term.
The majority of our customers sign Master Service Agreements (“MSAs”) that contain standard terms and conditions including service level agreements, required response intervals, indemnification, default, force majeure, assignment and notification, limitation of liability, confidentiality and other key terms and conditions. Most MSAs also contain appendices that contain information that is specific to each of the services that we provide. The MSAs either have exhibits that contain service orders or, alternatively, terms for services ordered are set forth in a separate service order. Each service order sets forth the minimum contract duration, the monthly recurring charge, and the non-recurring charges.
Our Business Strategy
In pursuit of our mission, our Business Strategy includes the following key elements:
| • | Focus on Bandwidth Infrastructure. We expect that bandwidth needs for mobile applications, cloud-based computing, and machine-to-machine connectivity will continue to grow with the continued adoption of bandwidth-intensive devices, as well as the escalating demand for Internet-delivered video. We focus on providing high-bandwidth infrastructure solutions, which we believe are essential in the consumption and delivery of bandwidth-intensive applications and services by enterprise customers and communications service providers. We believe our disciplined approach to providing these critical services to our targeted customers enables us to offer a high level of customer service, while at the same time being responsive to changes in the marketplace. |
| • | Target Large Consumers of Bandwidth. Our asset base and product suite are geared for large consumers of bandwidth with high connectivity requirements. The majority of our customers require more than 10G of bandwidth; many of our customers require multiple terabytes of bandwidth. Our revenue base is generally characterized by customers with a high bandwidth spend, consisting of a large number of individual services and increasing bandwidth infrastructure service demand. Tailoring our operations |
89
Table of Contents
| around these products, services and customers allows us to operate efficiently and meet these large consumers’ requirements for mission-critical infrastructure. |
| • | Leverage Our Extensive Asset Base by Selling Services on Our Network. Targeting our sales efforts on services that utilize our existing fiber networks and datacenters enables us to limit our reliance on third-party service providers. We believe this in turn produces high incremental margins, which helps us expand consolidated margins, achieve attractive returns on the capital we invest, and realize significant levered free cash flow. We also believe this enables us to provide our customers with a superior level of customer service due to the relative ease in responding to customer service inquiries over one contiguous fiber network. Our existing networks enable us to sell additional bandwidth to our existing customers as their capacity needs grow. |
| • | Continue to Expand Our Infrastructure Assets. Our ability to rapidly add network capacity to meet the growing requirements of our customers is an important component of our value proposition. We will continue to seek opportunities to expand our network footprint where supporting customer contracts provide an attractive return on our investment. The expansion of our network footprint also provides the ancillary benefit of bringing other potential customer locations within reach. We design our networks with additional capacity so that increasing bandwidth capacity can be deployed economically and efficiently. A significant portion of our capital expenditures are success-based. |
| • | Leverage Our Existing Relationships and Assets to Innovate. We believe we possess a unique set of assets and management systems designed to deliver customer solutions tailored to specific trends we observe in the marketplace. Our high-energy, entrepreneurial culture fosters employee innovation on an ongoing basis in response to specific customer requirements. Furthermore, we plan to continue to commit capital to new lines of infrastructure businesses that leverage our existing assets. For example, we are expanding into small cell infrastructure services provided to wireless services providers. These services entail us providing dark fiber and related services from a small cell location back to a mobile switching center. We provide the fiber-based transport over our existing and/or newly constructed fiber networks. In addition, we provide network-neutral space and power for wireless service providers to co-locate their small cell antennas and ancillary equipment. |
| • | Intelligently Expand Through Acquisitions. We have made 32 acquisitions to date for an aggregate purchase price, net of cash, of $3.9 billion, and associated with these acquisitions, we have acquired approximately $400 million of Adjusted EBITDA based on the quarter prior to each acquisition’s close annualized. We believe we have consistently demonstrated an ability to acquire and effectively integrate companies, realize cost synergies, and organically grow revenue and Adjusted EBITDA post-acquisition. Acquisitions have the ability to increase the scale of our operations, which in turn affords us the ability to expand our operating leverage, extend our network reach, and broaden our customer base. To date, we have identified and planned, although not fully realized cost synergies representing over $160 million in annual recurring cost savings. We believe that we have realized approximately 80% of our planned cost synergies to date. To achieve the remaining unrealized cost synergies, we expect to incur one-time costs of approximately $5 million, comprised of severance expense, and capital expenditures and early termination fees related to eliminating third party network expense. We believe our ability to realize significant cost synergies through acquisitions provides us with a competitive advantage in future consolidation opportunities within our industry. We will continue to evaluate potential acquisition opportunities and are regularly involved in acquisition discussions. We will evaluate these opportunities based on a number of criteria, including the quality of the infrastructure assets, the fit within our existing businesses, the opportunity to expand our network, and the opportunity to create value through the realization of cost synergies. |
Planned synergies reflect the annual expected cost savings associated with an acquisition as determined at the close of such transaction and are generally categorized into headcount-related savings, network-related savings and other savings (including real estate, insurance, auditor, legal and other costs that are expected to be significantly reduced through the combination). Acquired Adjusted EBITDA is based upon the annualized results
90
Table of Contents
of an acquired entity for the last full quarter prior to the acquisition’s close and reflects the adjustment required to align with our definition of Adjusted EBITDA. See “Non-GAAP Financial Measures” for a discussion of our calculation of Adjusted EBITDA.
Our Competitive Strengths
We believe the following are among our core competitive strengths and enable us to differentiate ourselves in the markets we serve:
| • | Unique Bandwidth Infrastructure Assets. We believe replicating our extensive metro, regional, and long-haul fiber assets would be difficult given the significant capital, time, permitting, and expertise required. As of March 31, 2014, our fiber spanned over 77,000 route miles and 5,700,000 fiber miles (representing an average of 74 fibers per route), served 297 geographic markets in the United States and Europe, and connected to 14,490 buildings. The majority of the markets that we serve and buildings to which we connect have few other networks capable of providing similar high-bandwidth infrastructure and connectivity solutions, which we believe provides us with a sustainable competitive advantage in these markets, and positions us as a mission-critical infrastructure supplier to the largest users of bandwidth. We believe that the vast majority of customers using our network, including our lit bandwidth, fiber-to-the-tower, and dark fiber customers, choose our services due to the quality and reach of our network, and the ability our network gives us to innovate and scale with their growing bandwidth needs. Additionally, we operate 27 datacenter facilities, which are located in eight of the most important carrier hotels in the U.S. This collective presence, combined with our high network density, creates a network effect that helps us retain existing customers and attract new customers. We believe the uniqueness of our network and our focus on investment in infrastructure assets provides us with the ability to enhance our high Adjusted EBITDA margin profile. From July 1, 2012 through March 31, 2014, exclusive of acquisitions, we have invested $598 million of capital in our networks, including expansion and maintenance expenditures. |
| • | Strong Revenue Growth, Visibility, and Durability. We have consistently grown our organic revenue, as gross installed revenue has exceeded churn processed in every quarter since we began reporting in March 2010. We believe our exposure to the enduring trend of increasing bandwidth consumption combined with our focused execution have allowed us to achieve this consistent growth. We typically provide our bandwidth infrastructure services for a fixed monthly recurring fee under multi-year contracts. Our contract terms range from one year to twenty years with a weighted average contract term of approximately 72 months for contracts entered into during the twelve months ended March 31, 2014. As of March 31, 2014, we had more than $4.3 billion in revenue under contract with a weighted average remaining contract life of 42 months. Our customers use our bandwidth infrastructure to support their mission-critical networks and applications. The switching costs and effort required to replace our services can be high, particularly for the services within our Physical Infrastructure segment, given the criticality of our services and the potential cost and disruption. We believe that increasing bandwidth needs combined with the mission-critical nature of our services provided under multi-year contracts create strong revenue growth, visibility, and durability, which support our decision-making abilities and financial stability. |
| • | Customer Service and Ability to Innovate for Our Customers. Our sales and product professionals work closely with potential and existing customers to design tailored high-bandwidth connectivity solutions across our eight Strategic Product Groups to meet specific, varying, and evolving customer needs. We are focused on delivering high-quality, reliable service to our customers. We achieve this by leveraging our contiguous network to expand with our customers as they seek to build scale, coverage, and/or performance. Additionally, our focus on serving the largest and most sophisticated users of bandwidth keeps our sales, engineering, and service organizations attuned to the latest technologies, architectures, and solutions that our customers may seek to implement. We believe our willingness to innovate for our customers and our dedication to customer service help establish our position as an important infrastructure supplier and allow us to attract new customers and businesses, sell an increasing amount of services to our |
91
Table of Contents
| existing customers, and reduce customer turnover. From March 31, 2013 through March 31, 2014, existing customers accounted for over 85% of newly installed monthly recurring revenue. |
| • | Strategic, Operational and Financial Transparency Excellence. As part of our strategy to serve the largest users of bandwidth, we have completed and integrated 32 acquisitions to date. Our acquired assets have been combined to create a contiguous network with the ability to provision and maintain local, regional, national, or international high-bandwidth connections across our eight Strategic Product Groups. Our entire network, sales and churn activity, installation pipeline, NPV commission plans, and all customer contracts are managed through an integrated operating and reporting platform, which gives management strong visibility into the business and improves our ability to drive return-maximizing decisions throughout the organization. We believe this approach creates efficiency, as evidenced by identified and planned, though not fully realized, cost synergies representing over $160 million in annual recurring cost savings from our 32 acquisitions to date. We also believe this approach allows for the integration of additional network assets whether through new builds or acquisitions. Our focus on operational and financial transparency not only allows us to be very nimble in attacking various market opportunities, but also provides us the ability to deliver disclosure that our stockholders and other stakeholders can use to accurately judge management’s performance from a capital allocation, financial, and operational perspective. |
| • | Financially Focused and Entrepreneurial Culture. Virtually all operational and financial decisions we make are driven by the standard of maximizing the value of our enterprise. Our sales commission plans use an NPV-based approach with the goal of encouraging the proper behavior within our sales force, and our eight Strategic Product Groups are held to group level equity IRR targets set by management. Additionally, to align individual behaviors with stockholder objectives, equity compensation is used throughout the Company, and our compensation plans include a larger equity component than we believe is standard in our industry. We expect that our employees will own % of our outstanding shares following this offering, assuming an initial public offering price at the midpoint of the estimated price range set forth on the cover of this prospectus, which we believe is a significantly higher percentage than other public peers. In addition to striving for industry-leading operational and growth outcomes to drive value creation, we are prepared to use debt capacity to enhance stockholder returns, but not at the expense of other stakeholders and only at levels we believe are in the long-term interests of the Company, our customers, and our stockholders. Finally, our owners’ manual, mission statement, and investor transparency all serve to enhance cultural alignment across the Company and our stockholders. |
| • | Experienced Management with Unique Leadership Approach. We have assembled an experienced management team that we believe is well-qualified to lead our company and execute our strategy. Our management team has substantial industry experience in managing and designing fiber networks and network-neutral colocation and interconnection facilities and in selling and marketing bandwidth infrastructure services. In addition, our management team has significant experience in acquiring and integrating bandwidth infrastructure and assets. Our management team is a cohesive unit with a common history that in many cases precedes the Company’s founding. We also believe that our approach to leadership—operationally, financially, culturally—is unique in our industry and differentiates us from our competitors. |
Our Competition
Physical Infrastructure Services
Given the requirement to own the underlying bandwidth infrastructure assets (e.g., fiber networks and datacenter facilities) in order to provide physical infrastructure services, the competitive environment tends to be less intensive for these products and the barriers to entry high. The degree of competition and actual competitive
92
Table of Contents
parties do vary by physical infrastructure sub-service and by individual market and fiber route. The competitive situation by service is described as follows:
Dark Fiber. Competition in dark fiber services tends to be less intense than for lit bandwidth infrastructure services primarily because a provider must predominantly own and operate a high count fiber network covering a substantial portion of the geographical demand in order to compete for a customer’s business. The uniqueness, density and depth (i.e, high fiber count) of our metro, regional, and long-haul fiber networks is therefore a key differentiating factor. In addition, given that providing dark fiber services often includes some degree of network expansion, dark fiber providers must also have internal project management expertise and access to capital to execute on the expansion aspect of the business. Due to the custom nature of most dark fiber opportunities, many larger lit bandwidth infrastructure providers do not actively market dark fiber as a product, even if they own fiber networks in the desired geographies. As a result, competition is often more limited in the dark fiber services market and highly dependent on the local (even sub-market) supply and demand environment. Given this dynamic and the generally longer contractual term of dark fiber services, dark fiber pricing tends to be more inflationary in nature.
Specific dark fiber competitors vary significantly based on geography, and often a particular solution can be provided by only one to three carriers that have sufficient fiber in place in the desired area or route. These competitors tend to fall into two categories: first, privately owned regional bandwidth infrastructure providers with a similar degree of focus (e.g., Fibertech, Lightower, and Sunesys) and second, single market dark fiber providers with market and fiber construction expertise (e.g., 24/7 Mid-Atlantic, DQE Communications, and Edison Carrier Solutions).
Mobile Infrastructure. Competition in mobile infrastructure services tends to mirror dark fiber services because of the need to own and operate an expansive and deep metro fiber network in order to compete. Given the frequent need to expand upon an existing fiber footprint in order to access additional cell towers and small cell locations, project management expertise and access to capital is also a key competitive factor. One additional criteria is that wireless carriers prefer to work with a more finite group of mobile infrastructure providers on either a metro or regional geographic basis. As a result, the competitive group tends to match that of dark fiber services, with the addition of two competitive groups. First, local cable providers and ILECs who will often break from their retail and small enterprise core focus to compete for FTT business, often as a result of legacy copper or coaxial-based services provided to these towers. Second, microwave backhaul providers who focus on more remote or rural towers that have lesser bandwidth needs that they can serve with less capital-intensive (and less bandwidth-capable) microwave solutions at a lower total cost. Examples of these additional mobile infrastructure competitors are Comcast, Time Warner Cable, CenturyLink, PEG Bandwidth, Conterra and TTMI.
Colocation. The market for our colocation and interconnection services is very competitive. We compete based on price, quality of service, network-neutrality, breadth of network connectivity options, type and quantity of customers in our datacenters, and location. We compete against both large, public colocation providers who have significant enterprise values, and privately-held, well-funded companies. Some of our competitors have longer-standing customer relationships and significantly greater access to capital, which may enable them to materially increase datacenter space, and therefore lower overall market pricing for such services. Several of our competitors have much larger colocation facilities in the markets where we operate. Others operate globally and are able to attract a customer base that values and requires global reach and scale.
These focused interconnection and colocation service providers include: Equinix, Inc., The Telx Group, Inc., Terremark Worldwide, Inc. (a Verizon Communications, Inc. subsidiary), Coresite, Savvis, Inc. (a CenturyLink, Inc. subsidiary), and Cologix. These companies offer similar services and operate in similar markets to us.
Lit Services
We believe that some of the key factors that influence our customers’ selection of us as their lit services provider are our ability to provide an on-net service that utilizes our fiber network on an end-to-end basis, the
93
Table of Contents
ability to more quickly implement a complex custom solution to meet customers’ needs, the price of the service provided, and the ongoing customer service provided.
Generally, price competition varies depending on the size and location of the market. We face direct price competition when there are other fiber-based carriers who have networks that serve the same customers and geographies that we do. The specific competitors vary significantly based on geography, and often a particular solution can be provided by only one to three carriers that have comparable fiber in place. Typically, these competitors are large, well-capitalized ILECs, such as AT&T Inc., CenturyLink, Inc., and Verizon Communications Inc., or are publicly traded communications service providers that provide bandwidth infrastructure, such as Level 3 Communications, Inc. or tw telecom, Inc. In certain geographies, privately-held companies can also offer comparable fiber-based solutions. Examples include: Fibertech, Lightower, and Southern Light. On occasion, the price for high-bandwidth infrastructure services is too high compared with the cost of lower-speed, copper-based telecom services. We believe that price competition will continue where our competitors have comparable existing fiber networks. Some of our competitors have long-standing customer relationships, very large enterprise values, and significant access to capital.
Our Properties
Our principal properties are fiber optic networks and their component assets. We own a majority of the communications equipment required for operating our network and our business. As of March 31, 2014, we own or lease (under long term contracts) approximately 77,000 fiber route miles or 5,700,000 fiber miles. We provide colocation and interconnection services utilizing our own datacenters located within major carrier hotels and other strategic buildings in 27 locations throughout the United States. We do not own the buildings where we provide our colocation and interconnection services; however, as of March 31, 2014, the zColo group managed approximately 200,000 square feet of billable colocation space. See “Business—Our Bandwidth Infrastructure and Bandwidth Infrastructure Assets,” for additional discussion related to our network and colocation properties.
We lease our corporate headquarters in Boulder, Colorado as well as regional offices and sales, administrative and other support offices. Our corporate headquarters located at 1805 29th Street, Suite 2050, Boulder, Colorado is approximately 29,951 square feet. We lease properties to locate the POPs necessary to operate our networks. Office and POP space is leased in the markets where we maintain our network and generally ranges from 100 to 5,000 square feet. Each of our business units utilize these facilities. The majority of our leases have renewal provisions at either fair market value or a stated escalation above the last year of the current term.
Other
We do not own any significant intellectual property, nor do we spend a material amount on research and development. Our working capital requirements and expansion needs have been satisfied to date through CII members’ equity contributions, debt issuances, and cash provided by operating activities.
Regulatory Matters
Our operations require that certain of our subsidiaries hold licenses, certificates, and/or other regulatory authorizations from the Federal Communications Commission (“FCC”) and various state Public Utilities Commissions (“PUCs”), all of which we have obtained and maintain in the normal course of our business. The FCC and State PUCs generally have the power to modify or terminate a carrier’s authority to provide regulated wireline services for failure to comply with certain federal and state laws and regulations, and may impose fines or other penalties for violations of the same. The State PUCs typically have similar powers with respect to the intrastate services that we provide under their jurisdiction. In addition, we are required to submit periodic reports to the FCC and the State PUCs documenting interstate and intrastate revenue, among other data, for fee assessments and general regulatory governance, and in some states are required to file tariffs of our rates, terms, and conditions of service. In order to engage in certain transactions in these jurisdictions, including changes of control, the encumbrance of certain assets, the issuance of securities, the incurrence of indebtedness, the
94
Table of Contents
guarantee of indebtedness of other entities, including subsidiaries of ours, and the transfer of our assets, we are required to provide notice and/or obtain prior approval from certain of these governmental agencies. The construction of additions to our current fiber network is also subject to certain governmental permitting and licensing requirements.
In addition, our business is subject to various other regulations at the federal, state and local levels. These regulations affect the way we can conduct our business and our costs of doing so. However, we believe, based on our examination of such existing and potential new regulations being considered in ongoing FCC and State PUC proceedings, that such regulations will not have a significant impact on us.
Legal Proceedings
In the ordinary course of business, we are from time to time party to various litigation matters that we believe are incidental to the operation of our business. We record an appropriate provision when the occurrence of loss is probable and can be reasonably estimated. We cannot estimate with certainty our ultimate legal and financial liability with respect to any such pending litigation matters, and it is possible one or more of them could have a material adverse effect on us. However, we believe that the outcome of any such pending litigation matters will not have a material adverse effect upon our results of operations, our consolidated financial condition, or our liquidity.
95
Table of Contents
The following table sets forth the names, ages and positions of our directors, and executive officers as of August 1, 2014. The director committee designations reflect anticipated committee appointments at the closing of this offering. Additional biographical information for each individual is provided in the text following the table.
| Name |
Age | Position | ||||
| Dan Caruso |
51 | Chief Executive Officer, Chairman of the Board of Directors | ||||
| Ken desGarennes |
43 | Chief Financial Officer | ||||
| Stephanie Copeland |
46 | President, Zayo Lit Services | ||||
| Matt Erickson |
37 | President, Zayo Physical Infrastructure | ||||
| Chris Morley |
40 | President, Sales and Marketing | ||||
| Phil Canfield |
46 | Director, Nominating & Governance Committee Chairman | ||||
| Gillis Cashman |
39 | Director, Audit Committee Member | ||||
| Michael Choe |
42 | Director, Compensation Committee Chairman, Nominating & Governance Committee Member | ||||
| Stephanie Comfort |
51 | Director, Audit Committee Member | ||||
| Rick Connor |
65 | Director, Audit Committee Chairman | ||||
| Don Gips |
54 | Director, Compensation Committee and Nominating & Governance Committee Member | ||||
| Linda Rottenberg |
45 | Director, Compensation Committee and Nominating & Governance Committee Member | ||||
Management Team
Dan Caruso, one of our cofounders, has served as our Chief Executive Officer since our inception in 2007. Between 2004 and 2006, Mr. Caruso was President and CEO of ICG Communications, Inc. (“ICG”). In 2004, he led a buyout of ICG and took it private. In 2006, ICG was sold to Level 3 Communications, Inc. (“Level 3”). Prior to ICG, Mr. Caruso was one of the founding executives of Level 3, and served as their Group Vice President from 1997 through 2003 where he was responsible for Level 3’s engineering, construction, and operations organization and most of its lines of business and marketing functions at different times. Prior to Level 3, Mr. Caruso was a member of the MFS Communications Company, Inc. (“MFS Communications”) senior management team. He began his career at Illinois Bell Telephone Company, a former subsidiary of Ameritech Corporation. He holds an MBA from the University of Chicago and a B.S. in Mechanical Engineering from the University of Illinois.
Ken desGarennes has served as our Chief Financial Officer and Vice President since October 2007. From November 2003 to October 2007, Mr. desGarennes served as Chief Financial Officer for Wire One Communications, Inc. (“Wire One”). Prior to joining Wire One, Mr. desGarennes was a Senior Director at The Gores Group, LLC, a technology-focused private equity firm. Mr. desGarennes started his career as a commercial banking officer with First Union Bank before moving to Accenture plc, where he worked for six years in a corporate development role. Mr. desGarennes received his B.S. in finance from the University of Maryland in College Park.
96
Table of Contents
Stephanie Copeland has served as President, Zayo Lit Services since April 2014. Ms. Copeland joined the Company in 2012 and served as Senior Vice President of the European Business Unit until April 2013 and then ran our Ethernet Strategic Product Group until she assumed her current role. Before joining the Company, Ms. Copeland was Chief Operating Officer of WildBlue (a division of ViaSat, Inc., a digital communications company) from April 2011 to May 2012, where she led the division’s sales and operational functions. Ms. Copeland also served as Vice President and General Manager of Small Business at Qwest Communications International from 2009 to 2011, where she was responsible for the full profit and loss of the small business segment. Ms. Copeland had previously served at Qwest as Vice President of Marketing from 2005 to 2009 and Vice President of Pricing from 2001 to 2005. Prior to Qwest, Ms. Copeland held leadership positions at Cable & Wireless joint ventures in Russia, MFS International in Washington, D.C., and Level 3 Communications in London. Ms. Copeland received her B.A. in German and Commercial Studies from the University of Illinois and also completed post-graduate coursework in Business at the University of Paderborn in Paderborn, Germany.
Matt Erickson has served as the President of Zayo Physical Infrastructure since May 2012. In addition to his responsibilities for the Strategic Product Groups within Physical Infrastructure (Dark Fiber, MIG, and zColo), Mr. Erickson oversees Zayo’s operations and outside plant organizations. Mr. Erickson joined the Company in 2006. From 2006 through May of 2014, Mr. Erickson has held various roles at the company, including President of Zayo Fiber and Transport Infrastructure, President of Zayo Fiber Solutions, Senior Vice President of Corporate Development & Strategy and Vice President of Marketing & Product Management. Before joining the Company, Mr. Erickson was at ICG, where he was Vice President of Marketing & Product Management from 2004 to 2006. Prior to ICG, Mr. Erickson was at Level 3, where he held various roles including Internet, transport and infrastructure product management and corporate strategy/development. Mr. Erickson began his career at PricewaterhouseCoopers in the audit and financial advisory services groups. Mr. Erickson received his B.S. in Accounting from Colorado State University.
Chris Morley has served as President, Sales and Marketing since April 1, 2014 and previously served as President of IP, Colocation, and Ethernet since May 2012 and the Network Control Center since June 2013 and President of Waves and SONET since December 2013. Mr. Morley joined the Company in 2009 and served as Chief Financial Officer and Head of Product Management for the Zayo Bandwidth business unit until December 2010. From December 2010 through May 2012, Mr. Morley served as the President of zColo. From 2008 until joining the Company in 2009, Mr. Morley acted as an independent consultant advising operating companies and private equity investors on strategy, merger and acquisition due diligence, execution, and operational improvements. During 2006 and 2007, Mr. Morley served as part of the management team for One Communications Corporation, serving as Chief Integration Officer and the Executive Vice President of Operations and Networks. From 1999 to 2006, Mr. Morley served as part of the management team for Conversent Communications, LLC, serving as Executive Vice President of Operations and Engineering. Mr. Morley received his B.S. in Finance from the University of Denver.
Directors
Philip Canfield has served as a Director since July 2012. Mr. Canfield is a Managing Director of private equity firm GTCR LLC and currently co-heads GTCR’s Information Services & Technology investment team. Mr. Canfield joined GTCR in 1992 and became a Principal in 1997. From 1990 to 1992, he worked in the Corporate Finance Department at Kidder, Peabody and Company. Mr. Canfield formerly served as a director of Solera Holdings and currently serves on several private company boards. He holds an M.B.A. from the University of Chicago and a B.B.A. in finance with high honors from the Honors Business Program at the University of Texas. Mr. Canfield was appointed Director as a result of his extensive experience in corporate finance and in the telecommunications industry.
Gillis Cashman has served as a Director since May 2007. Mr. Cashman currently serves as a Managing Partner of M/C Partners, a private equity firm where he focuses on telecom and media infrastructure. He joined M/C Partners as an associate in 1999 and was promoted to partner in 2006 before his appointment to his current
97
Table of Contents
position in 2007. From 1997 to 1999, he was with Salomon Smith Barney in the Global Telecommunications Corporate Finance Group, where he focused on mergers and acquisitions in the wireline and wireless segments of the telecommunications industry. Mr. Cashman currently serves on several private company boards. Mr. Cashman received an AB in economics from Duke University. Mr. Cashman was appointed Director as a result of his merger and acquisition experience and portfolio company management evidenced by his current position at M/C Partners, where he leads the Broadband Infrastructure and Services portion of the M/C Partners portfolio.
Michael Choe has served as a Director since March 2009 and is the Chairman of the Compensation Committee. Mr. Choe is currently a Managing Director and President at Charlesbank Capital Partners LLC, a private equity firm where he is responsible for executing and monitoring investments in companies. He joined Harvard Private Capital Group, the predecessor to Charlesbank, in 1997, and was appointed as Managing Director in 2006. Prior to that he was with McKinsey & Company, where he focused on corporate strategy work in energy, health care, and media. Mr. Choe graduated from Harvard University with a B.A. in Biology. Mr. Choe currently serves on several private company boards. Mr. Choe was appointed Director as a result of his extensive experience with mergers and acquisitions of middle-market companies.
Stephanie Comfort has served as a Director since July 2013. Ms. Comfort has been an advisory partner with Genesis, Inc., a Denver-based consultancy since June 2013 where she provides strategy and investor relations consulting to companies in a broad range of industries. Prior to Genesis, Stephanie was Executive Vice President, Corporate Strategy and Development at CenturyLink. Serving in the same role at Qwest Communications International, she was one of four senior executives selected to join the CenturyLink Leadership Team, post-merger. During her ten years at both companies, Ms. Comfort’s responsibilities included corporate strategy, product innovation, brand strategy, investor relations and mergers and acquisitions. Before joining Qwest, Ms. Comfort held various management and analyst positions including 18 years covering the Telecommunications Services sector as a top-ranked sell-side analyst on Wall Street. Stephanie joined Qwest in 2002 from Morgan Stanley where she served as senior telecommunications services analyst, and was recognized as an “All-Star Analyst” by Institutional Investor Magazine and a “Top Stock Picker” by the Wall Street Journal. Stephanie holds an MBA from The Wharton School and a BA in Economics from Wellesley College. Ms. Comfort was appointed Director as a result of her experience in the telecommunications industry, specifically as it relates to operating companies, and her Wall Street investment experience.
Rick Connor has served as a Director and Chairman of the Audit Committee since June 2010. Mr. Connor is currently retired. Prior to his retirement in 2009, he was an audit partner with KPMG LLP where he served clients in the telecommunications, media, and energy industries for 38 years. From 1996 to 2008, he served as the Managing Partner of KPMG’s Denver office. Mr. Connor earned his B.S. degree in accounting from the University of Colorado. Mr. Connor was appointed Director and the Chairman of the Audit Committee as a result of his extensive technical accounting and auditing background, knowledge of SEC filing requirements and experience with telecommunications clients. Mr. Connor is a member of the Board of Directors and Chairman of the Audit Committee of Antero Resources Corporation, an independent oil and natural gas corporation. Mr. Connor is also a member of the Board of Directors and Chairman of the Audit Committee of Centerra Gold, Inc., a Toronto based gold mining company listed on the Toronto Stock Exchange.
Don Gips has served as a Director since July 2013. Mr. Gips served as the United States Ambassador to South Africa from July 2009 until January 2013 and is currently a Senior Counselor at the Albright Stonebridge Group, a global strategy firm headquartered in Washington, DC. He also serves as a Senior Advisor to the Blackstone Group and a Venture Partner at Columbia Capital. He is also the chairman of the U.S. Chamber of Commerce’s U.S.-South Africa Business Council. Mr. Gips served as assistant to President Obama on the Presidential Transition Team and then served in the White House, where he ran the office of Presidential Personnel. Mr. Gips previously served in the White House during the Clinton administration, working as Chief Domestic Policy Advisor to Vice President Al Gore. From 1998-2008, Mr. Gips was Group Vice President of Global Corporate Development for Level 3 Communications. Mr. Gips also served as Chief of the International
98
Table of Contents
Bureau at the Federal Communications Commission where he was responsible for WTO negotiations and spectrum policy. Before entering government, he was a management consultant to Fortune 500 companies at McKinsey & Company. Mr. Gips received an MBA from the Yale School of Management where he was recently honored as a Donaldson Fellow and received his undergraduate degree from Harvard University. Mr. Gips was appointed Director as a result of his extensive experience in the telecommunications industry.
Linda Rottenberg has served as a Director since May 2014. Ms. Rottenberg is the chief executive officer of Endeavor Global, Inc., a global nonprofit organization that she co-founded in 1997 and that catalyzes economic growth by selecting, mentoring and accelerating high-impact entrepreneurs around the world. In addition to her responsibilities at Endeavor, Ms. Rottenberg has been nominated to serve on the board of directors for Globant S.A. and serves on the advisory council of the Abraaj Group and on the World Economic Forum’s global steering committee on entrepreneurship. Ms. Rottenberg earned a law degree at Yale Law School and a bachelor’s degree from Harvard University. Ms. Rottenberg was appointed Director as a result of her extensive experience in entrepreneurship, innovation, business development, and leadership.
Board Composition
Our board of directors consists of eight directors, each of whom was appointed as a director pursuant to the then-effective Operating Agreement of CII as follows:
| • | Mr. Caruso was appointed as the current Chief Executive Officer and Chairman of our board of directors; |
| • | Mr. Choe was designated the designated appointee of Charlesbank Capital Partners; |
| • | Mr. Cashman was the designated appointee of M/C Partners; |
| • | Mr. Canfield was the designated appointee of GTCR LLC; and |
| • | Ms. Comfort, Mr. Gips, Mr. Connor, and Ms. Rottenberg were appointed as independent directors by a majority of the Board of Managers of CII. |
After the closing of this offering, there will be no contractual obligations regarding the election of our directors, and election of our directors will be governed by our amended and restated certificate of incorporation and amended and restated bylaws. Our current directors will continue to serve as directors until their resignations or until their successors are duly elected by holders of our common stock. It is anticipated that Mr. Cashman will resign from his director position in connection with the consummation of this offering.
Classified Board
Our amended and restated certificate of incorporation and amended and restated bylaws that will be in effect at the closing of this offering will provide for a classified board of directors consisting of three classes of directors, each serving staggered three-year terms. Our directors will be divided among the three classes as follows:
| • | Class I directors will be , whose initial terms will expire at the first annual meeting of stockholders following the closing of this offering; |
| • | Class II directors will be , whose initial terms will expire at the second annual meeting of stockholders following the closing of this offering; and |
| • | Class III directors will be , whose initial terms will expire at the third annual meeting of stockholders following the closing of this offering. |
Directors for a particular class will be elected for three-year terms at the annual meeting of stockholders in the year in which their term expires. As a result, only one class of directors will be elected at each annual
99
Table of Contents
meeting of our stockholders, with the other classes continuing for the remainder of their respective three-year terms. Each director’s term continues until the election and qualification of his successor, or his earlier death, resignation, or removal.
Director Independence
In , 2014, our board of directors undertook a review of the independence of our directors and considered whether any director has a material relationship with us that could compromise that director’s ability to exercise independent judgment in carrying out that director’s responsibilities. Our board of directors has affirmatively determined that each of is independent under the rules of the .
Committees of the Board
Our board of directors currently has an Audit Committee, a Compensation Committee, and a Nominating and Governance Committee. In the future, our board of directors may establish other committees, as it deems appropriate, to assist it with its responsibilities. The composition, duties, and responsibilities of our committees are as set forth below.
Audit Committee
Our Audit Committee will have the following responsibilities, among other things, as set forth in its written charter that will become effective upon the closing of this offering:
| • | appointing, reviewing, compensating, retaining, and overseeing our independent registered public accounting firm; |
| • | approving in advance any material engagement with our independent registered public accounting firm; |
| • | reviewing policies for our hiring of employees or former employees of the independent registered public accounting firm who participated in an audit of our company; |
| • | overseeing our internal audit function; |
| • | reviewing relevant financial reports, disclosures within those reports, accounting policies and practices, and the processes used to produce such reports; |
| • | preparing the audit committee report required to be included in our annual proxy statement; |
| • | reviewing and monitoring our accounting policies and practices, financial and accounting controls, and compliance with legal and regulatory requirements; and |
| • | reviewing and approving any related party transactions in accordance with our related party transactions policy, as in effect from time to time. |
Upon completion of this offering, our Audit Committee will consist of Mr. Connor, Ms. Comfort and , each of whom is a non-employee director who meets the applicable requirements for financial literacy. Our board of directors has determined that will qualify as an “audit committee financial expert,” as such term is defined in Item 407(d)(5) of Regulation S-K. In addition, our board of directors has determined that each of meets the definition of independent director for purposes of serving on an audit committee under Rule 10A-3 and the rules.
100
Table of Contents
Compensation Committee
Our Compensation Committee will have the following responsibilities, among other things, as set forth in its written charter that will become effective upon the closing of this offering:
| • | reviewing and approving goals and objectives relevant to the compensation of our Chief Executive Officer; |
| • | annually evaluating the performance of our Chief Executive Officer in light of such compensation goals and objectives and determining the compensation of our Chief Executive Officer; |
| • | annually reviewing and approving the compensation of our other executive officers; |
| • | overseeing and administering our compensation plans and making recommendations to the board with respect to such plans; |
| • | preparing the Compensation Committee report required to be included in our annual proxy statement; and |
| • | approving and amending the compensation of our non-employee directors. |
Upon the completion of this offering, our Compensation Committee will consist of Mr. Choe, Mr. Gips and Ms. Rottenberg. Our Board of Directors has determined that each of is a non-employee director as defined in Rule 16b-3 of the Exchange Act, an outside director as defined in Section 162(m) of the Internal Revenue Code, and meets the definition of an independent director for purposes of serving on a compensation committee under the rules.
Nominating and Governance Committee
Our Nominating and Governance Committee will have the following responsibilities, among other things, as set forth in its written charter that will become effective upon the closing of this offering:
| • | evaluating the appropriate size and composition of the board and evaluate proposed changes to the criteria for board membership; |
| • | evaluating the independence of existing and prospective directors; |
| • | identifying individuals qualified to become board members; |
| • | recommending qualified candidates for election to the board; |
| • | developing corporate governance guidelines; |
| • | overseeing the self-evaluation of the board and the board’s committees; and |
| • | making an annual report to the board on succession planning. |
Upon the completion of this offering, our Nominating and Governance Committee will consist of Mr. Canfield, Mr. Gips, and Ms. Rottenberg. Our Board of Directors has determined that each of is a non-employee director and meets the definition of an “independent” director under the rules.
Compensation Committee Interlocks and Insider Participation
In Fiscal 2013, the members of our Compensation Committee were Mr. Choe, Mr. Gips, Ms. Comfort, and John Downer, who resigned as a director on May 9, 2014. None of these individuals is an officer or employee, or former officer or employee, of us or any of our subsidiaries. Furthermore, none of our executive officers
101
Table of Contents
currently serves or in the past year has served as a member of the board of directors or compensation committee of any entity that has one or more executive officers serving on our board or compensation committee.
Code of Ethics
We have adopted a written code of conduct that serves as the code of ethics applicable to our directors, officers and employees, including our principal executive officer and senior financial officers, in accordance with Section 406 of the Sarbanes-Oxley Act of 2002 and the rules of the SEC. In the event that we make any changes to, or provide any waivers from, the provisions of our code of conduct applicable to our principal executive officer and senior financial officers, we intend to disclose such events on our website or in a report on Form 8-K within four business days of such event.
Board Leadership Structure
With respect to the roles of Chairman of the Board and Chief Executive Officer, our corporate governance guidelines, as will be in effect at to the completion of this offering, will provide that the roles may be separated or combined, and our board of directors exercises its discretion in combining or separating these positions as it deems appropriate in light of prevailing circumstances. Our board of directors believes that the combination or separation of these positions should continue to be considered as part of our succession planning process. As of the date of this offering, Mr. Caruso serves as both Chief Executive Officer and Chairman of the Board, which enables him to act as the key link between our board of directors and the other members of management. Our board of directors believes that his service in both roles is currently in the best interest of our Company and our stockholders, as it provides strong unified leadership for our Company.
Our corporate governance guidelines will provide that if the Chairman of the Board is a member of management, or if no Chairman of the Board has been elected, the board of directors may designate the Chairman of the Nominating and Governance Committee as the Lead Director. The Lead Director will, among other things, be responsible for coordinating any required executive sessions and be consulted in the determination of the frequency, place, time, and length of regular meetings of the board of directors. Our corporate governance guidelines will further provide the flexibility for our board of directors to modify our leadership structure in the future as appropriate. We believe that our Company, like many United States companies, is well served by this flexible leadership structure.
Risk Oversight
Our board of directors is responsible for overseeing our risk management process. Our board of directors focuses on our general risk management strategy, the most significant risks facing us, and oversees the implementation of risk mitigation strategies by management. Our board of directors is also apprised of particular risk management matters in connection with its general oversight and approval of corporate matters and significant transactions.
Risk Considerations in Compensation Programs
We conducted an assessment of our compensation policies and practices for our employees and concluded that these policies and practices are not reasonably likely to have a material adverse effect on our Company.
102
Table of Contents
Compensation Discussion and Analysis
The following Compensation Discussion and Analysis describes the material elements of compensation for our named executive officers for Fiscal 2014. When we refer to “named executive” or “named executive officer” in this section, we mean the five executives listed in the Summary Compensation Table, below.
Compensation Objectives
The Company has developed a talent philosophy statement that guides our compensation objectives and practices. The talent philosophy articulates the characteristics of employees that we seek to attract and retain in our quest to achieve our mission; it also captures the culture that we seek to foster in support of our mission statement.
Talent Philosophy. The Company seeks to be the employer of choice for highly skilled, entrepreneurial employees who are integral to being the premier provider of bandwidth infrastructure services. Specifically, the Company targets employees that:
| • | are top quartile talent, which is essential to be the premier provider; |
| • | are entrepreneurial, to foster an innovative environment and thought leadership, and an organization that thrives on change; |
| • | are customer oriented, to seek out simple and innovative ways to enamor our customers; |
| • | are technically adept, to ensure operational, network engineering and software development strength; |
| • | are interested in professional development, so we can develop future leadership and innovation; |
| • | are financially astute, given our over-riding equity IRR guiding principle and financially oriented culture; |
| • | value equity ownership, as we want employees who are motivated by participating in value creation for our stakeholders; and |
| • | are highly diverse, as a diverse workforce is more effective and fosters a healthier work environment. |
The objective of our compensation program is to enable us to attract and retain employees consistent with our talent philosophy, while rewarding and incentivizing our employees to achieve the Company’s mission statement. The first component of our compensation objectives is aggregate compensation levels that map to top quartile levels relative to those companies with which we compete for employees in order to obtain top quartile talent. The second component of our compensation objectives is the mix of current (cash) compensation and long-term compensation (equity), which is weighted towards long-term compensation in order to align interests of employees with those of investors. The third component of our compensation objectives is a focus on performance reflected in equity compensation currently denominated in common units that only generate value if there is an increase in the equity value of the Company after the date of grant. Substantially all of our employees have a material portion of their compensation tied to the Company’s performance, and a large portion of the overall compensation of our executives is comprised of long-term compensation.
Elements of Executive Compensation
The components of compensation for our executives are base salary, quarterly non-equity incentive compensation, equity participation, and benefits. In addition, in limited circumstances, the Compensation Committee may exercise its discretion to pay other cash bonuses. Total compensation is targeted in the top quartile for the industry and is based on the executive’s experience, historical performance and demands of the position. Total compensation increases based on the position and increased responsibility. Pursuant to our objective of aligning our executives’ interests with the interests of our equity holders, we create compensation packages that target top quartile industry levels by combining base salaries that are at or below industry levels with bonuses and equity incentives that are at or above industry levels. The percentage of compensation that is
103
Table of Contents
“at risk” also increases with position and responsibility. “At risk” compensation includes potential quarterly payouts under our non-equity incentive compensation plan and long-term incentive awards. Executives with greater roles in, and responsibility for, achieving our performance goals bear a greater proportion of the risk that those goals are not achieved and receive a greater proportion of the rewards if goals are met or surpassed.
Base Salary. We provide our executives with a base salary to provide them with an immediate financial incentive. Base salaries are determined based on (1) a review of salary ranges for similar positions at companies of similar size based on annual revenues, (2) the specific experience level of the executive and (3) expected contributions by the executive. Base salaries are generally below our peer companies. Base salaries are approved by the Board’s Compensation Committee and are based on the recommendation of our CEO, Mr. Caruso. Base salaries may be reviewed and adjusted from time to time based on individual merit, promotions or other changes in job responsibilities. There are no automatic increases in base salary.
During Fiscal 2014, Mr. Caruso, Mr. Morley, Mr. Erickson and Ms. Copeland each received an increase in base salary. Mr. Caruso’s base salary increased from $10,961 per annum to $400,000 per annum in conjunction with his entrance into a new employment agreement and the completion of vesting on his previously issued preferred units. Mr. Morley’s base salary increased from $200,000 per annum to $220,000, Mr. Erickson’s base salary increased from $200,000 per annum to $230,000 per annum and, Ms. Copeland’s base salary increased from $160,000 per annum to $200,000 per annum, in each case reflecting the increased scope and scale of the executives’ responsibilities largely resulting from the Fiscal 2013 and Fiscal 2014 acquisitions.
Non-Equity Incentive Compensation Plan. We also have a quarterly non-equity incentive compensation plan in which most of our full-time, non-sales employees, including our executives, participate. Similar to base salaries, this plan provides our executives with potential cash payments that act as an incentive for current performance, while also encouraging behavior that is consistent with our long-term goals.
We make non-equity incentive compensation plan payments to participating executives if quarterly financial performance targets and certain qualitative business unit and corporate objectives are met. The financial targets and business unit and corporate objectives are proposed by the CEO (who has historically not participated in the non-equity incentive compensation plan) and are approved by the Compensation Committee. Our CEO recommends to the Compensation Committee the quarterly payouts under this plan, from 0% to 200% of target payout, based on the achievement of the financial performance targets and his assessment of business unit and corporate objectives. The actual financial results may be adjusted up or down to account for certain non-recurring or unusual events, if approved by the Compensation Committee.
In Fiscal 2014, the quantitative performance threshold that formed the primary basis for non-equity incentive compensation plan payments was equity IRR. Equity IRR is calculated for each fiscal quarter payment on a rolling three quarter basis including the two quarters ending in the payout period and one quarter of forecasted performance. The threshold ranges and associated payout ranges for each quarter in Fiscal 2014 were as follows:
| Equity IRR Performance Threshold |
Non-Equity Incentive Compensation Plan | |
| Between 10% - 15% |
0% - 50% | |
| Between 15% - 25% |
50% -100% | |
| Between 25% - 35% |
100% -150% | |
| > 35% |
150% -200% |
Actual payouts under the plan are determined based on our CEO’s evaluation of performance against the quantitative performance thresholds, qualitative business unit and qualitative corporate objectives and are approved by our Compensation Committee.
104
Table of Contents
The table below shows the total target payouts and actual payouts under the non-equity incentive compensation plan for Fiscal 2014 for our named executive officers.
| Name |
Plan Target Payout |
Plan Actual Payout |
||||||
| Dan Caruso |
$ | — | $ | — | ||||
| Ken desGarennes |
$ | 120,000 | $ | 127,500 | ||||
| Chris Morley |
$ | 110,000 | $ | 108,359 | ||||
| Matt Erickson |
$ | 115,000 | $ | 119,727 | ||||
| Stephanie Copeland |
$ | 67,000 | $ | 70,048 | ||||
Upon reevaluating the current ratio of base salary, non-equity incentive compensation and equity compensation of our named executives, we may increase their non-equity incentive compensation plan targets in connection with any increase in their base salaries with the approval of the Compensation Committee.
In Fiscal 2014, Mr. Morley’s, Mr, Erickson’s and Ms. Copeland’s plan target payouts were each increased in conjunction with the aforementioned increase in their base salaries. Our CEO, Mr. Caruso, does not earn a quarterly payment under the non-equity incentive compensation plan and while his base salary was increased in Fiscal 2014, there was no change to his participation in the non-equity incentive compensation plan.
In the first quarter of Fiscal 2014, measured equity IRR was 29% indicating a non-equity incentive compensation plan payout of 100% to 150% of target. Actual payouts for the first quarter of Fiscal 2014 by named executive officer were as follows.
| Named Executive Officer |
Non-Equity Incentive Compensation Plan Payout of Target |
|||
| Dan Caruso |
0 | % | ||
| Ken desGarennes |
125 | % | ||
| Chris Morley |
125 | % | ||
| Matt Erickson |
125 | % | ||
| Stephanie Copeland |
125 | % | ||
At 125%, actual payouts for each named executive officer were in the middle of the payout range corresponding to the equity IRR performance threshold. Our CEO and Compensation Committee also evaluated performance against qualitative business unit and corporate objectives during the quarter. No adjustments related to business unit or corporate objectives were made to actual payouts for the first quarter of Fiscal 2014.
In the second quarter of Fiscal 2014, measured equity IRR was 21% indicating a non-equity incentive compensation plan payout of 50% to 100% of target. Actual payouts for the second quarter of Fiscal 2014 by named executive officer were as follows.
| Named Executive Officer |
Non-Equity Incentive Compensation Plan Payout of Target |
|||
| Dan Caruso |
0 | % | ||
| Ken desGarennes |
25 | % | ||
| Chris Morley |
0 | % | ||
| Matt Erickson |
25 | % | ||
| Stephanie Copeland |
50 | % | ||
While a 21% measured equity IRR indicated a payout in the 50% - 100% of target, actual payouts were 25% for Mr. desGarennes and Mr. Erickson. Mr. Morley’s 0% payout reflects his election to forgo a payout during the quarter in order to allocate additional non-equity incentive compensation to his direct reports. The reduction from the indicated payout was a result of an evaluation performance against other qualitative business unit and
105
Table of Contents
corporate objectives, most notably the lower than anticipated adjusted EBITDA growth rate. Ms. Copeland’s actual payout at 50% reflected the relatively strong performance against business unit objectives of the business units for which she was responsible.
In the third quarter of Fiscal 2014, measured equity IRR was 25% indicating a non-equity incentive compensation plan payout of 100% to 150% of target. Actual payouts for the third quarter of Fiscal 2014 by named executive officer were as follows.
| Named Executive Officer |
Non-Equity Incentive Compensation Plan Payout of Target |
|||
| Dan Caruso |
0 | % | ||
| Ken desGarennes |
175 | % | ||
| Chris Morley |
169 | % | ||
| Matt Erickson |
166 | % | ||
| Stephanie Copeland |
147 | % | ||
For all named executives who participate in the plan, actual payouts for the quarter were above the 100% - 150% of targeted indicated by the equity IRR performance. In each case, the excess payout was a reflection of success against qualitative business unit and corporate objectives. The primary factors impacting the success against business unit and corporate objectives were the favorable net installs (amount by which installs exceeded churn) and growing bookings.
In the fourth quarter of Fiscal 2014, measured equity IRR was 20% indicating a non-equity incentive compensation plan payout of 50% to 100% of target. Actual payouts for the fourth quarter of Fiscal 2014 by named executive officer were as follows.
| Named Executive Officer |
Non-Equity Incentive Compensation Plan Payout of Target |
|||
| Dan Caruso |
0 | % | ||
| Ken desGarennes |
100 | % | ||
| Chris Morley |
100 | % | ||
| Matt Erickson |
100 | % | ||
| Stephanie Copeland |
100 | % | ||
All participating named executives received payouts at the high end of the range indicated by the actual equity IRR performance. These payments were also in recognition of completion of various qualitative business unit and corporate objectives, including the substantial completion of three targeted acquisitions and significant preparatory work for this offering.
Equity. A significant percentage of total compensation for our executives consists of long-term incentive compensation in the form of equity. We believe equity ownership encourages executives to behave like owners and provides a clear link between the interest of executives and those of equity holders. In support of our compensation objectives, the value of equity compensation is generally above what management estimates to be the industry median, so that when combined with below or at median salaries and non-equity incentive compensation, they create total compensation in the top quartile of our industry generally.
Certain employees, including our executives, have been granted common units in CII, our indirect parent company prior to this offering. Upon a distribution at CII, the holders of common units are entitled to share in the proceeds of a distribution after certain obligations to the preferred unit holders are met. See Note 12—Equity to our audited consolidated financial statements for additional information on member’s equity of CII, including the common units.
Certain executives also received preferred units in CII. The preferred unit holders are not entitled to receive dividends or distributions (although CII may elect to include holders of preferred units in distributions at its
106
Table of Contents
discretion). Upon a distribution at CII the holders of preferred units are entitled to receive their unreturned capital contributions and a priority return of 6% prior to any distributions being made to common unit holders. After the unreturned capital contributions and priority returns are satisfied, preferred unit holders receive 80% to 85% of the proceeds of a distribution while the common unit holders receive the remaining 15% to 20%, depending on the aggregate of the preferred holders’ return on their investments.
Common units are awarded to executives upon hiring, and thereafter, at the discretion of the Compensation Committee based on the executives’ past or expected role in increasing our equity value. All of the granted common units are subject to the terms of employee equity agreements covering vesting and transfer, among other terms.
The Company makes grants of CII common units under its long-term incentive plan on a periodic basis (typically approximately every six months) and in conjunction with significant corporate events (acquisitions). During Fiscal 2014, the Company made three incremental grants of equity: Class I, Class J and Class K. Each of Class I and Class J grants were broad based grants to primarily existing employees. The Class K grant was more limited in nature and primarily targeted at newer employees who had not received significant grants in previous periods.
Each of the named executive officers received grants of Class I and Class J (but not Class K) common units during Fiscal 2014. These grants were consistent with our overall compensation objectives and we believe, in conjunction with the other elements of executive compensation, place our named executives’ compensation in the top quartile of our peers.
In making the Fiscal 2014 equity grants, our CEO and Compensation Committee evaluated a number of factors, including the following:
| • | previous equity grants and current fair value; |
| • | pro-forma ratio of vested to non-vested equity; |
| • | total amount of Class I and Class J grants and implied dilution; |
| • | recent performance of named executive officer and expectations for future contribution; and |
| • | total annual compensation. |
In evaluating the performance of the executives for purposes of the equity grants the CEO and Committee reviewed the equity IRR performance of the business units and the overall performance of the functions that directly reported to the executive. In the case of Mr. Caruso and Mr. desGarennes the primary focus was on the performance of the Company overall, including measured equity IRR. Ultimately, given the structure of the common units, the grants will only have realizable value if the Company’s overall equity value increases after the grant date and there is a liquidity event, and as such the CEO and committee used percentage of total grant to assist in the determination of such grants. The table below shows the percentage of each class of common units granted that the named executives received in Fiscal 2014.
| Named Executive/Equity Class |
Grant % of Total Equity Class | |||
| Dan Caruso |
||||
| Common I |
27.2 | % | ||
| Common J |
25.5 | % | ||
| Ken desGarennes |
||||
| Common I |
8.0 | % | ||
| Common J |
7.0 | % | ||
| Chris Morley |
||||
| Common I |
1.9 | % | ||
| Common J |
2.6 | % | ||
107
Table of Contents
| Named Executive/Equity Class |
Grant % of Total Equity Class | |||
| Matt Erickson |
||||
| Common I |
5.3 | % | ||
| Common J |
2.6 | % | ||
| Stephanie Copeland |
||||
| Common I |
0.4 | % | ||
| Common J |
0.9 | % | ||
Mr. Caruso has consistently received approximately 25% of the common units granted in a given class (with the exception of smaller classes largely targeted at select newer employees). Mr. Caruso’s grants in Fiscal 2014 are consistent with the Compensation Committee’s and Board’s evaluation of Mr. Caruso’s strong performance in setting Company strategy, growing the business and leading the organization. The amount of Mr. Caruso’s equity also reflects the fact that he received no non-equity based incentive compensation.
Mr. desGarennes’ grants in Fiscal 2014 reflect the recommendation of the CEO and approval of the Compensation Committee based on his past and expected continued effectiveness in leading the Company’s accounting, finance, tax, legal, corporate development and investor relations activities.
Mr. Morley’s grants in Fiscal 2014 reflect the CEO’s and Compensation Committee’s recognition of his broad experience leading various components of our business over time. Most recently Mr. Morley assumed responsibility for all sales and marketing related functions. Mr. Morley’s equity grants in conjunction with an increase in base salary are a result of his versatility and capabilities as a member of the executive team.
Mr. Erickson’s grants in Fiscal 2014 were deemed appropriate by the CEO and Compensation Committee given his large scope of responsibility over one of our three operating segments (Physical Infrastructure) and many of the core functional areas of the business. Combined with the increase in Mr. Erickson’s base salary during the Fiscal year, the equity grants are anticipated to provide annual compensation in the top quartile of our peers.
Ms. Copeland’s grants in Fiscal 2014 were recommended by the CEO and approved by the Compensation Committee based on her continued increase in scope and responsibility, most recently as the President of one of our operating segments (Lit Services).
Benefits. We offer our executives the same health and welfare benefit and disability plans that we offer to all of our employees. These benefits are consistent with industry norms and combined with the other elements of executive compensation are necessary to be competitive with peers in attracting and retaining talent.
Determination of Executive Compensation
Our CEO, Mr. Caruso, makes recommendations to the Compensation Committee regarding the total compensation of each executive (excluding himself), including base salary, non-equity incentive compensation, and equity participation as well as the financial targets, business unit and corporate objectives which determine non-equity incentive compensation payouts. The Compensation Committee considers the CEO’s recommendations in consultation with the full Board, and makes all final decisions for the total amount of compensation and each element of compensation for our executives, including Mr. Caruso.
Mr. Caruso and the Compensation Committee use their general knowledge of the compensation practices of other similar telecommunications companies and other private equity-owned companies in the formulation of their recommendations and decisions. The day-to-day design and administration of savings, health, welfare and paid time-off plans and policies applicable to our employees in general, including our executives, are handled by company management and our third-party service provider, ADP.
108
Table of Contents
Employment and Equity Arrangements
During Fiscal 2014, our named executives have been granted the following common units in CII as equity compensation for services rendered.
| Named executive/Equity class |
Units(1) | First vesting date | Vesting End | Grant date fair value(2) |
||||||||||||
| Dan Caruso |
||||||||||||||||
| Common I |
11,982,893 | 8/15/2014 | 8/15/2016 | $ | 3,235,381 | |||||||||||
| Common J |
14,964,119 | 2/15/2015 | 2/15/2017 | $ | 3,292,106 | |||||||||||
| Ken desGarennes |
||||||||||||||||
| Common I |
3,531,331 | 8/15/2014 | 8/15/2016 | $ | 953,459 | |||||||||||
| Common J |
4,097,330 | 2/15/2015 | 2/15/2017 | $ | 901,413 | |||||||||||
| Chris Morley |
||||||||||||||||
| Common I |
844,737 | 8/15/2014 | 8/15/2016 | $ | 228,079 | |||||||||||
| Common J |
1,549,982 | 2/15/2015 | 2/15/2017 | $ | 340,996 | |||||||||||
| Matt Erickson |
||||||||||||||||
| Common I |
2,326,336 | 8/15/2014 | 8/15/2016 | $ | 628,111 | |||||||||||
| Common J |
1,537,947 | 2/15/2015 | 2/15/2017 | $ | 338,348 | |||||||||||
| Stephanie Copeland |
||||||||||||||||
| Common I |
182,992 | 8/15/2014 | 8/15/2016 | $ | 49,408 | |||||||||||
| Common J |
519,536 | 2/15/2015 | 2/15/2017 | $ | 114,298 | |||||||||||
(1) Classes I and J common units vest 33.33% on the first vesting date and the remaining units vest pro-rata on a monthly basis over a period of two years after the first vesting date.
(2) Grant date fair value was measured at the end of the quarter in which the grant was made. Amounts represent the grant date fair value of $0.27 per unit for the Class I and $0.22 per unit for the Class J.
Accelerated Vesting. Under the respective Employee Equity Agreements for Messrs. desGarennes, Morley, and Erickson and Ms. Copeland, each of their unvested Units will immediately vest five months after the consummation of a sale of CII, provided that the relevant employee has remained continuously employed from the date of the relevant Employee Equity Agreement through the date of such sale and does not voluntarily terminate his employment prior to the expiration of such five months, and (i) all of the consideration paid in respect of such sale consists of cash or certain marketable securities or (ii) in the event that the consideration consists of other than cash or such securities, the board of directors of CII determines that such sale does not constitute a management control acquisition. For purposes of such Employee Equity Agreement, a “sale” of CII means any of (a) a merger or consolidation of CII or its subsidiaries into or with any other person or persons, or a transfer of units in a single transaction or a series of transactions, in which in any case the members of CII or the members of its subsidiaries immediately prior to such merger, consolidation, sale, exchange, conveyance or other disposition or first of such series of transactions possess less than a majority of the voting power of CII’s or its subsidiaries’ or any successor entity’s issued and outstanding capital securities immediately after such transaction or series of such transactions; or (b) a single transaction or series of transactions, pursuant to which a person or persons who are not direct or indirect wholly-owned subsidiaries of CII acquire all, or substantially all, of CII’s or its subsidiaries’ assets determined on a consolidated basis, in each case, other than (i) the issuance of additional capital securities in a public offering or private offering for the account of CII or (ii) a foreclosure or similar transfer of equity occurring in connection with a creditor exercising remedies upon the default of any indebtedness of CII. Further, for purposes of such Employee Equity Agreement, “management control acquisition” is defined as a sale of CII with respect to which (i) immediately prior to such sale of CII, Dan Caruso is serving CII as chief executive officer and (ii) after giving effect to the consummation of the sale of CII, Dan Caruso is the chief executive officer of the combined company resulting from such sale of CII.
Employment Agreement. Dan Caruso is a founder of the Company and its subsidiaries and owns a substantial amount of equity of CII. Mr. Caruso currently acts as our Chief Executive Officer. Mr. Caruso is party to an employment agreement effective February 15, 2014. Under the terms of that employment agreement,
109
Table of Contents
Mr. Caruso reports directly to the Boards of Managers of CII and ZGL for a term expiring July 2, 2017, unless earlier terminated under the terms thereof. Mr. Caruso will initially receive a base salary of $400,000 per annum, which amount will be renegotiated on an annual basis, and will also be eligible to participate in other benefit plans generally available to our senior executive officers. The employment agreement may be terminated by Mr. Caruso, CII or us for any or no reason at any time subject to certain conditions. If Mr. Caruso resigns for Good Reason or is terminated without Cause (as such terms are defined in the employment agreement), or upon his death, he will be entitled to receive his base salary through the termination date and any accrued benefits, and all of his unvested common units will immediately be deemed fully vested as of the termination date. Mr. Caruso is restricted from participating in a competing business and soliciting our current customers or hiring our existing employees or contractors through July 2, 2017, except that these restrictions will not apply to Mr. Caruso in the event of a Company sale, his termination without Cause or his voluntary resignation with Good Reason or in certain other circumstances set forth in the employment agreement.
The employment agreement also confirmed that Mr. Caruso’s previously issued equity compensation awards of common units and preferred units in CII fully vested as of February 15, 2014, except with respect to certain unvested common units that vest as provided in Schedule A to the employment agreement. In accordance with Schedule A, Mr. Caruso’s unvested common units will vest one-third on the first anniversary of the grant date and thereafter one-thirty sixth of the total number of units in the grant will vest each month until fully vested on the third anniversary of the grant date. We have the right to repurchase vested units held by Mr. Caruso at fair market value upon a breach by Mr. Caruso of any term of his employment agreement or certain other agreements with us. Mr. Caruso is also eligible to participate in our non-equity incentive programs for executive officers but did not participate in Fiscal 2014.and is not expected to participate in future periods.
Also on February 15, 2014, we and CII approved an advance distribution of cash to Mr. Caruso in respect of his common units in the amount of $3,000,000 pursuant to a letter agreement with Mr. Caruso. Accordingly, Mr. Caruso will forfeit the first $3,000,000 in future distributions made in respect of his common units under the CII Operating Agreement.
We do not maintain any employment agreements with any of our other named executive officers.
Summary Compensation Table
The following summary compensation table sets forth information concerning the annual and long-term compensation earned by our named executive officers in Fiscal 2014 and Fiscal 2013.
| Name and Principal Position |
Fiscal Year |
Salary ($) |
Stock Awards ($)(1) |
Non-Equity Incentive Plan Compensation ($)(2) |
All Other Compensation ($) |
Total ($) |
||||||||||||||||||
| Dan Caruso |
2014 | 270,317 | 6,527,487 | — | — | 6,797,804 | ||||||||||||||||||
| Chief Executive Officer |
2013 | 10,951 | 17,920,646 | — | — | 17,931,597 | ||||||||||||||||||
| Ken desGarennes |
2014 | 240,000 | 1,854,872 | 120,000 | — | 2,214,872 | ||||||||||||||||||
| Chief Financial Officer |
2013 | 240,000 | 7,865,262 | 210,000 | — | 8,315,262 | ||||||||||||||||||
| Chris Morley |
2014 | 215,000 | 569,075 | 112,109 | — | 896,184 | ||||||||||||||||||
| President, Sales and Marketing |
2013 | 200,000 | 2,034,084 | 168,750 | — | 2,402,834 | ||||||||||||||||||
| Matt Erickson |
2014 | 222,500 | 966,459 | 122,227 | — | 1,311,186 | ||||||||||||||||||
| President, Zayo Physical Infrastructure |
2013 | 200,000 | 3,004,713 | 181,250 | — | 3,385,962 | ||||||||||||||||||
| Stephanie Copeland |
2014 | 169,384 | 163,706 | 59,048 | — | 392,138 | ||||||||||||||||||
| President, Zayo Lit Services |
2013 | 160,000 | 882,605 | 59,500 | 60,000 | (3) | 1,162,105 | |||||||||||||||||
(1) Amounts shown reflect the fair value calculated in accordance with Financial Accounting Standards Board Accounting Standards Codification 718-10-10, for the fiscal years ended June 30, 2014, and June 30, 2013. Grant date fair value was measured at the end of the quarter in which the grant was made. Assumptions used to
110
Table of Contents
determine these values can be found in Note 14—Fair Value Measurements of our audited consolidated financial statements.
(2) Comprises compensation earned in the respective year under our quarterly non-equity incentive plan, which we describe under “—Compensation Discussion and Analysis—Elements of Executive Compensation—Non-Equity Incentive Compensation Plan.”
(3) Ms. Copeland received additional cash compensation in Fiscal 2014 intended to compensate her for taxes incurred on the fair market value of the Class F common units that she received.
Grants of Plan Based Awards in Fiscal 2014
The following table provides information about grants of plan-based awards to our named executive officers in Fiscal 2014 and non-equity incentive plan award information for Fiscal 2014:
| Name |
Grant Date | Fiscal 2014 Non-Equity Incentive
Plan Target(1) |
All Other Stock Awards: Number of Shares of Stock or Units (#)(2) |
Grant Date Fair Value of Stock($)(3) |
||||||||||||||||||||
| Threshold | Target ($) | Maximum | ||||||||||||||||||||||
| Dan Caruso |
8/15/2013 | — | — | — | 11,982,893 | 3,235,381 | ||||||||||||||||||
| 2/15/2014 | — | — | — | 14,964,119 | 3,292,106 | |||||||||||||||||||
| Ken desGarennes |
N/A | — | 120,000 | 240,000 | — | — | ||||||||||||||||||
| 8/15/2013 | — | — | — | 3,531,331 | 953,459 | |||||||||||||||||||
| 2/15/2014 | — | — | — | 4,097,330 | 901,413 | |||||||||||||||||||
| Chris Morley |
N/A | — | 110,000 | 220,000 | — | — | ||||||||||||||||||
| 8/15/2013 | — | — | — | 844,737 | 228,079 | |||||||||||||||||||
| 2/15/2014 | — | — | — | 1,549,982 | 340,996 | |||||||||||||||||||
| Matt Erickson |
N/A | — | 115,000 | 230,000 | — | — | ||||||||||||||||||
| 8/15/2013 | — | — | — | 2,326,336 | 628,111 | |||||||||||||||||||
| 2/15/2014 | — | — | — | 1,537,947 | 338,348 | |||||||||||||||||||
| Stephanie Copeland |
N/A | — | 67,000 | 134,000 | — | — | ||||||||||||||||||
| 8/15/2013 | — | — | — | 182,992 | 49,408 | |||||||||||||||||||
| 2/15/2014 | — | — | — | 519,536 | 114,298 | |||||||||||||||||||
(1) These figures represent the threshold, target and maximum annual cash payout opportunity for each executive under our non-equity incentive compensation plan during Fiscal 2014 (See “—Compensation Discussion and Analysis—Elements of Executive Compensation—Non-Equity Incentive Compensation Plan” for additional information regarding this plan and the actual payouts for Fiscal 2014).
(2) The awards shown in this column vest over three years, 33.33% on the first anniversary of the grant date and the remaining units vest pro-rata on a monthly basis over a period of two years after the first vesting date.
(3) Grant date fair value was measured at the end of the quarter in which the grant was made.
Outstanding Equity Awards at 2014 Fiscal Year End
The table below lists the number and value of CII equity awards that have not vested at year end of Fiscal 2014:
| Name |
Number of Shares or Units of Stock that have not Vested (#) |
Market Value of Shares or Units of Stock that have not Vested ($)(1) |
||||||
| Dan Caruso |
61,747,655 | (2)(7) | 38,616,230 | |||||
| Ken desGarennes |
23,870,232 | (3)(8) | 16,113,226 | |||||
| Chris Morley |
6,624,875 | (4)(9) | 4,343,859 | |||||
| Matt Erickson |
9,923,207 | (5)(10) | 6,587,311 | |||||
| Stephanie Copeland |
1,924,981 | (6)(11) | 1,324,225 | |||||
111
Table of Contents
(1) Market value is based on the following fair value estimates at the end of Fiscal 2014.
| Class |
Fair Value | |||
| Preferred Unit C |
$ | 9.06 | ||
| Common Unit A |
2.47 | |||
| Common Unit B |
2.22 | |||
| Common Unit C |
1.92 | |||
| Common Unit D |
1.86 | |||
| Common Unit E |
1.62 | |||
| Common Unit F |
1.44 | |||
| Common Unit G |
0.82 | |||
| Common Unit H |
0.70 | |||
| Common Unit I |
0.45 | |||
| Common Unit J |
0.33 | |||
(2) Includes unvested Class F, G, H, I and J Common Units.
(3) Includes unvested Class F, G, H, I and J Common Units.
(4) Includes unvested Class F, G, H, I and J Common Units.
(5) Includes unvested Class F, G, H, I and J Common Units.
(6) Includes unvested Class F, G, H, I and J Common Units.
(7) 39,971,731, 17,784,848 and 3,991,076 units will vest during Fiscal 2015, 2016 and 2017, respectively.
(8) 14,575,746, 7,087,778 and 3,991,076 units will vest during Fiscal 2015, 2016 and 2017, respectively.
(9) 3,984,640, 1,974,176 and 666,058 units will vest during Fiscal 2015, 2016 and 2017, respectively.
(10) 6,167,824, 2,773,466 and 981,916 units will vest during Fiscal 2015, 2016 and 2017, respectively.
(11) 1,329,641, 469,721 and 125,619 units will vest during Fiscal 2015, 2016 and 2017, respectively.
Option Exercises and Stock Vested in 2014
The table below sets forth the CII equity awards that vested during Fiscal 2014:
| Name |
Number of Shares or Units of Stock that Vested in 2014(#) |
Market Value of Shares or Units of Stock that Vested in 2014($)(1) |
||||||
| Dan Caruso |
43,992,491 | 39,206,710 | ||||||
| Ken desGarennes |
18,922,194 | 17,393,910 | ||||||
| Chris Morley |
4,906,412 | 4,535,580 | ||||||
| Matt Erickson |
7,492,746 | 6,969,441 | ||||||
| Stephanie Copeland |
1,738,271 | 1,554,198 | ||||||
(1) See “—Compensation Discussion and Analysis—Outstanding Equity Awards at 2014 fiscal year end” for June 30, 2014 fair value estimates by class.
Pension Benefits for Fiscal 2014
We do not maintain a defined benefit pension plan, and there were no pension benefits earned by our executives in the year ended June 30, 2014
Nonqualified Defined Contribution and Other Nonqualified Deferred Compensation Plans
We do not have any nonqualified defined contribution or other nonqualified deferred compensation plans covering our executives.
112
Table of Contents
Potential Payments upon Termination or Change-in-Control
As a general practice the executives are not entitled to any payments upon termination or change-in-control other than those rights provided in the Employee Equity Agreements. See “—Compensation Discussion and Analysis—Employment and Equity Arrangements” above for information regarding vesting of equity in CII upon a change of control of CII. The following table sets forth information about the market value of unvested CII units held by each of the named executive officers, which would have accelerated upon a change in control on the last day of Fiscal Year 2014:
| Name |
Market Value of Unvested Units as at June 30, 2014 that would vest upon Change in Control ($) (1) |
Market Value of Unvested Units as at June 30, 2014 that would vest upon resignation for good reason, termination without cause or death |
||||||
| Dan Caruso |
38,616,230 | 38,616,230 | ||||||
| Ken desGarennes |
16,113,226 | — | ||||||
| Chris Morley |
4,343,859 | — | ||||||
| Matt Erickson |
6,587,311 | — | ||||||
| Stephanie Copeland |
1,324,225 | — | ||||||
(1) See “—Outstanding Equity Awards at 2014 Fiscal Year End” for June 30, 2014 fair value estimates by class.
Director Compensation
During Fiscal 2014, our Board was comprised of our Chief Executive Officer, representatives from a subset of our private equity investors, and four outside, non-employee directors. Neither our employee directors nor the director representatives from our private equity investors received any compensation for their services on either the Board or Committees of the Board during Fiscal 2014. The following table details the compensation paid to our non-employee directors that served on the Board during Fiscal 2014. Ms. Rottenberg was appointed as an outside, non-employee director effective May 9, 2014 and did not receive compensation for her services during Fiscal 2014.
| Name |
Fees Earned or Paid in Cash ($) |
Stock Awards($)(1)(2) | Non-equity Incentive Plan Compensation ($) |
All other Compensation ($)(3) |
Total ($) | |||||||||||||||
| Rick Connor |
42,500 | 321,010 | — | 146,362 | 509,872 | |||||||||||||||
| Don Gips |
35,000 | 201,538 | — | 117,342 | 353,880 | |||||||||||||||
| Stephanie Comfort |
37,000 | 211,766 | — | 127,017 | 376,283 | |||||||||||||||
| Linda Rottenberg |
— | 261,756 | — | — | 261,756 | |||||||||||||||
(1) As of June 30, 2014, each independent board member held the following numbers of outstanding unvested units: Mr. Connor—66,667 Class F common units, 343,069 Class G common units, 357,600 Class H common units, 306,512 Class I common units, 18,896 Class J common units and 27,447 Class C preferred units; Mr. Gips—179,647 Class H common units, 16,148 Class I common units, 45,000 Class J common units and 21,958 Class C preferred units; Ms. Comfort—194,617 Class H common units, 17,494 Class I common units, 18,896 Class J common units and 23,788 Class C preferred units; Ms. Rottenberg—33,260 Class C preferred units.
(2) Grant date fair value was measured at the end of the quarter in which the grant was made.
113
Table of Contents
(3) Mr. Connor, Mr. Gips and Ms. Comfort each received additional cash compensation in Fiscal 2014 intended to compensate them for the taxes incurred on the fair market value of the Class C Preferred and Class H Common Units received.
During Fiscal 2014, the independent board member compensation plan consists of an annual retainer of $30,000 for each independent director for their Board membership and separate annual fees for committee chairmanship and membership. These separate fees for independent directors are comprised of an annual fee of $12,500 for the chairmanship of the audit committee and $5,000 for the chairmanship of the compensation committee. In addition, each independent director who is a member, other than the chairman, of the audit committee receives an annual fee of $5,000, and an independent director who is a member, other than the chairman, of the compensation committee or nominating and governance committee receives an annual fee of $2,500.
During Fiscal 2014, Mr. Connor was granted 24,447 Class C Preferred Units and 224,558 Class H, 306,512 Class I, and 18,896 Class J Common Units, of which 33.3% vested or will vest on July 1, 2014 for the Class C Preferred Units and Class H Common Units and August 15, 2014 and February 15, 2015 for the Class I and Class J Common Units, and the remainder will vest pro rata on a monthly basis over the two-year periods ending on July 1, 2016 for the Class C Preferred Units and Class H Common Units and August 15, 2016 and February 15, 2017 for the Class I and Class J Common Units. The grant date fair value of Mr. Connor’s Class C Preferred Units and Class H, Class I and Class J Common Units was $148,763 and $85,332, $82,758, and $4,157, respectively.
During Fiscal 2014, Mr. Gips was granted 21,958 Class C Preferred Units and 179,647 Class H, 16,148 Class I, and 45,000 Class J Common Units, of which 33.3% vested or will vest on July 1, 2014 for the Class C Preferred Units and Class H Common Units and August 15, 2014 and February 15, 2015 for the Class I and Class J Common Units, and the remainder will vest pro rata on a monthly basis over the two-year periods ending on July 1, 2016 for the Class C Preferred Units and Class H Common Units and August 15, 2016 and February 15, 2017 for the Class I and Class J Common Units. The grant date fair value of Mr. Gips’ Class C Preferred Units and Class H, Class I and Class J Common Units was $119,012 and $68,266, $4,360, and $9,900, respectively.
During Fiscal 2014, Ms. Comfort was granted 23,788 Class C Preferred Units and 194,617 Class H, 17,494 Class I, and 18,896 Class J Common Units, of which 33.3% vested or will vest on July 1, 2014 for the Class C Preferred Units and Class H Common Units and August 15, 2014 and February 15, 2015 for the Class I and Class J Common Units, and the remainder will vest pro rata on a monthly basis over the two-year periods ending on July 1, 2016 for the Class C Preferred Units and Class H Common Units and August 15, 2016 and February 15, 2017 for the Class I and Class J Common Units. The grant date fair value of Ms. Comfort’s Class C Preferred Units and Class H, Class I and Class J Common Units was $128,931 and $73,954, $4,723, and $4,157, respectively.
During Fiscal 2014, Ms. Rottenberg was granted 33,260 Class C Preferred Units, of which 25% or 8,315 units will vest on each of October 1, 2014, January 1, 2015, April 1, 2015, and July 1, 2015. The grant date fair value of Ms. Rottenberg’s Class C Preferred Units was $261,756.
We reimburse our non-employee directors for travel, lodging and other reasonable out-of-pocket expenses in connection with the attendance at Board and committee meetings. We also provide liability insurance for our directors and officers.
114
Table of Contents
PRINCIPAL AND SELLING STOCKHOLDERS
The following table sets forth information as of , 2014 regarding the beneficial ownership of our common stock immediately prior to this offering and as adjusted to give effect to this offering by:
| • | each person or group who is known by us to own beneficially more than 5% of our outstanding shares of our common stock; |
| • | each of our named executive officers; |
| • | each of our directors; |
| • | each of our selling stockholders; and |
| • | all of our current executive officers and directors as a group. |
For further information regarding material transactions between us and our stockholders or their affiliates, see “Certain Relationships and Related Party Transactions.”
Beneficial ownership for the purposes of the following table is determined in accordance with the rules and regulations of the SEC. These rules generally provide that a person is the beneficial owner of securities if such person has or shares the power to vote or direct the voting thereof, or to dispose or direct the disposition thereof or has the right to acquire such powers within 60 days. Percentages of beneficial ownership are based on (i) shares of common stock to be outstanding after the Restructuring but prior to the completion of this offering, (ii) shares of common stock to be outstanding after the completion of this offering, assuming no exercise of the underwriters’ option to purchase additional shares, and (iii) shares of common stock to be outstanding after the completion of this offering, assuming full exercise of the underwriters’ option to purchase additional shares. Except as disclosed in the footnotes to this table and subject to applicable community property laws, we believe that each stockholder identified in the table possesses sole voting and investment power over all shares of common stock shown as beneficially owned by the stockholder. Unless otherwise indicated in the table or footnotes below, the address for each beneficial owner is c/o Zayo Group Holdings, Inc., 1805 29th Street, Suite 2050, Boulder, CO 80301.
115
Table of Contents
| Shares Beneficially Owned Prior to This Offering |
Shares to be Sold in This Offering |
Shares Beneficially Owned After This Offering Assuming No Exercise of Option to Purchase Additional Shares |
Shares Beneficially Owned After This Offering Assuming Full Exercise of Option to Purchase Additional Shares | |||||||||||
| Name |
Number | Percent | Number | Number | Percent | Number | Percent | |||||||
| 5% Stockholders |
||||||||||||||
| Battery Ventures(1) |
||||||||||||||
| Charlesbank Capital Partners(2)(7) |
||||||||||||||
| Columbia Capital(3) |
||||||||||||||
| GTCR LLC(4)(9) |
||||||||||||||
| M/C Partners(5)(8) |
||||||||||||||
| Oak Investment Partners XII, Limited Partnership(6) |
||||||||||||||
| Our Directors |
||||||||||||||
| Dan Caruso |
||||||||||||||
| Michael Choe(7) |
||||||||||||||
| Gillis Cashman(8) |
||||||||||||||
| Rick Connor |
||||||||||||||
| Phil Canfield(9) |
||||||||||||||
| Stephanie Comfort |
||||||||||||||
| Don Gips |
||||||||||||||
| Linda Rottenberg |
||||||||||||||
| Our Named Executive Officers |
||||||||||||||
| Ken desGarennes |
||||||||||||||
| Chris Morley |
||||||||||||||
| Matt Erickson |
||||||||||||||
| Stephanie Copeland |
||||||||||||||
| All directors and executive officers as a group |
||||||||||||||
| Other Selling Stockholders |
||||||||||||||
| * | Less than 1% |
(1) Consists of (i) shares held of record by Battery Ventures VII, L.P. (“Battery Ventures VII”); (ii) shares held of record by Battery Investment Partners VII, LLC (“BIP VII”); and (iii) shares held of record by Battery Ventures VIII, L.P. (“Battery Ventures VIII”). Battery Partners VII, LLC (“BPVII”) is the sole general partner of Battery Ventures VII and the sole managing member of BIP VII. BPVII’s investment adviser is Battery Management Corp. (together with BPVII, the “Battery VII Companies”). Thomas J. Crotty, Richard D. Frisbie, Kenneth P. Lawler, R. David Tabors and Scott R. Tobin are the managing members and officers of the Battery VII Companies and share voting and dispositive power with respect to the shares held by Battery Ventures VII and BIP VII. Battery Partners VIII, LLC (“BPVIII”) is the sole general partner of Battery Ventures VIII. BPVIII’s investment adviser is Battery Management Corp. (together with BPVIII, the “Battery VIII Companies”). Neeraj Agrawal, Michael M. Brown, Thomas J. Crotty, Richard D. Frisbie, Kenneth P. Lawler, R. David Tabors, Scott R. Tobin and Roger H. Lee are the managing members and officers of the Battery VIII Companies and share voting and dispositive power with respect to the shares held by Battery Ventures VIII. Each of the foregoing persons disclaims beneficial ownership of these shares except to the extent of his pecuniary interest therein. The address for each of these entities is c/o Battery Ventures, One Marina Park Drive, Suite 1100, Boston, Massachusetts 02210.
(2) Aggregate holdings of Charlesbank Equity Fund VI, LP, CB Offshore Equity Fund VI, LP, Charlesbank Equity Coinvestment Fund VI, LP, and Charlesbank Equity Coinvestment Partners, LP. The address for all four entities is 200 Clarendon, 5th Floor, Boston, MA 02116.
(3) Aggregate holdings of Columbia Capital Equity Partners IV (QP), L.P., Columbia Capital Equity Partners IV (QPCO), L.P., Columbia Capital Employee Investors IV, L.P., Columbia Capital Equity Partners III (QP), L.P., Columbia Capital Equity Partners III (Cayman) L.P., Columbia Capital Equity Partners III (AI), L.P., Columbia Capital Investors III, L.L.C., and Columbia Capital Employee Investors III, L.L.C. The address for all eight entities is 204 S. Union Street, Alexandria, VA, 22302.
(4) Aggregate holdings of GTCR Fund X/A, LP, GTCR Fund VC, LP, GTCR Co-Invest X, LP. The address for all three entities is 300 North LaSalle Street, Suite 5600, Chicago, IL, 60654.
116
Table of Contents
(5) Aggregate holdings of M/C Venture Partners VI, L.P., M/C Venture Investors, L.L.C., M/C Venture Partners V, L.P., and Chestnut Venture Partners, L.P. The address for all four entities is 75 State Street, Suite 2500, Boston, MA, 02109.
(6) Address is 525 University Avenue, Suite 1300, Palo Alto, CA 94301.
(7) Michael Choe is the Managing Director of Charlesbank Capital Partners and has voting control and investment power over the shares held by Charlesbank Capital Partners, but disclaims beneficial ownership of such shares except to the extent of his pecuniary interest therein.
(8) Gillis Cashman is a Managing Partner of M/C Partners and has voting control and investment power over the shares held by M/C Partners, but disclaims beneficial ownership of such shares except to the extent of his pecuniary interest therein.
(9) Phil Canfield is a Principal of GTCR LLC and has voting control and investment power over the shares held by GTCR LLC, but disclaims beneficial ownership of such shares except to the extent of his pecuniary interest therein.
117
Table of Contents
CERTAIN RELATIONSHIPS AND RELATED PARTY TRANSACTIONS
Services Provided to and by Onvoy, LLC
On June 13, 2014, we spun off Onvoy to CII. However, we continue to have certain ongoing contractual relationships with Onvoy, which are based on agreements between Onvoy and us entered into at rates that we believe approximate market rates.
We have entered into a Master Services Agreement with Onvoy that requires us to provide the following services to Onvoy:
| • | Transport services for circuits. |
| • | Leases of colocation racks in various markets. |
| • | Fiber and optronics management. |
| • | Leases of colocation racks at the colocation facility at 60 Hudson Street, New York, New York. |
We have entered into a Master Services Agreement with Onvoy that requires Onvoy to provide the following services to us:
| • | Agent services for customer referrals. |
| • | Fiber IRU and services related to fiber in Minnesota. |
| • | Transport services covering lit services. |
| • | Sublease for space in Minneapolis and Plymouth, Minnesota. |
| • | Lease of colocation racks. |
| • | Agreements covering VoIP and switching services. |
In connection with the spin-off, we have entered into a transition services agreement with Onvoy under which we have agreed to continue to provide Onvoy with certain corporate services, including assistance with income, sales/use, property tax and regulatory tax filings, audit and accounting matters, insurance coverage, and treasury support, during a transitional period ending March 31, 2015.
We have also entered into an agreement with Onvoy on certain tax matters, under which we have agreed to indemnify Onvoy for any tax liability imposed on Onvoy or its subsidiaries for all pre-spin periods.
The revenue and expenses associated with transactions with Onvoy have been recorded in results from discontinued operations.
We or Onvoy may terminate existing contracts in the future, or we may enter into additional or other contractual arrangements with Onvoy as a result of which our contractual relationship with Onvoy and the payments among us and Onvoy pursuant to such contracts may substantially change.
118
Table of Contents
The following table represents the revenue and expense transactions we recognized with Onvoy for the periods presented:
| Year Ended June 30, | ||||||||||||
| 2011 | 2012 | 2013 | ||||||||||
| Revenues |
$ | 6,376 | $ | 6,467 | $ | 6,639 | ||||||
|
|
|
|
|
|
|
|||||||
| Operating costs |
$ | (2,616 | ) | $ | (2,675 | ) | $ | (1,515 | ) | |||
|
|
|
|
|
|
|
|||||||
| Net |
$ | 3,760 | $ | 3,792 | $ | 5,124 | ||||||
|
|
|
|
|
|
|
|||||||
Purchase of Previously Outstanding Notes
On September 14, 2010, Dan Caruso, our President, Chief Executive Officer and Director, purchased $0.5 million (face amount) of ZGL’s notes in connection with its $100.0 million notes offering on September 20, 2010. The purchase price of the notes purchased by Mr. Caruso was $0.5 million, including the premium on the notes and accrued interest. On July 2, 2012, in connection with the AboveNet Acquisition, we repaid our previously outstanding notes. Mr. Caruso’s notes were repurchased for $0.5 million.
Executive Aircraft Agreement
Dan Caruso, our Chief Executive Officer, is a party to an aircraft charter (or membership) agreement through his affiliate, Bear Equity LLC, for business and personal travel. Under the terms of the charter agreement, all fees for the use of the aircraft are effectively variable in nature. For his business travel on behalf of the Company, Mr. Caruso is reimbursed for his use of the aircraft subject to quarterly and annual maximum reimbursement thresholds approved by the our Nominating and Governance Committee. During the nine months ended March 31, 2014, we reimbursed Mr. Caruso approximately $143,000 for his business use of the aircraft.
Purchase of Unsecured Notes
On June 28, 2012, Matt Erickson, the President of Zayo Physical Infrastructure, purchased $0.6 million in aggregate principal amount of ZGL’s 10.125% senior unsecured notes due 2020 at the offering price for such notes. Mr. Erickson qualifies as an “accredited investor” (as defined in Rule 501 under the Securities Act), and this purchase was on terms available to other investors. As of March 31, 2014, the principal amount outstanding was $0.6 million.
Transactions with CII
As of July 1, 2011, ZGL had a balance due to CII of $4.6 million. The liability with CII related to an interest payment made by CII on the Notes. During the year ended June 30, 2012, CII made an additional interest payment of $11.0 million on behalf of the Company. During the quarter ended June 30, 2012, the ZGL and CII agreed to settle the then outstanding payable to CII in the amount of $15.5 million through an increase in CII’s equity interest in ZGL. There were no transactions with CII during the year ended June 30, 2013.
Registration Rights Agreement
After the completion of this offering, will be entitled to certain rights with respect to the registration under the Securities Act of our common stock that it owns, under the terms of a registration rights agreement between us and .
Our Policy Regarding Related Party Transactions
Our board of directors will have adopted a written related person transaction policy prior to the closing of this offering, which will set forth the policies and procedures for the review and approval or ratification of related party transactions.
119
Table of Contents
DESCRIPTION OF CERTAIN INDEBTEDNESS
The following is a summary of provisions relating to our material indebtedness, all of which was incurred by our subsidiaries, ZGL and Zayo Capital Inc. The following summary does not purport to be complete and is subject to, and qualified in its entirety by reference to, the provisions of the corresponding agreements, including the definitions of certain terms therein that are not otherwise defined in this prospectus.
Outstanding Notes
On July 2, 2012, we issued $750.0 million aggregate principal amount of 8.125% senior secured first-priority notes due 2020 (the “Senior Secured Notes”) and $500.0 million aggregate principal amount of 10.125% senior unsecured notes due 2020 (“Senior Unsecured Notes”, and collectively with the Senior Secured Notes, the “Notes”). Interest on the Notes is payable on January 1 and July 1 of each year. The Senior Secured Notes will mature on January 1, 2020, and the Senior Unsecured Notes will mature on July 1, 2020. At any time on or after July 1, 2015 or July 1, 2016, we may redeem the Senior Secured Notes or the Senior Unsecured Notes, respectively, in whole or in part, at the applicable redemption prices set forth in the applicable indenture, plus accrued and unpaid interest. Before July 1, 2015 or July 1, 2016, we may redeem the Senior Secured Notes or the Senior Unsecured Notes, respectively, in whole or in part, at a redemption price equal to 100% of their principal amount, plus accrued and unpaid interest and a “make-whole” premium as set forth in the applicable indenture. In addition, before July 1, 2015, we may redeem up to 35% of the Senior Secured Notes and up to 35% of the Senior Unsecured Notes at a redemption price equal to 108.125% and 110.125%, respectively, of their principal amounts, plus accrued and unpaid interest, using the proceeds of certain equity offerings, including this initial public offering of our common stock. See Note 9—Long-Term Debt—Debt Covenants to our audited consolidated financial statements for the covenants applicable to our outstanding Notes.
Credit Facilities
We have a $250 million senior secured revolving credit facility (the “Revolver”) and a $1,989.2 million senior secured term loan facility (the “Term Loan Facility”) pursuant to a credit agreement, dated as of July 2, 2012, by and among ZGL, Zayo Capital, Inc., the guarantors party thereto, and the lenders party thereto (the “Credit Agreement”). The Term Loan Facility bears interest per annum at a fixed rate of LIBOR plus 3.0% with a minimum LIBOR rate of 1.0%, and the Revolver, which was undrawn as of March 31, 2014, bears interest at LIBOR plus 2.75% (based on our current leverage ratio). Borrowings under the Term Loan Facility and Revolver are prepayable at any time prior to maturity (subject to advance notice) without penalty. The Term Loan Facility will mature in July 2019 and the Revolver will mature in July 2017. See Note 9—Long-Term Debt—Debt Covenants to our audited consolidated financial statements for the covenants applicable to our Revolver and Term Loan Facility.
120
Table of Contents
The following is a description of the material terms and provisions of our common stock and preferred stock, our certificate of incorporation and bylaws, as they will be in effect upon completion of this offering. For more complete information, you should read our certificate of incorporation and bylaws, copies of which are or will be filed with the SEC as exhibits to the registration statement, of which this prospectus is a part.
Authorized Capitalization
Upon completion of this offering and giving effect to the Restructuring, our authorized capital stock will consist of million shares of common stock, par value $0.001 per share, and million shares of preferred stock, par value $0.001 per share. Immediately after the Restructuring and prior to the completion of this offering, we had outstanding shares of common stock, held of record by stockholders. Based upon (i) million shares of our common stock that will be outstanding after giving effect to the Restructuring and (ii) the issuance of million shares of common stock in this offering to be sold by us, there will be million shares of our common stock outstanding upon completion of this offering, and no shares of preferred stock will be outstanding.
Common Stock
Voting Rights
Each share of common stock entitles the holder to one vote with respect to each matter presented to our stockholders on which the holders of common stock are entitled to vote. Subject to any rights that may be applicable to any then outstanding preferred stock, our common stock votes as a single class on all matters relating to the election and removal of directors on our board of directors and as provided by law. Holders of our common stock will not have cumulative voting rights. Except in respect of matters relating to the election of and removal of directors on our board of directors, and as otherwise provided in our certificate of incorporation or required by law, all matters to be voted on by our stockholders must be approved by a majority of the shares present in person or by proxy at the meeting and entitled to vote on the subject matter. In the case of election of directors, all matters to be voted on by our stockholders must be approved by a plurality of the votes entitled to be cast by all shares of common stock. In the case of removal of directors, all matters to be voted on by our stockholders must be approved by an affirmative vote of 66 2/3% of our common stock.
Dividend Rights
Subject to preferences that may be applicable to any then-outstanding shares of our preferred stock, the holders of our outstanding shares of common stock are entitled to receive dividends, if any, as may be declared from time to time by our board of directors out of legally available funds. It is our present intention not to pay cash dividends on our common stock for the foreseeable future. We are a holding company and substantially all of our operations are carried out by our subsidiary, ZGL, and its subsidiaries. ZGL’s ability to pay dividends to us is limited by the terms of its credit agreement, which in turn may limit our ability to pay dividends on our common stock. See “Dividend Policy.”
Liquidation Rights
In the event of any voluntary or involuntary liquidation, dissolution or winding up of our affairs, holders of our common stock would be entitled to share ratably in our assets that are legally available for distribution to our common stockholders after payment of our debts and other liabilities. If we have any preferred stock outstanding at such time, holders of the preferred stock may be entitled to distribution or liquidation preferences. In either such case, we must pay the applicable distribution to the holders of our preferred stock before we may pay distributions to the holders of our common stock.
121
Table of Contents
Other Rights
Our stockholders have no preemptive, conversion or other rights to subscribe for additional shares. The rights, preferences and privileges of the holders of our common stock are subject to, and may be adversely affected by, the rights of the holders of shares of any series of our preferred stock that we may designate and issue in the future.
Preferred Stock
Our certificate of incorporation authorizes our board of directors to provide for the issuance of up to million shares of preferred stock in one or more series and to fix the preferences, powers and relative, participating, optional or other special rights, and qualifications, limitations or restrictions thereof, including the dividend rate, conversion rights, voting rights, redemption rights and liquidation preference and to fix the number of shares to be included in any such series without any further vote or action by our stockholders. Any preferred stock so issued may rank senior to our common stock with respect to the payment of dividends or amounts upon liquidation, dissolution or winding up, or both. The issuance of preferred stock may have the effect of delaying, deferring or preventing a change in control of our Company without further action by the stockholders and may adversely affect the voting and other rights of the holders of common stock. The issuance of preferred stock with voting and conversion rights may adversely affect the voting power of the holders of common stock, including the loss of voting control to others. At present, we have no plans to issue any shares of preferred stock.
Exclusive Venue
Unless we consent otherwise, the Court of Chancery in the State of Delaware shall be the sole and exclusive forum for stockholder actions against us.
Antitakeover Effects of Delaware Law and Our Certificate of Incorporation and Bylaws
Our certificate of incorporation and bylaws, as they will be in effect upon completion of this offering, also contain provisions that may delay, defer or discourage another party from acquiring control of us. We expect that these provisions, which are summarized below, will discourage coercive takeover practices or inadequate takeover bids. These provisions are also designed to encourage persons seeking to acquire control of us to first negotiate with our board of directors, which we believe may result in an improvement of the terms of any such acquisition in favor of our stockholders. However, they also give our board of directors the power to discourage acquisitions that some stockholders may favor.
Undesignated Preferred Stock
The authorization of undesignated preferred stock in our certificate of incorporation will make it possible for our board of directors to issue preferred stock with super voting, special approval, dividend or other rights or preferences on a discriminatory basis that could impede the success of any attempt to acquire us. These and other provisions may have the effect of deferring, delaying or discouraging hostile takeovers, or changes in control or management of our Company.
Classified Board of Directors
Our certificate of incorporation will provide that our board of directors will be divided into three classes, with each class serving three-year staggered terms. In addition, our certificate of incorporation will provide that directors may only be removed from our board of directors with cause and by an affirmative vote of 66 2/3% of our common stock. These provisions may have the effect of deferring, delaying or discouraging hostile takeovers, or changes in control or management of our Company.
122
Table of Contents
Requirements for Advance Notification of Stockholder Meetings, Nominations and Proposals
Our certificate of incorporation will provide that, upon completion of this offering, special meetings of the stockholders may be called only by a resolution adopted by the affirmative vote of the majority of the directors then in office. Our bylaws will prohibit the conduct of any business at a special meeting other than as specified in the notice for such meeting. In addition, any stockholder who wishes to bring business before an annual meeting or nominate directors must comply with the requirements set forth in our bylaws. These provisions may have the effect of deferring, delaying or discouraging hostile takeovers or changes in control or management of our Company.
Stockholder Action by Written Consent
Pursuant to Section 228 of the DGCL, any action required to be taken at any annual or special meeting of the stockholders may be taken without a meeting, without prior notice and without a vote if a consent or consents in writing, setting forth the action so taken, is signed by the holders of outstanding stock having not less than the minimum number of votes that would be necessary to authorize or take such action at a meeting at which all shares of our stock entitled to vote thereon were present and voted, unless our Company’s certificate of incorporation provides otherwise. Our certificate of incorporation will provide that any action required or permitted to be taken by our stockholders may be effected at a duly called annual or special meeting of our stockholders and may not be effected by consent in writing by such stockholders.
Special Meetings
Our bylaws provide that special meetings of stockholders may be called only by the Chairman of our board of directors, our Chief Executive Officer, or our board of directors. Stockholders may not call a special meeting, which may delay the ability of our stockholders to force consideration of proposals or for holders controlling a majority of our capital stock to take any action, including removal of directors.
Business Combinations with Interested Stockholders
We are subject to Section 203 of the DGCL, an anti-takeover law. In general, Section 203 prohibits a publicly held Delaware corporation from engaging in a business combination, such as a merger, with a person or group owning 15% or more of the corporation’s voting stock for a period of three years following the date the person became an interested stockholder, unless (with certain exceptions) the business combination or the transaction in which the person became an interested stockholder is approved in a prescribed manner.
Amendments
Any amendments to the foregoing provisions of our certificate of incorporation (other than the designation of preferred stock pursuant to a certificate of designation) will require the affirmative vote of at least 66 2/3% of the voting power of all shares of our common stock then outstanding. Our bylaws may be adopted, amended or repealed by (i) our board of directors, or (ii) by the holders of more than 66 2/3% of the voting power of all of the outstanding shares.
Listing
We will apply to list our common stock on the under the symbol .
Transfer Agent and Registrar
The transfer agent and registrar for our common stock will be .
123
Table of Contents
SHARES ELIGIBLE FOR FUTURE SALE
Prior to this offering, there has not been any public market for our common stock, and a significant public market for our common stock may not develop or be sustained after this offering. We cannot predict what effect, if any, sales of shares of our common stock or the availability of shares of our common stock for sale will have on the prevailing market price of our common stock from time to time. The number of shares of our common stock available for future sale into the public markets is subject to legal and contractual restrictions, some of which are described below. The expiration of these restrictions will permit sales of substantial amounts of our common stock in the public market or could create the perception that these sales could occur, which could adversely affect the market price for our common stock and could make it more difficult for us to raise capital through the sale of our equity or equity-related securities at a time and price that we deem acceptable.
Upon the completion of this offering, we expect to have a total of shares of our common stock outstanding. All of the shares of our common stock sold in this offering will be freely tradable without restriction or further registration under the Securities Act, except for “restricted” shares held by persons who may be deemed our “affiliates,” as those terms are defined under Rule 144 of the Securities Act. An “affiliate” is a person that directly, or indirectly through one or more intermediaries, controls or is controlled by us or is under common control with us.
Rule 144
In general, pursuant to Rule 144 under the Securities Act in effect on the date of this prospectus, once we have been subject to public company reporting requirements for at least 90 days, a person who is not one of our affiliates at any time during the 90 days preceding a sale and who has beneficially owned the shares of our common stock to be sold for at least six months, including the holding period of any prior owner other than our affiliates, would be entitled to sell those shares without complying with the manner of sale, volume limitation or notice provisions of Rule 144, subject to compliance with the public information requirements of Rule 144. In addition, under Rule 144, a person who is not one of our affiliates at any time during the 90 days preceding a sale, and who has beneficially owned the shares of our common stock to be sold for at least one year, including the holding period of any prior owner other than our affiliates, would be entitled to sell those shares without regard to the requirements of Rule 144. Our affiliates or persons selling on behalf of our affiliates are entitled to sell, upon expiration of the lock-up agreements described below, within any three-month period beginning 90 days after the date of this prospectus, a number of shares that does not exceed the greater of:
| • | 1.0% of the number of shares of common stock then outstanding, which is approximately shares of common stock upon the completion of this offering; and |
| • | the average weekly trading volume of our common stock on the during the four calendar weeks preceding each such sale, subject to certain restrictions. |
Sales under Rule 144 by our affiliates or persons selling on behalf of our affiliates are also subject to manner of sale provisions and notice requirements and to the availability of current public information about us. Rule 144 also provides that affiliates relying on Rule 144 to sell shares of our common stock that are not restricted shares must nonetheless comply with the same restrictions applicable to restricted shares, other than the holding period requirement.
Lock-up Agreements
We, our directors, certain of our officers and stockholders have agreed with the underwriters not to sell or otherwise transfer or dispose of any shares of our common stock, subject to specified exceptions, during the period from the date of this prospectus continuing through the date that is 180 days after the date of this prospectus, subject to an extension in certain circumstances, except with the prior written consent of Morgan Stanley & Co. LLC and Barclays Capital Inc. See “Underwriting” for a description of the terms of the lock-up agreements.
124
Table of Contents
After the offering, certain of our employees, including our executive officers, and/or directors may enter into written trading plans that are intended to comply with Rule 10b5-1 under the Securities Exchange Act of 1934. Sales under these trading plans would not be permitted until the expiration of the lock-up agreements relating to the offering described above.
Shares Issued Under Employee Plans
We intend to file a registration statement on Form S-8 under the Securities Act to register common stock issuable under our employee plans. This registration statement is expected to be filed following the effective date of the registration statement of which this prospectus is a part and will be effective upon filing. Accordingly, shares registered under such registration statement will be available for sale in the public market following the effective date, unless such shares are subject to vesting restrictions with us, Rule 144 restrictions applicable to our affiliates, or the lock-up agreements described above.
Registration Rights
After the completion of this offering, will be entitled to certain rights with respect to the registration under the Securities Act of our common stock that it owns, under the terms of a registration rights agreement between us and .
125
Table of Contents
MATERIAL U.S. FEDERAL INCOME TAX CONSEQUENCES TO NON-U.S. HOLDERS OF OUR COMMON STOCK
The following is a summary of the material U.S. federal income tax consequences to non-U.S. holders (as defined below) associated with the purchase, ownership and disposition of our common stock, but does not purport to be a complete analysis of all the potential tax considerations relating thereto. This summary is based upon the provisions of the Internal Revenue Code of 1986, as amended (the “Code”), Treasury regulations promulgated thereunder, administrative rulings and judicial decisions, all as of the date hereof. These authorities may be changed, possibly retroactively, and any changes may result in U.S. federal income tax consequences different from those set forth below. We have not sought any ruling from the Internal Revenue Service (the “IRS”), with respect to the statements made and the conclusions reached in the following summary, and there can be no assurance that the IRS will agree with such statements and conclusions.
This summary also does not address the tax considerations arising under the laws of any state, local or non-U.S. jurisdiction or under U.S. federal gift and estate tax laws, except to the limited extent set forth below. In addition, because this section is a general summary, it does not address all aspects of taxation that may be relevant to particular shareholders in light of their personal investment or tax circumstances, or to certain types of shareholders that are subject to special treatment under the U.S. federal income tax laws, including, without limitation, brokers or dealers in securities, insurance companies, banks or other financial institutions, hybrid entities, regulated investment companies, real estate investment trusts, tax-exempt organizations or accounts, persons holding common stock as a part of a hedging, integrated, conversion transaction, straddle or other risk reduction transaction, traders in securities that elect to use a mark-to-market method of accounting for their securities holdings, persons subject to the alternative minimum tax or the Medicare tax on net investment income, entities or arrangements treated as partnerships for U.S. federal income tax purposes or investors in such entities, persons who acquired our common stock through the exercise of employee stock options or otherwise as compensation for services, persons who do not hold our common stock as a capital asset within the meaning of Section 1221 of the Code, certain former U.S. citizens or long-term residents, U.S. expatriates, “controlled foreign corporations,” “passive foreign investment companies,” and persons deemed to sell our common stock under the constructive sale provisions of the Code.
You are urged to consult your tax advisor with respect to the application of the U.S. federal income tax laws to your particular situation, as well as any tax consequences of the purchase, ownership and disposition of our common stock arising under the U.S. federal estate or gift tax rules or under the laws of any state, local, non-U.S. or other taxing jurisdiction or under any applicable tax treaty.
Non-U.S. Holder Defined
As used in this prospectus, the term “non-U.S. holder” means a beneficial owner of 5% or less of our common stock that, for U.S. federal income tax purposes, is an individual, corporation, estate or trust and is not any of the following for U.S. federal income tax purposes:
| • | an entity or arrangement treated as a partnership; |
| • | an individual who is a citizen or resident of the United States; |
| • | a corporation created or organized in the United States or under the laws of the United States or any political subdivision thereof (including the District of Columbia); |
| • | an estate whose income is subject to U.S. federal income tax regardless of its source; or |
| • | a trust (i) the administration of which is subject to the primary supervision of a U.S. court and that has one or more U.S. persons who have the authority to control all substantial decisions of the trust or (ii) that has a valid election in effect under applicable U.S. Treasury regulations to be treated as a U.S. person. |
126
Table of Contents
Distributions
We have no present intention to make distributions on our common stock. However, if distributions of cash or property (other than certain stock distributions) are made to non-U.S. holders on shares of our common stock, such distributions generally will constitute dividends for U.S. federal income tax purposes to the extent paid from our current or accumulated earnings and profits, as determined under U.S. federal income tax principles. To the extent those distributions exceed both our current and our accumulated earnings and profits, they will constitute a return of capital and will first reduce your basis in our common stock (determined separately with respect to each share of our common stock), but not below zero, and then will be treated as gain from the sale of that stock.
Any dividend paid to you generally will be subject to U.S. withholding tax either at a rate of 30% of the gross amount of the dividend or such lower rate as may be specified by an applicable income tax treaty. In order to receive a reduced treaty rate, you must provide us in a timely manner an IRS Form W-8BEN or W-8BEN-E, whichever is applicable, or other appropriate version of IRS Form W-8, including a U.S. taxpayer identification number, certifying qualification for the reduced rate. A non-U.S. holder of shares of our common stock eligible for a reduced rate of U.S. withholding tax pursuant to an income tax treaty may obtain a refund of any excess amounts withheld by filing an appropriate claim for refund with the IRS in a timely manner. If the non-U.S. holder holds the stock through a financial institution or other agent acting on the non-U.S. holder’s behalf, the non-U.S. holder will be required to provide appropriate documentation to the agent, which then will be required to provide certification to us or our paying agent, either directly or through other intermediaries.
Dividends received by you that are effectively connected with your conduct of a U.S. trade or business (and, if an income tax treaty applies, that are attributable to a permanent establishment or fixed base maintained by you in the United States), are exempt from such withholding tax. In order to obtain this exemption, you must provide us with an IRS Form W-8ECI or other applicable IRS Form W-8 properly certifying such exemption. Such effectively connected dividends, although not subject to withholding tax, generally are subject to U.S. federal income tax on a net income basis at applicable graduated U.S. federal income tax rates, net of certain deductions and credits, and in a manner applicable to U.S. persons. In addition, if you are a corporate non-U.S. holder, dividends you receive that are effectively connected with your conduct of a U.S. trade or business may also be subject to a branch profits tax at a rate of 30% or such lower rate as may be specified by an applicable income tax treaty.
Gain on Disposition of Our Common Stock
You generally will not be required to pay U.S. federal income tax, including by way of withholding, on any gain realized upon the sale or other disposition of our common stock unless:
| • | the gain is effectively connected with your conduct of a U.S. trade or business, directly or through an entity treated as a partnership for U.S. tax purposes, and, if an applicable tax treaty requires, attributable to a U.S. permanent establishment or fixed base maintained by you or by the partnership (as the case may be) in the United States; |
| • | you are an individual who is present in the United States for a period or periods aggregating 183 days or more during the calendar year in which the sale or disposition occurs and certain other conditions are met; or |
| • | our common stock constitutes a U.S. real property interest by reason of our status as a “United States real property holding corporation” (a “USRPHC”) for U.S. federal income tax purposes at any time within the shorter of the five-year period preceding your disposition of, or your holding period for, our common stock. |
127
Table of Contents
We intend to take the position that we are not currently a USRPHC. However, we have not sought either an opinion or an IRS ruling with respect to whether or not we are a USRPHC, and we cannot guarantee that the IRS will not successfully challenge our position. Additionally, because the determination of whether we are a USRPHC depends on the fair market value of our U.S. real property relative to the fair market value of our other business assets, there can be no assurance that we will not become a USRPHC in the future. Even if we become a USRPHC, however, as long as our common stock is regularly traded on an established securities market, such common stock will be treated as U.S. real property interests only if you actually or constructively hold more than 5% of such regularly traded common stock at any time during the shorter of the five-year period preceding your disposition of, or your holding period for, our common stock.
If you are a non-U.S. holder described in the first bullet above, you will be required to pay tax on the net gain derived from the sale under regular graduated U.S. federal income tax rates, and a corporate non-U.S. holder described in the first bullet above also may be subject to the branch profits tax at a 30% rate, or such lower rate as may be specified by an applicable income tax treaty. If you are an individual non-U.S. holder described in the second bullet above, you will be required to pay a flat 30% tax on the gain derived from the sale, which tax may be offset by U.S.-source capital losses for the year. You should consult any applicable income tax or other treaties that may provide for different rules. In addition, if we are determined to be a USRPHC and our common stock is not regularly traded on an established securities market, then a purchaser may be required to withhold 10% of the proceeds payable to a non-U.S. holder from a sale or other taxable disposition of our common stock.
U.S. Federal Estate Taxes
Our common stock beneficially owned or treated as beneficially owned by an individual who at the time of death is not a citizen or resident of the United States (as specifically defined for U.S. federal estate tax purposes), and certain lifetime transfers of an interest in common stock made by such an individual, will be included in his or her gross estate for U.S. federal estate tax purposes and, therefore, may be subject to U.S. federal estate tax, unless an applicable estate tax treaty provides otherwise. Estates of nonresident alien individuals are generally allowed a statutory credit that has the effect of offsetting the U.S. federal estate tax imposed on the first $60,000 of the taxable estate.
Backup Withholding and Information Reporting
Generally, we must report annually to the IRS the amount of dividends paid to you, your name and address, and the amount of tax withheld, if any. A similar report will be sent to you. These information reporting requirements apply even if withholding was not required because the dividends were effectively connected to the conduct of your trade or business within the United States or withholding was reduced or eliminated by an applicable income tax treaty. Pursuant to applicable income tax treaties or other agreements, the IRS may make these reports available to tax authorities in your country of residence.
Payments of dividends on or of proceeds from the disposition of our common stock made to you may be subject to additional information reporting and backup withholding at a current rate of 28% unless you establish an exemption, for example, by properly certifying your non-U.S. status on a Form W-8BEN or W-8BEN-E, whichever is applicable, or another appropriate version of IRS Form W-8. Notwithstanding the foregoing, backup withholding and information reporting may apply if either we or our paying agent has actual knowledge, or reason to know, that you are a U.S. person.
U.S. information reporting and backup withholding generally will not apply to a payment of proceeds of a disposition of common stock where the transaction is effected outside the United States through a non-U.S. office of a non-U.S. broker. However, information reporting requirements, but generally not backup withholding, generally will apply to such a payment if the broker is (i) a U.S. person; (ii) a foreign person that derives 50% or more of its gross income for certain periods from the conduct of a trade or business in the United States; (iii) a controlled foreign corporation as defined in the Code; (iv) a foreign partnership with certain U.S. connections; or
128
Table of Contents
(v) a U.S. branch of a foreign bank or a foreign insurance company, unless the broker has documentary evidence in its records that the holder is a non-U.S. holder and certain conditions are met or the holder otherwise establishes an exemption.
Backup withholding is not an additional tax; rather, the U.S. income tax liability of persons subject to backup withholding will be reduced by the amount of tax withheld. If withholding results in an overpayment of taxes, a refund or credit may generally be obtained from the IRS, provided that the required information is furnished to the IRS in a timely manner. You should consult your own tax advisor regarding application of backup withholding in your particular circumstance and the availability of and procedure for obtaining an exemption from backup withholding under current U.S. Treasury regulations.
FATCA
Legislation commonly known as FATCA generally will impose a U.S. federal withholding tax of 30% on dividends on and the gross proceeds of a disposition of our common stock, paid to a “foreign financial institution” (as defined under these rules), unless such institution enters into an agreement with the U.S. government to withhold on certain payments and to collect and provide to the U.S. tax authorities substantial information regarding the U.S. account holders of such institution (which includes certain equity and debt holders of such institution, as well as certain account holders that are foreign entities with U.S. owners) or otherwise establishes an exemption. The legislation also generally will impose a U.S. federal withholding tax of 30% on dividends on and the gross proceeds of a disposition of our common stock paid to a non-financial foreign entity unless such entity provides the withholding agent with a certification identifying certain substantial direct and indirect U.S. owners of the entity, certifies that there are none or otherwise establishes an exemption. The withholding taxes described above will apply to dividend payments made after June 30, 2014 and payments of gross proceeds from dispositions occurring after December 31, 2016. Under certain circumstances, a non-U.S. holder might be eligible for refunds or credits of such taxes. An intergovernmental agreement between the United States and an applicable foreign country may modify the requirements described in this paragraph. Prospective investors are urged to consult with their own tax advisors regarding the possible implications of this legislation on their investment in our common stock.
129
Table of Contents
Under the terms and subject to the conditions in an underwriting agreement dated the date of this prospectus, the underwriters named below, for whom Morgan Stanley & Co. LLC, Barclays Capital Inc. and Goldman, Sachs & Co. are acting as representatives, have severally agreed to purchase, and we and the selling stockholders have agreed to sell to them, severally, the number of shares indicated below:
| Name |
Number of Shares | |
| Morgan Stanley & Co. LLC |
||
| Barclays Capital Inc. |
||
| Goldman, Sachs & Co. |
||
| RBC Capital Markets, LLC |
||
| Citigroup Global Markets Inc. |
||
| SunTrust Robinson Humphrey, Inc. |
||
| Cowen and Company, LLC |
||
| Oppenheimer & Co. Inc. |
||
| Raymond James & Associates, Inc. |
||
| Stephens Inc. |
||
| Wells Fargo Securities, LLC |
||
| William Blair & Company, L.L.C. |
||
|
| ||
| Total: |
The underwriters are offering the shares of our common stock subject to their acceptance of the shares from us and the selling stockholders and subject to prior sale. The underwriting agreement provides that the obligations of the several underwriters to pay for and accept delivery of the shares of common stock offered by this prospectus are subject to the approval of certain legal matters by their counsel and to certain other conditions. The underwriters are obligated to take and pay for all of the shares of common stock offered by this prospectus, if any such shares are taken. However, the underwriters are not required to take or pay for the shares covered by the underwriters’ option to purchase additional shares described below. The offering of the shares by the underwriters is subject to receipt and acceptance and subject to the underwriters’ right to reject any order in whole or in part.
The underwriters initially propose to offer part of the shares of our common stock directly to the public at the offering price listed on the cover page of this prospectus and part to certain dealers at a price that represents a concession not in excess of $ a share under the public offering price. After the initial offering of the shares of our common stock, the offering price and other selling terms may from time to time be varied by the representatives.
The selling stockholders have granted to the underwriters an option, exercisable for 30 days from the date of this prospectus, to purchase up to additional shares of our common stock at the public offering price listed on the cover page of this prospectus, less underwriting discounts and commissions. To the extent the option is exercised, each underwriter will become obligated, subject to certain conditions, to purchase about the same percentage of the additional shares of our common stock as the number listed next to the underwriter’s name in the preceding table bears to the total number of shares of our common stock listed next to the names of all underwriters in the preceding table.
130
Table of Contents
The following table shows the per share and total public offering price, underwriting discounts and commissions, and proceeds before expenses to us and the selling stockholders. These amounts are shown assuming both no exercise and full exercise of the underwriters’ option to purchase up to an additional shares of our common stock from the selling stockholders.
| Total | ||||||||||||
| Per Share |
No Exercise | Full Exercise | ||||||||||
| Public offering price |
$ | $ | $ | |||||||||
| Underwriting discounts and commissions to be paid by: |
||||||||||||
| The Company |
||||||||||||
| The selling stockholders |
||||||||||||
| Proceeds, before expenses, to the Company |
||||||||||||
| Proceeds, before expenses, to the selling stockholders |
||||||||||||
The estimated offering expenses payable by us, exclusive of the underwriting discounts and commissions, are approximately $ . We have agreed to reimburse the underwriters for certain of their out-of-pocket expenses, in an aggregate amount not to exceed $ .
The underwriters have informed us that they do not intend sales to discretionary accounts to exceed 5% of the total number of shares of our common stock offered by them.
We expect to apply to list our common stock on the under the symbol .
We and all directors and officers and certain holders of all of our outstanding stock, including the selling stockholders, have agreed that, without the prior written consent of Morgan Stanley & Co. LLC and Barclays Capital Inc. on behalf of the underwriters, we and they will not, during the period ending 180 days after the date of this prospectus (the “restricted period”):
| • | offer, pledge, sell, contract to sell, sell any option or contract to purchase, purchase any option or contract to sell, grant any option, right or warrant to purchase, lend or otherwise transfer or dispose of, directly or indirectly, any shares of our common stock or any securities convertible into or exercisable or exchangeable for shares of our common stock; |
| • | file any registration statement with the Securities and Exchange Commission relating to the offering of any shares of our common stock or any securities convertible into or exercisable or exchangeable for our common stock; or |
| • | enter into any swap or other arrangement that transfers to another, in whole or in part, any of the economic consequences of ownership of our common stock; |
whether any such transaction described above is to be settled by delivery of common stock or such other securities, in cash or otherwise. In addition, we and each such person agree that, without the prior written consent of Morgan Stanley & Co. LLC and Barclays Capital Inc. on behalf of the underwriters, we or such other person will not, during the restricted period, make any demand for, or exercise any right with respect to, the registration of any shares of our common stock or any security convertible into or exercisable or exchangeable for our common stock.
The restrictions described in the immediately preceding paragraph to do not apply to:
| • | the sale of shares to the underwriters under this prospectus; |
| • | the issuance by us of common stock or other securities under our equity incentive plans or upon the exercise of any option or any other derivative security outstanding on the date of this prospectus; |
131
Table of Contents
| • | transactions by any person other than us relating to shares of our common stock or other securities acquired in open market transactions after the completion of the offering of the shares; provided that no filing under Section 16(a) of the Securities Exchange Act of 1934, as amended (the “Exchange Act”), is required or voluntarily made in connection with subsequent sales of the common stock or other securities acquired in such open market transactions; or |
| • | the establishment of a trading plan pursuant to Rule 10b5-1 under the Exchange Act for the transfer of shares of our common stock, provided that (i) such plan does not provide for the transfer of our common stock during the restricted period and (ii) to the extent a public announcement or filing under the Exchange Act, if any, is required or voluntarily made regarding the establishment of such plan, such announcement or filing shall include a statement to the effect that no transfer of our common stock may be made under such plan during the restricted period. |
The restricted period described in the preceding paragraph will be extended if:
| • | during the last 17 days of the restricted period we issue an earnings release or material news event relating to us, or |
| • | prior to the expiration of the restricted period, we announce that we will release earnings results during the 16-day period beginning on the last day of the restricted period or provide notification to Morgan Stanley & Co. LLC and Barclays Capital Inc. of any earnings release or material news or material event that may give rise to an extension of the initial restricted period, |
in which case the restrictions described in the preceding paragraph will continue to apply until the expiration of the 18-day period beginning on the issuance of the earnings release or the occurrence of the material news or material event.
Morgan Stanley & Co. LLC and Barclays Capital Inc., in their sole discretion, may release our common stock and other securities subject to the lock-up agreements described above in whole or in part, at any time, with or without notice.
In order to facilitate the offering of our common stock, the underwriters may engage in transactions that stabilize, maintain or otherwise affect the price of our common stock. Specifically, the underwriters may sell more shares than they are obligated to purchase under the underwriting agreement, creating a short position. A short sale is covered if the short position is no greater than the number of shares available for purchase by the underwriters under their option to purchase additional shares. The underwriters can close out a covered short sale by exercising their option or purchasing shares in the open market. In determining the source of shares to close out a covered short sale, the underwriters will consider, among other things, the open market price of shares compared to the price available under their option to purchase additional shares. The underwriters may also sell shares in excess of their option, creating a naked short position. The underwriters must close out any naked short position by purchasing shares in the open market. A naked short position is more likely to be created if the underwriters are concerned that there may be downward pressure on the price of our common stock in the open market after pricing that could adversely affect investors who purchase in this offering. As an additional means of facilitating this offering, the underwriters may bid for, and purchase, shares of our common stock in the open market to stabilize the price of our common stock. These activities may raise or maintain the market price of our common stock above independent market levels or prevent or retard a decline in the market price of our common stock. The underwriters are not required to engage in these activities and may end any of these activities at any time. The underwriters may also impose a penalty bid. This occurs when a particular underwriter repays to the underwriters a portion of the underwriting discount received by it because the representatives have repurchased shares sold by or for the account of such underwriter in stabilizing or short covering transactions.
We, the selling stockholders, and the underwriters have agreed to indemnify each other against certain liabilities, including liabilities under the Securities Act.
132
Table of Contents
A prospectus in electronic format may be made available on websites maintained by one or more underwriters participating in this offering. The representatives may agree to allocate a number of shares of our common stock to underwriters for sale to their online brokerage account holders. Internet distributions will be allocated by the representatives to underwriters that may make Internet distributions on the same basis as other allocations.
The underwriters and their respective affiliates are full service financial institutions engaged in various activities, which may include securities trading, commercial and investment banking, financial advisory, investment management, investment research, principal investment, hedging, financing, and brokerage activities. Certain of the underwriters and their respective affiliates have, from time to time, performed, and may in the future perform, various financial advisory and investment banking services for us, for which they received or will receive customary fees and expenses. For example, affiliates of Morgan Stanley & Co. LLC, Barclays Capital Inc., Goldman, Sachs & Co., and certain of the other underwriters are lenders under our Credit Agreement.
In addition, in the ordinary course of their various business activities, the underwriters and their respective affiliates may make or hold a broad array of investments and actively trade debt and equity securities (or related derivative securities) and financial instruments (including bank loans) for their own account and for the accounts of their customers and may at any time hold long and short positions in such securities and instruments. Such investment and securities activities may involve our securities and instruments. The underwriters and their respective affiliates may also make investment recommendations or publish or express independent research views in respect of such securities or instruments and may at any time hold, or recommend to clients that they acquire, long or short positions in such securities and instruments.
Pricing of the Offering
Prior to this offering, there has been no public market for our common stock. The initial public offering price was determined by negotiations among us and the representatives. Among the factors considered in determining the initial public offering price were our future prospects and those of our industry in general, our sales, earnings, and certain other financial and operating information in recent periods along with the price-earnings ratios, price-sales ratios, market prices of securities, and certain financial and operating information of companies engaged in activities similar to ours.
Selling Restrictions
European Economic Area
In relation to each Member State of the European Economic Area which has implemented the Prospectus Directive (each, a “Relevant Member State”) an offer to the public of any shares of our common stock may not be made in that Relevant Member State, except that an offer to the public in that Relevant Member State of any shares of our common stock may be made at any time under the following exemptions under the Prospectus Directive, if they have been implemented in that Relevant Member State:
| (a) | to any legal entity which is a qualified investor as defined in the Prospectus Directive; |
| (b) | to fewer than 100 or, if the Relevant Member State has implemented the relevant provision of the 2010 PD Amending Directive, 150, natural or legal persons (other than qualified investors as defined in the Prospectus Directive), as permitted under the Prospectus Directive, subject to obtaining the prior consent of the representatives for any such offer; or |
| (c) | in any other circumstances falling within Article 3(2) of the Prospectus Directive, provided that no such offer of shares of our common stock shall result in a requirement for the publication by us or any underwriter of a prospectus pursuant to Article 3 of the Prospectus Directive. |
133
Table of Contents
For the purposes of this provision, the expression an “offer to the public” in relation to any shares of our common stock in any Relevant Member State means the communication in any form and by any means of sufficient information on the terms of the offer and any shares of our common stock to be offered so as to enable an investor to decide to purchase any shares of our common stock, as the same may be varied in that Member State by any measure implementing the Prospectus Directive in that Member State, the expression “Prospectus Directive” means Directive 2003/71/EC (and amendments thereto, including the 2010 PD Amending Directive, to the extent implemented in the Relevant Member State), and includes any relevant implementing measure in the Relevant Member State, and the expression “2010 PD Amending Directive” means Directive 2010/73/EU.
United Kingdom
Each underwriter has represented and agreed that:
| (a) | it has only communicated or caused to be communicated and will only communicate or cause to be communicated an invitation or inducement to engage in investment activity (within the meaning of Section 21 of the Financial Services and Markets Act 2000 (“FSMA”) received by it in connection with the issue or sale of the shares of our common stock in circumstances in which Section 21(1) of the FSMA does not apply to us; and |
| (b) | it has complied and will comply with all applicable provisions of the FSMA with respect to anything done by it in relation to the shares of our common stock in, from or otherwise involving the United Kingdom. |
Hong Kong
The shares may not be offered or sold by means of any document other than (i) in circumstances which do not constitute an offer to the public within the meaning of the Companies Ordinance (Cap.32, Laws of Hong Kong), or (ii) to “professional investors” within the meaning of the Securities and Futures Ordinance (Cap.571, Laws of Hong Kong) and any rules made thereunder, or (iii) in other circumstances which do not result in the document being a “prospectus” within the meaning of the Companies Ordinance (Cap.32, Laws of Hong Kong), and no advertisement, invitation or document relating to the shares may be issued or may be in the possession of any person for the purpose of issue (in each case whether in Hong Kong or elsewhere), which is directed at, or the contents of which are likely to be accessed or read by, the public in Hong Kong (except if permitted to do so under the laws of Hong Kong) other than with respect to shares which are or are intended to be disposed of only to persons outside Hong Kong or only to “professional investors” within the meaning of the Securities and Futures Ordinance (Cap. 571, Laws of Hong Kong) and any rules made thereunder.
Singapore
This prospectus has not been registered as a prospectus with the Monetary Authority of Singapore. Accordingly, this prospectus and any other document or material in connection with the offer or sale, or invitation for subscription or purchase, of the shares may not be circulated or distributed, nor may the shares be offered or sold, or be made the subject of an invitation for subscription or purchase, whether directly or indirectly, to persons in Singapore other than (i) to an institutional investor under Section 274 of the Securities and Futures Act, Chapter 289 of Singapore (the “SFA”), (ii) to a relevant person, or any person pursuant to Section 275(1A), and in accordance with the conditions, specified in Section 275 of the SFA or (iii) otherwise pursuant to, and in accordance with the conditions of, any other applicable provision of the SFA.
Where the shares are subscribed or purchased under Section 275 by a relevant person which is: (a) a corporation (which is not an accredited investor) the sole business of which is to hold investments and the entire share capital of which is owned by one or more individuals, each of whom is an accredited investor; or (b) a trust (where the trustee is not an accredited investor) whose sole purpose is to hold investments and each beneficiary is an accredited investor, shares, debentures and units of shares and debentures of that corporation or the beneficiaries’ rights and interest in that trust shall not be transferable for 6 months after that corporation or that trust has acquired the shares
134
Table of Contents
under Section 275 except: (1) to an institutional investor under Section 274 of the SFA or to a relevant person, or any person pursuant to Section 275(1A), and in accordance with the conditions, specified in Section 275 of the SFA; (2) where no consideration is given for the transfer; or (3) by operation of law.
Japan
The securities have not been and will not be registered under the Financial Instruments and Exchange Law of Japan (the Financial Instruments and Exchange Law) and each underwriter has agreed that it will not offer or sell any securities, directly or indirectly, in Japan or to, or for the benefit of, any resident of Japan (which term as used herein means any person resident in Japan, including any corporation or other entity organized under the laws of Japan), or to others for re-offering or resale, directly or indirectly, in Japan or to a resident of Japan, except pursuant to an exemption from the registration requirements of, and otherwise in compliance with, the Financial Instruments and Exchange Law and any other applicable laws, regulations and ministerial guidelines of Japan.
135
Table of Contents
The validity of the common stock offered hereby will be passed upon for us by Gibson, Dunn & Crutcher LLP. Certain legal matters will be passed upon for the underwriters by Shearman & Sterling LLP.
136
Table of Contents
The consolidated financial statements of Zayo Group Holdings, Inc. as of June 30, 2012 and 2013, and for each of the years in the two year period ended June 30, 2012, have been included herein in reliance upon the report of KPMG LLP, independent registered public accounting firm, appearing elsewhere herein, and upon the authority of said firm as experts in accounting and auditing.
The consolidated financial statements of Zayo Group Holdings, Inc. for the year ended June 30, 2011, included in this prospectus and elsewhere in the registration statement have been so included in reliance upon the report of Grant Thornton LLP, independent registered public accountants, upon the authority of said firm as experts in accounting and auditing.
The consolidated financial statements of AboveNet as of December 31, 2011 and 2010 and for each of the three years in the period ended December 31, 2011, included in this prospectus and in the registration statement have been so included in reliance on the report of BDO USA, LLP, an independent registered public accounting firm, appearing elsewhere herein and in the registration statement, given on the authority of said firm as experts in auditing and accounting.
The consolidated financial statements of 360networks Corporation as of December 31, 2010 and 2009, and for each of the three years in the period ended December 31, 2010, included in this prospectus have been so included in reliance on the report of Moss Adams LLP, an independent registered public accounting firm, given on the authority of said firm as experts in accounting and auditing.
137
Table of Contents
WHERE YOU CAN FIND MORE INFORMATION
We have filed with the SEC a registration statement on Form S-1 under the Securities Act that registers the shares of our common stock to be sold in this offering. The registration statement, including the attached exhibits, contains additional relevant information about us and our common stock. The rules and regulations of the SEC allow us to omit from this document certain information included in the registration statement.
You may read and copy the reports and other information we file with the SEC at the SEC’s Public Reference Room at 100 F Street, N.E., Room 1580, Washington, D.C. 20549. You may also obtain copies of this information by mail from the public reference section of the SEC, 100 F Street, N.E., Washington, D.C. 20549, at prescribed rates. You may obtain information regarding the operation of the public reference room by calling 1-800-SEC-0330. The SEC also maintains a website that contains reports, proxy statements and other information about issuers, like us, who file electronically with the SEC. The address of that website is http://www.sec.gov.
Upon completion of this offering, we will become subject to the reporting, proxy and information requirements of the Exchange Act, and as a result will be required to file periodic reports, proxy statements and other information with the SEC. These periodic reports, proxy statements and other information will be available for inspection and copying at the SEC’s public reference room and the website of the SEC referred to above, as well as on our website, www.zayogroup.com. The contents of our website are not part of this prospectus, and you should not consider the contents of our website in making an investment decision with respect to our common stock.
138
Table of Contents
INDEX TO CONSOLIDATED FINANCIAL STATEMENTS
F-1
Table of Contents
ZAYO GROUP HOLDINGS, INC.
AUDITED CONSOLIDATED FINANCIAL STATEMENTS
F-2
Table of Contents
When the consolidated financial statements as of June 30, 2014 are issued, which will include the spin-off referred to in note 4 of the Notes to Consolidated Financial Statements, we will be in a position to render the following report.
/s/ KPMG LLP
Report of Independent Registered Public Accounting Firm
Board of Directors and Stockholder
Zayo Group Holdings, Inc.:
We have audited the accompanying consolidated balance sheets of Zayo Group Holdings, Inc. and subsidiaries (the Company) as of June 30, 2012 and 2013, and the related consolidated statements of operations, comprehensive loss, stockholder’s equity, and cash flows for each of the years in the two-year period ended June 30, 2013. These consolidated financial statements are the responsibility of the Company’s management. Our responsibility is to express an opinion on these consolidated financial statements based on our audits.
We conducted our audits in accordance with the standards of the Public Company Accounting Oversight Board (United States). Those standards require that we plan and perform the audit to obtain reasonable assurance about whether the financial statements are free of material misstatement. An audit includes examining, on a test basis, evidence supporting the amounts and disclosures in the financial statements. An audit also includes assessing the accounting principles used and significant estimates made by management, as well as evaluating the overall financial statement presentation. We believe that our audits provide a reasonable basis for our opinion.
In our opinion, the consolidated financial statements referred to above present fairly, in all material respects, the financial position of Zayo Group Holdings Inc. and subsidiaries as of June 30, 2012 and 2013, and the results of their operations and their cash flows for each of the years in the two-year period ended June 30, 2013, in conformity with U.S. generally accepted accounting principles.
[unsigned]
Denver, Colorado
July 2, 2014
F-3
Table of Contents
REPORT OF INDEPENDENT REGISTERED PUBLIC ACCOUNTING FIRM
Board of Directors and Shareholders
Zayo Group Holdings, Inc.
We have audited the accompanying consolidated statement of operations, comprehensive loss, changes in stockholders’ equity and cash flows of Zayo Group Holdings, Inc. (a Delaware corporation) and subsidiaries (the “Company”) for the year ended June 30, 2011. These financial statements are the responsibility of the Company’s management. Our responsibility is to express an opinion on these financial statements based on our audit.
We conducted our audit in accordance with the standards of the Public Company Accounting Oversight Board (United States). Those standards require that we plan and perform the audit to obtain reasonable assurance about whether the financial statements are free of material misstatement. We were not engaged to perform an audit of the Company’s internal control over financial reporting. Our audit included consideration of internal control over financial reporting as a basis for designing audit procedures that are appropriate in the circumstances, but not for the purpose of expressing an opinion on the effectiveness of the Company’s internal control over financial reporting. Accordingly, we express no such opinion. An audit also includes examining, on a test basis, evidence supporting the amounts and disclosures in the financial statements, assessing the accounting principles used and significant estimates made by management, as well as evaluating the overall financial statement presentation. We believe that our audit provide a reasonable basis for our opinion.
In our opinion, the consolidated financial statements referred to above present fairly, in all material respects, the consolidated results of operations of Zayo Group Holdings, Inc. and subsidiaries and their consolidated cash flows for the year ended June 30, 2011, in conformity with accounting principles generally accepted in the United States of America.
[unsigned]
Denver, Colorado
, 2014
Once the spin-off referred to in Note 4 of the Notes to the Consolidated Financial Statements qualifies for discontinued operations presentation, we will be in a position to render the foregoing auditor’s report.
/s/ GRANT THORNTON LLP
Denver, Colorado
July 2, 2014
F-4
Table of Contents
ZAYO GROUP HOLDINGS, INC. AND SUBSIDIARIES
CONSOLIDATED BALANCE SHEETS
(in thousands, except share and per share data)
| June 30, 2012 | June 30, 2013 | |||||||
| Assets |
||||||||
| Current assets |
||||||||
| Cash and cash equivalents |
$ | 150,693 | $ | 91,313 | ||||
| Trade receivables, net of allowance of $911 and $4,036 as of June 30, 2012 and 2013, respectively |
31,703 | 70,877 | ||||||
| Due from related parties |
231 | 622 | ||||||
| Prepaid expenses |
7,099 | 19,925 | ||||||
| Deferred income taxes, net |
6,018 | 90,628 | ||||||
| Restricted cash |
22,417 | — | ||||||
| Other current assets |
4,429 | 2,281 | ||||||
| Current assets of discontinued operations |
23,659 | 27,850 | ||||||
|
|
|
|
|
|||||
| Total current assets |
246,249 | 303,496 | ||||||
| Property and equipment, net |
754,738 | 2,437,707 | ||||||
| Intangible assets, net |
128,705 | 640,350 | ||||||
| Goodwill |
190,279 | 688,836 | ||||||
| Debt issuance costs, net |
19,706 | 99,098 | ||||||
| Deferred income taxes, net |
36,897 | 8,106 | ||||||
| Other assets |
21,875 | 29,354 | ||||||
| Assets of discontinued operations |
43,606 | 44,293 | ||||||
|
|
|
|
|
|||||
| Total assets |
$ | 1,442,055 | $ | 4,251,240 | ||||
|
|
|
|
|
|||||
| Liabilities and stockholder’s equity |
||||||||
| Current liabilities |
||||||||
| Current portion of long-term debt |
$ | 4,440 | $ | 16,200 | ||||
| Accounts payable |
16,180 | 33,530 | ||||||
| Accrued liabilities |
45,835 | 117,101 | ||||||
| Accrued interest |
10,863 | 55,048 | ||||||
| Capital lease obligations, current |
1,148 | 6,600 | ||||||
| Deferred revenue, current |
22,940 | 37,937 | ||||||
| Current liabilities of discontinued operations |
11,195 | 15,344 | ||||||
|
|
|
|
|
|||||
| Total current liabilities |
112,601 | 281,760 | ||||||
| Long-term debt, non-current |
685,281 | 2,814,505 | ||||||
| Capital lease obligation, non-current |
10,470 | 6,567 | ||||||
| Deferred revenue, non-current |
146,663 | 344,466 | ||||||
| Stock-based compensation liability |
54,367 | 159,320 | ||||||
| Deferred income taxes, net |
— | 5,992 | ||||||
| Other long-term liabilities |
9,085 | 19,549 | ||||||
| Liabilities of discontinued operations |
13,274 | 12,828 | ||||||
|
|
|
|
|
|||||
| Total liabilities |
1,031,741 | 3,644,987 | ||||||
| Commitments and contingencies (Note 15) |
||||||||
| Stockholder’s equity: |
||||||||
| Common stock, $0.001 par value—1,000 shares authorized; 1,000 shares issued and outstanding as of June 30, 2012 and 2013, respectively |
— | — | ||||||
| Additional paid-in capital |
425,444 | 763,355 | ||||||
| Accumulated other comprehensive loss |
— | (4,755 | ) | |||||
| Accumulated deficit |
(15,130 | ) | (152,347 | ) | ||||
|
|
|
|
|
|||||
| Total stockholder’s equity |
410,314 | 606,253 | ||||||
|
|
|
|
|
|||||
| Total liabilities and stockholder’s equity |
$ | 1,442,055 | $ | 4,251,240 | ||||
|
|
|
|
|
|||||
The accompanying notes are an integral part of these consolidated financial statements.
F-5
Table of Contents
ZAYO GROUP HOLDINGS, INC. AND SUBSIDIARIES
CONSOLIDATED STATEMENTS OF OPERATIONS
(in thousands, except share and per share data)
| Year Ended June 30, | ||||||||||||
| 2011 | 2012 | 2013 | ||||||||||
| Revenue |
$ | 282,143 | $ | 375,526 | $ | 1,004,354 | ||||||
|
|
|
|
|
|
|
|||||||
| Operating costs and expenses |
||||||||||||
| Operating costs (excluding depreciation and amortization shown separately below) |
70,978 | 82,083 | 145,877 | |||||||||
| Selling, general and administrative expenses, excluding stock-based compensation |
88,414 | 112,410 | 318,523 | |||||||||
| Stock-based compensation |
24,310 | 26,253 | 105,849 | |||||||||
|
|
|
|
|
|
|
|||||||
| Selling, general and administrative expenses |
112,724 | 138,663 | 424,372 | |||||||||
| Depreciation and amortization |
60,463 | 84,961 | 324,532 | |||||||||
|
|
|
|
|
|
|
|||||||
| Total operating costs and expenses |
244,165 | 305,707 | 894,781 | |||||||||
|
|
|
|
|
|
|
|||||||
| Operating income |
37,978 | 69,819 | 109,573 | |||||||||
|
|
|
|
|
|
|
|||||||
| Other expenses |
||||||||||||
| Interest expense |
(33,414 | ) | (50,720 | ) | (202,464 | ) | ||||||
| Loss on extinguishment of debt |
— | — | (77,253 | ) | ||||||||
| Impairment of cost method investment |
— | (2,248 | ) | — | ||||||||
| Other (expense)/income, net |
(126 | ) | 123 | 326 | ||||||||
|
|
|
|
|
|
|
|||||||
| Total other expenses, net |
(33,540 | ) | (52,845 | ) | (279,391 | ) | ||||||
|
|
|
|
|
|
|
|||||||
| Earnings/(loss) from continuing operations before provision for income taxes |
4,438 | 16,974 | (169,818 | ) | ||||||||
| Provision/(benefit) for income taxes |
11,329 | 26,871 | (24,205 | ) | ||||||||
|
|
|
|
|
|
|
|||||||
| Loss from continuing operations |
(6,891 | ) | (9,897 | ) | (145,613 | ) | ||||||
| Earnings from discontinued operations, net of income taxes |
5,331 | 8,673 | 8,396 | |||||||||
|
|
|
|
|
|
|
|||||||
| Net loss |
$ | (1,560 | ) | $ | (1,224 | ) | $ | (137,217 | ) | |||
|
|
|
|
|
|
|
|||||||
| Weighted-average shares used to compute net earnings (loss) per share: |
||||||||||||
| Basic and diluted |
1,000 | 1,000 | 1,000 | |||||||||
| Loss from continuing operations per share: |
||||||||||||
| Basic and diluted |
$ | (6,891 | ) | $ | (9,897 | ) | $ | (145,613 | ) | |||
| Earnings from discontinued operations per share: |
||||||||||||
| Basic and diluted |
$ | 5,331 | $ | 8,673 | $ | 8,396 | ||||||
| Net loss per share: |
||||||||||||
| Basic and diluted |
$ | (1,560 | ) | $ | (1,224 | ) | $ | (137,217 | ) | |||
| Pro forma (loss)/earnings per share (unaudited): |
||||||||||||
| Basic and diluted - continuing operations |
||||||||||||
| Basic and diluted - discontinued operations |
||||||||||||
The accompanying notes are an integral part of these consolidated financial statements.
F-6
Table of Contents
ZAYO GROUP HOLDINGS, INC. AND SUBSIDIARIES
CONSOLIDATED STATEMENTS OF COMPREHENSIVE LOSS
(in thousands)
| Year Ended June 30, | ||||||||||||
| 2011 | 2012 | 2013 | ||||||||||
| Net loss |
$ | (1,560 | ) | $ | (1,224 | ) | $ | (137,217 | ) | |||
| Foreign currency translation adjustments |
— | — | (4,755 | ) | ||||||||
|
|
|
|
|
|
|
|||||||
| Comprehensive loss |
$ | (1,560 | ) | $ | (1,224 | ) | $ | (141,972 | ) | |||
|
|
|
|
|
|
|
|||||||
The accompanying notes are an integral part of these consolidated financial statements.
F-7
Table of Contents
ZAYO GROUP HOLDINGS, INC. AND SUBSIDIARIES
CONSOLIDATED STATEMENTS OF STOCKHOLDER’S EQUITY
(in thousands, except share data)
| Common Shares |
Common Stock |
Additional Paid-In Capital |
Accumulated Other Comprehensive Loss |
Accumulated Deficit |
Total Stockholder’s Equity |
|||||||||||||||||||
| Balance at July 1, 2010 |
1,000 | $ | — | $ | 255,669 | $ | — | $ | (12,346 | ) | $ | 243,323 | ||||||||||||
| Capital contributed (cash) |
— | — | 15,500 | — | — | 15,500 | ||||||||||||||||||
| Stock-based compensation |
— | — | 820 | — | — | 820 | ||||||||||||||||||
| Net loss |
— | — | — | — | (1,560 | ) | (1,560 | ) | ||||||||||||||||
|
|
|
|
|
|
|
|
|
|
|
|
|
|||||||||||||
| Balance at June 30, 2011 |
1,000 | — | 271,989 | — | (13,906 | ) | 258,083 | |||||||||||||||||
|
|
|
|
|
|
|
|
|
|
|
|
|
|||||||||||||
| Capital contributed (cash) |
— | — | 127,046 | — | — | 127,046 | ||||||||||||||||||
| Non-cash contributions from CII, net |
— | — | 25,538 | — | — | 25,538 | ||||||||||||||||||
| Stock-based compensation |
— | — | 871 | — | — | 871 | ||||||||||||||||||
| Net loss |
— | — | — | — | (1,224 | ) | (1,224 | ) | ||||||||||||||||
|
|
|
|
|
|
|
|
|
|
|
|
|
|||||||||||||
| Balance at June 30, 2012 |
1,000 | — | 425,444 | — | (15,130 | ) | 410,314 | |||||||||||||||||
|
|
|
|
|
|
|
|
|
|
|
|
|
|||||||||||||
| Capital contributed (cash) |
— | — | 337,126 | — | — | 337,126 | ||||||||||||||||||
| Non-cash distributions to CII, net |
— | — | (68 | ) | — | — | (68 | ) | ||||||||||||||||
| Stock-based compensation |
— | — | 853 | — | — | 853 | ||||||||||||||||||
| Foreign currency translation adjustment |
— | — | — | (4,755 | ) | — | (4,755 | ) | ||||||||||||||||
| Net loss |
— | — | — | — | (137,217 | ) | (137,217 | ) | ||||||||||||||||
|
|
|
|
|
|
|
|
|
|
|
|
|
|||||||||||||
| Balance at June 30, 2013 |
1,000 | $ | — | $ | 763,355 | $ | (4,755 | ) | $ | (152,347 | ) | $ | 606,253 | |||||||||||
|
|
|
|
|
|
|
|
|
|
|
|
|
|||||||||||||
The accompanying notes are an integral part of these consolidated financial statements.
F-8
Table of Contents
ZAYO GROUP HOLDINGS, INC. AND SUBSIDIARIES
CONSOLIDATED STATEMENTS OF CASH FLOWS
(in thousands)
| Year Ended June 30, | ||||||||||||
| 2011 | 2012 | 2013 | ||||||||||
| Cash flows from operating activities |
||||||||||||
| Net loss |
$ | (1,560 | ) | $ | (1,224 | ) | $ | (137,217 | ) | |||
| Earnings from discontinued operations |
5,331 | 8,673 | 8,396 | |||||||||
|
|
|
|
|
|
|
|||||||
| Loss from continuing operations |
(6,891 | ) | (9,897 | ) | (145,613 | ) | ||||||
| Adjustments to reconcile net loss to net cash provided by operating activities of continuing operations |
||||||||||||
| Depreciation and amortization |
60,463 | 84,961 | 324,532 | |||||||||
| Loss on extinguishment of debt |
— | — | 77,253 | |||||||||
| Loss on disposal of property and equipment |
84 | 32 | — | |||||||||
| Provision for bad debts |
794 | 729 | 2,137 | |||||||||
| Non-cash interest expense |
2,413 | 4,773 | 12,313 | |||||||||
| Lease termination charge |
— | — | 10,197 | |||||||||
| Impairment of cost method investment |
— | 2,248 | — | |||||||||
| Stock-based compensation |
24,310 | 26,253 | 105,849 | |||||||||
| Additions to deferred revenue |
4,629 | 55,041 | 61,734 | |||||||||
| Amortization of deferred revenue |
(8,976 | ) | (13,785 | ) | (43,140 | ) | ||||||
| Deferred income taxes |
12,332 | 28,441 | (27,769 | ) | ||||||||
| Changes in operating assets and liabilities |
||||||||||||
| Trade receivables |
2,449 | (9,294 | ) | (4,433 | ) | |||||||
| Interest rate swap |
(566 | ) | — | — | ||||||||
| Prepaid expenses |
(638 | ) | 1,058 | 1,879 | ||||||||
| Other assets, current and non-current |
2,440 | (3,121 | ) | (11,130 | ) | |||||||
| Accounts payable and accrued liabilities |
1,409 | (1,504 | ) | 17,084 | ||||||||
| Payables to related parties, net |
8,054 | 5,742 | 16,799 | |||||||||
| Other liabilities |
(2,804 | ) | (4,047 | ) | 7,191 | |||||||
|
|
|
|
|
|
|
|||||||
| Net cash provided by operating activities of continuing operations |
99,502 | 167,630 | 404,883 | |||||||||
|
|
|
|
|
|
|
|||||||
| Cash flows from investing activities |
||||||||||||
| Purchases of property and equipment |
(116,068 | ) | (146,963 | ) | (332,551 | ) | ||||||
| Broadband stimulus grants received |
3,544 | 22,826 | 9,319 | |||||||||
| Proceeds from sale of property and equipment |
28 | — | — | |||||||||
| Acquisition of Abovenet, Inc., net of cash acquired |
— | — | (2,210,043 | ) | ||||||||
| Acquisition of FiberGate, net of cash acquired |
— | — | (118,335 | ) | ||||||||
| Acquisition of USCarrier Telecom, LLC |
— | — | (16,092 | ) | ||||||||
| Acquisition of First Telecom Services, LLC |
— | — | (109,700 | ) | ||||||||
| Acquisition of Litecast/Balticore, LLC |
— | — | (22,160 | ) | ||||||||
| Acquisition of Core NAP, LP, net of cash acquired |
— | — | (7,080 | ) | ||||||||
| Acquisition of 360networks Holdings (USA), net of cash acquired |
— | (317,891 | ) | — | ||||||||
| Acquisition of MarquisNet, net of cash acquired |
— | (15,456 | ) | — | ||||||||
| Acquisition of Arialink, net of cash acquired |
— | (17,926 | ) | — | ||||||||
| Acquisition of American Fiber Systems Holdings Corporation, net of cash acquired |
(110,000 | ) | — | — | ||||||||
| Acquisition of AGL Networks, LLC, net of cash acquired |
(73,666 | ) | — | — | ||||||||
| Arialink and MarquisNet purchase consideration returned |
— | — | 2,672 | |||||||||
|
|
|
|
|
|
|
|||||||
| Net cash used in investing activities of continuing operations |
(296,162 | ) | (475,410 | ) | (2,803,970 | ) | ||||||
|
|
|
|
|
|
|
|||||||
F-9
Table of Contents
| Year Ended June 30, | ||||||||||||
| 2011 | 2012 | 2013 | ||||||||||
| Cash flows from financing activities |
||||||||||||
| Equity contributions |
36,450 | 134,796 | 343,783 | |||||||||
| Proceeds from long-term debt |
103,000 | 335,550 | 3,189,339 | |||||||||
| Principal repayments on long-term debt |
— | (1,575 | ) | (1,058,577 | ) | |||||||
| Change in restricted cash, net |
578 | (22,820 | ) | 22,666 | ||||||||
| Principal repayments on capital lease obligations |
(1,732 | ) | (1,171 | ) | (1,931 | ) | ||||||
| Payment of deferred debt issuance costs |
(4,106 | ) | (11,701 | ) | (83,134 | ) | ||||||
| Payment of early redemption fees on debt extinguished |
— | — | (72,117 | ) | ||||||||
|
|
|
|
|
|
|
|||||||
| Net cash provided by financing activities of continuing operations |
134,190 | 433,079 | 2,340,029 | |||||||||
|
|
|
|
|
|
|
|||||||
| Cash flows from continuing operations |
(62,470 | ) | 125,299 | (59,058 | ) | |||||||
| Cash flows from discontinued operations |
||||||||||||
| Operating activities |
10,407 | 12,908 | 20,905 | |||||||||
| Investing activities |
(2,008 | ) | (1,310 | ) | (1,730 | ) | ||||||
| Financing activities |
(2,746 | ) | (12,309 | ) | (11,037 | ) | ||||||
|
|
|
|
|
|
|
|||||||
| Cash flows from discontinued operations |
5,653 | (711 | ) | 8,138 | ||||||||
|
|
|
|
|
|
|
|||||||
| Effect of changes in foreign exchange rates on cash |
— | — | (322 | ) | ||||||||
|
|
|
|
|
|
|
|||||||
| Net (decrease)/increase in cash and cash equivalents |
(56,817 | ) | 124,588 | (51,242 | ) | |||||||
|
|
|
|
|
|
|
|||||||
| Continuing operations: |
||||||||||||
| Cash and cash equivalents, beginning of year |
$ | 87,864 | $ | 25,394 | $ | 150,693 | ||||||
| Cash flows from continuing operations |
(62,470 | ) | 125,299 | (59,058 | ) | |||||||
| Effect of changes in foreign exchange rates on cash |
— | — | (322 | ) | ||||||||
|
|
|
|
|
|
|
|||||||
| Cash and cash equivalents, end of year |
$ | 25,394 | $ | 150,693 | $ | 91,313 | ||||||
|
|
|
|
|
|
|
|||||||
| Discontinued operations: |
||||||||||||
| Cash and cash equivalents, beginning of year |
$ | 2,907 | $ | 8,560 | $ | 7,849 | ||||||
| Cash flows from discontinued operations |
5,653 | (711 | ) | 8,138 | ||||||||
|
|
|
|
|
|
|
|||||||
| Cash and cash equivalents, end of year |
$ | 8,560 | $ | 7,849 | $ | 15,987 | ||||||
|
|
|
|
|
|
|
|||||||
| Supplemental disclosure of non-cash, investing and financing activities: |
||||||||||||
| Cash paid for interest, net of capitalized interest—continuing operations |
$ | 28,247 | $ | 43,964 | $ | 143,518 | ||||||
| Cash paid for interest, net of capitalized interest—discontinued operations |
624 | 953 | 611 | |||||||||
| Cash paid for income taxes, net of refunds—continuing operations |
2,974 | 1,739 | 2,811 | |||||||||
| Non-cash additions to property and equipment from capital leases—continuing operations |
200 | 367 | 11,404 | |||||||||
| Increase in accounts payable and accrued expenses for purchases of property and equipment, net—continuing operations |
5,911 | 4,010 | 15,021 | |||||||||
| Increase/(decrease) in accounts payable and accrued expenses for purchases of property and equipment, net—discontinued operations |
(523 | ) | (137 | ) | 101 | |||||||
| Interest payment made on behalf of the Company by CII |
4,590 | 10,951 | — | |||||||||
| Non-liquidating distribution to common unit holders made by CII on behalf of the Company |
— | 9,080 | — | |||||||||
| Promissory note issued as consideration for American Fiber Systems Holding Corporation acquisition |
4,141 | — | — | |||||||||
Refer to Note 3—Acquisitions for details regarding the Company’s recent acquisitions and Note 4—Spin-off of Business for details regarding the Company’s discontinued operations.
Refer to Note 12—Equity to the Company’s consolidated financial statements for details of the non-cash capital transactions.
The accompanying notes are an integral part of these consolidated financial statements.
F-10
Table of Contents
ZAYO GROUP HOLDINGS, INC. AND SUBSIDIARIES
Notes to Consolidated Financial Statements
(in thousands except share and per share data)
(1) ORGANIZATION AND DESCRIPTION OF BUSINESS
Zayo Group Holdings, Inc., a Delaware corporation, was formed on November 13, 2007, and is the parent company of a number of subsidiaries engaged in bandwidth infrastructure services. Zayo Group Holdings, Inc. and its subsidiaries are collectively referred to as “Zayo Group Holdings” or the “Company.” The Company’s primary operating subsidiary is Zayo Group, LLC (“ZGL”). Headquartered in Boulder, Colorado, the Company operates bandwidth infrastructure assets, including fiber networks and datacenters, in the United States and Europe to offer:
| • | Physical infrastructure, including dark fiber, mobile infrastructure and colocation services. |
| • | Lit services, including wavelengths, Ethernet, IP, and SONET services. |
| • | Other services, consisting of Zayo Professional Services. |
Zayo Group Holdings is wholly-owned by Communications Infrastructure Investments, LLC (“CII”).
(2) BASIS OF PRESENTATION AND SIGNIFICANT ACCOUNTING POLICIES
a. Basis of Presentation
The accompanying consolidated financial statements include all the accounts of the Company and its wholly-owned subsidiaries. All inter-company accounts and transactions have been eliminated in consolidation. The accompanying consolidated financial statements and related notes have been prepared in accordance with accounting principles generally accepted in the United States (“GAAP”).
Unless otherwise noted, dollar amounts and disclosures throughout the Notes to the consolidated financial statements relate to the Company’s continuing operations and are presented in thousands of dollars.
Our fiscal year ends June 30 each year, and we refer to the fiscal year ended June 30, 2013 as “Fiscal 2013,” the fiscal year ended June 30, 2012 as “Fiscal 2012,” and the fiscal year ended June 30, 2011 as “Fiscal 2011.”
b. Foreign Currency Translation
For operations outside the U.S. that have functional currencies other than the U.S. dollar, assets and liabilities are translated to U.S. dollars at period-end exchange rates, and revenue, expenses and cash flows are translated using monthly average exchange rates during the year. Gains or losses resulting from currency translation are recorded as a component of accumulated other comprehensive loss in stockholder’s equity and in the consolidated statements of comprehensive loss. The Company considers the majority of its investments in its foreign subsidiaries to be permanently reinvested. The Company’s foreign exchange transaction gains and losses are included within “Other income/(expense), net” in the consolidated statements of operations.
c. Discontinued Operations
On June 13, 2014, the Company completed a spin-off of Onvoy, LLC and its subsidiaries (“OVS”), to CII. The Company will account for the spin-off as an equity distribution at carryover basis and distribute assets and liabilities of OVS to CII on the spin-off date, as the transaction is between entities under common control. See Note 4—Spin-off of Business.
F-11
Table of Contents
ZAYO GROUP HOLDINGS, INC. AND SUBSIDIARIES
Notes to Consolidated Financial Statements (Continued)
(in thousands except share and per share data)
The Company determined all significant cash flows and continuing involvement associated with the operations of OVS were discontinued. The results of operations of OVS are reported as discontinued operations in the accompanying consolidated financial statements for all periods presented and is presented net of elimination activity.
In connection with certain business combinations, the Company acquired assets that supported products outside of the Company’s primary focus of providing bandwidth infrastructure and network neutral colocation services. In some cases, the net assets acquired that supported product offerings outside of the scope of the Company’s primary focus were spun-off to Holdings on the acquisition date and accounted for as equity transactions at carryover basis. As the spin-off of certain of these acquired non-core assets occurred on the acquisition date, the consolidated financial statements do not reflect the operating results or net assets of these spun-off businesses.
d. Use of Estimates
The preparation of the Company’s consolidated financial statements in conformity with GAAP requires management to make estimates and assumptions that affect the reported amounts of assets and liabilities, and disclosures of contingent assets and liabilities at the date of the financial statements and the reported amounts of revenue and expense during the reporting period. Significant estimates are used when establishing allowances for doubtful accounts, reserves for disputed line cost billings, determining useful lives for depreciation and amortization, determining accruals for exit activities associated with real estate leases, assessing the need for impairment charges (including those related to investments, intangible assets and goodwill), determining the fair values of assets acquired and liabilities assumed in business combinations, accounting for income taxes and related valuation allowances against deferred tax assets and estimating the common unit fair values used to compute the stock-based compensation liability. Management evaluates these estimates and judgments on an ongoing basis and makes estimates based on historical experience, current conditions, and various other assumptions that are believed to be reasonable at the time under the circumstances. The results of these estimates form the basis for making judgments about the carrying values of assets and liabilities as well as identifying and assessing the accounting treatment with respect to commitments and contingencies. Actual results may differ from these estimates.
e. Cash and Cash Equivalents and Restricted Cash
The Company considers all highly liquid investments with original maturities of three months or less to be cash and cash equivalents. Cash equivalents are stated at cost, which approximates fair value. Restricted cash consists of cash balances held by various financial institutions as collateral for letters of credit and surety bonds. These balances are reclassified to cash and cash equivalents when the underlying obligation is satisfied, or in accordance with the governing agreement. Restricted cash balances expected to become unrestricted during the next twelve months are recorded as current assets. As of June 30, 2012 and 2013, the Company had a current restricted cash balance of $22,417 and zero, respectively. The current restricted cash balance as of June 30, 2012 related to cash held in escrow associated with the Company’s July 2, 2012 debt refinancing—see Note 9—Long Term Debt. Restricted cash balances that are not expected to become unrestricted during the next twelve months are recorded as other non-current assets. As of June 30, 2012 and 2013, the Company had non-current restricted cash balances of $958 and $5,533, respectively.
F-12
Table of Contents
ZAYO GROUP HOLDINGS, INC. AND SUBSIDIARIES
Notes to Consolidated Financial Statements (Continued)
(in thousands except share and per share data)
f. Trade Receivables
Trade receivables are recorded at the invoiced amount and do not bear interest. The Company maintains an allowance for doubtful accounts for estimated losses inherent in its trade receivable portfolio. In establishing the required allowance, management considers historical losses adjusted to take into account current market conditions and the customer’s financial condition, and the age of receivables and current payment patterns. Account balances are charged off against the allowance after all means of collection have been exhausted and the potential for recovery is considered remote.
g. Property and Equipment
The Company’s property and equipment include assets in service and under construction or development.
Property and equipment is recorded at historical cost or acquisition date fair value. Costs associated directly with network construction, service installations, and development of business support systems, including employee-related costs, are capitalized. Depreciation is calculated on a straight-line basis over the asset’s estimated useful life from the date placed into service or acquired. Management periodically evaluates the estimates of the useful life of property and equipment by reviewing historical usage, with consideration given to technological changes, trends in the industry, and other economic factors that could impact the network architecture and asset utilization.
Equipment acquired under capital leases is recorded at the lower of the fair value of the asset or the net present value of the minimum lease payments at the inception of the lease. Depreciation of equipment held under capital leases is included in depreciation and amortization expense, and is calculated on a straight-line basis over the estimated useful lives of the assets, or the related lease term, whichever is shorter.
Management reviews property and equipment for impairment whenever events or changes in circumstances indicate that the carrying value of its property and equipment may not be recoverable. An impairment loss is recognized when the assets’ carrying value exceeds both the assets’ estimated undiscounted future cash flows and the assets’ estimated fair value. Measurement of the impairment loss is then based on the estimated fair value of the assets. Considerable judgment is required to project such future cash flows and, if required, to estimate the fair value of the property and equipment and the resulting amount of the impairment. No impairment charges were recorded for property and equipment during the years ended June 30, 2011, 2012 or 2013.
The Company capitalizes interest for assets that require a period of time to get them ready for their intended use. The amount of interest capitalized is based on the Company’s weighted average effective interest rate for outstanding debt obligations during the respective accounting period.
h. Goodwill and Acquired Intangibles
Intangible assets arising from business combinations, such as acquired customer contracts and relationships (collectively “customer relationships”), are initially recorded at fair value. The Company amortizes customer relationships primarily over an estimated life of 10 to 20 years, using the straight-line method as this method approximates the timing in which the Company expects to receive the benefit from the acquired customer relationship assets.
Goodwill represents the excess of the purchase price over the fair value of the net identifiable assets acquired in a business combination. Goodwill is reviewed for impairment at least annually in April, or more frequently if a triggering event occurs between impairment testing dates. The Company’s impairment assessment begins with a
F-13
Table of Contents
ZAYO GROUP HOLDINGS, INC. AND SUBSIDIARIES
Notes to Consolidated Financial Statements (Continued)
(in thousands except share and per share data)
qualitative assessment to determine whether it is more likely than not that the fair value of a reporting unit is less than its carrying value. The qualitative assessment includes comparing the overall financial performance of the reporting units against the planned results used in the last quantitative goodwill impairment test. Additionally, each reporting unit’s fair value is assessed in light of certain events and circumstances, including macroeconomic conditions, industry and market considerations, cost factors, and other relevant entity- and reporting unit-specific events. The selection and assessment of qualitative factors used to determine whether it is more likely than not that the fair value of a reporting unit exceeds the carrying value involves significant judgments and estimates. If it is determined under the qualitative assessment that it is more likely than not that the fair value of a reporting unit is less than its carrying value, then a two-step quantitative impairment test is performed. Under the first step, the estimated fair value of the reporting unit is compared with its carrying value (including goodwill). If the fair value of the reporting unit exceeds its carrying value, step two does not need to be performed. If the estimated fair value of the reporting unit is less than its carrying value, an indication of goodwill impairment exists for the reporting unit and the enterprise must perform step two of the impairment test (measurement). Under step two, an impairment loss is recognized for any excess of the carrying amount of the reporting unit’s goodwill over the implied fair value of that goodwill. The implied fair value of goodwill is determined by allocating the fair value of the reporting unit in a manner similar to a purchase price allocation in acquisition accounting. The residual amount after this allocation is the implied fair value of the reporting unit goodwill. Fair value of the reporting unit under the two-step assessment is determined using a combination of both income and market-based variation approaches. The inputs and assumptions to valuation methods used to estimate the fair value of reporting units involves significant judgments.
Intangible assets with finite useful lives are amortized over their respective estimated useful lives and reviewed for impairment whenever events or changes in circumstances indicate that the carrying amount of the asset may not be recoverable. No impairment charges were recorded for goodwill or intangibles during the years ended June 30, 2011, 2012 or 2013.
i. Derivative Financial Instruments
Derivative instruments are recorded in the balance sheet as either assets or liabilities, measured at fair value. The Company has historically entered into interest rate swaps to convert a portion of its floating-rate debt to fixed-rate debt and has not applied hedge accounting; therefore, the changes in the fair value of the interest rate swaps are recognized in earnings as adjustments to interest expense. The principal objectives of the derivative instruments are to minimize the cash interest rate risks associated with financing activities. The Company does not use financial instruments for trading purposes. The Company utilizes interest rate swap contracts in connection with debt instruments entered into during the July 2012 financing transactions. See Note 9—Long-term Debt, for further discussion of the Company’s debt obligations and Note 14—Fair Value Measurements, for a discussion of the fair value of the interest rate swaps.
j. Revenue Recognition
The Company recognizes revenues derived from leasing fiber optic telecommunications infrastructure and the provision of telecommunications and colocation services when the service has been provided and when there is persuasive evidence of an arrangement, the fee is fixed or determinable, customer acceptance has been obtained with relevant contract terms, and collection of the receivable is reasonably assured. Taxes collected from customers and remitted to a governmental authority are reported on a net basis and are excluded from revenue.
Most revenue is billed in advance on a fixed-rate basis. An immaterial amount of revenue is billed in arrears on a transactional basis determined by customer usage. The Company often bills customers for upfront charges,
F-14
Table of Contents
ZAYO GROUP HOLDINGS, INC. AND SUBSIDIARIES
Notes to Consolidated Financial Statements (Continued)
(in thousands except share and per share data)
which are non-refundable. These charges relate to activation fees, installation charges or prepayments for future services and are influenced by various business factors including how the Company and customer agree to structure the payment terms. The Company also defers costs associated with customer activation and installation to the extent of upfront amounts received from customers, which are recognized as expense over the same period for which the associated revenue is recognized.
The Company typically records revenues from leases of dark fiber, including indefeasible rights-of-use (“IRU”) agreements, over the term that the customer is given exclusive access to the assets. Dark fiber IRU agreements generally require the customer to make a down payment upon the execution of the agreement with monthly IRU fees paid over the contract term; however, in some cases, the Company receives up to the entire lease payment at the inception of the lease and recognizes the revenue ratably over the lease term. Revenue related to professional services to provide network management and technical support is recognized as services are provided.
In determining the appropriate amount of such revenue and related reserves to reflect in its consolidated financial statements, management evaluates payment history, credit ratings, customer financial performance, and historical or potential billing disputes and related estimates are based on these factors and assumptions.
k. Operating Costs and Accrued Liabilities
The Company’s operating costs consist primarily of third-party network service costs and colocation facility costs. Third-party network service costs result from the Company’s leasing of certain network facilities, primarily leases of circuits and dark fiber, from carriers to augment its owned infrastructure, for which the Company is generally billed a fixed monthly fee. The Company’s colocation facility costs include rent and license fees paid to the landlords of the buildings in which its zColo business operates, along with the utility costs to power those facilities.
The Company recognizes the cost of these facilities or services when it is incurred in accordance with contractual requirements. The Company routinely disputes incorrect billings. The most prevalent types of disputes include disputes for circuits that are not disconnected on a timely basis and usage bills with incorrect records. Depending on the type and complexity of the issues involved, it may take several quarters to resolve disputes.
In determining the amount of such operating expenses and related accrued liabilities to reflect in its consolidated financial statements, management considers the adequacy of documentation of disconnect notices, compliance with prevailing contractual requirements for submitting such disconnect notices and disputes to the provider of the facilities, and compliance with its interconnection agreements with these carriers. Significant judgment is required in estimating the ultimate outcome of the dispute resolution process, as well as any other costs that may be incurred to conclude the negotiations or settle any litigation.
l. Stock-Based Compensation
The common units granted by the Company’s ultimate parent company, CII, to the employees and independent directors of Zayo Group Holdings are considered stock-based compensation with terms that require the awards to be classified as liabilities due to cash settlement features. As such, the Company accounts for these awards as a liability and re-measures the liability at each reporting date. These awards typically vest over a period of three or four years with the first vesting date occurring one year after the grant date and the remaining unvested shares vesting pro-rata over the remaining term. The common units may fully vest subsequent to a sale of CII or its subsidiaries. The stock compensation expense associated with the common unit liability is recognized on a straight-line basis over the requisite service period of three to five years but is adjusted each reporting period such that the liability is equal to
F-15
Table of Contents
ZAYO GROUP HOLDINGS, INC. AND SUBSIDIARIES
Notes to Consolidated Financial Statements (Continued)
(in thousands except share and per share data)
the fair value of the vested awards. Subsequent to the vesting period end date, changes to the fair value of the liability classified awards are recognized as stock-based compensation expense until the awards are settled.
The preferred units granted by the Company’s ultimate parent company, CII, to the employees and independent directors of the Company are considered stock-based compensation with terms that require the awards to be classified as equity. As such, the Company accounts for these awards as equity, which requires the cost to be measured at the grant date based on the fair value of the award. The cost is recognized as expense over the requisite service period. Preferred unit awards typically vest over a period of three or four years with the first vesting date occurring one year after the grant date and the remaining unvested units vesting pro-rata over the remaining term and may fully vest subsequent to a sale of CII or its subsidiaries.
Determining the fair value of share-based awards at the grant date and subsequent reporting dates requires judgment. If actual results differ significantly from these estimates, stock-based compensation expense and the Company’s results of operations could be materially impacted.
m. Legal Costs
Costs incurred to hire and retain external legal counsel to advise the Company on regulatory, litigation and other matters is expensed as the related services are received.
n. Government Grants
The Company has received grant money from the National Telecommunications and Information Administration (“NTIA”) Broadband Technology Opportunity Program (“BTOP”). The BTOP program is intended to support the deployment of broadband infrastructure, encourage sustainable adoption of broadband service, and develop and maintain a nationwide public map of broadband service capability and availability, under which recipients are required to comply with certain operational and reporting requirements as it relates to these broadband infrastructure assets. The Company has accounted for grant money received for reimbursement of capital expenditures as a reduction of the cost of the asset in arriving at its carrying value. The grant is thus recognized in earnings over the useful life of a depreciable asset by way of a reduced depreciation charge.
o. Income Taxes
The Company recognizes income taxes under the asset and liability method. Deferred tax assets and liabilities are recognized for the future tax consequences attributable to differences between the financial statement carrying amounts of existing assets and liabilities and their respective tax bases. Deferred tax assets and liabilities are measured using enacted tax rates expected to apply to taxable income in the years in which those temporary differences are expected to be recovered or settled. The effect on deferred tax assets and liabilities of a change in tax rates is recognized in earnings in the period that includes the enactment date.
Estimating the future tax benefit associated with deferred tax assets requires significant judgment. Deferred tax assets arise from a variety of sources, the most significant being: tax losses that can be carried forward to be utilized against taxable income in future years; and expenses recognized in the Company’s financial statements but disallowed in the Company’s tax return until the associated cash flow occurs.
The Company records a valuation allowance to reduce its deferred tax assets to the amount that is expected to be recognized. The valuation allowance is established if, based on available evidence, it is more-likely-than-not that all or some portion of the asset will not be realized due to the inability to generate sufficient taxable income in the period and/or of the character necessary to utilize the benefit of the deferred tax asset. When evaluating
F-16
Table of Contents
ZAYO GROUP HOLDINGS, INC. AND SUBSIDIARIES
Notes to Consolidated Financial Statements (Continued)
(in thousands except share and per share data)
whether it is more-likely-than-not that all or some portion of the deferred tax asset will not be realized, all available evidence, both positive and negative, that may affect the realizability of deferred tax assets is identified and considered in determining the appropriate amount of the valuation allowance. The Company continues to monitor its financial performance and other evidence each quarter to determine the appropriateness of the Company’s valuation allowance. At each balance sheet date, existing assessments are reviewed and, if necessary, revised to reflect changed circumstances.
The analysis of the Company’s ability to utilize its NOL balance is based on the Company’s forecasted taxable income. The forecasted assumptions approximate the Company’s best estimates, including market growth rates, future pricing, market acceptance of the Company’s products and services, future expected capital investments, and discount rates. If the Company is unable to meet its taxable income forecasts in future periods the Company may change its conclusion about the appropriateness of the valuation allowance which could create a substantial income tax expense in the Company’s consolidated statement of operations in the period such change occurs.
The Company records interest related to unrecognized tax benefits and penalties in the provision for income taxes.
p. Earnings/(Loss) per Share
Basic earnings/(loss) per share is computed as net income/(loss) divided by the weighted-average number of common shares outstanding for the period. Diluted earnings (loss) per share is computed as net income (loss) divided by the weighted-average number of common shares outstanding for the period plus common stock equivalents consisting of shares subject to stock-based awards with exercise prices less than or equal to the average market price of the Company’s common stock for the period, to the extent their inclusion would be dilutive. Potential dilutive securities are excluded from the computation of diluted earnings (loss) per share if their effect is anti-dilutive.
q. Fair Value of Financial Instruments
Relevant accounting literature defines and establishes a framework for measuring fair value, and requires expanded disclosures about fair value measurements. It also emphasizes that fair value is a market-based measurement, not an entity-specific measurement, and defines fair value as the price that would be received to sell an asset or transfer a liability in an orderly transaction between market participants at the measurement date. Valuation techniques that may be used include the market approach (comparable market prices), the income approach (present value of future income or cash flow) and the cost approach (cost to replace the service capacity of an asset or replacement cost), which are each based upon observable and unobservable inputs. Observable inputs reflect market data obtained from independent sources, while unobservable inputs reflect the Company’s market assumptions.
Fair Value Hierarchy
A fair value hierarchy is established that requires an entity to maximize the use of observable inputs and minimize the use of unobservable inputs when measuring fair value. A financial instrument’s categorization within the fair value hierarchy is based upon the lowest level of input that is significant to the fair value measurement. The three levels of inputs that are used to measure fair value are:
Level 1
Inputs to the valuation methodology are unadjusted quoted prices for identical assets or liabilities in active markets that the Company has the ability to access.
F-17
Table of Contents
ZAYO GROUP HOLDINGS, INC. AND SUBSIDIARIES
Notes to Consolidated Financial Statements (Continued)
(in thousands except share and per share data)
Level 2
Inputs to the valuation methodology include:
| • | quoted prices for similar assets or liabilities in active markets; |
| • | quoted prices for identical or similar assets or liabilities in inactive markets; |
| • | inputs other than quoted prices that are observable for the asset or liability; and |
| • | inputs that are derived principally from or corroborated by observable market data by correlation or other means. |
If the asset or liability has a specified (contractual) term, the Level 2 input must be observable for substantially the full term of the asset or liability.
Level 3
Inputs to the valuation methodology are unobservable and significant to the fair value measurement.
The Company views fair value as the price that would be received from selling an asset or paid to transfer a liability in an orderly transaction between market participants at the measurement date. When determining the fair value measurements for assets and liabilities required to be recorded at fair value, management considers the principal or most advantageous market in which it would transact and considers assumptions that market participants would use when pricing the asset or liability, such as inherent risk, transfer restrictions, and risk of nonperformance.
q. Concentration of Credit Risk
Financial instruments that potentially subject the Company to concentration of credit risk consist principally of cash investments and accounts receivable. The Company’s cash and cash equivalents are primarily held in commercial bank accounts in the United States. The Company limits its cash investments to high-quality financial institutions in order to minimize its credit risk.
The Company’s trade receivables, which are unsecured, are geographically dispersed. During the year ended June 30, 2013, the Company had no single customer that exceeded 10% of total revenue. During the years ended June 30, 2011 and 2012, the Company had one customer that accounted for 12% of the total revenue recognized during each period. As of June 30, 2012, the Company had one customer with a trade receivable balance of 14% of total receivables. No other customers’ trade receivable balance as of June 30, 2012 or 2013 exceeded 10% of the Company’s consolidated net trade receivable balance.
(3) ACQUISITIONS
As of June 30, 2013 and prior to or since the formation of Zayo Group Holdings, Inc. in November 2007, the Company has consummated 25 transactions accounted for as business combinations. The acquisitions were executed as part of the Company’s business strategy of expanding through acquisitions. The acquisitions of these businesses have allowed the Company to increase the scale at which it operates, which in turn affords the Company the ability to increase its operating leverage, extend its network reach, and broaden its customer base.
The accompanying consolidated financial statements include the operations of the acquired entities from their respective acquisition dates.
F-18
Table of Contents
ZAYO GROUP HOLDINGS, INC. AND SUBSIDIARIES
Notes to Consolidated Financial Statements (Continued)
(in thousands except share and per share data)
Acquisitions During the Year Ended June 30, 2011
AGL Networks, LLC (“AGL Networks”)
On July 1, 2010, the Company acquired all of the equity interest in AGL Networks. The purchase price of this acquisition, after post-close adjustments, was $73,666. The acquisition was financed with cash on hand. The acquisition was considered an asset purchase for tax purposes.
American Fiber Systems Holding Corporation (“AFS”)
On October 1, 2010, the Company acquired all of the equity interest in AFS, the parent company of American Fiber Systems, Inc. The purchase price was $110,000 in cash and a $4,500 non-interest bearing promissory note due in 2012 for all of the interest in AFS. The Company calculated the fair market value of the promissory note to be $4,141 resulting in an aggregate purchase price of $114,141 . The purchase price was based upon the valuation of both the business and assets directly owned by AFS and its ownership interest in USCarrier Telecom Holdings, LLC (“USCarrier”). The acquisition was considered a stock purchase for tax purposes.
Acquisitions During the Year Ended June 30, 2012
360networks Holdings (USA) Inc. (“360networks”)
On December 1, 2011, the Company acquired all of the outstanding equity interest in 360networks for a contractual purchase price of $345,000. In connection with the agreement, the Company agreed to assume a net working capital deficit of approximately $26,400 and acquired $709 in cash balances. In March 2012, the Company received $400 in cash from an escrow account as a final working capital adjustment. As a result, the net consideration paid for the transaction was $317,891. The acquisition was funded with proceeds from a $315,000 Senior Secured Term Loan Facility (“Original Term Loan Facility”), which was entered into on December 1, 2011 (see Note 9—Long-Term Debt) and cash on hand.
Included in the $345,000 contractual purchase price was VoIP360, Inc., a legal subsidiary of 360networks. The VoIP360, Inc. entity held substantially all of 360networks’ Voice over Internet Protocol (“VoIP”) and other voice product offerings. Concurrently with the close of the 360networks acquisition, the Company contributed 360networks’ VoIP operations to OVS. On the contribution date, the Company estimated the fair value of the VoIP assets and liabilities that were distributed to OVS to be $11,700, which is netted within the caption “Net assets contributed to OVS” presented in the purchase price allocation table below. The acquisition was considered a stock purchase for tax purposes.
Mercury Marquis Holdings, LLC (“MarquisNet”)
On December 31, 2011, the Company entered into an Asset Purchase Agreement with MarquisNet. The agreement was consummated on the same date, at which time the Company acquired substantially all of the net assets of MarquisNet for a purchase price of $15,875, subject to post-closing adjustments. In connection with the agreement, the parties estimated the Company would assume a net working capital deficit of approximately $419. The Company also received an escrow refund totaling $1,875 related to the resolution of contingent purchase price adjustments in connection with the MarquisNet acquisition. As such, the consideration paid for the transaction was reduced to $13,581. The acquisition was funded with a draw on the Company’s revolving line-of-credit, which was subsequently repaid. The acquisition was considered an asset purchase for tax purposes.
F-19
Table of Contents
ZAYO GROUP HOLDINGS, INC. AND SUBSIDIARIES
Notes to Consolidated Financial Statements (Continued)
(in thousands except share and per share data)
Control Room Technologies, LLC, Allegan Fiber Communications, LLC and Lansing Fiber Communications (collectively “Arialink”)
On May 1, 2012, the Company acquired 100% of the equity interest in Arialink. The purchase price, which was funded with cash on hand, was $17,129, net of cash acquired and an escrow refund totaling $797 related to the resolution of contingent purchase price adjustments in connection with the Arialink acquisition. The acquisition was considered an asset purchase for tax purposes.
Included in the Arialink acquisition were certain assets and liabilities that supported Arialink’s managed service product offerings. Concurrently with the close of the Arialink acquisition, the Company contributed the portion of Arialink’s business that supported those managed service product offerings to OVS. The Company’s estimate of the fair value of the net assets contributed to OVS is approximately $1,752.
Acquisitions During the Year Ended June 30, 2013
AboveNet, Inc. (“AboveNet”)
On July 2, 2012, the Company acquired 100% of the outstanding capital stock of AboveNet, previously a publicly traded company listed on the New York Stock Exchange, in exchange for cash of approximately $2,210,043, net of cash acquired. The purchase price was based upon the price of $84 per share agreed to in the Agreement and Plan of Merger and the number of AboveNet shares outstanding on July 2, 2012. The acquisition was funded through cash proceeds raised through financing transactions that occurred in July 2012. The acquisition was considered a stock purchase for tax purposes.
FiberGate Holdings, Inc. (“FiberGate”)
On August 31, 2012, the Company acquired 100% of the equity interest in FiberGate, a privately held corporation, for total consideration of $118,335. The acquisition was funded with cash on hand. $17,550 of the purchase price is currently held in escrow pending the expiration of the working capital and indemnification adjustment period. The acquisition was considered a stock purchase for tax purposes.
USCarrier Telecom, LLC (“USCarrier”)
In connection with the October 1, 2010 acquisition of AFS, the Company acquired an ownership interest in USCarrier. As of June 30, 2012, the Company owned 55% of the outstanding Class A membership units and 34% of the outstanding Class B membership units of USCarrier. On October 1, 2012, the Company acquired the remaining equity interests in USCarrier not previously owned for total consideration of $16,092, subject to certain post-closing adjustments. The purchase price was paid with cash on hand. The acquisition was considered an asset purchase for tax purposes.
First Telecom Services, LLC (“First Telecom”)
On December 14, 2012, the Company acquired 100% of the equity interest in First Telecom, for total consideration of $109,700, subject to certain post-closing adjustments. The purchase price was paid with cash on hand. The acquisition was considered an asset purchase for tax purposes.
Litecast/Balticore, LLC (“Litecast”)
On December 31, 2012, the Company acquired 100% of the equity interest in Litecast for total consideration of $22,160, subject to certain post-closing adjustments. $3,338 of the purchase price is currently held in escrow
F-20
Table of Contents
ZAYO GROUP HOLDINGS, INC. AND SUBSIDIARIES
Notes to Consolidated Financial Statements (Continued)
(in thousands except share and per share data)
pending the expiration of the indemnification adjustment period. The purchase price was paid with cash on hand. The acquisition was considered an asset purchase for tax purposes.
Core NAP, L.P. (“Core NAP”)
On May 31, 2013, the Company acquired substantially all of the net assets of Core NAP for a purchase price of approximately $7,080, subject to customary post-closing adjustments. The purchase price was paid with cash on hand. The acquisition was considered an asset purchase for tax purposes.
Recently Closed Acquisitions
Access Communications, Inc. (“Access”)
On August 13, 2013, the Company entered into a purchase agreement with Access, a Minnesota corporation, and shareholders of Access, and that acquisition closed on October 1, 2013. The Company acquired 100% of the equity interest in Access. The acquisition was considered a stock purchase for tax purposes. The purchase price, subject to certain customary post-closing adjustments, was $40,068 and was paid with cash on hand. $4,000 of the purchase price is currently held in escrow pending the expiration of the indemnification adjustment period.
FiberLink, LLC (“FiberLink”)
On October 2, 2013, the Company entered into a purchase agreement with FiberLink, an Illinois limited liability company, and the shareholders of FiberLink. The transaction was consummated on the same date, at which time the Company acquired 100% of the equity interest in FiberLink. The acquisition was considered an asset purchase for tax purposes. The purchase price of $43,137 was primarily paid with available funds drawn on the Company’s revolving credit facility.
CoreXchange, Inc. (“CoreXchange”)
On March 4, 2014, the Company entered into a purchase agreement with CoreXchange, a data center, bandwidth and managed services provider in Dallas, Texas. The transaction was consummated on the same date, at which time the Company acquired one new data center operation located at 8600 Harry Hines Blvd. and secured additional square footage in its existing data center for a total purchase price of $17,502, subject to customary post-closing adjustments. The purchase price was paid with cash on hand. $1,775 of the purchase price is currently held in escrow pending the expiration of the indemnification adjustment period.
Geo Networks Limited (“Geo”)
On May 16, 2014, the Company entered into a purchase agreement with Ego Holdings Limited and the shareholders of Geo to acquire all of the outstanding shares of Geo, a London-based dark fiber provider. The transaction was consummated on the same date, at which time the Company acquired 100% of the equity interest in Geo. The purchase price of approximately £175,000 (or $294,288 based on the foreign currency exchange rate on May 16, 2014) was funded with a combination of cash on hand and available funds drawn on the Company’s Revolver.
Neo Telecoms (“Neo”)
On July 1, 2014, the Company acquired a 96% equity interest in Neo, a Paris-based bandwidth infrastructure company. The agreement also includes a contractual mechanism to acquire the remaining approximately 4% equity
F-21
Table of Contents
ZAYO GROUP HOLDINGS, INC. AND SUBSIDIARIES
Notes to Consolidated Financial Statements (Continued)
(in thousands except share and per share data)
interest on or after December 31, 2015. The purchase price of €58,000 Euros (or $79,344 based on the exchange rate as of July 1, 2014) was in consideration of acquiring full equity ownership in Neo and is subject to certain adjustments post-closing. The purchase price was paid with cash on hand available from the proceeds of the Sixth Amendment to the Company’s Term Loan Facility (see Note 19—Subsequent Events).
Colo Facilities Atlanta (“AtlantaNAP”)
On July 1, 2014, we acquired AtlantaNAP, a data center and managed services provider in Atlanta, for a purchase price of $52,500 million. The purchase price was paid with cash on hand. The acquisition of AtlantaNAP added over 72,000 square feet of total data center space, including 42,000 square feet of conditioned colocation space.
Acquisition Method Accounting Estimates
The Company initially recognizes the assets and liabilities acquired from the aforementioned acquisitions based on its preliminary estimates of their acquisition date fair values. As additional information becomes known concerning the acquired assets and assumed liabilities, management may make adjustments to the opening balance sheet of the acquired company up to the end of the measurement period, which is no longer than a one year period following the acquisition date. The determination of the fair values of the acquired assets and liabilities assumed (and the related determination of estimated lives of depreciable tangible and identifiable intangible assets) require significant judgment. As of June 30, 2013, the Company finalized its fair value analysis and resulting purchase accounting for the 360networks, MarquisNet and Arialink acquisitions consummated in Fiscal 2012 and for the AboveNet, FiberGate, USCarrier, First Telecom, Litecast, and Core NAP acquisitions consummated in Fiscal 2013.
The table below reflects the Company’s estimates of the acquisition date fair values of the assets and liabilities assumed from its Fiscal 2011 acquisitions:
| AGL Networks | AFS | |||||||
| Acquisition date |
July 1, 2010 | October 1, 2010 | ||||||
| Current assets |
$ | 3,714 | $ | 3,808 | ||||
| Property and equipment |
93,136 | 56,481 | ||||||
| Intangibles-customer relationships |
3,433 | 57,082 | ||||||
| Goodwill |
220 | 15,746 | ||||||
| Investment in USCarrier |
— | 15,075 | ||||||
| Other assets |
680 | 335 | ||||||
|
|
|
|
|
|||||
| Total assets acquired |
101,183 | 148,527 | ||||||
|
|
|
|
|
|||||
| Current liabilities |
1,006 | 3,396 | ||||||
| Deferred revenue |
26,511 | 23,905 | ||||||
| Deferred tax liability, net |
— | 3,958 | ||||||
| Other liabilities |
— | 3,127 | ||||||
|
|
|
|
|
|||||
| Total liabilities assumed |
27,517 | 34,386 | ||||||
|
|
|
|
|
|||||
| Net assets acquired |
73,666 | 114,141 | ||||||
| Note payable to former AFS Holdings owners |
— | (4,141 | ) | |||||
|
|
|
|
|
|||||
| Net cash paid |
$ | 73,666 | $ | 110,000 | ||||
|
|
|
|
|
|||||
F-22
Table of Contents
ZAYO GROUP HOLDINGS, INC. AND SUBSIDIARIES
Notes to Consolidated Financial Statements (Continued)
(in thousands except share and per share data)
The table below reflects the Company’s estimates of the acquisition date fair values of the acquired assets and liabilities assumed from its Fiscal 2012 acquisitions:
| 360networks | MarquisNet | Arialink | ||||||||||
| Acquisition date |
December 1, 2011 |
December 31, 2011 |
May 1, 2012 |
|||||||||
| Cash |
$ | 709 | $ | — | $ | 74 | ||||||
| Other current assets |
10,722 | 64 | 97 | |||||||||
| Property and equipment |
167,116 | 1,295 | 8,873 | |||||||||
| Deferred tax assets, net |
88,600 | — | 741 | |||||||||
| Intangibles |
23,959 | 7,874 | 6,807 | |||||||||
| Goodwill |
96,811 | 4,735 | 3,753 | |||||||||
| Other assets |
214 | — | 31 | |||||||||
|
|
|
|
|
|
|
|||||||
| Total assets acquired |
388,131 | 13,968 | 20,376 | |||||||||
|
|
|
|
|
|
|
|||||||
| Current liabilities |
32,304 | 254 | 1,295 | |||||||||
| Deferred revenue |
45,455 | — | 2,685 | |||||||||
| Other liabilities |
3,472 | 133 | 945 | |||||||||
|
|
|
|
|
|
|
|||||||
| Total liabilities assumed |
81,231 | 387 | 4,925 | |||||||||
|
|
|
|
|
|
|
|||||||
| Net assets acquired |
306,900 | 13,581 | 15,451 | |||||||||
| Net assets contributed to OVS |
11,700 | — | 1,752 | |||||||||
| Less cash acquired |
(709 | ) | — | (74 | ) | |||||||
|
|
|
|
|
|
|
|||||||
| Net cash paid |
$ | 317,891 | $ | 13,581 | $ | 17,129 | ||||||
|
|
|
|
|
|
|
|||||||
The table below reflects the Company’s estimates of the acquisition date fair values of the assets and liabilities assumed from its Fiscal 2013 acquisitions:
| Fibergate | USCarrier |
First Telecom | Litecast | |||||||||||||||||||||
| Acquisition date |
AboveNet July 2, 2012 |
August 31, 2012 |
October 1, 2012 |
December 14, 2012 |
December 31, 2012 |
Core NAP May 31, 2013 |
||||||||||||||||||
| Cash |
$ | 141,586 | $ | 2,278 | $ | — | $ | — | $ | — | $ | — | ||||||||||||
| Other current assets |
46,501 | 4,912 | 1,297 | 5,901 | 256 | 198 | ||||||||||||||||||
| Property and equipment |
1,477,320 | 58,975 | 19,361 | 63,543 | 386 | 2,507 | ||||||||||||||||||
| Deferred tax assets, net |
42,126 | — | 1,986 | 19,238 | 51 | — | ||||||||||||||||||
| Intangibles |
480,366 | 35,963 | 6,820 | 17,135 | 12,510 | 4,105 | ||||||||||||||||||
| Goodwill |
381,634 | 53,783 | 5,376 | 48,382 | 9,867 | 986 | ||||||||||||||||||
| Other assets |
12,564 | 58 | 27 | 60 | — | — | ||||||||||||||||||
|
|
|
|
|
|
|
|
|
|
|
|
|
|||||||||||||
| Total assets acquired |
2,582,097 | 155,969 | 34,867 | 154,259 | 23,070 | 7,796 | ||||||||||||||||||
|
|
|
|
|
|
|
|
|
|
|
|
|
|||||||||||||
| Current liabilities |
78,371 | 1,508 | 3,742 | 4,560 | 209 | 543 | ||||||||||||||||||
| Deferred revenue |
146,016 | 2,541 | 2,206 | 39,999 | 701 | — | ||||||||||||||||||
| Other liabilities |
6,081 | — | — | — | — | 173 | ||||||||||||||||||
| Deferred tax liability, net |
— | 31,307 | — | — | — | — | ||||||||||||||||||
|
|
|
|
|
|
|
|
|
|
|
|
|
|||||||||||||
| Total liabilities assumed |
230,468 | 35,356 | 5,948 | 44,559 | 910 | 716 | ||||||||||||||||||
|
|
|
|
|
|
|
|
|
|
|
|
|
|||||||||||||
| Net assets acquired |
2,351,629 | 120,613 | 28,919 | 109,700 | 22,160 | 7,080 | ||||||||||||||||||
| Cost method investment in USCarrier |
— | — | (12,827 | ) | — | — | — | |||||||||||||||||
| Less cash acquired |
(141,586 | ) | (2,278 | ) | — | — | — | — | ||||||||||||||||
|
|
|
|
|
|
|
|
|
|
|
|
|
|||||||||||||
| Net cash paid |
$ | 2,210,043 | $ | 118,335 | $ | 16,092 | $ | 109,700 | $ | 22,160 | $ | 7,080 | ||||||||||||
|
|
|
|
|
|
|
|
|
|
|
|
|
|||||||||||||
F-23
Table of Contents
ZAYO GROUP HOLDINGS, INC. AND SUBSIDIARIES
Notes to Consolidated Financial Statements (Continued)
(in thousands except share and per share data)
The goodwill arising from the Company’s acquisitions results from the cost synergies, anticipated incremental sales to the acquired company’s customer base and economies-of-scale expected from the acquisitions. The Company has allocated the goodwill to the reporting units (in existence on the respective acquisition dates) that were expected to benefit from the acquired goodwill. The allocation was determined based on the excess of the fair value of the acquired business over the fair value of the individual assets acquired and liabilities assumed that were assigned to the reporting units. Note 7—Goodwill, displays the allocation of the Company’s acquired goodwill to each of its reporting units. The goodwill associated with the acquisitions of USCarrier, First Telecom, Litecast, and Core NAP is deductible for tax purposes. The goodwill associated with the acquisitions of AboveNet and Fibergate is not deductible for tax purposes.
In each of the Company’s Fiscal 2011, 2012, and 2013 acquisitions, the Company acquired certain customer relationships. These relationships represent a valuable intangible asset, as the Company anticipates continued business from the acquired customer bases. The Company’s estimate of the fair value of the acquired customer relationships is based on a multi-period excess earnings valuation technique. The fair value of the acquired customer relationships for each acquisition was determined to be as follows: 2011 acquisitions—AGL Networks, $3,433; AFS, $57,082; 2012 acquisitions—360networks, $19,923; MarquisNet, $7,874; Arialink, $6,807; 2013 acquisitions—AboveNet, $478,112; FiberGate, $35,963; USCarrier, $6,820; First Telecom, $17,135; LiteCast, $12,510. For Fiscal 2011 acquisitions, the Company estimated the useful life of the acquired customer relationships to be approximately 19 and 14 years, respectively, as it relates to the AGL Networks and AFS acquisitions. For Fiscal 2012 acquisitions, the Company estimated the useful life of the acquired customer relationships to be approximately 20 years as it relates to Arialink and 360networks and 11 years for MarquisNet. For Fiscal 2013 acquisitions, the Company estimated the useful life of the acquired customer relationships to be approximately 20 years as it relates to AboveNet, FiberGate, Litecast and USCarrier and 15 years for First Telecom.
The previous owners of AboveNet, 360networks, and First Telecom had entered into various agreements, including IRU agreements with other telecommunication service providers to lease fiber and other bandwidth infrastructure in exchange for upfront cash payments. The Company accounted for acquired deferred revenue at its acquisition date fair value, which was determined utilizing both the income and market approaches. The income approach was based upon management’s assessment of the cost of the network encumbered by the IRU contracts in place, as well as the future costs to be incurred in connection with the Company’s continuing legal obligation associated with the acquired IRU contracts plus a reasonable profit margin. The market approach incorporated the actual up-front payments received by AboveNet and 360networks under contracts entered in to within close proximity to the acquisition date, as those were recent market transactions between parties unrelated to the Company, and comparable transactions that the Company had entered into with other third-party customers within 18 months of the acquisition. A fair value of $146,016, $45,455, and $39,999 was assigned to the acquired deferred revenue balance of AboveNet, 360networks, and First Telecom, respectively. The acquired deferred revenue is being recognized over a weighted average contract term of 9.1 years, 12.5 years, and 14.2 years for the AboveNet, 360networks, and First Telecom acquisitions, respectively.
Purchase Accounting Estimates Associated with Deferred Taxes
The two largest acquisitions effectuated in the last three years were 360networks and AboveNet.
Based on the Company’s fair value assessment related to deferred tax assets acquired in the 360networks and AboveNet acquisitions, a value of $88,600 and $42,126, respectively, was assigned to the acquired net deferred tax assets and liabilities.
F-24
Table of Contents
ZAYO GROUP HOLDINGS, INC. AND SUBSIDIARIES
Notes to Consolidated Financial Statements (Continued)
(in thousands except share and per share data)
In conjunction with the finalization of acquisition accounting for 360networks and AboveNet, the Company completed a “change in ownership” analysis, within the meaning of Section 382 of the Internal Revenue Code (“IRC”). Section 382 of the IRC limits an acquiring company’s ability to utilize net operating loss carryforwards (“NOLs”) previously generated by an acquired company in order to reduce future taxable income. As a result of the Company’s acquisition of AboveNet, the Company is subject to annual limitations on usage of the acquired $1,008,755 of NOLs generated by AboveNet prior to the acquisition date.
The tax effect of temporary differences that give rise to significant portions of the deferred tax assets and deferred tax liabilities are as follows:
| 360networks | AboveNet | |||||||
| December 1, 2011 | July 2, 2012 | |||||||
| Deferred income tax assets: |
||||||||
| Net operating loss carry forwards |
$ | 33,111 | $ | 405,292 | ||||
| Property and equipment |
41,071 | — | ||||||
| Deferred revenue |
16,456 | 49,140 | ||||||
| Accrued expenses |
2,301 | 12,243 | ||||||
| Allowance for doubtful accounts |
16 | 2,435 | ||||||
|
|
|
|
|
|||||
| Total deferred income tax assets |
92,955 | 469,110 | ||||||
|
|
|
|
|
|||||
| Deferred income tax liabilities: |
||||||||
| Property and equipment |
— | (249,963 | ) | |||||
| Intangible assets |
(4,355 | ) | (177,021 | ) | ||||
|
|
|
|
|
|||||
| Total deferred income tax liabilities |
(4,355 | ) | (426,984 | ) | ||||
|
|
|
|
|
|||||
| Net deferred income tax assets |
$ | 88,600 | $ | 42,126 | ||||
|
|
|
|
|
|||||
Transaction Costs
Transaction costs include expenses associated with professional services (i.e., legal, accounting, regulatory, etc.) rendered in connection with signed and/or closed acquisitions, travel expense, severance expense incurred on the date of acquisition, and other direct expenses incurred that are associated with such acquisitions. The Company incurred transaction costs of $865, $6,630, and $14,204 during the years ended June 30, 2011, 2012 and 2013. Transaction costs have been included in selling, general and administrative expenses in the consolidated statements of operations and in cash flows from operating activities in the consolidated statements of cash flows during these periods.
F-25
Table of Contents
ZAYO GROUP HOLDINGS, INC. AND SUBSIDIARIES
Notes to Consolidated Financial Statements (Continued)
(in thousands except share and per share data)
Pro-forma Financial Information
The unaudited pro forma results presented below include the effects of the Company’s Fiscal 2012 acquisitions of 360networks, Arialink and MarquisNet and the Company’s Fiscal 2013 acquisitions of AboveNet, Fibergate, USCarrier, First Telecom, Litecast, and Core NAP as if each acquisition occurred on July 1, 2011. The pro forma loss for the years ended June 30, 2012 and 2013 includes the additional depreciation and amortization resulting from the adjustments to the value of property and equipment and intangible assets resulting from purchase accounting and a net decrease to revenue during 2012 and a net increase to revenue during 2013 as a result of the acquisition date valuation of acquired deferred revenue. The pro forma results also include interest expense associated with debt used to fund the acquisitions. The pro forma results do not include any anticipated cost synergies or other expected benefits of the acquisitions. The unaudited pro forma financial information below is not necessarily indicative of either future results of operations or results that might have been achieved had the acquisitions been consummated as of July 1, 2011.
| Year Ended June 30, | ||||||||
| 2012 | 2013 | |||||||
| Revenue |
$ | 954,567 | $ | 1,034,231 | ||||
| Loss from continuing operations |
$ | (65,488 | ) | $ | (241,730 | ) | ||
The Company is unable to determine the amount of revenue associated with each acquisition recognized in the post-acquisition period as a result of integration activities.
(4) SPIN-OFF OF BUSINESS
In connection with certain business combinations, the Company may acquire assets or liabilities that support products outside of the Company’s primary focus of providing bandwidth infrastructure services.
On June 13, 2014, the Company completed a spin-off of Onvoy, LLC, a business unit that provides voice and managed services. The Company distributed all of the assets and liabilities of OVS on the spin-off date to CII.
The Company continues to have ongoing contractual relationships with OVS, to provide OVS and its subsidiaries with bandwidth capacity. The contractual relationships are based on agreements that were entered into at estimated market rates. During the years ended June 30, 2011, 2012 and 2013, respectively, transactions with OVS were eliminated upon consolidation. Subsequent to the spin-off date, transactions with OVS will be included in the Company’s results of operations.
The Company determined all significant cash flows and continuing involvement associated with the operations of OVS were discontinued. The results of operations of OVS are reported as discontinued operations in the accompanying consolidated financial statements for all periods presented and are presented net of intercompany eliminations.
F-26
Table of Contents
ZAYO GROUP HOLDINGS, INC. AND SUBSIDIARIES
Notes to Consolidated Financial Statements (Continued)
(in thousands except share and per share data)
The following table presents the book value of the assets and liabilities presented and disclosed as discontinued operations for OVS as of June 30, 2012 and June 30, 2013, respectively:
| June 30, 2012 |
June 30, 2013 |
|||||||
| Cash |
$ | 7,849 | $ | 15,987 | ||||
| Other current assets |
10,032 | 10,130 | ||||||
| Property and equipment |
20,496 | 21,065 | ||||||
| Intangibles |
14,242 | 11,673 | ||||||
| Goodwill |
3,876 | 3,833 | ||||||
| Deferred tax asset (including current portion) |
9,761 | 8,579 | ||||||
| Other assets |
1,009 | 876 | ||||||
|
|
|
|
|
|||||
| Total assets |
67,265 | 72,143 | ||||||
|
|
|
|
|
|||||
| Current liabilities |
11,426 | 15,356 | ||||||
| Long term debt (including current portion) |
9,809 | 4,306 | ||||||
| Other liabilities |
3,234 | 8,510 | ||||||
|
|
|
|
|
|||||
| Total liabilities |
24,469 | 28,172 | ||||||
|
|
|
|
|
|||||
| Net book value |
$ | 42,796 | $ | 43,971 | ||||
|
|
|
|
|
|||||
Earnings from discontinued operations, net of income taxes in the accompanying consolidated statements of operations are comprised of the following:
| Year Ended June 30, | ||||||||||||
| 2011 | 2012 | 2013 | ||||||||||
| Revenues |
$ | 68,951 | $ | 74,671 | $ | 80,241 | ||||||
|
|
|
|
|
|
|
|||||||
| Earnings before income taxes |
$ | 9,910 | $ | 14,467 | $ | 17,003 | ||||||
| Income tax expense |
4,579 | 5,794 | 8,607 | |||||||||
|
|
|
|
|
|
|
|||||||
| Earnings from discontinued operations, net of income taxes |
$ | 5,331 | $ | 8,673 | $ | 8,396 | ||||||
|
|
|
|
|
|
|
|||||||
(5) INVESTMENT
In connection with the AFS acquisition, the Company acquired an ownership interest in USCarrier. As of June 30, 2012, the Company’s ownership in USCarrier was comprised of 55% of the outstanding Class A membership units and 34% of the outstanding Class B membership units. As discussed in Note 3—Acquisitions, on October 1, 2012, the Company acquired the remaining equity interest in USCarrier. At the time of the AFS acquisition, management estimated the fair value of its interest in USCarrier to be $15,075. In valuing the Company’s interest in USCarrier, management used both an income- and market-based approach to estimate the acquisition date fair value.
Although the Company had a significant ownership position in USCarrier prior to the October 1, 2012 acquisition, as a result of certain historical disputes with the board of managers of USCarrier, the Company was unable to exercise control or significant influence over USCarrier’s operating and financial policies and so the Company accounted for this investment utilizing the cost method of accounting from the date of the AFS acquisition, at which time the investment was recorded at fair value, through June 30, 2012.
F-27
Table of Contents
ZAYO GROUP HOLDINGS, INC. AND SUBSIDIARIES
Notes to Consolidated Financial Statements (Continued)
(in thousands except share and per share data)
Based on the agreed upon purchase price of the remaining outstanding equity interests included in the August 15, 2012 purchase agreement, the fair value of the Company’s initial ownership interest in USCarrier was determined to be $12,827, and as such, the Company wrote-down the carrying value of its investment in USCarrier of $15,075 to its fair value and recognized an impairment of $2,248 during the year ended June 30, 2012.
(6) PROPERTY AND EQUIPMENT
Property and equipment, including assets held under capital leases, was comprised of the following:
| Estimated (in years) |
As of June 30, | |||||||||
| 2012 | 2013 | |||||||||
| Land |
N/A | $ | 490 | $ | 712 | |||||
| Building leasehold and site improvements |
15 to 20 | 26,368 | 50,106 | |||||||
| Furniture, fixtures and office equipment |
3 to 7 | 1,377 | 4,278 | |||||||
| Computer hardware |
3 to 5 | 3,512 | 14,155 | |||||||
| Software |
3 | 3,334 | 7,623 | |||||||
| Machinery and equipment |
5 to 7 | 12,222 | 59,217 | |||||||
| Fiber optic equipment |
8 | 233,424 | 485,782 | |||||||
| Circuit switch equipment |
10 | 9,594 | 11,173 | |||||||
| Packet switch equipment |
5 | 24,219 | 41,133 | |||||||
| Fiber optic network |
15 to 20 | 518,049 | 1,958,231 | |||||||
| Construction in progress |
N/A | 91,239 | 249,168 | |||||||
|
|
|
|
|
|||||||
| Total |
923,828 | 2,881,578 | ||||||||
| Less accumulated depreciation |
(169,090 | ) | (443,871 | ) | ||||||
|
|
|
|
|
|||||||
| Property and equipment, net |
$ | 754,738 | $ | 2,437,707 | ||||||
|
|
|
|
|
|||||||
Total depreciation expense, including depreciation of assets held under capital leases, for the years ended June 30, 2011, 2012 and 2013 was $47,905, $70,357 and $280,128, respectively.
Included within the Company’s property and equipment balance are assets under capital leases with a cost of $17,751 and $13,219 with associated accumulated depreciation of $4,988 and $3,722 as of June 30, 2012 and 2013, respectively. The Company recognized depreciation expense associated with assets under capital leases of $1,272, $1,377 and $1,781 for the years ended June 30, 2011, 2012 and 2013, respectively.
During the years ended June 30, 2011, 2012, and 2013, the Company received a total of $3,544, $22,826, and $9,319, respectively, in grant money from the NTIA’s Broadband Technology Opportunities Program for reimbursement of property and equipment expenditures. The Company has accounted for these funds as a reduction of the cost of its fiber optic network.
During the years ended June 30, 2011, 2012 and 2013, the Company capitalized interest in the amounts of $3,691, $5,472, and $12,970, respectively. The Company capitalized $6,230, $9,373, and $28,613 of direct labor costs to property and equipment accounts during the years ended June 30, 2011, 2012 and 2013, respectively.
F-28
Table of Contents
ZAYO GROUP HOLDINGS, INC. AND SUBSIDIARIES
Notes to Consolidated Financial Statements (Continued)
(in thousands except share and per share data)
(7) GOODWILL
The Company’s goodwill balance was $190,279 and $688,836 as of June 30, 2012 and 2013, respectively. Additions to goodwill during the year ended June 30, 2013 relate to the acquisitions of AboveNet, FiberGate, USCarrier, First Telecom, Litecast, and Core NAP (See Note 3—Acquisitions).
The Company’s reporting units are comprised of its Strategic Product Groups (“SPGs”): Zayo Dark Fiber (“Dark Fiber”), Zayo Wavelength Services (“Waves”), Zayo SONET Services (“SONET”), Zayo Ethernet Services (“Ethernet”), Zayo IP Services (“IP”), Zayo Mobile Infrastructure Group (“MIG”), Zayo Colocation (“zColo”), and Zayo Professional Services (“ZPS”). The following table reflects the allocation of goodwill acquired in the Company’s Fiscal 2012 and 2013 acquisitions to the Company’s reporting units (in thousands):
| Dark Fiber |
Waves | SONET | Ethernet | IP | MIG | zColo | ZPS | Total | ||||||||||||||||||||||||||||
| As of July 1, 2011 |
$ | 12,082 | $ | 32,668 | $ | 7,605 | $ | 13,875 | $ | 12,119 | $ | 5,795 | $ | 836 | $ | — | $ | 84,980 | ||||||||||||||||||
| Additions |
||||||||||||||||||||||||||||||||||||
| 360networks |
46,874 | 22,642 | 5,270 | 9,617 | 8,398 | 4,010 | — | — | 96,811 | |||||||||||||||||||||||||||
| MarquisNet |
— | — | — | — | — | — | 4,735 | — | 4,735 | |||||||||||||||||||||||||||
| Arialink |
1,010 | 1,244 | 289 | 528 | 461 | 221 | — | — | 3,753 | |||||||||||||||||||||||||||
|
|
|
|
|
|
|
|
|
|
|
|
|
|
|
|
|
|
|
|||||||||||||||||||
| As of June 30, 2012 |
59,966 | 56,554 | 13,164 | 24,020 | 20,978 | 10,026 | 5,571 | — | 190,279 | |||||||||||||||||||||||||||
| Additions: |
||||||||||||||||||||||||||||||||||||
| AboveNet |
23,288 | 156,823 | 36,506 | 66,607 | 58,174 | 27,819 | 5,114 | 7,303 | 381,634 | |||||||||||||||||||||||||||
| FiberGate |
53,783 | — | — | — | — | — | — | — | 53,783 | |||||||||||||||||||||||||||
| USCarrier |
855 | 1,908 | 444 | 810 | 708 | 338 | 313 | — | 5,376 | |||||||||||||||||||||||||||
| First Telecom |
48,310 | 29 | 7 | 12 | 11 | 5 | 8 | — | 48,382 | |||||||||||||||||||||||||||
| Litecast |
8,277 | 706 | 164 | 300 | 262 | 125 | 33 | — | 9,867 | |||||||||||||||||||||||||||
| Core NAP |
— | — | — | — | — | — | 986 | — | 986 | |||||||||||||||||||||||||||
| Foreign currency translation |
(1,164 | ) | (155 | ) | — | (42 | ) | (60 | ) | — | (50 | ) | — | (1,471 | ) | |||||||||||||||||||||
|
|
|
|
|
|
|
|
|
|
|
|
|
|
|
|
|
|
|
|||||||||||||||||||
| As of June 30, 2013 |
$ | 193,315 | $ | 215,865 | $ | 50,285 | $ | 91,707 | $ | 80,073 | $ | 38,313 | $ | 11,975 | $ | 7,303 | $ | 688,836 | ||||||||||||||||||
|
|
|
|
|
|
|
|
|
|
|
|
|
|
|
|
|
|
|
|||||||||||||||||||
F-29
Table of Contents
ZAYO GROUP HOLDINGS, INC. AND SUBSIDIARIES
Notes to Consolidated Financial Statements (Continued)
(in thousands except share and per share data)
(8) INTANGIBLE ASSETS
Identifiable acquisition-related intangible assets as of June 30, 2012 and 2013 were as follows:
| Gross Carrying Amount |
Accumulated Amortization |
Net | ||||||||||
| June 30, 2012 |
||||||||||||
| Finite-Lived Intangible Assets |
||||||||||||
| Customer relationships |
$ | 167,917 | $ | (42,928 | ) | $ | 124,989 | |||||
| Tradenames |
548 | (320 | ) | 228 | ||||||||
|
|
|
|
|
|
|
|||||||
| 168,465 | (43,248 | ) | 125,217 | |||||||||
| Indefinite-Lived Intangible Assets |
||||||||||||
| Certifications |
3,488 | — | 3,488 | |||||||||
|
|
|
|
|
|
|
|||||||
| Total |
$ | 171,953 | $ | (43,248 | ) | $ | 128,705 | |||||
|
|
|
|
|
|
|
|||||||
| June 30, 2013 |
||||||||||||
| Finite-Lived Intangible Assets |
||||||||||||
| Customer relationships |
$ | 721,659 | $ | (86,407 | ) | $ | 635,252 | |||||
| Tradenames |
1,179 | (590 | ) | 589 | ||||||||
| Underlying rights |
1,075 | (54 | ) | 1,021 | ||||||||
|
|
|
|
|
|
|
|||||||
| 723,913 | (87,051 | ) | 636,862 | |||||||||
| Indefinite-Lived Intangible Assets |
||||||||||||
| Certifications |
3,488 | — | 3,488 | |||||||||
|
|
|
|
|
|
|
|||||||
| Total |
$ | 727,401 | $ | (87,051 | ) | $ | 640,350 | |||||
|
|
|
|
|
|
|
|||||||
The weighted average remaining amortization period for the Company’s customer relationships and trade name assets as of June 30, 2012 and 2013, is 17.3 years and 1.0 years, respectively. The Company has determined that the certifications have indefinite lives. The amortization period for underlying rights is 20 years. The amortization of intangible assets for the years ended June 30, 2011, 2012 and 2013 was $12,558, $14,604 and $44,404, respectively.
During the years ended June 30, 2012 and 2013, the Company wrote off $9,335 and $548 in fully amortized intangible assets, respectively. Estimated future amortization of finite-lived intangible assets is as follows:
| Year Ended June 30, |
||||
| 2014 |
$ | 42,766 | ||
| 2015 |
39,766 | |||
| 2016 |
39,671 | |||
| 2017 |
39,671 | |||
| 2018 |
39,671 | |||
| Thereafter |
435,317 | |||
|
|
|
|||
| Total |
$ | 636,862 | ||
|
|
|
|||
F-30
Table of Contents
ZAYO GROUP HOLDINGS, INC. AND SUBSIDIARIES
Notes to Consolidated Financial Statements (Continued)
(in thousands except share and per share data)
(9) LONG-TERM DEBT
As of June 30, 2013 and 2012, long-term debt was as follows:
| (dollars in thousands) |
June 30, 2012 |
June 30, 2013 |
||||||
| Revolver |
$ | 30,000 | $ | — | ||||
| Term Loan Facility due 2016 |
313,425 | — | ||||||
| 10.25% Senior Secured Notes due 2017 |
350,000 | — | ||||||
| Promissory Note due 2012 |
4,440 | — | ||||||
| Term Loan Facility due 2019 |
— | 1,603,800 | ||||||
| 8.125% Senior Secured First Priority Notes due 2020 |
— | 750,000 | ||||||
| 10.125% Senior Unsecured Notes due 2020 |
— | 500,000 | ||||||
| Capital Leases |
11,618 | 13,167 | ||||||
|
|
|
|
|
|||||
| Total Debt Obligations |
709,483 | 2,866,967 | ||||||
| Unamortized premium/(discount): |
||||||||
| Unamortized premium on senior Secured Notes due 2017 |
122 | — | ||||||
| Unamortized discount on senior Secured Term Loan Due 2016 |
(8,266 | ) | — | |||||
| Unamortized discount on senior Secured Term Loan due 2017 |
— | (23,095 | ) | |||||
|
|
|
|
|
|||||
| Total unamortized premium/discount |
(8,144 | ) | (23,095 | ) | ||||
|
|
|
|
|
|||||
| Carrying value of debt |
701,339 | 2,843,872 | ||||||
| Less current portion |
(5,588 | ) | (22,800 | ) | ||||
|
|
|
|
|
|||||
| Long-term debt, less current portion |
$ | 695,751 | $ | 2,821,072 | ||||
|
|
|
|
|
|||||
In March 2010, Zayo Group, LLC (“ZGL”) co-issued, with Zayo Captial, Inc. (“Zayo Capital”) (at an issue price of 98.779%), $250,000 of senior secured notes. These notes bore interest at 10.25% annually and were due on March 15, 2017. The net proceeds from these notes were approximately $239,050 after deducting the discount on the notes of $3,052 and debt issuance costs of approximately $7,898. In September 2010, ZGL completed an offering of an additional $100,000 in notes (at an issue price of 103%). These notes were part of the same series as the $250,000 senior secured notes (collectively, the “Original Notes”) and also bore interest at a rate of 10.25% and were due on March 15, 2017. The net proceeds from this debt issuance were approximately $98,954 after adding the premium on the notes of $3,000 and deducting debt issuance costs of approximately $4,046. The Company used a portion of the proceeds from this issuance of the notes to fund the acquisition of AFS (see Note 3—Acquisitions). The Original Notes were being accreted to their par value over the term of the Original Notes as an increase or decrease to interest expense using the effective interest method until they were redeemed in July 2012.
In March 2010, ZGL and Zayo Capital also entered into a revolving line-of-credit (the “Original Revolver”). Concurrent with offering the $100,000 of notes in September 2010, ZGL and Zayo Capital amended the terms of the Original Revolver to increase the borrowing capacity from $75,000 to $100,000 (adjusted for letter of credit usage). The Company capitalized $2,248 in debt issuance costs associated with the amended Original Revolver.
In October 2010, in connection with the AFS acquisition, the Company provided the former owners of AFS with a promissory note in the amount of $4,500. The Company recorded this note at its fair value on the acquisition date, which was determined to be $4,141. Management estimated the imputed interest associated with this note on the acquisition date to be $359, which was recognized over the term of the promissory note. During the years ended June 30, 2011, 2012, and 2013, the Company recognized interest expense and a corresponding
F-31
Table of Contents
ZAYO GROUP HOLDINGS, INC. AND SUBSIDIARIES
Notes to Consolidated Financial Statements (Continued)
(in thousands except share and per share data)
increase to the promissory note obligation of $126, $174, and $59, respectively. The promissory note was non-interest bearing and was paid in full in October 2012.
On December 1, 2011, ZGL, a wholly-owned operating subsidiary of the Company, and Zayo Capital, a 100% owned finance subsidiary of the Company that does not have independent assets or operations, entered into a $315,000 senior secured term loan facility (the “Original Term Loan Facility”). The net proceeds from the Original Term Loan Facility were approximately $296,523 after deducting the discount of $9,450 and debt issuance costs of approximately $9,027. The Original Term Loan Facility was being accreted to its par value over the term of the loan as additional interest expense using the effective interest rate method. The proceeds of the Original Term Loan Facility were used to partially fund the acquisition of 360networks (See Note 3—Acquisitions). The Original Term Loan Facility had a maturity date of September 15, 2016, and the borrowings thereunder bore interest at varying levels based on the London Interbank Offered Rate (“LIBOR”) plus a spread of 5.5% (subject to a minimum LIBOR rate of 1.5%) or a specified base rate plus a spread of 4.5%. As of June 30, 2012, the applicable interest rate on the Original Term Loan Facility was 7.0%. The balance on the Original Term Loan Facility was $305,159, net of the unamortized discount of $8,265, as of June 30, 2012. The Original Term Loan Facility was refinanced in July 2012.
As of June 30, 2012, $30,000 was outstanding under the Original Revolver. Standby letters of credit were outstanding in the amount of $6,166. Outstanding letters of credit backed by the Original Revolver accrued interest at a rate ranging from 3.5% to 4.5% per annum based upon the ZGL’s leverage ratio. As of June 30, 2012, the interest rate on the outstanding Original Revolver balance was 4.2%. The Original Revolver was paid off in July 2012.
As of June 30, 2012, the Company’s debt obligations included the Original Notes with a balance of $350,122 (net of unamortized premiums and discounts of $122), the Original Term Loan Facility with a balance of $305,159 (net of unamortized discount of $8,266) and $30,000 outstanding under the Original Revolver.
On July 2, 2012, ZGL and Zayo Capital issued $750,000 aggregate principal amount of 8.125% senior secured first-priority notes due 2020 (the “Senior Secured Notes”) and $500,000 aggregate principal amount of 10.125% senior unsecured notes due 2020 (the “Senior Unsecured Notes”, and together with the Senior Secured Notes, the “Notes”). On July 2, 2012, ZGL and Zayo Capital also entered into a $250,000 senior secured revolving credit facility (the “Revolver”) and a $1,620,000 senior secured term loan facility, issued at a $30,000 discount, which accrues interest at floating rates (the “Term Loan Facility”); the interest rate on the Term Loan Facility was initially LIBOR plus 5.875% (subject to a 7.125% floor) and the interest rate on the Revolver was initially LIBOR plus 5.375%. A portion of the net proceeds from the Notes and the Term Loan Facility, together with cash on hand and equity contributions (See Note 12—Equity), were used to extinguish the Original Term Loan Facility and Original Revolver, to finance the cash tender offer for and subsequent redemption of the Company’s Original Notes, to pay the cash consideration for the AboveNet acquisition, and to pay associated fees and expenses.
In connection with the debt extinguishment activities discussed above, the Company recognized an expense in July 2012 of $64,975 associated with debt extinguishment costs, including a cash expense of $39,798 associated with the payment of early redemption fees on the Company’s previous indebtedness and non-cash expenses of $17,032 associated with the write-off of the Company’s unamortized debt issuance costs and $8,145 associated with writing-off the net unamortized discount on the debt balances extinguished.
On October 5, 2012, ZGL and Zayo Capital entered into a second amendment (the “Second Amendment”) to the agreement governing its Term Loan Facility and Revolver (the “Credit Agreement”). Under the terms of the Second
F-32
Table of Contents
ZAYO GROUP HOLDINGS, INC. AND SUBSIDIARIES
Notes to Consolidated Financial Statements (Continued)
(in thousands except share and per share data)
Amendment, effective October 5, 2012, the interest rate on the Term Loan Facility was adjusted to bear an interest rate at LIBOR plus 4.0% (subject to a 5.25% floor), which represented a decrease of 187.5 basis points from the original Credit Agreement. The Second Amendment also reduced the interest rate on the Revolver by 187.5 basis points.
On February 27, 2013, ZGL and Zayo Capital entered into a Fourth Amendment (the “Fourth Amendment”) to the Company’s Credit Agreement. Under the terms of the Fourth Amendment, effective February 27, 2013, the interest rate on the Term Loan Facility was further adjusted to bear interest at LIBOR plus 3.5% (subject to a 4.5% floor). The amended terms represent a downward adjustment of 50 basis points on the spread and a further 25 basis point reduction minimum floor. Under the terms of the Fourth Amendment, the Revolver bore interest at LIBOR plus 3.00%, based on ZGL’s current leverage ratio, which represented a 50 basis point reduction. The Fourth Amendment also amended certain terms and provisions of the Credit Agreement, including removing the senior secured and total leverage maintenance covenants and increasing the total leverage ratio required to be met in order to incur certain additional indebtedness from 5.00:1.00 to 5.25:1.00 as a multiple of EBITDA (as defined in the Credit Agreement).
In connection with the aforementioned amendments, the Company incurred early redemption call premiums of $16,200 and $16,119 for the Second Amendment and Fourth Amendment, respectively. The early redemption call premiums were paid with cash on hand to the syndicate of creditors in the Term Loan Facility. Prior to the consummation of the amendments, the Company requested the consent of all creditors holding balances in the Term Loan Facility to the amended terms. $15,261 and $15,040 of the early call premium paid to consenting creditors in the Second and Fourth Amendments, respectively, have been accounted for as additional debt issuance costs during the year ended June 30, 2013, which are being amortized over the term of the Term Loan Facility using the effective interest method. The remaining call premium of $939 and $1,079 associated with the Second and Fourth Amendments, respectively, that was paid to non-consenting creditors has been recorded as a loss on extinguishment of debt on the consolidated statements of operations for the year ended June 30, 2013. Existing and/or new creditors replaced the non-consented commitments, such that the full amount of the Term Loan Facility’s commitments were replaced in both the Second and Fourth Amendments. The principal payment of $344,452 to the non-consenting creditors is reflected on the consolidated statement of cash flows as a principal payment on long-term debt, and the corresponding $344,452 received from new creditors is reflected as proceeds from issuance of long-term debt.
In connection with the amendments, the Company recognized an expense of $12,278 during the year ended June 30, 2013 associated with debt extinguishment costs. The loss on extinguishment of debt associated with the amendments includes the aforementioned early call premiums paid to non-consenting creditors, non-cash expense associated with the write off of unamortized debt issuance costs and issuance discounts on the debt balances accounted for as an extinguishment, and certain fees paid to third parties involved in the amendments.
The interest rates in effect on the Term Loan Facility and Revolver as of June 30, 2013 were 4.50% and 3.27%, respectively. The Revolver is subject to a commitment fee of 0.5% of the weighted-average unused capacity and outstanding letters of credit backed by the Revolver are subject to a 0.25% fee per annum. The Revolver has a maturity date of July 2017.
The Term Loan Facility was issued at a discount of $30,000 and has a maturity date of July 2019. The issue discount is being amortized to interest expense over the term of the loan. The terms of the Term Loan Facility require ZGL to make quarterly principal payments of $4,050 plus an annual payment of up to 50% of excess cash flow, as determined in accordance with the Credit Agreement (no such payment was required during the year ending June 30, 2013).
As of June 30, 2013, the balances of the Notes and Term Loan Facility were $1,250,000 and $1,580,705 (net of an unamortized discount of $23,095).
F-33
Table of Contents
ZAYO GROUP HOLDINGS, INC. AND SUBSIDIARIES
Notes to Consolidated Financial Statements (Continued)
(in thousands except share and per share data)
As of June 30, 2013, no amounts were outstanding on the Revolver. Standby letters of credit were outstanding in the amount of $6,561 as of June 30, 2013, leaving $243,439 available under the Revolver as of June 30, 2013. Outstanding letters of credit backed by the Revolver accrue interest at a rate ranging from LIBOR plus 2.0% to LIBOR plus 3.0% per annum based upon the Company’s leverage ratio.
Debt covenants
The Credit Agreement, as amended, contains a covenant that requires ZGL to maintain a minimum fixed-charge coverage ratio. Pursuant to the Credit Agreement, ZGL shall not permit its Fixed Charge Coverage Ratio, which is defined in the Credit Agreement as the ratio of ZGL’s annualized modified EBITDA (as defined in the Credit Agreement) during the most recent quarter minus Capital Expenditures (as defined in the Credit Agreement) for the twelve month period ended as of the end of each applicable fiscal quarter to interest expense for that same period to be less than the minimum ratio for the applicable period set forth below:
| Fiscal Quarters Ending |
Minimum Ratio |
|||
| December 31, 2012, March 31, 2013 and June 30, 2013 |
1.5 to 1.0 | |||
| September 30, 2013, December 31, 2013, March 31, 2014 and June 30, 2014 |
1.75 to 1.0 | |||
| September 30, 2014, December 31, 2014 and March 31, 2015 |
2.0 to 1.0 | |||
| June 30, 2015, September 30, 2015 and December 31, 2015 |
2.25 to 1.0 | |||
| March 31, 2016, June 30, 2016 and September 30, 2016 |
2.5 to 1.0 | |||
| December 31, 2016 and for each fiscal quarter thereafter |
2.75 to 1.0 | |||
The Credit Agreement also requires ZGL and its subsidiaries to comply with customary affirmative and negative covenants, including covenants restricting the ability of ZGL and its subsidiaries, subject to specified exceptions, to incur additional indebtedness, make additional guaranties, incur additional liens on assets, or dispose of assets, pay dividends, or make other distributions, voluntarily prepay certain other indebtedness, enter into transactions with affiliated persons, make investments and amend the terms of certain other indebtedness.
The Credit Agreement contains customary events of default, including among others, non-payment of principal, interest, or other amounts when due, inaccuracy of representations and warranties, breach of covenants, cross default to certain other indebtedness, insolvency or inability to pay debts, bankruptcy, or a change of control.
The indentures governing the Notes (the “Indentures”) limit any increase in the Company’s secured indebtedness (other than certain forms of secured indebtedness expressly permitted under the indentures) to a pro forma secured debt ratio of 4.5 times the Company’s previous quarter’s annualized modified EBITDA, as defined in the Indentures, and limit the Company’s incurrence of additional indebtedness to a total indebtedness ratio of 5.25 times the previous quarter’s annualized modified EBITDA.
The Credit Agreement and Indentures contain certain restrictions on the ability of ZGL and its subsidiaries to pay dividends to CII.
ZGL was in compliance with all covenants associated with its debt agreements as of June 30, 2012 and 2013.
Redemption rights
At any time prior to July 1, 2015 (for the Senior Secured Notes) and July 1, 2016 (for the Senior Unsecured Notes), the Company may redeem all or part of the Notes at a redemption price equal to the sum of (i) 100% of the principal amount thereof, plus (ii) accrued interest and a “make-whole” premium, which is a lump sum
F-34
Table of Contents
ZAYO GROUP HOLDINGS, INC. AND SUBSIDIARIES
Notes to Consolidated Financial Statements (Continued)
(in thousands except share and per share data)
payment derived from a formula based on the net present value of future coupon payments that will not be paid because of the early redemption.
On or after July 1, 2015 (for the Senior Secured Notes) or July 1, 2016 (for the Senior Unsecured Notes), the Company may redeem all or part of the Notes, at the redemption prices (expressed as percentages of principal amount and set forth below), plus accrued and unpaid interest and additional interest, if any, thereon, to the applicable redemption date, subject to the rights of the holders of the Notes on the relevant record date to receive interest due on the relevant interest payment date, if redeemed during the 12-month period beginning on July 1 of the years indicated below:
| Year |
Redemption Price (Senior Secured Notes) |
|||
| 2015 |
104.063 | % | ||
| 2016 |
102.031 | % | ||
| 2017 and thereafter |
100.000 | % | ||
| Year |
Redemption Price (Senior Unsecured Notes) |
|||
| 2016 |
105.063 | % | ||
| 2017 |
102.531 | % | ||
| 2018 and thereafter |
100.000 | % | ||
In the event of an equity offering to the public, at any time prior to July 1, 2015, the Company may redeem up to 35% of the aggregate principal amount of the Notes issued under the Indentures at a redemption price of 108.125% (for the Senior Secured Notes) and 110.25% (for the Senior Unsecured Notes) of the principal amount thereof, plus accrued and unpaid interest and additional interest, if any, thereon to the redemption date, subject to the rights of the holders of the Notes on the relevant record date to receive interest due on the relevant interest payment date, with the net cash proceeds of one or more equity offerings, provided that (i) at least 65% of the aggregate principal amount of the Notes issued under each of the Indentures remains outstanding immediately after the occurrence of such redemption and (ii) the redemption occurs within 90 days of the date of the closing of such equity offering.
The Company may purchase the Notes in open-market transactions, tender offers, or otherwise. The Company is not required to make any mandatory redemption or sinking fund payments with respect to the Notes.
Prior to July 27, 2013, the Company may make prepayments on the Term Loan Facility subject to a 1% premium charge; after July 27, 2013, no premium charge would apply.
Aggregate future contractual maturities of long-term debt (excluding issue discounts and premiums) were as follows as of June 30, 2013:
| Year Ended June 30, |
||||
| 2014 |
$ | 16,200 | ||
| 2015 |
16,200 | |||
| 2016 |
16,200 | |||
| 2017 |
16,200 | |||
| 2018 |
16,200 | |||
| Thereafter |
2,772,800 | |||
|
|
|
|||
| Total |
$ | 2,853,800 | ||
|
|
|
|||
F-35
Table of Contents
ZAYO GROUP HOLDINGS, INC. AND SUBSIDIARIES
Notes to Consolidated Financial Statements (Continued)
(in thousands except share and per share data)
Guarantees
The Notes are fully and unconditionally guaranteed, jointly and severally, on a senior secured basis by all of the ZGL’s current and future domestic restricted subsidiaries. The Notes were co-issued with Zayo Capital, which does not have independent assets or operations.
Debt issuance costs
In connection with the Notes offering, Revolver and the amended Term Loan Facility and subsequent Fiscal 2013 amendments, the Company incurred debt issuance costs of $130,148. These costs are being amortized to interest expense over the respective terms of the underlying debt instruments using the effective interest method, unless extinguished earlier, at which time the related unamortized costs are immediately expensed.
Unamortized debt issuance costs of $19,706 and $22,561 associated with the Company’s previous indebtedness were recorded as part of the loss on extinguishment of debt during the year ended June 30, 2013 upon the settlement of the Company’s previous debt obligations in July 2012 and material amendment to the Company’s existing debt obligations in October 2012 and February 2013, respectively. The balance of debt issuance costs as of June 30, 2012 and 2013 was $19,706 and $99,098, net of accumulated amortization of $6,187 and $11,482, respectively. Interest expense associated with the amortization of debt issuance costs was $2,220, $3,441, and $11,482 for the years ended June 30, 2011, 2012 and 2013, respectively. The amortization of debt issuance costs is included on the consolidated statements of cash flows within the caption “non-cash interest expense” along with the amortization or accretion of the premium and discount on the Company’s indebtedness and changes in the fair value of the Company’s interest rate derivatives.
Interest rate derivatives
On August 13, 2012, ZGL entered into forward-starting interest rate swap agreements with an aggregate notional value of $750,000, a maturity date of June 30, 2017, and a start date of June 30, 2013. There were no up-front fees for these agreements. The contract states that the Company shall pay a 1.67% fixed rate of interest for the term of the agreement beginning on the start date. The counter-party will pay to the Company the greater of actual LIBOR or 1.25%. The Company entered in to the forward-starting swap arrangements to reduce the risk of increased interest costs associated with potential changes in LIBOR rates.
Changes in the fair value of interest rate swaps are recorded as an increase or decrease in interest expense in the consolidated statements of operations for the applicable period. During the year ended June 30, 2013, $2,642 was recorded as a decrease in interest expense for the change in the fair value of the interest rate swaps. The fair value of the interest rate swaps of $2,642 is included in “Other long term assets” in the Company’s consolidated balance sheet as of June 30, 2013.
F-36
Table of Contents
ZAYO GROUP HOLDINGS, INC. AND SUBSIDIARIES
Notes to Consolidated Financial Statements (Continued)
(in thousands except share and per share data)
(10) INCOME TAXES
The Company’s provision/(benefit) for income taxes from continuing operations is summarized as follows:
| Year Ended June 30, | ||||||||||||
| 2011 | 2012 | 2013 | ||||||||||
| Current income taxes |
||||||||||||
| Federal |
$ | — | $ | (625 | ) | $ | — | |||||
| State |
1,449 | (945 | ) | 1,661 | ||||||||
| Foreign |
— | — | — | |||||||||
|
|
|
|
|
|
|
|||||||
| Total |
1,449 | (1,570 | ) | 1,661 | ||||||||
|
|
|
|
|
|
|
|||||||
| Deferred income taxes |
||||||||||||
| Federal |
9,079 | 19,849 | (25,738 | ) | ||||||||
| State |
801 | 8,592 | (3,668 | ) | ||||||||
| Foreign |
— | — | 3,540 | |||||||||
|
|
|
|
|
|
|
|||||||
| Total |
9,880 | 28,441 | (25,866 | ) | ||||||||
|
|
|
|
|
|
|
|||||||
| Total provisional (benefit) for income taxes |
$ | 11,329 | $ | 26,871 | $ | (24,205 | ) | |||||
|
|
|
|
|
|
|
The United States and foreign components of income/(loss) from continuing operations before income taxes for each of the three years ended June 30, 2011, 2012 and 2013 are as follows:
| Year Ended June 30, | ||||||||||||
| 2011 | 2012 | 2013 | ||||||||||
| United States |
$ | 4,438 | $ | 16,974 | $ | (185,658 | ) | |||||
| Foreign |
— | — | 15,840 | |||||||||
|
|
|
|
|
|
|
|||||||
| Total |
$ | 4,438 | $ | 16,974 | $ | (169,818 | ) | |||||
|
|
|
|
|
|
|
|||||||
The Company’s effective income tax rate differs from what would be expected if the federal statutory rate were applied to earnings before income taxes primarily because of certain expenses that represent permanent differences between book and tax expenses and deductions, such as stock-based compensation expense that is recorded as an expense for financial reporting purposes but is not deductible for tax purposes.
F-37
Table of Contents
ZAYO GROUP HOLDINGS, INC. AND SUBSIDIARIES
Notes to Consolidated Financial Statements (Continued)
(in thousands except share and per share data)
A reconciliation of the actual income tax provision and the tax computed by applying the U.S. federal rate to the earnings before income taxes during the years ended June 30, 2011, 2012 and 2013 are as follows:
| Year ended June 30, | ||||||||||||
| 2011 | 2012 | 2013 | ||||||||||
| Expected provision/(benefit) at the statutory rate |
$ | 1,505 | $ | 5,941 | $ | (59,469 | ) | |||||
| Increase due to: |
||||||||||||
| Non-deductible stock-based compensation |
7,824 | 8,685 | 35,879 | |||||||||
| State income taxes (benefit)/provision, net of federal benefit |
1,412 | 4,855 | (2,243 | ) | ||||||||
| Transactions costs not deductible for tax purposes |
294 | 1,416 | 1,257 | |||||||||
| Provision for uncertain tax positions, net |
— | 5,808 | — | |||||||||
| State NOL adjustment |
— | — | 2,788 | |||||||||
| Change in effective tax rate |
— | 459 | — | |||||||||
| Foreign tax rate differential |
— | — | (2,264 | ) | ||||||||
| Other, net |
294 | (293 | ) | (153 | ) | |||||||
|
|
|
|
|
|
|
|||||||
| Provision/(benefit) for income taxes |
$ | 11,329 | $ | 26,871 | $ | (24,205 | ) | |||||
|
|
|
|
|
|
|
|||||||
Deferred income taxes reflect the tax effects of temporary differences between the carrying amounts of assets and liabilities for financial reporting purposes and the amounts used for income tax purposes.
The tax effect of temporary differences that give rise to significant portions of the deferred tax assets and deferred tax liabilities are as follows:
| June 30, | ||||||||
| 2012 | 2013 | |||||||
| Deferred income tax assets |
||||||||
| Net operating loss carry forwards |
$ | 107,848 | $ | 530,972 | ||||
| Alternate minimum tax credit carryforwards |
102 | 181 | ||||||
| Deferred revenue |
30,620 | 106,560 | ||||||
| Accrued expenses |
5,210 | 19,737 | ||||||
| Other liabilities |
5,822 | 7,754 | ||||||
| Allowance for doubtful accounts |
624 | 3,332 | ||||||
| Other |
20 | 7,948 | ||||||
|
|
|
|
|
|||||
| Total deferred income tax assets |
150,246 | 676,484 | ||||||
| Valuation allowance |
— | — | ||||||
|
|
|
|
|
|||||
| Net deferred tax assets |
150,246 | 676,484 | ||||||
| Deferred income tax liabilities |
||||||||
| Property and equipment |
65,376 | 331,517 | ||||||
| Intangible assets |
38,028 | 220,551 | ||||||
| Debt issuance costs |
— | 31,674 | ||||||
| Investment in unconsolidated subsidiary |
3,927 | — | ||||||
|
|
|
|
|
|||||
| Total deferred income tax liabilities |
107,331 | 583,742 | ||||||
|
|
|
|
|
|||||
| Net deferred income tax assets |
$ | 42,915 | $ | 92,742 | ||||
|
|
|
|
|
|||||
As of June 30, 2013, the Company had $1,375,906 of net operating loss (“NOL”) carryforwards. During the year ending June 30, 2012, the Company utilized $19,520 of NOLs. After completing a Section 382 NOL limitation study for the 360networks acquisition, it was determined that $157,618 of NOL carryforwards would never be realized due to this limitation and were therefore recorded as an adjustment to the net deferred tax assets
F-38
Table of Contents
ZAYO GROUP HOLDINGS, INC. AND SUBSIDIARIES
Notes to Consolidated Financial Statements (Continued)
(in thousands except share and per share data)
recognized in the purchase price allocation for 360networks (see Note 3—Acquisitions). The Company acquired $1,008,755 of NOL carryforwards in the AboveNet acquisition. The acquisition, however, was considered a “change in ownership” within the meaning of Section 382 of the Internal Revenue Code and, as a result, such NOL carryforwards are subject to an annual limitation, reducing the amount available to offset income tax liabilities absent the limitation. Currently available NOL carryforwards as of June 30, 2013 are approximately $400,578. An additional $190,344 became available for use during fiscal year end June 30, 2014. The Company’s NOL carryforwards, if not utilized to reduce taxable income in future periods, will expire in various amounts beginning in 2020 and ending in 2032.
As of June 30, 2013, the Company had approximately $1,162 of foreign jurisdiction net operating loss carry forwards. The majority of these foreign jurisdiction net operating loss carry forwards do not expire.
As of June 30, 2013, the Company had tax-effected state net operating loss carry forwards of approximately $58,189, which are subject to limitations on their utilization and have various expiration periods through 2032.
Management believes it is more likely than not that it will utilize its net deferred tax assets to reduce or eliminate tax payments in future periods. The Company’s evaluation encompassed (i) a review of its recent history of taxable income for the past three years and (ii) a review of internal financial forecasts demonstrating its expected ability to fully utilize its deferred tax assets prior to expiration.
Uncertain Tax Positions
The Company is subject to audit by various taxing authorities, and these audits may result in proposed assessments where the ultimate resolution results in the Company owing additional income taxes. The statute of limitations is open with respect to tax years 2008 to 2013; however, to the extent that the Company has an NOL balance that was generated in a tax year outside of this statute of limitations period, such tax years will remain open until such NOLs are utilized by the Company. The Company establishes reserves through the reduction of deferred tax assets associated with NOL carryforwards when management believes there is uncertainty with respect to certain positions and the Company may not succeed in realizing the tax benefits. The Company recognizes the benefit of uncertain tax positions only if those positions are more likely than not of being sustained. Recognized benefits from uncertain tax positions are measured at the largest amount that is greater than 50% likely of being sustained. Changes in recognition or measurement are reflected in the period in which the change in judgment occurs. The application of income tax law is inherently complex and as such, it requires many subjective assumptions and judgments regarding income tax exposures. Interpretations of and guidance surrounding income tax laws and regulations change over time; as such, changes in these subjective assumptions and judgments can materially affect amounts recognized in the balance sheets and statements of operations. As of June 30, 2012 and 2013, there was no accrued interest or penalties related to uncertain tax positions since the Company’s NOL carryforwards are sufficient to absorb any tax deficiencies that may ultimately be due if the Company’s uncertain tax positions are settled with the taxing authorities.
As of June 30, 2013, the total amount of the reserves for uncertain tax positions was $6,416. The Company’s tax reserves reflect management’s estimate of the maximum amount of tax benefit that is more likely than not of being realized. The entire $6,416 unrecognized tax benefit, if recognized, would affect the effective tax rate.
F-39
Table of Contents
ZAYO GROUP HOLDINGS, INC. AND SUBSIDIARIES
Notes to Consolidated Financial Statements (Continued)
(in thousands except share and per share data)
Unrecognized tax benefits represent the aggregate tax effect of differences between tax return positions and the amounts otherwise recognized in the Company’s financial statements, and as a result of the substantial NOL carryforwards, are netted against the Company’s deferred tax asset balance in the consolidated balance sheets. A reconciliation of the beginning and ending amount of unrecognized tax benefits, excluding interest and penalties, is as follows:
| As of June 30, | ||||||||
| 2012 | 2013 | |||||||
| Balance, beginning of year, |
$ | — | $ | 6,416 | ||||
| Increases—positions taken in prior periods |
6,416 | — | ||||||
|
|
|
|
|
|||||
| Balance, end of year, |
$ | 6,416 | $ | 6,416 | ||||
|
|
|
|
|
|||||
(11) ACCRUED LIABILITIES
Accrued liabilities included in current liabilities consisted of the following:
| Year Ended June 30, | ||||||||
| 2012 | 2013 | |||||||
| Accrued compensation and benefits |
$ | 5,204 | $ | 10,702 | ||||
| Accrued property and equipment purchases |
11,128 | 26,301 | ||||||
| Network expense accruals |
5,891 | 46,767 | ||||||
| Other accrued taxes |
3,492 | 11,277 | ||||||
| Deferred lease obligations |
955 | 2,760 | ||||||
| Accrued professional fees |
3,158 | 2,575 | ||||||
| Other accruals |
16,007 | 16,719 | ||||||
|
|
|
|
|
|||||
| Total |
$ | 45,835 | $ | 117,101 | ||||
|
|
|
|
|
|||||
(12) EQUITY
Zayo Group Holdings was initially formed on November 13, 2007 and is a wholly owned subsidiary of CII. CII was organized on November 6, 2006, and subsequently capitalized on May 7, 2007, with capital contributions from various institutional and founder investors. The Company is controlled by the CII Board of Managers, which is in turn controlled by the members of CII in accordance with the rights specified in CII’s operating agreement. At formation, 1,000 shares of common stock were issued to CII by the Company with a par value of $0.001, which are currently outstanding.
During the years ended June 30, 2011, 2012 and 2013, CII contributed $15,500, $134,796, and $337,126, respectively, in cash to the Company. CII funded these amounts from equity contributions made by its investors.
F-40
Table of Contents
ZAYO GROUP HOLDINGS, INC. AND SUBSIDIARIES
Notes to Consolidated Financial Statements (Continued)
(in thousands except share and per share data)
In connection with and prior to the acquisition of AboveNet, CII concluded the sale of 98,916,060.11 Class C Preferred Units of CII pursuant to certain securities purchase agreements with new private investment funds, as well as certain existing owners of CII and other investors. The total value of the Class C Preferred Units of CII sold pursuant to the securities purchase agreements was approximately $470,274, net of $1,976 in costs associated with raising the additional equity. In June 2012, $133,150 of the proceeds (net of fees) from the equity raised was contributed to the Company, and the remaining $337,124 was contributed during the year ended June 30, 2013. As of July 2, 2012, the equity commitments from CII’s investors had been fulfilled.
As discussed in Note 13—Stock-Based Compensation, during the year ended June 30, 2012, the Board of CII authorized a non-liquidating distribution to certain common unit holders. The total amount of the aggregate distributions to employees of the Company was $9,080. The distribution was funded by CII, which resulted in a non-cash capital contribution to the Company and is reflected as such in the consolidated statement of stockholder’s equity for the year ended June 30, 2012.
During the year ended June 30, 2012, CII and the Company agreed to settle a related party payable due to CII in the amount of $15,541 via a non-cash equity contribution from the Company. This contribution is reflected in the consolidated statement of member’s equity in the caption “Non-cash contributions from CII, net.”
(13) STOCK-BASED COMPENSATION
Liability Classified Awards
As of June 30, 2013, the Company had been given authorization by CII to award 525,000,000 of CII’s common units as profits interests to employees and directors of the Company. Subsequent to June 30, 2013, 100,000,000 additional CII common units were authorized to award to employees and directors of the Company as profits interests.
As of June 30, 2012, CII had six classes of common units with different liquidation preferences—Class A through Class F units. During the year ended June 30, 2013, CII issued two additional classes of common units: Class G and Class H. Common units are issued to employees and to independent directors of the Company and are allocated by the Chief Executive Officer and the Board of Managers of CII on the terms and conditions specified in the employee equity agreement. The common units do not have voting rights. At June 30, 2012, 169,083,792 common units were issued and outstanding to employees and directors of the Company, and 355,916,208 common units were available to be issued. At June 30, 2013, 461,204,980 common units of CII were issued and outstanding to employees and directors of the Company and 63,795,020 common units of CII were available to be issued. As of June 30, 2013, CII has a separate class of common units of CII issued to employees of ZPS (“ZPS Class A”). 8,660,000 ZPS Class A common units were issued and outstanding at June 30, 2013, and no units were available to be issued. No ZPS Class A units were issued or outstanding as of June 30, 2012.
The common units are considered to be stock-based compensation with terms that require the awards to be classified as liabilities due to cash settlement features. As such, the Company accounts for the vested awards as a liability and re-measures the liability to fair value at each reporting date until the date of settlement.
F-41
Table of Contents
ZAYO GROUP HOLDINGS, INC. AND SUBSIDIARIES
Notes to Consolidated Financial Statements (Continued)
(in thousands except share and per share data)
As of June 30, 2012 and 2013, the estimated fair value of the common units was as follows:
| As of June 30, | ||||||||
| Common Unit Class |
2012 | 2013 | ||||||
| (estimated per unit value) | ||||||||
| Class A |
$ | 0.92 | $ | 1.50 | ||||
| Class B |
0.81 | 1.34 | ||||||
| Class C |
0.68 | 1.14 | ||||||
| Class D |
0.65 | 1.10 | ||||||
| Class E |
0.55 | 0.95 | ||||||
| Class F |
0.49 | 0.75 | ||||||
| Class G |
n/a | 0.46 | ||||||
| Class H |
n/a | 0.38 | ||||||
| ZPS Class A |
n/a | 0.20 | ||||||
The liability associated with the common units was $54,367 and $159,320 as of June 30, 2012 and 2013, respectively. The stock-based compensation expense associated with the common units was $23,490, $25,382, and $104,996 during the years ended June 30, 2011, 2012 and 2013, respectively.
The Company’s stock-based compensation relates to employees functioning in the selling, general and administrative capacity. The Company presents stock-based compensation as a separate component of selling, general and administrative expenses on the consolidated statement of operations due to the size and volatility of the non-cash expense.
The holders of common units of CII are not entitled to transfer their units or receive dividends or distributions, except at the discretion of CII’s Board of Managers. Upon a liquidation of CII, or upon a non-liquidating distribution, the holders of common units share in the proceeds after the capital contributions of the CII preferred unit holders plus their priority return of 6% per annum has been reimbursed. The remaining proceeds from a liquidation event are distributed between the preferred and common unit holders on a scale ranging from 85% to the preferred unit holders and 15% to the common unit holders to 80% to the preferred unit holders and 20% to the common unit holders. The percentage allocated to the common unit holders is dependent upon the return multiple realized by the preferred unit holders as defined in CII’s operating agreement. The maximum incremental allocation of proceeds from a liquidation event to common unit holders, of 20%, occurs if the return multiple realized by a preferred unit holder reaches 3.5 times each respective preferred holder’s combined capital contributions.
F-42
Table of Contents
ZAYO GROUP HOLDINGS, INC. AND SUBSIDIARIES
Notes to Consolidated Financial Statements (Continued)
(in thousands except share and per share data)
Each class of common units has a liquidation threshold. Holders of a respective class of common units begin to receive a portion of the proceeds from a liquidity event once the aggregate distributions previously made with respect to issued common units of earlier classes are equal to or greater than the respective common unit classes liquidation threshold. Common unit holders of each of the following classes begin sharing in the proceeds of a liquidation event once the total amount distributed to earlier classes reaches the following liquidation thresholds:
| Common Unit Class |
Liquidation Threshold | |||
| Class A |
$ | — | ||
| Class B |
15,000 | |||
| Class C |
40,000 | |||
| Class D |
45,000 | |||
| Class E |
75,000 | |||
| Class F |
95,000 | |||
| Class G |
235,000 | |||
| Class H |
290,000 | |||
In December 2011, CII and the preferred unit holders of CII authorized a non-liquidating cash distribution to common unit holders of up to $10,000. The eligibility for receiving proceeds from this distribution was determined by the liquidation preference of the unit holder. Receiving proceeds from the authorized distribution was at the election of the common unit holder. As a condition of the early distribution, common unit holders electing to receive an early distribution received 85% of the amount that they would otherwise be entitled to receive if the distribution were in connection with a liquidating distribution. The common unit holders electing to receive the early distribution will retain all of their common units and be entitled to receive future distributions only to the extent such future distributions are in excess of the non-liquidating distribution, before applying the 15% discount. During the year ended June 30, 2012, $9,080 was distributed to the Company’s common unit holders as a result of the December 2011 non-liquidating distributions. The distribution was paid by CII and is reflected in the Company’s consolidated statement of stockholder’s equity as a capital contribution (non-cash) with a corresponding reduction in the stock-based compensation liability as the associated expense for the common unit grants was previously recognized. Common unit holders electing to receive the early distribution forfeited $1,615 in previously recognized stock-based compensation, which had the effect of reducing stock-based compensation expense during the year ended June 30, 2012.
In June 2012, CII and the preferred unit holders of CII authorized an additional non-liquidating cash distribution in the amount of $7,000 to the Company’s Chief Executive Officer. The officer will retain all of his common units and be entitled to receive future distributions only to the extent such future distributions are in excess of the $7,000 non-liquidating distribution.
F-43
Table of Contents
ZAYO GROUP HOLDINGS, INC. AND SUBSIDIARIES
Notes to Consolidated Financial Statements (Continued)
(in thousands except share and per share data)
The following table represents the activity as it relates to common unit issuances and forfeitures during the years ended June 30, 2011, 2012 and 2013.
| Class A | Class B | Class C | Class D | Class E | Class F | Class G | Class H | ZPS Class A | Totals | |||||||||||||||||||||||||||||||
| Balance at June 30, 2010 |
47,438,787 | 18,254,500 | 3,292,718 | — | — | — | — | — | — | 68,986,005 | ||||||||||||||||||||||||||||||
| Common units issued |
— | 500,000 | — | 32,536,673 | 10,445,905 | — | — | — | — | 43,482,578 | ||||||||||||||||||||||||||||||
| Common units forfeited |
(341,659 | ) | (1,506,980 | ) | (505,000 | ) | (147,203 | ) | (155,000 | ) | — | — | — | — | (2,655,842 | ) | ||||||||||||||||||||||||
|
|
|
|
|
|
|
|
|
|
|
|
|
|
|
|
|
|
|
|
|
|||||||||||||||||||||
| Balance at June 30, 2011 |
47,097,128 | 17,247,520 | 2,787,718 | 32,389,470 | 10,290,905 | — | — | — | — | 109,812,741 | ||||||||||||||||||||||||||||||
| Common units issued |
— | — | — | — | — | 63,450,000 | — | — | — | 63,450,000 | ||||||||||||||||||||||||||||||
| Common units forfeited |
— | (318,749 | ) | (610,936 | ) | (1,740,931 | ) | (808,333 | ) | (700,000 | ) | — | — | — | (4,178,949 | ) | ||||||||||||||||||||||||
|
|
|
|
|
|
|
|
|
|
|
|
|
|
|
|
|
|
|
|
|
|||||||||||||||||||||
| Balance at June 30, 2012 |
47,097,128 | 16,928,771 | 2,176,782 | 30,648,539 | 9,482,572 | 62,750,000 | — | — | — | 169,083,792 | ||||||||||||||||||||||||||||||
| Common units issued |
— | — | — | — | — | 2,500,000 | 192,747,213 | 118,930,832 | 9,335,000 | 323,513,045 | ||||||||||||||||||||||||||||||
| Common units forfeited |
(50,000 | ) | (42,917 | ) | (24,999 | ) | (732,944 | ) | (51,389 | ) | (3,038,056 | ) | (17,001,364 | ) | (1,115,188 | ) | (675,000 | ) | (22,731,857 | ) | ||||||||||||||||||||
|
|
|
|
|
|
|
|
|
|
|
|
|
|
|
|
|
|
|
|
|
|||||||||||||||||||||
| Balance at June 30, 2013 |
47,047,128 | 16,885,854 | 2,151,783 | 29,915,595 | 9,431,183 | 62,211,944 | 175,745,849 | 117,815,644 | 8,660,000 | 469,864,980 | ||||||||||||||||||||||||||||||
|
|
|
|
|
|
|
|
|
|
|
|
|
|
|
|
|
|
|
|
|
|||||||||||||||||||||
F-44
Table of Contents
ZAYO GROUP HOLDINGS, INC. AND SUBSIDIARIES
Notes to Consolidated Financial Statements (Continued)
(in thousands except share and per share data)
The following table represents the activity as it relates to common units vested since the Company’s inception:
| Common |
Year ended June 30, | As of June 30, 2013 | ||||||||||||||||||||||||||||||
| 2008 | 2009 | 2010 | 2011 | 2012 | 2013 | Total Vested | Unvested | |||||||||||||||||||||||||
| Class A |
14,602,642 | 12,968,534 | 12,573,357 | 6,523,678 | 278,499 | 100,418 | 47,047,128 | — | ||||||||||||||||||||||||
| Class B |
— | — | 5,523,680 | 4,868,342 | 4,174,457 | 1,765,438 | 16,331,917 | 553,937 | ||||||||||||||||||||||||
| Class C |
— | — | 239,583 | 750,267 | 517,236 | 481,021 | 1,988,107 | 163,676 | ||||||||||||||||||||||||
| Class D |
— | — | — | 5,200,091 | 9,848,175 | 9,220,808 | 24,269,074 | 5,646,521 | ||||||||||||||||||||||||
| Class E |
— | — | — | 263,405 | 3,465,003 | 2,856,349 | 6,584,757 | 2,846,426 | ||||||||||||||||||||||||
| Class F |
— | — | — | — | 8,701,389 | 18,721,790 | 27,423,179 | 34,788,765 | ||||||||||||||||||||||||
| Class G |
— | — | — | — | — | 53,699,599 | 53,699,599 | 122,046,250 | ||||||||||||||||||||||||
| Class H |
— | — | — | — | — | 12,826,164 | 12,826,164 | 104,989,480 | ||||||||||||||||||||||||
| ZPS Class A |
— | — | — | — | — | — | — | 8,660,000 | ||||||||||||||||||||||||
|
|
|
|
|
|
|
|
|
|
|
|
|
|
|
|
|
|||||||||||||||||
| Total Vested |
14,602,642 | 12,968,534 | 18,336,620 | 17,605,783 | 26,984,759 | 99,671,587 | 190,169,925 | 279,695,055 | ||||||||||||||||||||||||
|
|
|
|
|
|
|
|
|
|
|
|
|
|
|
|
|
|||||||||||||||||
As of June 30, 2012 and 2013, respectively, the Company had 78,585,454 and 279,695,055 common units that were unvested and outstanding. As of June 30, 2013, the fair value of unvested common units issued to employees and independent directors was $133,742. The unvested shares at June 30, 2013 will become fully vested over a three to four year period.
The Company utilizes a probability-weighted estimated return method to value the common units. The method estimates the value of the units based on an analysis of values of the enterprise assuming various future outcomes. The estimated fair value of the common units is based on a probability-weighted present value of expected future proceeds to CII’s equity holders, considering certain potential liquidity scenarios available to CII’s investors as well as preferential rights of each security. This approach utilizes a variety of assumptions regarding the probability of a certain scenario occurring, if the event involves a transaction, the potential timing of such an event, and the potential valuation that each scenario might yield. The potential future outcomes that were considered by management were remaining a private company with the same ownership, a sale or merger, and an initial public offering (“IPO”). The income approach utilized under the remaining private scenario was based on management’s projected future cash flows and was discounted at a market participant weighted-average cost of capital. The market-based approach, utilized under the IPO and sale scenarios, estimates the fair value of CII’s equity based on observable multiples of revenue and EBITDA paid by investors and acquirers of interests of comparable companies in the public and private markets. These observable revenue and EBITDA multiples are applied to projected twelve-month revenue and EBITDA amounts at the dates of the potential exit events and discounted back using CII’s estimated cost of capital. The value attributable to each class of shares is then discounted in order to account for the lack of marketability of the units.
Equity Classified Awards
CII has issued preferred units to certain Company executives and directors as compensation. The terms of these preferred unit awards require the Company to record the award as an equity award. The Company estimates the fair value of these equity awards on the grant date and recognizes the related expense over the vesting period of the awards. As these awards have been issued by CII to employees and directors of the Company as compensation, the related expense has been recorded by the Company in the accompanying consolidated statements of operations. The
F-45
Table of Contents
ZAYO GROUP HOLDINGS, INC. AND SUBSIDIARIES
Notes to Consolidated Financial Statements (Continued)
(in thousands except share and per share data)
Company recognized stock-based compensation expense and a related increase to the Company’s member interest account of $820, $871, and $853 for the years ended June 30, 2011, 2012 and 2013, respectively.
(14) FAIR VALUE MEASUREMENTS
The Company’s financial instruments consist of cash and cash equivalents, restricted cash, trade receivables, accounts payable, interest rate swaps, long-term debt and stock-based compensation liability. The carrying values of cash and cash equivalents, restricted cash, trade receivables, and accounts payable approximated their fair values at June 30, 2012 and 2013 due to the short maturity of these instruments.
The carrying value of the note obligations reflects the original amounts borrowed, net of unamortized discounts or premiums, and was $350,122 and $1,250,000 as of June 30, 2012 and 2013, respectively. Based on market interest rates for debt of similar terms and average maturities, the fair value of the Company’s notes as of June 30, 2012 and 2013 was estimated to be $392,600 and $1,364,375, respectively. The Company’s fair value estimates associated with its note obligations were derived utilizing Level 2 inputs—quoted prices for similar instruments in active markets.
The carrying value of the Company’s term loan obligations reflects the original amounts borrowed, net of the unamortized discount and was $305,159 and $1,580,705 as of June 30, 2012 and 2013, respectively. The Company’s term loan accrues interest at variable rates based upon the one month, three month or six month LIBOR (with a LIBOR floor of 1.00%) plus a spread of 3.50%. Since management does not believe that the Company’s credit quality has changed significantly since the date when the amended Term Loan Facility was entered into and subsequently repriced, its carrying amount approximates fair value. Without giving effect to the Company’s interest rate swap which goes into effect July 1, 2013, a hypothetical increase in the applicable interest rate on the Company’s term loan of one percentage point above the 1.0% LIBOR floor would increase the Company’s annual interest expense by approximately $16,079.
The Company’s interest rate swaps are valued using discounted cash flow techniques that use observable market inputs, such as LIBOR-based yield curves, forward rates, and credit ratings. A change in the fair value of the interest rate swaps of $2,642 was recorded as a decrease to interest expense during the year ended June 30, 2013. A hypothetical increase in LIBOR rates of 100 basis points would increase the fair value of the interest rate swaps by approximately $26.6 million.
The carrying value of the Revolver as of June 30, 2012 reflected the balance outstanding, which was $30,000. Based on current market interest rates for debt of similar terms, the carrying value of the Revolver as of June 30, 2012 approximated fair value as the interest rate for the Revolver was variable based upon either a base rate or a Eurodollar rate plus an applicable margin and management did not believe that the Company’s credit quality has changed significantly since the date at which the Revolver was entered into. As of June 30, 2013, there is no balance currently outstanding under the Company’s current Revolver.
The Company recorded its promissory note with the previous owners of AFS at its fair value on the acquisition date, which was determined to be $4,141. As of June 30, 2012, management estimated the imputed interest associated with this note to be $359, which was amortized to interest expense through October 2012 the due date of the note. The fair value of this promissory note was not re-measured each reporting period; however, based on current interest rates for debt instruments with similar maturity dates, the June 30, 2012 book value of the AFS promissory note approximated fair value.
F-46
Table of Contents
ZAYO GROUP HOLDINGS, INC. AND SUBSIDIARIES
Notes to Consolidated Financial Statements (Continued)
(in thousands except share and per share data)
The Company records its interest rate swaps and stock-based compensation liability at their estimated fair value. Financial instruments measured at fair value on a recurring basis are summarized below:
| Level | June 30, 2012 | June 30, 2013 | ||||||||||
| Assets Recorded at Fair Value in the Financial Statements: |
||||||||||||
| Interest rate swap |
Level 2 | $ | — | $ | 2,642 | |||||||
| Liabilities Recorded at Fair Value in the Financial Statements: |
||||||||||||
| Stock-based compensation liability |
Level 3 | $ | 54,367 | $ | 159,320 | |||||||
The Company’s stock-based compensation liability related to CII common unit grants to employees is measured at fair value each reporting date. Various assumptions are utilized in the valuation that impact the resulting fair values calculated for each grant class, the most sensitive of which is the enterprise valuation multiple used under each exit scenario. An increase of 1.0x in these multiples would increase the corresponding stock-based compensation expense and liability by approximately $14,743 as of June 30, 2013.
(15) COMMITMENTS AND CONTINGENCIES
Capital Leases
Future contractual payments under the terms of the Company’s capital lease obligations were as follows:
| Year Ended June 30, |
||||
| 2014 |
$ | 7,166 | ||
| 2015 |
2,444 | |||
| 2016 |
1,426 | |||
| 2017 |
1,301 | |||
| 2018 |
758 | |||
| Thereafter |
2,535 | |||
|
|
|
|||
| Total minimum lease payments |
15,630 | |||
| Less amounts representing interest |
(2,463 | ) | ||
| Less current portion |
(6,600 | ) | ||
|
|
|
|||
| Capital lease obligations, non-current |
$ | 6,567 | ||
|
|
|
Operating Leases
The Company leases office space, warehouse space, network assets, switching and transport sites, points of presence and equipment under non-cancelable operating leases. Lease expense was $38,446, $45,885 and $87,161 for the years ended June 30, 2011, 2012 and 2013, respectively.
For scheduled rent escalation clauses during the lease terms or for rental payments commencing at a date other than the date of initial occupancy, the Company records minimum rental expenses on a straight-line basis over the terms of the leases. When the straight-line expense recorded exceeds the cash outflows during the respective period, the Company records a deferred rent liability on the consolidated balance sheets and amortizes the deferred rent over the term of the respective leases.
F-47
Table of Contents
ZAYO GROUP HOLDINGS, INC. AND SUBSIDIARIES
Notes to Consolidated Financial Statements (Continued)
(in thousands except share and per share data)
Minimum contractual lease payments due under the Company’s long-term operating leases are as follows:
| Year Ended June 30, |
||||
| 2014 |
$ | 85,441 | ||
| 2015 |
67,669 | |||
| 2016 |
55,296 | |||
| 2017 |
48,003 | |||
| 2018 |
43,474 | |||
| Thereafter |
223,920 | |||
|
|
|
|||
| $ | 523,803 | |||
|
|
|
Lease Termination Costs
During the fourth quarter of 2013, the Company recorded a charge for lease termination costs totaling $10,360 related to exit activities initiated for unutilized space associated with leased office and technical facilities, which was partially offset by a benefit related to the release of associated rent escalation accrual in the amount of $163. The net lease termination charge recorded during the year ended June 30, 2013 was $10,197. In connection with integration activities associated with acquisitions completed during Fiscal 2012 and 2013, the Company completed an analysis of existing and acquired facilities leases and determined that certain facilities under lease would not be used by the Company in the future. The charge has been included in operating costs and selling, general and administrative expenses. As of June 30, 2013, the remaining lease termination obligation associated with these facilities was $10,073, which is recorded net of expected sublease income of $2,952. The Company periodically re-evaluates its assumptions used to estimate this obligation and may record adjustments prospectively as facts or circumstances change related to the impaired leased facilities.
A summary of the lease termination charges and related activity follows:
| Lease Termination Liability (in thousands) |
||||
| Balance as of June 30, 2012 |
$ | — | ||
| Charges |
10,360 | |||
| Accretion |
3 | |||
| Payments |
(290 | ) | ||
|
|
|
|||
| Balance as of June 30, 2013 |
10,073 | |||
| Less current portion |
2,054 | |||
|
|
|
|||
| Lease termination liability-long term |
$ | 8,019 | ||
|
|
|
|||
Purchase Commitments
At June 30, 2013, the Company was contractually committed for $85,835 of capital expenditures for construction materials and purchases of property and equipment. A majority of these purchase commitments are expected to be satisfied in the next twelve months. These purchase commitments are primarily success based; that is, the Company has executed customer contracts that support the future capital expenditures.
Outstanding Letters of Credit
As of June 30, 2013, the Company had $6,561 in outstanding letters of credit, which were primarily entered into in connection with various lease agreements.
F-48
Table of Contents
ZAYO GROUP HOLDINGS, INC. AND SUBSIDIARIES
Notes to Consolidated Financial Statements (Continued)
(in thousands except share and per share data)
Other Commitments
In February 2010, the Company was awarded an NTIA Broadband Technology Opportunities Program grant for a fiber network project in Indiana (the “Indiana Stimulus Project”). The Indiana Stimulus Project involves approximately $31,425 of capital expenditures, of which $25,100 was funded by a government grant and approximately $6,285 was funded by the Company. In connection with this project, 626 route miles of fiber were constructed and lit. The Company began capitalizing certain pre-construction costs associated with this project in April 2010 and began receiving grant funds in May 2010. As of June 30, 2013, the Company has been reimbursed for $96 of expenses and $23,786 of capital expenditures related to the Indiana Stimulus Project. The Company also contributed $4,400 of pre-existing network assets to the project as of June 30, 2013. The Company completed this project on July 31, 2013.
In July 2010, the Company was awarded from the NTIA Broadband Technology Opportunities Program a $13,383 grant to construct 286 miles of fiber network in Anoka County, Minnesota, outside of Minneapolis (the “Anoka Stimulus Project”). The Anoka Stimulus Project involves approximately $19,117 of capital expenditures, of which $13,383 is to be funded by a government grant and approximately $5,735 is to be funded by the Company. As of June 30, 2013, The Company has been reimbursed for $121 of expenses and $11,646 of capital expenditures related to the Anoka Stimulus Project. The Company anticipates this project will be completed by December 2013.
In September 2011, the Company signed a sub-recipient agreement on an award granted to Com Net, Inc. (“Com Net”) from the NTIA Broadband Technology Opportunities Program. The award of approximately $30,032 to Com Net will expand broadband services to rural and underserved communities in Western Ohio. In order to effectively implement the project, Com Net established the GigE Plus Availability Coalition consisting of the Company, OARnet and an initial group of 33 Broadband Service Providers to deploy broadband to 28 Western Ohio counties. Upon completion, the project will add nearly 366 new miles of fiber to the Company’s existing Ohio network. As a sub recipient, the Company is required to contribute to the federal match. The Company’s maximum contribution is $3,111 which represents a 30% match on the assets to which the Company will take ownership. The Company anticipates the project will be completed by November 2013. As of June 30, 2013, the Company has incurred $476 in capital expenditures associated with this project.
Contingencies
In the normal course of business, the Company is party to various outstanding legal proceedings, asserted and unasserted claims, and carrier disputes. In the opinion of management, the ultimate disposition of these matters, both asserted and unasserted, will not have a material adverse effect on the Company’s financial condition, results of operations, or cash flows.
(16) RELATED PARTY TRANSACTIONS
As of July 1, 2011, the Company had a due to related party balance with CII of $4,590. The liability with CII relates to an interest payment made by CII on the Company’s Original Notes. During the year ended June 30, 2012, CII made an additional interest payment of $10,951 on behalf of the Company. During the year ended June 30, 2012, the Company and CII agreed to settle the then outstanding payable to CII in the amount of $15,541 through an increase in CII’s equity in the Company. The Company has not included these non-cash payments of interest in its statements of cash flows.
As discussed in Note 4—Spin-off of Business, the Company spun-off the OVS business to CII on June 13, 2014.
F-49
Table of Contents
ZAYO GROUP HOLDINGS, INC. AND SUBSIDIARIES
Notes to Consolidated Financial Statements (Continued)
(in thousands except share and per share data)
Dan Caruso, the Company’s President, Chief Executive Officer and director purchased $500 of the Company’s notes in connection with the Company’s $100,000 notes offering in September 2010. The purchase price of the notes acquired by Mr. Caruso was $516 after considering the premium on the notes and accrued interest. On July 2, 2012, the Company repurchased Mr. Caruso’s notes for $541 pursuant to its offer to repurchase all of the outstanding notes of that series.
On July 2, 2012, Matthew Erickson, an officer of the Company, purchased $600 in aggregate principal amount of the Company’s Senior Unsecured Notes at the offering price for such notes. Mr. Erickson qualifies as an “accredited investor” (as defined in Rule 501 under the Securities Act) and purchased the notes on terms available to other investors.
(17) SEGMENT REPORTING
An operating segment is a component of an entity that has all of the following characteristics:
| • | It engages in business activities from which it may earn revenues and incur expenses. |
| • | Its operating results are regularly reviewed by the entity’s chief operating decision maker to make decisions about resources to be allocated to the segment and assess its performance. |
| • | Its discrete financial information is available. |
The Company’s chief operating decision maker is its Chief Executive Officer.
The Company uses the management approach to determine the segment financial information that should be disaggregated and presented separately in the Company’s notes to its financial statements. The management approach is based on the manner by which management has organized the segments within the Company for making operating decisions, allocating resources, and assessing performance. The Company evaluates performance and makes decisions about allocating resources to its operating segments based on financial measures such as revenue and adjusted EBITDA (as defined below).
The Company’s eight SPGs are organized into three reportable segments based on the similarities of business activities: Physical Infrastructure, Lit Services, and Other. The Physical Infrastructure reporting segment is comprised of the following SPGs: Dark Fiber, Mobile Infrastructure, and zColo. The Lit Services reporting segment is comprised of the following SPGs: Wavelengths, Ethernet, IP and SONET. The Other reporting segment is comprised of the ZPS SPG. SPGs report directly to the segment managers who are responsible for the operations and financial results for the Physical Infrastructure, Lit Services and Other reportable segments. The segment managers for each of the Physical Infrastructure, Lit Services and Other reportable segments report directly to the CODM, and it is the financial results of those segments that are evaluated and drive the resource allocation decisions.
The Company’s three reportable segments are described below:
| • | Physical Infrastructure. Through the Physical Infrastructure segment, the Company provides raw bandwidth infrastructure to customers that require more control of their internal networks. These services include dark fiber, mobile infrastructure (fiber-to-the-tower and small cell), and colocation and interconnection. Dark fiber is a physically separate and secure, private platform for dedicated bandwidth. The Company leases dark fiber pairs (usually 2 to 12 total fibers) to its customers, who “light” the fiber using their own optronics. The Company’s mobile infrastructure services provide direct fiber connections |
F-50
Table of Contents
ZAYO GROUP HOLDINGS, INC. AND SUBSIDIARIES
Notes to Consolidated Financial Statements (Continued)
(in thousands except share and per share data)
| to cell towers, small cells, hub sites, and mobile switching centers. The Company’s datacenters offer colocation and interconnection services to its customers, who then house and power the Company’s computing and networking equipment for the purpose of aggregating and distributing data, voice, Internet, and video traffic. Physical Infrastructure customers include carriers and other communication service providers, Internet service providers, wireless service providers, major media and content companies, large enterprises, and other companies that have the expertise to run their own fiber optic networks or require interconnected technical space. The contract terms in the Physical Infrastructure segment generally tend to range from three to twenty years. |
| • | Lit Services. The Lit Services segment provides bandwidth infrastructure solutions over the Company’s metro, regional, and long-haul fiber networks where it uses optronics to light the fiber and the Company’s customers pay for access based on the amount and type of bandwidth they purchase. The Company’s lit services include wavelength, Ethernet, IP, and SONET services with capacity ranging from 1.54Mb to 100G. The Company targets customers who require a minimum of 10G of bandwidth across their networks. Lit Services customers include carriers, financial services companies, healthcare, government institutions, education institutions and other enterprises. The contract terms in this segment tend to range from two to five years. |
| • | Other. The Other segment is comprised of the ZPS SPG, which provides network and technical resources to customers in designing, acquiring and maintaining their networks. Services are typically provided for a term of one year for a fixed recurring monthly fee in the case of network and on an hourly basis for technical resources (usage revenue). |
Revenues for all of the Company’s products are included in one of the Company’s three reportable segments. The results of operations for each reportable segment include an allocation of certain indirect costs and corporate related costs, including overhead and third party-financed debt. The allocation is based on a percentage that represents management’s estimate of the relative burden each segment bears of indirect and corporate costs. Management has evaluated the allocation methods utilized to allocate these costs and determined they are systematic and rational. Identifiable assets for each reportable segment are reconciled to total consolidated assets including unallocated corporate assets and intersegment eliminations. Unallocated corporate assets consist primarily of cash and deferred taxes. The following tables summarize financial information of each of the segments:
Segment Adjusted EBITDA
Segment Adjusted EBITDA is the primary measure used by the Company’s CODM to evaluate segment operating performance.
The Company defines Segment Adjusted EBITDA as earnings from continuing operations before interest, income taxes, depreciation and amortization (“EBITDA”) adjusted to exclude acquisition-related transaction costs, losses on extinguishment of debt, stock-based compensation, unrealized foreign currency translation gains on an intercompany loan, and impairment of cost method investment. The Company uses Segment Adjusted EBITDA to evaluate operating performance, and this financial measure is among the primary measures used by management for planning and forecasting of future periods. The Company believes that the presentation of Segment Adjusted EBITDA is relevant and useful for investors because it allows investors to view results in a manner similar to the method used by management and facilitates comparison of the Company’s results with the results of other companies that have different financing and capital structures.
F-51
Table of Contents
ZAYO GROUP HOLDINGS, INC. AND SUBSIDIARIES
Notes to Consolidated Financial Statements (Continued)
(in thousands except share and per share data)
Segment Adjusted EBITDA results, along with other quantitative and qualitative information, are also utilized by the Company and its Compensation Committee for purposes of determining bonus payouts to employees.
Segment Adjusted EBITDA has limitations as an analytical tool and should not be considered in isolation from, or as a substitute for, analysis of the Company’s results from operations and operating cash flows as reported under GAAP. For example, Segment Adjusted EBITDA:
| • | does not reflect capital expenditures, or future requirements for capital and major maintenance expenditures or contractual commitments; |
| • | does not reflect changes in, or cash requirements for, working capital needs; |
| • | does not reflect the significant interest expense, or the cash requirements necessary to service the interest payments, on the Company’s debt; and |
| • | does not reflect cash required to pay income taxes. |
The Company’s computation of Segment Adjusted EBITDA may not be comparable to other similarly titled measures computed by other companies because all companies do not calculate segment Adjusted EBITDA in the same fashion.
| For the year ended June 30, 2011 | ||||||||||||||||||||
| Physical Infrastructure |
Lit Services | Other | Corp/ eliminations |
Total | ||||||||||||||||
| Revenue from external customers |
$ | 110,868 | $ | 176,367 | $ | — | $ | (5,092 | ) | $ | 282,143 | |||||||||
| Segment Adjusted EBITDA |
60,419 | 66,392 | — | (3,321 | ) | 123,490 | ||||||||||||||
| Capital expenditures, net of stimulus grant reimbursements |
72,627 | 39,897 | — | — | 112,524 | |||||||||||||||
| For the year ended June 30, 2012 | ||||||||||||||||||||
| Physical Infrastructure |
Lit Services | Other | Corp/ eliminations |
Total | ||||||||||||||||
| Revenue from external customers |
$ | 157,419 | $ | 224,624 | $ | — | $ | (6,517 | ) | $ | 375,526 | |||||||||
| Segment Adjusted EBITDA |
101,060 | 92,120 | — | (5,394 | ) | 187,786 | ||||||||||||||
| Total assets(1) |
611,777 | 483,755 | — | 346,523 | 1,442,055 | |||||||||||||||
| Capital expenditures, net of stimulus grant reimbursements |
38,809 | 85,328 | — | — | 124,137 | |||||||||||||||
(1) Assets of discontinued operations of $67,328 are included in the Corp/elimination column for the year ended June 30, 2012.
| For the year ended June 30, 2013 | ||||||||||||||||||||
| Physical Infrastructure |
Lit Services | Other | Corp/ eliminations |
Total | ||||||||||||||||
| Revenue from external customers |
$ | 415,454 | $ | 572,631 | $ | 27,775 | $ | (11,506 | ) | $ | 1,004,354 | |||||||||
| Segment Adjusted EBITDA |
275,684 | 277,854 | 6,193 | (5,302 | ) | 554,429 | ||||||||||||||
| Total assets(1) |
2,311,552 | 1,685,510 | 32,363 | 221,815 | 4,251,240 | |||||||||||||||
| Capital expenditures, net of stimulus grant reimbursements |
180,261 | 142,940 | 31 | — | 323,232 | |||||||||||||||
(1) Assets of discontinued operations of $69,828 are included in the Corp/elimination column for the year ended June 30, 2013
F-52
Table of Contents
ZAYO GROUP HOLDINGS, INC. AND SUBSIDIARIES
Notes to Consolidated Financial Statements (Continued)
(in thousands except share and per share data)
Reconciliation from Total Segment Adjusted EBITDA to net earnings/(loss) from continuing operations before income taxes
| For the year ended June 30, | ||||||||||||
| 2011 | 2012 | 2013 | ||||||||||
| Total Segment Adjusted EBITDA |
$ | 123,490 | $ | 187,786 | $ | 554,429 | ||||||
| Interest expense |
(33,414 | ) | (50,720 | ) | (202,464 | ) | ||||||
| Depreciation and amortization expense |
(60,463 | ) | (84,961 | ) | (324,532 | ) | ||||||
| Transaction costs |
(865 | ) | (6,630 | ) | (14,204 | ) | ||||||
| Impairment of cost method investment |
— | (2,248 | ) | — | ||||||||
| Stock-based compensation |
(24,310 | ) | (26,253 | ) | (105,849 | ) | ||||||
| Loss on extinguishment of debt |
— | — | (77,253 | ) | ||||||||
| Unrealized foreign currency translation gain |
— | — | 55 | |||||||||
|
|
|
|
|
|
|
|||||||
| Net earnings/(loss) from continuing operations before provision for income taxes |
$ | 4,438 | $ | 16,974 | $ | (169,818 | ) | |||||
|
|
|
|
|
|
|
|||||||
The following is a summary of geographical information (dollars in thousands):
| For the year ended June 30, | ||||||||||||
| 2011 | 2012 | 2013 | ||||||||||
| Revenue from external customers: |
||||||||||||
| United States |
$ | 282,143 | $ | 375,526 | $ | 946,502 | ||||||
| United Kingdom |
— | — | 57,488 | |||||||||
| Japan |
— | — | 364 | |||||||||
|
|
|
|
|
|
|
|||||||
| $ | 282,143 | $ | 375,526 | $ | 1,004,354 | |||||||
|
|
|
|
|
|
|
|||||||
| Long-lived assets: |
||||||||||||
| United States |
$ | 961,921 | $ | 3,094,392 | ||||||||
| United Kingdom |
— | 120,221 | ||||||||||
| Japan |
— | 2 | ||||||||||
|
|
|
|
|
|||||||||
| $ | 961,921 | $ | 3,214,615 | |||||||||
|
|
|
|
|
|||||||||
The Company includes all non-current assets, except for goodwill and assets of discontinued operations, in its long-lived assets.
F-53
Table of Contents
ZAYO GROUP HOLDINGS, INC. AND SUBSIDIARIES
Notes to Consolidated Financial Statements (Continued)
(in thousands except share and per share data)
(18) QUARTERLY FINANCIAL DATA (UNAUDITED)
The following table presents the unaudited quarterly results for the year ended June 30, 2012:
| 2012 Quarter Ended | ||||||||||||||||||||
| September 30 | December 31(1) | March 31(2) | June 30(3) | Total | ||||||||||||||||
| Revenue |
$ | 76,858 | $ | 87,371 | $ | 103,434 | $ | 107,863 | $ | 375,526 | ||||||||||
|
|
|
|
|
|
|
|
|
|
|
|||||||||||
| Operating costs and expenses |
||||||||||||||||||||
| Operating costs, excluding depreciation and amortization |
18,001 | 19,212 | 22,309 | 22,561 | 82,083 | |||||||||||||||
| Selling, general and administrative expenses, excluding stock-based compensation |
22,646 | 26,288 | 30,629 | 32,847 | 112,410 | |||||||||||||||
| Stock-based compensation |
3,704 | 10,372 | 5,624 | 6,553 | 26,253 | |||||||||||||||
|
|
|
|
|
|
|
|
|
|
|
|||||||||||
| Selling, general and administrative expenses |
26,350 | 36,660 | 36,253 | 39,400 | 138,663 | |||||||||||||||
| Depreciation and amortization |
17,062 | 19,820 | 23,798 | 24,281 | 84,961 | |||||||||||||||
|
|
|
|
|
|
|
|
|
|
|
|||||||||||
| Total operating costs and expenses |
61,413 | 75,692 | 82,360 | 86,242 | 305,707 | |||||||||||||||
|
|
|
|
|
|
|
|
|
|
|
|||||||||||
| Operating income |
15,445 | 11,679 | 21,074 | 21,621 | 69,819 | |||||||||||||||
|
|
|
|
|
|
|
|
|
|
|
|||||||||||
| Other expenses |
||||||||||||||||||||
| Interest expense |
(9,168 | ) | (11,504 | ) | (14,450 | ) | (15,598 | ) | (50,720 | ) | ||||||||||
| Impairment of cost method investment |
— | — | — | (2,248 | ) | (2,248 | ) | |||||||||||||
| Other (expense)/income, net |
(11 | ) | (19 | ) | 152 | 1 | 123 | |||||||||||||
|
|
|
|
|
|
|
|
|
|
|
|||||||||||
| Total other expenses, net |
(9,179 | ) | (11,523 | ) | (14,298 | ) | (17,845 | ) | (52,845 | ) | ||||||||||
|
|
|
|
|
|
|
|
|
|
|
|||||||||||
| Earnings from continuing operations before income taxes |
6,266 | 156 | 6,776 | 3,776 | 16,974 | |||||||||||||||
| Provision for income taxes |
3,998 | 2,319 | 10,480 | 10,074 | 26,871 | |||||||||||||||
|
|
|
|
|
|
|
|
|
|
|
|||||||||||
| Earnings/(loss) from continuing operations |
2,268 | (2,163 | ) | (3,704 | ) | (6,298 | ) | (9,897 | ) | |||||||||||
| Earnings from discontinued operations, net of income taxes(5) |
1,744 | 1,569 | 2,425 | 2,935 | 8,673 | |||||||||||||||
|
|
|
|
|
|
|
|
|
|
|
|||||||||||
| Net earnings/(loss) |
$ | 4,012 | $ | (594 | ) | $ | (1,279 | ) | $ | (3,363 | ) | $ | (1,224 | ) | ||||||
|
|
|
|
|
|
|
|
|
|
|
|||||||||||
(1) The Company realized an increase in revenue and operating expenses beginning December 1, 2011 as a result of the acquisition of 360networks. The Company also recognized an increase in interest expense associated with the debt issued to fund the acquisition—see Note 9—Long-Term Debt.
(2) The Company realized an increase in revenue and operating expenses beginning December 31, 2011 as a result of the acquisition of MarquisNet.
(3) The Company realized an increase in revenue and operating expenses beginning May 1, 2012 as a result of the acquisition of Arialink.
(4) During the quarter ended June 30, 2012, the Company recognized an impairment of its investment in USCarrier of $2,248—see Note 5—Investment.
(5) The Company spun-off its OVS operating unit on June 13, 2014—see Note 4—Spin-Off of Business.
F-54
Table of Contents
ZAYO GROUP HOLDINGS, INC. AND SUBSIDIARIES
Notes to Consolidated Financial Statements (Continued)
(in thousands except share and per share data)
The following table presents the unaudited quarterly results for the year ended June 30, 2013:
| 2013 Quarter Ended | ||||||||||||||||||||
| September 30(1) | December 31(2)(3) | March 31(4) | June 30(5) | Total | ||||||||||||||||
| Revenue |
$ | 234,827 | $ | 248,876 | $ | 258,944 | $ | 261,707 | $ | 1,004,354 | ||||||||||
|
|
|
|
|
|
|
|
|
|
|
|||||||||||
| Operating costs and expenses |
||||||||||||||||||||
| Operating costs, excluding depreciation and amortization |
32,482 | 37,400 | 40,150 | 35,845 | 145,877 | |||||||||||||||
| Selling, general and administrative expenses, excluding stock-based compensation |
86,800 | 74,328 | 72,265 | 85,130 | 318,523 | |||||||||||||||
| Stock-based compensation |
10,481 | 33,712 | 23,720 | 37,936 | 105,849 | |||||||||||||||
|
|
|
|
|
|
|
|
|
|
|
|||||||||||
| Selling, general and administrative expenses |
97,281 | 108,040 | 95,985 | 123,066 | 424,372 | |||||||||||||||
| Depreciation and amortization |
80,014 | 83,930 | 79,936 | 80,652 | 324,532 | |||||||||||||||
|
|
|
|
|
|
|
|
|
|
|
|||||||||||
| Total operating costs and expenses |
209,777 | 229,370 | 216,071 | 239,563 | 894,781 | |||||||||||||||
|
|
|
|
|
|
|
|
|
|
|
|||||||||||
| Operating income |
25,050 | 19,506 | 42,873 | 22,144 | 109,573 | |||||||||||||||
|
|
|
|
|
|
|
|
|
|
|
|||||||||||
| Other expenses |
||||||||||||||||||||
| Interest expense(7) |
(62,554 | ) | (52,635 | ) | (49,618 | ) | (37,657 | ) | (202,464 | ) | ||||||||||
| Loss on extinguishment of debt(8) |
(64,976 | ) | (5,707 | ) | (6,570 | ) | — | (77,253 | ) | |||||||||||
| Other income/(expense), net |
578 | 226 | (502 | ) | 24 | 326 | ||||||||||||||
|
|
|
|
|
|
|
|
|
|
|
|||||||||||
| Total other expenses, net |
(126,952 | ) | (58,116 | ) | (56,690 | ) | (37,633 | ) | (279,391 | ) | ||||||||||
|
|
|
|
|
|
|
|
|
|
|
|||||||||||
| (Loss)/earnings from continuing operations before income taxes |
(101,902 | ) | (38,610 | ) | (13,817 | ) | (15,489 | ) | (169,818 | ) | ||||||||||
| (Benefit)/provision for income taxes |
(36,214 | ) | (3,541 | ) | 6,206 | 9,344 | (24,205 | ) | ||||||||||||
|
|
|
|
|
|
|
|
|
|
|
|||||||||||
| Loss from continuing operations |
(65,688 | ) | (35,069 | ) | (20,023 | ) | (24,833 | ) | (145,613 | ) | ||||||||||
| Earnings from discontinued operations, net of income taxes(9) |
2,432 | 2,422 | 2,634 | 908 | 8,396 | |||||||||||||||
|
|
|
|
|
|
|
|
|
|
|
|||||||||||
| Net (loss)/earnings |
$ | (63,256 | ) | $ | (32,647 | ) | $ | (17,389 | ) | $ | (23,925 | ) | $ | (137,217 | ) | |||||
|
|
|
|
|
|
|
|
|
|
|
|||||||||||
(1) The Company realized an increase in revenue and operating expenses beginning August 31, 2012 as a result of the acquisition of FiberGate.
(2) The Company realized an increase in revenue and operating expenses beginning October 1, 2012 as a result of the acquisition of USCarrier.
(3) The Company realized an increase in revenue and operating expenses beginning December 14, 2012 as a result of the acquisition of First Telecom.
(4) The Company realized an increase in revenue and operating expenses beginning December 31, 2012 as a result of the acquisition of Litecast.
(5) The Company realized an increase in revenue and operating expenses beginning June 1, 2013 as a result of the acquisition of Core NAP.
(6) During the quarter ended June 30, 2013, the Company recognized a charge of $10,197 for lease termination costs related to exit activities initiated for unutilized space associated with leased office and technical facilities—see Note 15—Commitments and Contingencies.
(7) The Company realized a decrease in interest expense during the second and third quarters of 2013 due to financing transactions completed to lower the interest rates on the Company’s variable rate debt. During the
F-55
Table of Contents
ZAYO GROUP HOLDINGS, INC. AND SUBSIDIARIES
Notes to Consolidated Financial Statements (Continued)
(in thousands except share and per share data)
fourth quarter of 2013, favorable movements in interest rates increased the fair value of the Company’s interest rate swaps, resulting in a decrease in the Company’s interest expense—see Note 9—Long-Term Debt.
(8) The Company completed debt refinancing transactions during the first, second and third quarters of Fiscal 2013, resulting in a loss on debt extinguishment in each respective period. See Note 9—Long-Term Debt.
(9) The Company spun-off its OVS operating unit on June 13, 2014—see Note 4—Spin-Off of Business.
(19) SUBSEQUENT EVENTS
See Note 3—Acquisitions, for a discussion of acquisitions closed subsequent to year end or that were pending.
On September 12, 2013, the Board of Managers of CII authorized a non-liquidating distribution to certain common unit holders of up to $10,000. The total amount of the aggregate distributions to employees of the Company was $8,797 and was recognized as a non-cash capital contribution to the Company upon distribution during the second quarter of Fiscal 2014.
Fifth Amendment to Credit Agreement
On November 26, 2013, ZGL and Zayo Capital Inc. entered into a Fifth Amendment to the Credit Agreement dated as of July 2, 2012 (the “Fifth Amendment”). Per the terms of the Fifth Amendment, the Company’s Term Loan Facility was increased by $150,000 to $1,749,750 and bears interest at LIBOR plus 3.0 percent with a minimum LIBOR rate of 1.0 percent. The amended terms represent a downward adjustment of 50 basis points. The Company’s Revolver bears interest at LIBOR plus 2.75 percent (based on the Company’s current leverage ratio), which represents a downward adjustment of 25 basis points. In connection with the Fifth Amendment, the Company did not incur a re-pricing premium.
Employment Agreement
Effective February 15, 2014, Daniel P. Caruso entered into an employment agreement with the Company. Mr. Caruso reports directly to the Boards of Managers of CII and ZGL for a term expiring July 2, 2017, unless earlier terminated under the terms thereof. Mr. Caruso will initially receive a base salary of $400 per annum, which amount will be renegotiated on an annual basis. The employment agreement also confirmed that Mr. Caruso’s previously issued equity compensation awards of common units and preferred units in CII fully vested as of February 15, 2014, except with respect to certain unvested common units that vest as provided in Schedule A to the employment agreement.
Also on February 15, 2014, the Company and CII approved an advance distribution of cash to Mr. Caruso in respect of his common units in the amount of $3,000 pursuant to a letter agreement with Mr. Caruso. Accordingly, Mr. Caruso will forfeit the first $3,000 in future distributions made in respect of his common units under the CII operating agreement.
Distribution to Employee
Effective May 1, 2014, Martin Snella, an employee of the Company, entered into a settlement agreement with CII and the Company in connection with his concurrent resignation. In connection with his voluntary resignation, all of Mr. Snella’s vested equity compensation awards of common units were redeemed in exchange for a purchase price of $9,050. All of the redeemed common units were transferred to CII and were cancelled upon his termination with the Company, with a corresponding reduction in the Company’s remaining liability for Mr. Snella’s vested common units.
F-56
Table of Contents
ZAYO GROUP HOLDINGS, INC. AND SUBSIDIARIES
Notes to Consolidated Financial Statements (Continued)
(in thousands except share and per share data)
Sixth Amendment to Credit Agreement
On May 16, 2014, ZGL and Zayo Capital Inc. entered into a Sixth Amendment (the “Sixth Amendment”) to the Credit Agreement dated as of July 2, 2012 (as amended, the “Credit Agreement”). Per the terms of the Sixth Amendment, the Company’s $1,740,900 Term Loan Facility was increased by $275,000 to $2,015,900 and bears interest at the existing rate of LIBOR plus 3.0 percent with a minimum LIBOR rate of 1.0 percent. The $275,000 add-on was priced at 99.5 percent. No other terms of the Credit Agreement were amended.
See Note 3—Spin-Off of Business, for a discussion of the spin-off of Onvoy, LLC.
F-57
Table of Contents
ZAYO GROUP HOLDINGS, INC.
UNAUDITED CONDENSED CONSOLIDATED FINANCIAL STATEMENTS
F-58
Table of Contents
ZAYO GROUP HOLDINGS, INC. AND SUBSIDIARIES
CONDENSED CONSOLIDATED BALANCE SHEETS (UNAUDITED)
(in thousands, except share and per share data)
| June 30, 2013 |
March 31, 2014 |
|||||||
| Assets |
||||||||
| Current assets |
||||||||
| Cash and cash equivalents |
$ | 91,313 | $ | 254,607 | ||||
| Trade receivables, net of allowance of $4,036 and $4,230 as of June 30, 2013 and March 31, 2014, respectively |
70,877 | 49,751 | ||||||
| Due from related parties |
622 | 508 | ||||||
| Prepaid expenses |
19,925 | 21,514 | ||||||
| Deferred income taxes, net |
90,628 | 90,356 | ||||||
| Other assets |
2,281 | 3,607 | ||||||
| Current assets of discontinued operations |
27,850 | 31,727 | ||||||
|
|
|
|
|
|||||
| Total current assets |
303,496 | 452,070 | ||||||
| Property and equipment, net |
2,437,707 | 2,533,256 | ||||||
| Intangible assets, net |
640,350 | 653,971 | ||||||
| Goodwill |
688,836 | 756,715 | ||||||
| Debt issuance costs, net |
99,098 | 89,793 | ||||||
| Deferred income taxes, net |
8,106 | — | ||||||
| Other assets |
29,354 | 27,933 | ||||||
| Assets of discontinued operations |
44,293 | 48,078 | ||||||
|
|
|
|
|
|||||
| Total assets |
$ | 4,251,240 | $ | 4,561,816 | ||||
|
|
|
|
|
|||||
| Liabilities and stockholder’s equity |
||||||||
| Current liabilities |
||||||||
| Current portion of long-term debt |
$ | 16,200 | $ | 17,700 | ||||
| Accounts payable |
33,530 | 20,850 | ||||||
| Accrued liabilities |
117,101 | 116,740 | ||||||
| Accrued interest |
55,048 | 28,849 | ||||||
| Capital lease obligations, current |
6,600 | 3,050 | ||||||
| Deferred revenue, current |
37,937 | 59,526 | ||||||
| Current liabilities of discontinued operations |
15,344 | 16,811 | ||||||
|
|
|
|
|
|||||
| Total current liabilities |
281,760 | 263,526 | ||||||
| Long-term debt, non-current |
2,814,505 | 2,953,010 | ||||||
| Capital lease obligation, non-current |
6,567 | 16,481 | ||||||
| Deferred revenue, non-current |
344,466 | 434,305 | ||||||
| Stock-based compensation liability |
159,320 | 312,489 | ||||||
| Deferred income taxes, net |
5,992 | 29,673 | ||||||
| Other long-term liabilities |
19,549 | 20,230 | ||||||
| Liabilities of discontinued operations |
12,828 | 14,783 | ||||||
|
|
|
|
|
|||||
| Total liabilities |
3,644,987 | 4,044,497 | ||||||
|
|
|
|
|
|||||
| Commitments and contingencies (Note 11) |
||||||||
| Stockholder’s equity: |
||||||||
| Common stock, $0.001 par value—1,000 shares authorized; 1,000 shares issued and outstanding as of June 30, 2013 and March 31, 2014, respectively |
— | — | ||||||
| Additional paid-in capital |
763,355 | 778,431 | ||||||
| Accumulated other comprehensive (loss)/income |
(4,755 | ) | 9,880 | |||||
| Accumulated deficit |
(152,347 | ) | (257,992 | ) | ||||
| Note receivable from CII |
— | (13,000 | ) | |||||
|
|
|
|
|
|||||
| Total stockholder’s equity |
606,253 | 517,319 | ||||||
|
|
|
|
|
|||||
| Total liabilities and stockholder’s equity |
$ | 4,251,240 | $ | 4,561,816 | ||||
|
|
|
|
|
|||||
The accompanying notes are an integral part of these condensed consolidated financial statements.
F-59
Table of Contents
ZAYO GROUP HOLDINGS, INC. AND SUBSIDIARIES
CONDENSED CONSOLIDATED STATEMENTS OF OPERATIONS (UNAUDITED)
(in thousands, except share and per share data)
| Nine months
ended March 31, |
||||||||
| 2013 | 2014 | |||||||
| Revenue |
$ | 742,647 | $ | 826,537 | ||||
|
|
|
|
|
|||||
| Operating costs and expenses |
||||||||
| Operating costs, excluding depreciation and amortization |
110,032 | 110,634 | ||||||
| Selling, general and administrative expenses, excluding stock-based compensation |
233,393 | 234,395 | ||||||
| Stock-based compensation |
67,913 | 165,134 | ||||||
|
|
|
|
|
|||||
| Selling, general and administrative expenses |
301,306 | 399,529 | ||||||
| Depreciation and amortization |
243,880 | 246,922 | ||||||
|
|
|
|
|
|||||
| Total operating costs and expenses |
655,218 | 757,085 | ||||||
|
|
|
|
|
|||||
| Operating income |
87,429 | 69,452 | ||||||
|
|
|
|
|
|||||
| Other expenses |
||||||||
| Interest expense |
(164,807 | ) | (150,905 | ) | ||||
| Loss on extinguishment of debt |
(77,253 | ) | (1,911 | ) | ||||
| Other income, net |
302 | 1,266 | ||||||
|
|
|
|
|
|||||
| Total other expenses, net |
(241,758 | ) | (151,550 | ) | ||||
|
|
|
|
|
|||||
| Loss from continuing operations before provision for income taxes |
(154,329 | ) | (82,098 | ) | ||||
| Provision/(benefit) for income taxes |
(33,549 | ) | 27,202 | |||||
|
|
|
|
|
|||||
| Loss from continuing operations |
(120,780 | ) | (109,300 | ) | ||||
| Earnings from discontinued operations, net of income taxes |
7,488 | 3,655 | ||||||
|
|
|
|
|
|||||
| Net loss |
$ | (113,292 | ) | $ | (105,645 | ) | ||
|
|
|
|
|
|||||
| Weighted-average shares used to compute net loss per share: |
||||||||
| Basic and diluted |
1,000 | 1,000 | ||||||
| Loss from continuing operations per share: |
||||||||
| Basic and diluted |
$ | (120,780 | ) | $ | (109,300 | ) | ||
| Income from discontinued operations per share: |
||||||||
| Basic and diluted |
$ | 7,488 | $ | 3,655 | ||||
| Net loss per share: |
||||||||
| Basic and diluted |
$ | (113,292 | ) | $ | (105,645 | ) | ||
| Proforma (loss)/earnings per share (unaudited): |
||||||||
| Basic and diluted – continuing operations |
||||||||
| Basic and diluted – discontinued operations |
||||||||
The accompanying notes are an integral part of these condensed consolidated financial statements.
F-60
Table of Contents
ZAYO GROUP HOLDINGS, INC. AND SUBSIDIARIES
CONDENSED CONSOLIDATED STATEMENTS OF COMPREHENSIVE LOSS (UNAUDITED)
(in thousands)
| Nine months
ended March 31, |
||||||||
| 2013 | 2014 | |||||||
| Net loss |
$ | (113,292 | ) | $ | (105,645 | ) | ||
| Foreign currency translation adjustments |
(4,956 | ) | 14,635 | |||||
|
|
|
|
|
|||||
| Comprehensive loss |
$ | (118,248 | ) | $ | (91,010 | ) | ||
|
|
|
|
|
|||||
The accompanying notes are an integral part of these condensed consolidated financial statements.
F-61
Table of Contents
ZAYO GROUP HOLDINGS, INC. AND SUBSIDIARIES
CONDENSED CONSOLIDATED STATEMENT OF STOCKHOLDER’S EQUITY (UNAUDITED)
NINE MONTHS ENDED MARCH 31, 2014
(in thousands, except share data)
| Common Shares |
Common Stock |
Additional Paid-In Capital |
Accumulated Other Comprehensive (Loss)/Income |
Accumulated Deficit |
Note Receivable From CII |
Total Stockholder’s Equity |
||||||||||||||||||||||
| Balance at June 30, 2013 |
1,000 | $ | — | $ | 763,355 | $ | (4,755 | ) | $(152,347) | $ | — | $606,253 | ||||||||||||||||
|
|
|
|
|
|
|
|
|
|
|
|
|
|
|
|||||||||||||||
| Capital contributed (non-cash) |
— | — | 13,077 | — | — | (13,000 | ) | 77 | ||||||||||||||||||||
| Stock-based compensation |
— | — | 362 | — | — | — | 362 | |||||||||||||||||||||
| Foreign currency translation adjustment |
— | — | — | 14,635 | — | — | 14,635 | |||||||||||||||||||||
| Preferred stock issued for Corelink purchase |
— | — | 1,637 | — | — | — | 1,637 | |||||||||||||||||||||
| Net loss |
— | — | — | — | (105,645 | ) | — | (105,645 | ) | |||||||||||||||||||
|
|
|
|
|
|
|
|
|
|
|
|
|
|
|
|||||||||||||||
| Balance at March 31, 2014 |
1,000 | $ | — | $ | 778,431 | $ | 9,880 | $(257,992) | $ | (13,000 | ) | $517,319 | ||||||||||||||||
|
|
|
|
|
|
|
|
|
|
|
|
|
|
|
|||||||||||||||
The accompanying notes are an integral part of these condensed consolidated financial statements.
F-62
Table of Contents
ZAYO GROUP HOLDINGS, INC. AND SUBSIDIARIES
CONDENSED CONSOLIDATED STATEMENTS OF CASH FLOWS (UNAUDITED)
(in thousands)
| Nine months
ended March 31, |
||||||||
| 2013 | 2014 | |||||||
| Cash flows from operating activities |
||||||||
| Net loss |
$ | (113,292 | ) | $ | (105,645 | ) | ||
| Earnings from discontinued operations |
7,488 | 3,655 | ||||||
|
|
|
|
|
|||||
| Loss from continuing operations |
(120,780 | ) | (109,300 | ) | ||||
| Adjustments to reconcile net loss to net cash provided by operating activities of continuing operations |
||||||||
| Depreciation and amortization |
243,880 | 246,922 | ||||||
| Loss on extinguishment of debt |
77,253 | 1,911 | ||||||
| Non-cash interest expense |
18,575 | 14,883 | ||||||
| Stock-based compensation |
67,913 | 165,134 | ||||||
| Amortization of deferred revenue |
(30,703 | ) | (40,605 | ) | ||||
| Additions to deferred revenue |
27,201 | 112,564 | ||||||
| Provision for bad debts |
1,698 | 1,611 | ||||||
| Deferred income taxes |
(32,273 | ) | 27,043 | |||||
| Changes in operating assets and liabilities, net of acquisitions |
||||||||
| Trade receivables |
(8,523 | ) | 24,065 | |||||
| Prepaid expenses |
6,310 | (792 | ) | |||||
| Other assets |
(3,441 | ) | (2,549 | ) | ||||
| Accounts payable and accrued liabilities |
14,994 | (33,115 | ) | |||||
| Payables to related parties, net |
2,496 | 5,630 | ||||||
| Other liabilities |
3,665 | (12,081 | ) | |||||
|
|
|
|
|
|||||
| Net cash provided by operating activities of continuing operations |
268,265 | 401,321 | ||||||
|
|
|
|
|
|||||
| Cash flows from investing activities |
||||||||
| Purchases of property and equipment |
(230,295 | ) | (265,872 | ) | ||||
| Broadband stimulus grants received |
8,967 | — | ||||||
| Acquisition of CoreXchange, LLC |
— | (17,503 | ) | |||||
| Acquisition of Fiberlink, LLC, net of cash acquired |
— | (43,137 | ) | |||||
| Acquisition of Access Communications, Inc., net of cash acquired |
— | (40,068 | ) | |||||
| Corelink, net of cash acquired |
— | (251 | ) | |||||
| Core NAP purchase consideration paid |
— | (50 | ) | |||||
| Acquisition of Abovenet, Inc., net of cash acquired |
(2,210,043 | ) | — | |||||
| Acquisition of FiberGate, net of cash acquired |
(118,335 | ) | — | |||||
| Acquisition of USCarrier Telecom, LLC, net of cash acquired |
(16,092 | ) | — | |||||
| Acquisition of First Telecom Services, LLC, net of cash acquired |
(109,700 | ) | — | |||||
| Acquisition of Litecast/Balticore, LLC, net of cash acquired |
(22,177 | ) | — | |||||
| Arialink purchase consideration returned |
797 | — | ||||||
| Mercury Marquis Holdings, LLC purchase consideration returned |
1,875 | — | ||||||
|
|
|
|
|
|||||
| Net cash used in investing activities of continuing operations |
(2,695,003 | ) | (366,881 | ) | ||||
|
|
|
|
|
|||||
F-63
Table of Contents
ZAYO GROUP HOLDINGS, INC. AND SUBSIDIARIES
CONDENSED CONSOLIDATED STATEMENTS OF CASH FLOWS (UNAUDITED) (CONTINUED)
(in thousands)
| Nine months
ended March 31, |
||||||||
| 2013 | 2014 | |||||||
| Cash flows from financing activities |
||||||||
| Proceeds from issuance of long-term debt |
3,188,048 | 150,000 | ||||||
| Proceeds from revolving credit facility |
— | 45,000 | ||||||
| Payments on revolving credit facility |
— | (45,000 | ) | |||||
| Equity contributions |
342,783 | — | ||||||
| Distribution to Parent |
— | (136 | ) | |||||
| Principal payments on long-term debt |
(1,050,477 | ) | (12,900 | ) | ||||
| Principal repayments on capital lease obligations |
(1,130 | ) | (6,873 | ) | ||||
| Payment of early redemption fees on debt extinguished |
(72,117 | ) | — | |||||
| Payment of debt issuance costs |
(82,972 | ) | (1,695 | ) | ||||
| Change in restricted cash, net |
22,668 | — | ||||||
|
|
|
|
|
|||||
| Net cash provided by financing activities of continuing operations |
2,346,803 | 128,396 | ||||||
|
|
|
|
|
|||||
| Cash flows from continuing operations |
(79,935 | ) | 162,836 | |||||
|
|
|
|
|
|||||
| Cash flows from discontinued operations |
||||||||
| Operating activities |
17,455 | 12,198 | ||||||
| Investing activities |
(3,299 | ) | (4,318 | ) | ||||
| Financing activities |
(8,781 | ) | (4,862 | ) | ||||
|
|
|
|
|
|||||
| Cash flows from discontinued operations |
5,375 | 3,018 | ||||||
|
|
|
|
|
|||||
| Effect of changes in foreign exchange rates on cash |
(581 | ) | 458 | |||||
|
|
|
|
|
|||||
| Net increase/(decrease) in cash and cash equivalents |
(75,141 | ) | 166,312 | |||||
|
|
|
|
|
|||||
| Continuing operations: |
||||||||
| Cash and cash equivalents, beginning of period |
$ | 150,693 | $ | 91,313 | ||||
| Cash flows from continuing operations |
(79,935 | ) | 162,836 | |||||
| Effect of changes in foreign exchange rates on cash |
(581 | ) | 458 | |||||
|
|
|
|
|
|||||
| Cash and cash equivalents, end of period |
$ | 70,177 | $ | 254,607 | ||||
|
|
|
|
|
|||||
| Discontinued operations: |
||||||||
| Cash and cash equivalents, beginning of period |
$ | 7,849 | $ | 15,987 | ||||
| Cash flows from discontinued operations |
5,375 | 3,018 | ||||||
|
|
|
|
|
|||||
| Cash and cash equivalents, end of period |
$ | 13,224 | $ | 19,005 | ||||
|
|
|
|
|
|||||
| Supplemental disclosure of non-cash investing and financing activities: |
||||||||
| Cash paid for interest, net of capitalized interest |
$ | 112,075 | $ | 160,174 | ||||
| Cash paid for income taxes |
1,909 | 2,642 | ||||||
| Non-cash purchases of equipment through capital leasing |
9,809 | 5,642 | ||||||
| (Decrease)/increase in accruals for purchases of property and equipment |
2,642 | (12,056 | ) | |||||
| Intercompany loan to CII |
— | 13,000 | ||||||
Refer to Note 2—Acquisitions for details regarding the Company’s recent acquisitions and Note 3—Spin-off of Business for details regarding the Company’s discontinued operations.
The accompanying notes are an integral part of these condensed consolidated financial statements.
F-64
Table of Contents
ZAYO GROUP HOLDINGS, INC. AND SUBSIDIARIES
NOTES TO THE CONDENSED CONSOLIDATED STATEMENTS (UNAUDITED)
(in thousands)
(1) BUSINESS AND BASIS OF PRESENTATION
Business
Zayo Group Holdings, Inc., a Delaware corporation, was formed on November 13, 2007, and is the parent company of a number of subsidiaries engaged in bandwidth infrastructure services. Zayo Group Holdings, Inc. and its subsidiaries are collectively referred to as “Zayo Group Holdings” or the “Company.” The Company’s primary operating subsidiary is Zayo Group, LLC (“ZGL”). Headquartered in Boulder, Colorado, the Company operates bandwidth infrastructure assets, including fiber networks and data centers, in the United States and Europe to offer:
| • | Physical infrastructure, including dark fiber, mobile infrastructure, and colocation services. |
| • | Lit services, including wavelengths, Ethernet, IP and SONET services. |
| • | Other services, consisting of Zayo Professional Services. |
Zayo Group Holdings is wholly-owned by Communications Infrastructure Investments, LLC (“CII”).
Basis of Presentation
The accompanying condensed consolidated financial statements include all the accounts of the Company and its wholly-owned subsidiaries. All inter-company accounts and transactions have been eliminated in consolidation. The accompanying condensed consolidated financial statements and related notes are unaudited and have been prepared in accordance with accounting principles generally accepted in the United States (“GAAP”) for interim financial reporting and pursuant to the rules and regulations of the Securities and Exchange Commission (the “SEC”) for condensed consolidated interim financial reporting and do not include all of the note disclosures required by GAAP for complete financial statements. These condensed consolidated financial statements should, therefore, be read in conjunction with the consolidated financial statements and notes thereto for the years ended June 30, 2011, 2012 and 2013, respectively, included within this document. In the opinion of management, all adjustments considered necessary for fair presentation of financial position, results of operations and cash flows of the Company have been included herein. The results of operations for the nine month period ended March 31, 2014 are not necessarily indicative of the operating results for any future interim period or the full year.
Unless otherwise noted, dollar amounts and disclosures throughout the notes to the condensed consolidated financial statements relate to the Company’s continuing operations and are presented in thousands of dollars.
The Company’s fiscal year ends June 30 each year, and we refer to the fiscal year ended June 30, 2013 as “Fiscal 2013” and the fiscal year ending June 30, 2014 as “Fiscal 2014.”
Significant Accounting Policies
There have been no changes to the Company’s significant accounting policies described in its annual financial statements included herein that have had a material impact on the Company’s condensed consolidated financial statements and related notes.
Use of Estimates
The preparation of the Company’s consolidated financial statements in conformity with GAAP requires management to make estimates and assumptions that affect the reported amounts of assets and liabilities, and
F-65
Table of Contents
ZAYO GROUP HOLDINGS, INC. AND SUBSIDIARIES
NOTES TO THE CONDENSED CONSOLIDATED STATEMENTS (UNAUDITED) (CONTINUED)
(in thousands)
disclosures of contingent assets and liabilities at the date of the financial statements and the reported amounts of revenue and expense during the reporting period. Significant estimates are used when establishing allowances for doubtful accounts, reserves for disputed line cost billings, determining customer lives used to recognize certain revenues, determining useful lives for depreciation and amortization, determining accruals for exit activities associated with real estate leases, assessing the need for impairment charges (including those related to intangible assets and goodwill), determining the fair values of assets acquired and liabilities assumed in business combinations, accounting for income taxes and related valuation allowances against deferred tax assets and estimating the common units fair values used to compute the stock-based compensation liability. Management evaluates these estimates and judgments on an ongoing basis and makes estimates based on historical experience, current conditions, and various other assumptions that are believed to be reasonable under the circumstances. The results of these estimates form the basis for making judgments about the carrying values of assets and liabilities as well as identifying and assessing the accounting treatment with respect to commitments and contingencies. Actual results may differ from these estimates under different assumptions or conditions.
(2) ACQUISITIONS
As of March 31, 2014, the Company has consummated 29 transactions accounted for as business combinations. The consummation of the acquisitions was executed as part of the Company’s business strategy of expanding through acquisitions. The acquisitions of these businesses have allowed the Company to increase the scale at which it operates, which in turn affords the Company the ability to increase its operating leverage, extend its network reach, and broaden its customer base.
The accompanying condensed consolidated financial statements include the operations of the acquired entities from their respective acquisition dates.
Acquisitions
The Company completed four acquisitions during the first three quarters of Fiscal 2014 with an aggregate purchase price of $102,596. The Company had not yet finalized its purchase accounting related to the acquired assets and assumed liabilities as of March 31, 2014 for the following acquisitions:
Corelink Data Centers, LLC (Corelink”)
On August 1, 2013, the Company entered into an asset purchase agreement to acquire Corelink. The transaction was consummated on the same date, at which time the Company acquired substantially all of the net assets of this business for a purchase price of approximately $1,932, comprised of 301,949 preferred units of CII with an estimated fair value of $1,637 and cash consideration of $344 ($251 net of cash acquired). The acquisition was considered a stock purchase for tax purposes. The purchase price is subject to customary post-closing adjustments. $278 of the purchase price (consisting of 51,310 preferred units) is currently held in escrow pending expiration of the indemnification adjustment period. The cash consideration was paid with cash on hand.
The results of the acquired colocation business are included in the Company’s operating results beginning August 1, 2013.
Access Communications, Inc. (“Access”)
On August 13, 2013, the Company entered into a purchase agreement with Access, a Minnesota corporation, and shareholders of Access, and that acquisition closed on October 1, 2013. The Company acquired 100% of the
F-66
Table of Contents
ZAYO GROUP HOLDINGS, INC. AND SUBSIDIARIES
NOTES TO THE CONDENSED CONSOLIDATED STATEMENTS (UNAUDITED) (CONTINUED)
(in thousands)
equity interest in Access. The acquisition was considered a stock purchase for tax purposes. The purchase price, subject to certain customary post-closing adjustments, was $40,068 and was paid with cash on hand. $4,000 of the purchase price is currently held in escrow pending the expiration of the indemnification adjustment period.
The results of the acquired Access business are included in the Company’s operating results beginning October 1, 2013.
FiberLink, LLC (“FiberLink”)
On October 2, 2013, the Company entered into a purchase agreement with FiberLink, an Illinois limited liability company, and the shareholders of FiberLink. The transaction was consummated on the same date, at which time the Company acquired 100% of the equity interest in FiberLink. The acquisition was considered an asset purchase for tax purposes. The purchase price of $43,137 was primarily paid with available funds drawn on the Company’s revolving credit facility (“the Revolver”).
The results of the acquired FiberLink business are included in the Company’s operating results beginning October 2, 2013.
CoreXchange, Inc. (“CoreXchange”)
On March 4, 2014, the Company entered into a purchase agreement with CoreXchange, a data center, bandwidth and managed services provider in Dallas, Texas. The transaction was consummated on the same date, at which time the Company acquired one new data center operation located at 8600 Harry Hines Blvd. and secured additional square footage in its existing data center for a total purchase price of $17,503, subject to customary post-closing adjustments. The purchase price was paid with cash on hand. $1,775 of the purchase price is currently held in escrow pending the expiration of the indemnification adjustment period.
The results of the acquired CoreXchange business are included in the Company operating results beginning March 4, 2014.
Recently Closed Acquisitions
Geo Networks Limited (“Geo”)
On May 16, 2014, the Company entered into a purchase agreement with Ego Holdings Limited and the shareholders of Geo to acquire all of the outstanding shares of Geo, a London-based dark fiber provider. The transaction was consummated on the same date, at which time the Company acquired 100% of the equity interest in Geo. The purchase price of approximately £175,000 (or $294,288 based on the foreign currency exchange rate on May 16, 2014) was funded with a combination of cash on hand and available funds drawn on the Company’s Revolver.
Neo Telecoms (“Neo”)
On July 1, 2014, the Company acquired a 96% equity interest in Neo, a Paris-based bandwidth infrastructure company. The agreement also includes a contractual mechanism to acquire the remaining approximately 4% equity interest on or after December 31, 2015. The purchase price of €58,000 Euros (or $79,344 based on the exchange rate as of July 1, 2014) was in consideration of acquiring full equity ownership in Neo and is subject to certain adjustments post-closing. The purchase price was paid with cash on hand available from the proceeds of the Sixth Amendment to the Company’s Term Loan Facility (see Note 14—Subsequent Events).
F-67
Table of Contents
ZAYO GROUP HOLDINGS, INC. AND SUBSIDIARIES
NOTES TO THE CONDENSED CONSOLIDATED STATEMENTS (UNAUDITED) (CONTINUED)
(in thousands)
Colo Facilities Atlanta (“AtlantaNAP”)
On July 1, 2014, we acquired AtlantaNAP, a data center and managed services provider in Atlanta, for a purchase price of $52,500 million. The purchase price was paid with cash on hand. The acquisition of AtlantaNAP added over 72,000 square feet of total data center space, including 42,000 square feet of conditioned colocation space.
Acquisition Method Accounting Estimates
The Company has recognized the assets and liabilities acquired from the aforementioned acquisitions based on its preliminary estimates of their acquisition date fair values. The determination of the fair values of the acquired assets and liabilities assumed (and the related determination of estimated lives of depreciable tangible and identifiable intangible assets) require significant judgment. As of March 31, 2014, the Company has not completed its fair value analysis and calculations in sufficient detail necessary to arrive at the final estimates of the fair value of the non-working capital acquired assets and liabilities assumed, including the allocations to property, plant and equipment, goodwill and intangible assets, deferred revenue and resulting deferred taxes related to its acquisitions of Corelink, Access, FiberLink, and CoreXchange. All information presented with respect to non-working capital acquired assets and liabilities assumed as it relates to these acquisitions is preliminary and subject to revision pending the final fair value analysis. As additional information becomes known concerning the acquired net assets, management may make adjustments to the opening balance sheet of the acquired company up to the end of the measurement period, which is no longer than a one year period following the acquisition date. The table below reflects the Company’s estimates of the acquisition date fair values of the assets and liabilities assumed from its Fiscal 2014 acquisitions for which acquisition accounting was finalized during the nine months ended March 31, 2014 or is not yet finalized:
| Acquisition date |
Corelink August 1, 2013 |
Access October 1, 2013 |
Fiberlink October 2, 2013 |
CoreXchange March 4, 2014 |
||||||||||||
| Cash |
$ | 93 | $ | 1,162 | $ | 1 | $ | — | ||||||||
| Other current assets |
521 | 2,248 | 811 | 825 | ||||||||||||
| Property and equipment |
8,993 | 8,401 | 6,105 | 3,009 | ||||||||||||
| Deferred tax assets, net |
— | — | — | — | ||||||||||||
| Intangibles |
— | 16,000 | 17,200 | 10,148 | ||||||||||||
| Goodwill |
55 | 19,426 | 39,370 | 4,473 | ||||||||||||
| Other assets |
545 | — | 144 | 45 | ||||||||||||
|
|
|
|
|
|
|
|
|
|||||||||
| Total assets acquired |
10,207 | 47,237 | 63,631 | 18,500 | ||||||||||||
|
|
|
|
|
|
|
|
|
|||||||||
| Current liabilities |
719 | 953 | 1,290 | 398 | ||||||||||||
| Deferred revenue |
219 | 5,054 | 19,203 | 395 | ||||||||||||
| Other liabilities |
7,287 | — | — | 204 | ||||||||||||
|
|
|
|
|
|
|
|
|
|||||||||
| Total liabilities assumed |
8,225 | 6,007 | 20,493 | 997 | ||||||||||||
|
|
|
|
|
|
|
|
|
|||||||||
| Net assets acquired |
1,982 | 41,230 | 43,138 | 17,503 | ||||||||||||
| Less cash acquired |
(93 | ) | (1,162 | ) | (1 | ) | — | |||||||||
|
|
|
|
|
|
|
|
|
|||||||||
| Net consideration paid |
$ | 1,889 | $ | 40,068 | $ | 43,137 | $ | 17,503 | ||||||||
|
|
|
|
|
|
|
|
|
|||||||||
The goodwill arising from the Company’s acquisitions results from cost synergies, anticipated incremental sales to the acquired company customer base, and economies-of-scale expected from the acquisitions. The
F-68
Table of Contents
ZAYO GROUP HOLDINGS, INC. AND SUBSIDIARIES
NOTES TO THE CONDENSED CONSOLIDATED STATEMENTS (UNAUDITED) (CONTINUED)
(in thousands)
Company has allocated the goodwill to the reporting units (as such reporting units existed on the respective acquisition dates) that were expected to benefit from the acquired goodwill. The allocation was determined based on the excess of the estimated fair value of the reporting unit over the estimated fair value of the individual assets acquired and liabilities assumed that were assigned to the reporting units. Note 4—Goodwill, discloses the preliminary allocation of the Company’s acquired goodwill to each of its reporting units.
In each of the Company’s Fiscal 2014 acquisitions, the Company acquired certain customer relationships. These relationships represent a valuable intangible asset, as the Company anticipates continued business from the acquired customer bases. The Company’s estimate of the fair value of the acquired customer relationships is based on a multi-period excess earnings valuation technique. The Company has not yet finalized the valuation of acquired customer relationships for Corelink, Access, Fiberlink, and CoreXchange. The initial estimate of acquired deferred revenue for the Access and FiberLink acquisitions is being recognized over a weighted average contract term of 20.0 years.
Adjustments to Purchase Accounting Estimates Associated with Prior Year Acquisitions
Escrow Claim Settlement
During the second quarter of Fiscal 2014, the Company settled its outstanding escrow claim with the sellers of 360networks Holdings (USA), Inc. (“360networks”) and received a one-time payment of $5,042 as full and final settlement. $1,261 of the settlement was transferred to Onvoy, Inc. (“OVS”) for customer billing disputes related to its acquired VOIP 360, Inc. business. The remaining $3,781 was recognized as a reduction in “Selling, general and administrative expenses” in the accompanying condensed consolidated statement of operations for the nine months ended March 31, 2014 since the measurement period had closed for the 360networks acquisition at the time of settlement.
Transaction Costs
Transaction costs include expenses associated with professional services (i.e., legal, accounting, regulatory, etc.) rendered in connection with signed and/or closed acquisitions, travel expense, severance expense incurred on the date of acquisition, and other direct expenses incurred that are associated with such acquisitions. The Company incurred transaction costs of $13,089 and $789 during the nine months ended March 31, 2013 and 2014, respectively. Transaction costs have been included in selling, general and administrative expenses during these periods in the consolidated statements of operations and in cash flows from operating activities in the consolidated statements of cash flows.
Pro-forma Financial Information
The unaudited pro forma results presented below include the effects of the Company’s Fiscal 2013 acquisitions of AboveNet, Fibergate, USCarrier, First Telecom, Litecast, and Core NAP and Fiscal 2014 acquisitions of Corelink, Access, FiberLink, and CoreXchange as if the acquisitions occurred on July 1, 2012. The pro forma loss for the quarters ended March 31, 2013 and 2014 includes the additional depreciation and amortization resulting from the adjustments to the value of property and equipment and intangible assets resulting from purchase accounting and adjustments to amortized revenue during Fiscal 2013 and Fiscal 2014 as a result of the acquisition date valuation of assumed deferred revenue. The pro forma results also include interest expense associated with debt used to fund the acquisitions. The pro forma results do not include any anticipated cost synergies or other expected benefits of the acquisitions. The unaudited pro forma financial information
F-69
Table of Contents
ZAYO GROUP HOLDINGS, INC. AND SUBSIDIARIES
NOTES TO THE CONDENSED CONSOLIDATED STATEMENTS (UNAUDITED) (CONTINUED)
(in thousands)
below is not necessarily indicative of either future results of operations or results that might have been achieved had the acquisitions been consummated as of July 1, 2012.
| Nine months ended March 31, | ||||||||
| 2013 | 2014 | |||||||
| Revenue |
$ | 793,521 | $ | 835,311 | ||||
| Loss from continuing operations |
$ | (109,216 | ) | $ | (108,201 | ) | ||
(3) SPIN-OFF OF BUSINESS
In connection with certain business combinations, the Company may acquire assets or liabilities that support products outside of the Company’s primary focus of providing bandwidth infrastructure services.
On June 13, 2014, the Company completed a spin-off of Onvoy, LLC, a business unit that provides voice and managed services. The Company distributed all of the assets and liabilities of OVS on the spin-off date to CII.
The Company continues to have ongoing contractual relationships with OVS to provide OVS and its subsidiaries with bandwidth capacity. The contractual relationships are based on agreements that were entered into at estimated market rates. During the nine months ended March 31, 2013 and 2014, transactions with OVS were eliminated upon consolidation. Subsequent to the spin-off date, transactions with OVS will be included in the Company’s results of operations.
The Company determined all significant cash flows and continuing involvement associated with the operations of OVS were discontinued. The results of operations of OVS are reported as discontinued operations in the accompanying consolidated financial statements for all periods presented and are presented net of intercompany eliminations.
Earnings from discontinued operations, net of income taxes in the accompanying consolidated statements of operations are comprised of the following:
| Nine months ended March 31, | ||||||||
| 2013 | 2014 | |||||||
| Revenues |
$ | 59,950 | $ | 60,046 | ||||
|
|
|
|
|
|||||
| Earnings before income taxes |
$ | 13,382 | $ | 9,953 | ||||
| Income tax expense |
5,894 | 6,298 | ||||||
|
|
|
|
|
|||||
| Earnings from discontinued operations, net of income taxes |
$ | 7,488 | $ | 3,655 | ||||
|
|
|
|
|
|||||
(4) GOODWILL
The Company’s goodwill balance was $688,836 and $756,715 as of June 30, 2013 and March 31, 2014, respectively.
F-70
Table of Contents
ZAYO GROUP HOLDINGS, INC. AND SUBSIDIARIES
NOTES TO THE CONDENSED CONSOLIDATED STATEMENTS (UNAUDITED) (CONTINUED)
(in thousands)
The Company’s reporting units are comprised of its Strategic Product Groups (“SPGs”): Zayo Dark Fiber (“Dark Fiber”), Zayo Wavelength Services (“Waves”), Zayo SONET Services (“SONET”), Zayo Ethernet Services (“Ethernet”), Zayo IP Services (“IP”), Zayo Mobile Infrastructure Group (“MIG”), Zayo Colocation (“zColo”), and Zayo Professional Services (“ZPS”). The following table reflects the allocation of goodwill acquired in the Company’s Fiscal 2013 and 2014 acquisitions to the Company’s reporting units (in thousands):
| Dark Fiber | Waves | SONET | Ethernet | IP | MIG | zColo | ZPS | Total | ||||||||||||||||||||||||||||
| As of June 30, 2013 |
$ | 193,315 | $ | 215,865 | $ | 50,285 | $ | 91,707 | $ | 80,073 | $ | 38,313 | $ | 11,975 | $ | 7,303 | $ | 688,836 | ||||||||||||||||||
| Additions: |
||||||||||||||||||||||||||||||||||||
| Corelink |
— | — | — | — | — | — | 55 | — | 55 | |||||||||||||||||||||||||||
| Access |
10,971 | — | — | 3,945 | 107 | 4,403 | — | — | 19,426 | |||||||||||||||||||||||||||
| Fiberlink |
39,370 | — | — | — | — | — | — | — | 39,370 | |||||||||||||||||||||||||||
| CoreXchange |
— | — | — | — | — | — | 4,473 | — | 4,473 | |||||||||||||||||||||||||||
| Foreign currency translation |
3,498 | 458 | — | 123 | 177 | — | 299 | — | 4,555 | |||||||||||||||||||||||||||
|
|
|
|
|
|
|
|
|
|
|
|
|
|
|
|
|
|
|
|||||||||||||||||||
| As of March 31, 2014 |
$ | 247,154 | $ | 216,323 | $ | 50,285 | $ | 95,775 | $ | 80,357 | $ | 42,716 | $ | 16,802 | $ | 7,303 | $ | 756,715 | ||||||||||||||||||
|
|
|
|
|
|
|
|
|
|
|
|
|
|
|
|
|
|
|
|||||||||||||||||||
Additions to goodwill during the nine months ended March 31, 2014 primarily relate to the acquisitions of Access, Fiberlink, and CoreXchange (see Note 2—Acquisitions).
During the nine months ended March 31, 2014, goodwill increased by $4,555 due to foreign currency movements impacting goodwill allocated to the U.K. operations.
F-71
Table of Contents
ZAYO GROUP HOLDINGS, INC. AND SUBSIDIARIES
NOTES TO THE CONDENSED CONSOLIDATED STATEMENTS (UNAUDITED) (CONTINUED)
(in thousands)
(5) INTANGIBLE ASSETS
Identifiable acquisition-related intangible assets as of June 30, 2013 and March 31, 2014 were as follows:
| Gross Carrying Amount |
Accumulated Amortization |
Net | ||||||||||
| June 30, 2013 |
||||||||||||
| Finite-Lived Intangible Assets |
||||||||||||
| Customer relationships |
$ | 721,659 | $ | (86,407 | ) | $ | 635,252 | |||||
| Trade names |
1,179 | (590 | ) | 589 | ||||||||
| Underlying rights |
1,075 | (54 | ) | 1,021 | ||||||||
|
|
|
|
|
|
|
|||||||
| 723,913 | (87,051 | ) | 636,862 | |||||||||
| Indefinite-Lived Intangible Assets |
||||||||||||
| Certifications |
3,488 | — | 3,488 | |||||||||
|
|
|
|
|
|
|
|||||||
| Total |
$ | 727,401 | $ | (87,051 | ) | $ | 640,350 | |||||
|
|
|
|
|
|
|
|||||||
| March 31, 2014 |
||||||||||||
| Finite-Lived Intangible Assets |
||||||||||||
| Customer relationships |
$ | 742,979 | $ | (93,623 | ) | $ | 649,356 | |||||
| Trade names |
1,179 | (1,032 | ) | 147 | ||||||||
| Underlying rights |
1,075 | (95 | ) | 980 | ||||||||
|
|
|
|
|
|
|
|||||||
| 745,233 | (94,750 | ) | 650,483 | |||||||||
| Indefinite-Lived Intangible Assets |
||||||||||||
| Certifications |
3,488 | — | 3,488 | |||||||||
|
|
|
|
|
|
|
|||||||
| Total |
$ | 748,721 | $ | (94,750 | ) | $ | 653,971 | |||||
|
|
|
|
|
|
|
|||||||
(6) LONG-TERM DEBT
As of March 31, 2014 and June 30, 2013, long-term debt was as follows:
| (dollars in thousands) |
June 30, 2013 |
March 31, 2014 |
||||||
| Term Loan Facility |
$ | 1,603,800 | $ | 1,740,900 | ||||
| 8.125% Senior Secured First Priority Notes due 2020 |
750,000 | 750,000 | ||||||
| 10.125% Senior Unsecured Notes due 2020 |
500,000 | 500,000 | ||||||
| Capital leases |
13,167 | 19,531 | ||||||
|
|
|
|
|
|||||
| Total debt obligations |
2,866,967 | 3,010,431 | ||||||
| Discount on Senior Secured Term Loan |
(23,095 | ) | (20,189 | ) | ||||
|
|
|
|
|
|||||
| Total unamortized discount |
(23,095 | ) | (20,189 | ) | ||||
|
|
|
|
|
|||||
| Carrying value of debt |
2,843,872 | 2,990,242 | ||||||
| Less current portion (including capital leases) |
(22,800 | ) | (20,750 | ) | ||||
|
|
|
|
|
|||||
| Long-term Debt, less current portion |
$ | 2,821,072 | $ | 2,969,492 | ||||
|
|
|
|
|
|||||
F-72
Table of Contents
ZAYO GROUP HOLDINGS, INC. AND SUBSIDIARIES
NOTES TO THE CONDENSED CONSOLIDATED STATEMENTS (UNAUDITED) (CONTINUED)
(in thousands)
As of March 31, 2014, the balances of the Company’s $750,000 Senior Secured Notes and $500,000 Senior Unsecured Notes (collectively the “Notes”) and term loan facility (the “Term Loan Facility”) were $1,250,000 and $1,720,711 (net of an unamortized discount of $20,189), respectively, and no amounts were outstanding under the Company’s Revolver. As of June 30, 2013, the balances of the Notes and Term Loan Facility were $1,250,000 and $1,580,705 (net of unamortized discount of $23,095), respectively, and no amounts were outstanding under the Revolver. During the nine months ended March 31, 2014, the Company drew $45,000 under the Revolver primarily in connection with the FiberLink acquisition and repaid the outstanding balance during the second quarter of Fiscal 2014.
As of March 31, 2014, standby letters of credit were outstanding in the amount of $6,428, leaving $243,572 available under the Revolver. Outstanding letters of credit backed by the Revolver accrue interest at a rate ranging from LIBOR plus 2% to 3% per annum based upon the Company’s leverage ratio.
On November 26, 2013, Zayo Group, LLC (“ZGL”) and Zayo Capital, Inc. (“Zayo Capital”) entered into a Fifth Amendment (the “Fifth Amendment”) to the Company’s Credit Agreement. Under the terms of the Fifth Amendment, effective November 26, 2013, the Term Loan Facility was increased by $150,000 to $1,749,750, and the interest rate was adjusted to LIBOR plus 3.00% with a minimum LIBOR rate of 1.00%. The amended terms represented a downward adjustment of 50 basis points on the interest rate from the Fourth Amendment. The interest rate on the Revolver was amended to LIBOR plus 2.75% (based on the Company’s current leverage ratio), which represented a downward adjustment of 25 basis points on the interest rate from the Fourth Amendment. In connection with the Fifth Amendment, the Company did not incur a re-pricing premium.
Also, in connection with the Fifth Amendment, the Company recognized an expense during the second quarter of Fiscal 2014 of $1,911 associated with debt extinguishment costs, including cash expense of $955 related to third party costs and non-cash expense of $956 associated with the write-off of the Company’s unamortized debt issuance costs and discount on the Term Loan Facility accounted for as an extinguishment. The Company also incurred an additional $1,512 in debt issuance costs.
The interest rates in effect on the Term Loan Facility as of March 31, 2014 and June 30, 2013 were 4.00% and 4.50%, respectively. The interest rates in effect on the Revolver as of March 31, 2014 and June 30, 2013 were 3.00% and 3.27%, respectively.
ZGL was in compliance with all covenants associated with its debt agreements as of June 30, 2013 and March 31, 2014.
Debt issuance costs
In connection with the Notes offering, Revolver and Term Loan Facility and the subsequent amendments thereto, the Company incurred debt issuance costs of $117,805. These costs are being amortized to interest expense over the respective terms of the underlying debt instruments using the effective interest method, unless extinguished earlier, at which time the related unamortized costs are to be immediately expensed.
The balance of debt issuance costs as of June 30, 2013 and March 31, 2014 was $99,098 and $89,793, net of accumulated amortization of $11,482 and $21,807, respectively. The amortization of debt issuance costs is included on the condensed consolidated statements of cash flows within the caption “Non-cash interest expense” along with the amortization or accretion of the premium and discount on the Company’s indebtedness and changes in the fair value of the Company’s interest rate derivatives. Interest expense associated with the amortization of debt issuance costs was $10,247 and $10,308 during the nine months ended March 31, 2013 and 2014, respectively.
F-73
Table of Contents
ZAYO GROUP HOLDINGS, INC. AND SUBSIDIARIES
NOTES TO THE CONDENSED CONSOLIDATED STATEMENTS (UNAUDITED) (CONTINUED)
(in thousands)
Interest rate derivatives
On August 13, 2012, the Company entered into interest rate swap agreements with an aggregate notional value of $750,000 and a maturity date of June 30, 2017. There were no up-front fees for these agreements. The contract states that the Company pays a 1.67% fixed rate of interest for the term of the agreement, beginning June 30, 2013. The counterparties pay to the Company the greater of actual LIBOR or 1.25%. The Company entered into the swap arrangements to reduce the risk of increased interest costs associated with potential changes in LIBOR rates.
Changes in the fair value of interest rate swaps are recorded as an increase or decrease in interest expense in the consolidated statements of operations for the applicable period. During the nine months ended March 31, 2013 and 2014, respectively, $5,103 and $1,935 and was recorded as an increase in interest expense for the change in the fair value of the interest rate swaps. The fair value of the interest rate swaps of $2,642 and $707 is included in “Other long term assets” in the Company’s consolidated balance sheet as of June 30, 2013 and March 31, 2014, respectively.
(7) INCOME TAXES
The Company’s effective income tax rate differs from what would be expected if the federal statutory rate were applied to earnings before income taxes primarily because of certain expenses that represent permanent differences between book and tax expenses and deductions, such as stock-based compensation expense, that are recorded as an expense for financial reporting purposes but are not deductible for tax purposes.
Reconciliations of the actual income tax provision and the tax computed by applying the U.S. federal rate to the earnings before income taxes during the three-and nine-month periods ended March 31, 2013 and 2014 are as follows:
| For the nine months ended March 31, |
||||||||
| 2013 | 2014 | |||||||
| Expected benefit at statutory rate |
$ | (54,021 | ) | $ | (28,559 | ) | ||
| Increase due to: |
||||||||
| Non-deductible stock-based compensation |
22,968 | 62,554 | ||||||
| State income taxes provision/(benefit), net of federal benefit |
(4,942 | ) | (3,928 | ) | ||||
| Transaction costs not deductible for tax purposes |
970 | 201 | ||||||
| Foreign tax rate differential |
(1,096 | ) | (62 | ) | ||||
| Provision to return adjustment |
— | (514 | ) | |||||
| Release of accrual for uncertain tax position |
— | (2,600 | ) | |||||
| Other, net |
2,572 | 110 | ||||||
|
|
|
|
|
|||||
| Provision/(benefit) for income taxes |
$ | (33,549 | ) | $ | 27,202 | |||
|
|
|
|
|
|||||
Each interim period, management estimates the annual effective tax rate and applies that rate to its reported year-to-date earnings. The tax expense or benefit related to items for which management is unable to make reliable estimates or that are significant, unusual, or extraordinary items that will be separately reported, or reported net of their related tax effect, are individually computed and are recognized in the interim period in which those items occur. In addition, the effect of changes in enacted tax laws, tax rates or tax status is recognized in the interim period in which the change occurs.
F-74
Table of Contents
ZAYO GROUP HOLDINGS, INC. AND SUBSIDIARIES
NOTES TO THE CONDENSED CONSOLIDATED STATEMENTS (UNAUDITED) (CONTINUED)
(in thousands)
The computation of the annual estimated effective tax rate at each interim period requires certain estimates and significant judgments, including but not limited to the expected operating income for the year, projections of the proportion of income earned and taxed in various jurisdictions, permanent differences, and the likelihood of realizing deferred tax assets generated in both the current year and prior years. The accounting estimates used to compute the interim provision for income taxes may change as new events occur, more experience is acquired, additional information is obtained, or the tax environment changes. The effective tax rate is significantly affected by the amount of non-deductible stock-based compensation recognized during the year and given the significant assumptions inherent in the determination of this item, management is not able to reliably estimate the annual amount expected to impact the effective tax rate. As such, the tax effect of non-deductible stock-based compensation is recognized in each interim period in which the stock-based compensation is recorded.
Release of Accrual for Uncertain Tax Position
During the nine months ended March 31, 2014, the Company released a tax contingency of $2,600 related to an uncertain tax position previously recognized in connection with the Fibernet acquisition upon settlement of the matter with the Internal Revenue Service (“IRS”). The uncertain tax position was associated with a deduction taken for Fibernet accelerated vesting of restricted stock units. This reduced the Company’s estimated effective tax rate for the nine months ended March 31, 2014. The remaining tax contingency was written off as a reduction in deferred tax assets associated with the Company’s net operating loss carryforwards.
(8) EQUITY
As discussed in Note 2—Acquisitions, CII issued 301,949 preferred units with an estimated fair value of $1,637 in connection with the Corelink acquisition during the first quarter of Fiscal 2014. $278 of the purchase price (consisting of 51,310 preferred units) is currently held in escrow pending expiration of the adjustment period.
As discussed in Note 9—Stock-Based Compensation, during the quarter ended December 31, 2013, the Board of CII authorized a non-liquidating distribution to certain common unit holders of up to $10,000 and advanced $10,000 to CII, evidenced by an intercompany note receivable. During the quarter ended March 31, 2014, the Board of CII authorized and paid a non-liquidating distribution to the Company’s CEO for $3,000 and amended the intercompany note receivable with CII for the incremental distribution. The amount due from CII is reflected as a reduction of stockholder’s equity as of March 31, 2014.
(9) STOCK-BASED COMPENSATION
Liability Classified Awards
The Company has been given authorization by CII to award 625,000,000 of CII’s common units as profits interests to employees, directors, and affiliates of the Company.
As of March 31, 2014, CII had ten classes of common units with different liquidation preferences: Class A through Class J units. Common units are issued to employees and to independent directors of the Company and are allocated by the Chief Executive Officer and the board of managers on the terms and conditions specified in the employee equity agreement. The common units do not have voting rights. During the three months ended March 31, 2014, the Company issued 60,000,009 Class J common units to its employees and independent directors. During the three months ended September 30, 2013, the Company issued 598,822 Class H common units to its independent directors and 45,767,059 Class I common units to its employees and independent
F-75
Table of Contents
ZAYO GROUP HOLDINGS, INC. AND SUBSIDIARIES
NOTES TO THE CONDENSED CONSOLIDATED STATEMENTS (UNAUDITED) (CONTINUED)
(in thousands)
directors. At March 31, 2014, 565,157,439 common units of CII were issued and outstanding to employees, directors, and affiliates of the Company and 59,842,561 common units of CII were available to be issued. As of March 31, 2014, CII has a separate class of common units of CII issued to employees of ZPS: ZPS Class A. At June 30, 2013 and March 31, 2014, ZPS Class A common units of 8,660,000 and 18,710,000 were issued and outstanding to employees of ZPS, with no units available to be issued.
The common units are considered to be stock-based compensation with terms that require the awards to be classified as liabilities due to cash settlement features. As such, the Company accounts for the vested awards as a liability and re-measures the liability to fair value at each reporting date until the date of settlement.
As of June 30, 2013 and March 31, 2014, the estimated fair value of the common units was as follows:
| As of | ||||||||
| Common Unit Class |
June 30, 2013 | March 31, 2014 | ||||||
| (estimated per unit value) | ||||||||
| Class A |
$ | 1.50 | $ | 2.17 | ||||
| Class B |
1.34 | 1.93 | ||||||
| Class C |
1.14 | 1.65 | ||||||
| Class D |
1.10 | 1.60 | ||||||
| Class E |
0.95 | 1.38 | ||||||
| Class F |
0.75 | 1.22 | ||||||
| Class G |
0.46 | 0.65 | ||||||
| Class H |
0.38 | 0.53 | ||||||
| Class I |
n/a | 0.31 | ||||||
| Class J |
n/a | 0.22 | ||||||
| ZPS Class A |
0.20 | 0.20 | ||||||
The liability associated with the common units issued to employees and directors of the Company was $159,320 and $312,489 as of June 30, 2013 and March 31, 2014, respectively. As of March 31, 2014, common units with an estimated fair value of $133,796 were unvested. The fair value of the unvested common units will be recognized as stock-based compensation expense over the next three to four years.
The stock-based compensation expense associated with the common units was $67,270 and $164,772 during the nine months ended March 31, 2013 and 2014, respectively.
The Company’s stock-based compensation relates to employees functioning in a selling, general and administrative capacity. The Company presents stock-based compensation as a separate component of selling, general and administrative expenses on the consolidated statement of operations due to the size and volatility of the non-cash expense.
The holders of common units of CII are not entitled to transfer their units or receive dividends or distributions, except at the discretion of CII’s Board of Directors. Upon a liquidation of CII, or upon a non-liquidating distribution, the holders of common units share in the proceeds after the capital contributions of the CII preferred unit holders plus their priority return of 6% per annum has been reimbursed. The remaining proceeds from a liquidation event are distributed between the preferred and common unit holders on a scale ranging from 85% to the preferred unit holders and 15% to the common unit holders to 80% to the preferred unit holders and 20% to the common unit holders. The percentage allocated to the common unit holders is dependent upon the return multiple realized by the preferred unit holders as defined in the CII operating agreement. The
F-76
Table of Contents
ZAYO GROUP HOLDINGS, INC. AND SUBSIDIARIES
NOTES TO THE CONDENSED CONSOLIDATED STATEMENTS (UNAUDITED) (CONTINUED)
(in thousands)
maximum incremental allocation of proceeds from a liquidation event to common unit holders, of 20%, occurs if the return multiple realized by a preferred unit holder reaches 3.5 times each respective preferred holder’s combined capital contributions.
Each class of common units has a liquidation threshold. Holders of a respective class of common units begin to receive a portion of the proceeds from a liquidity event once the aggregate distributions previously made with respect to issued common units of earlier classes are equal to or greater than the liquidation threshold of the respective common unit class. Common unit holders of each of the following classes begin sharing in the proceeds of a liquidation event once the total amount distributed to earlier classes reaches the following liquidation thresholds:
| Common Unit Class |
Liquidation Threshold | |||
| Class A |
$ | — | ||
| Class B |
15,000 | |||
| Class C |
40,000 | |||
| Class D |
45,000 | |||
| Class E |
75,000 | |||
| Class F |
95,000 | |||
| Class G |
235,000 | |||
| Class H |
290,000 | |||
| Class I |
435,000 | |||
| Class J |
515,000 | |||
Equity Classified Awards
CII has issued preferred units to certain Zayo Group executives and independent directors as compensation. The terms of these preferred unit awards require the Company to record the award as an equity award. The Company estimates the fair value of these equity awards on the grant date and recognizes the related expense over the vesting period of the awards. As these awards have been issued by CII to employees and directors of the Company as compensation, the related expense has been recorded by the Company in the accompanying consolidated statements of operations. On July 1, 2013, 70,193 preferred unit awards were granted to the Company’s independent directors with an estimated grant date fair value of $380, which vest over a period of three years. The Company recognized stock-based compensation expense and a related increase to the Company’s member’s interest account of $643 and $362 for the nine months ended March 31, 2013 and 2014, respectively.
Non-Liquidating Distribution to Chief Executive Officer and Common Unit Holders
In February 2014, the Board of CII approved an advance distribution of cash to the Company’s Chief Executive Officer, Dan Caruso, in respect of his common units in the amount of $3,000 pursuant to a new compensation agreement. This advance distribution was funded by the Company through a $3,000 advance to CII, which paid the distribution to Mr. Caruso, with a corresponding reduction in the stock-based compensation liability as the associated expense for Mr. Caruso’s common unit grants was previously recognized. The advance was evidenced by a note receivable from CII.
In September 2013, the Board of CII authorized a non-liquidating cash distribution to certain common unit holders of up to $10,000. The eligibility for receiving proceeds from this distribution was determined by the liquidation preference of the unit holder. Receiving proceeds from the authorized distribution was at the election
F-77
Table of Contents
ZAYO GROUP HOLDINGS, INC. AND SUBSIDIARIES
NOTES TO THE CONDENSED CONSOLIDATED STATEMENTS (UNAUDITED) (CONTINUED)
(in thousands)
of the common unit holder. As a condition of the early distribution, common unit holders electing to receive an early distribution received 90% of the amount that they would otherwise be entitled to receive if the distribution were in connection with a liquidating distribution. The common unit holders electing to receive the early distribution retained all of their common units and are entitled to receive future distributions only to the extent such future distributions are in excess of the non-liquidating distribution, before applying the 10% discount. During the second quarter of Fiscal 2014, $8,797 was distributed to CII’s common unit holders as a result of the non-liquidating distributions, with a corresponding reduction in the stock-based compensation liability as the associated expense for the common unit grants was previously recognized. The distribution was funded by the Company through a $10,000 advance to CII, evidenced by a note receivable. The amount distributed in excess of the amounts distributed to the employees is reflected as a distribution of $1,203 in the consolidated statement of shareholder’s equity as “Distribution to Parent” during the nine months ended March 31, 2014. Common unit holders electing to receive the early distribution forfeited $977 in previously recognized stock-based compensation, which had the effect of reducing stock-based compensation expense recognized during the second quarter of Fiscal 2014.
(10) FAIR VALUE MEASUREMENTS
The Company’s financial instruments consist of cash and cash equivalents, restricted cash, trade receivables, accounts payable, interest rate swaps, long-term debt and stock-based compensation liability. The carrying values of cash and cash equivalents, restricted cash, trade receivables, and accounts payable approximated their fair values at June 30, 2013 and March 31, 2014 due to the short maturity of these instruments.
The carrying value of the Company’s note obligations reflects the original amounts borrowed and was $1,250,000 as of June 30, 2013 and March 31, 2014. Based on market interest rates for debt of similar terms and average maturities, the fair value of the Company’s notes as of June 30, 2013 and March 31, 2014 was estimated to be $1,364,375 and $1,298,600, respectively. The Company’s fair value estimates associated with its note obligations were derived utilizing Level 2 inputs—quoted prices for similar instruments in active markets.
The carrying value of the Company’s term loan obligations reflects the original amounts borrowed, net of the unamortized discount and was $1,580,705 and $1,720,711 as of June 30, 2013 and March 31, 2014, respectively. The Company’s term loan accrues interest at variable rates based upon the one month, three month or six month LIBOR (with a LIBOR floor of 1.00%) plus a spread of 3.00%. Since management does not believe that the Company’s credit quality has changed significantly since the date when the amended Term Loan Facility was entered into in November 2013, its carrying amount approximates fair value. Excluding any offsetting effect of the Company’s interest rate swaps, a hypothetical increase in the applicable interest rate on the Company’s term loan of one percentage point above the 1.0% LIBOR floor would increase the Company’s annual interest expense by approximately $17,409.
The Company’s interest rate swaps are valued using discounted cash flow techniques that use observable market inputs, such as LIBOR-based yield curves, forward rates, and credit ratings. Changes in the fair value of the interest rate swaps of $5,103 and $1,935 were recorded as an increase to interest expense during the nine months ended March 31, 2013 and 2014, respectively. A hypothetical increase in LIBOR rates of 100 basis points would increase the fair value of the interest rate swaps by approximately $19,621.
F-78
Table of Contents
ZAYO GROUP HOLDINGS, INC. AND SUBSIDIARIES
NOTES TO THE CONDENSED CONSOLIDATED STATEMENTS (UNAUDITED) (CONTINUED)
(in thousands)
The Company records its stock-based compensation liability at its estimated fair value. Financial instruments measured at fair value on a recurring basis are summarized below:
| Level | June 30, 2013 | March 31, 2014 | ||||||||||
| Assets Recorded at Fair Value in the Financial Statements: |
||||||||||||
| Interest rate swap |
Level 2 | $ | 2,642 | $ | 707 | |||||||
| Liabilities Recorded at Fair Value in the Financial Statements: |
||||||||||||
| Stock-based compensation liability |
Level 3 | $ | 159,320 | $ | 312,489 | |||||||
(11) COMMITMENTS AND CONTINGENCIES
Purchase commitments
At March 31, 2014, the Company was contractually committed for $114,982 of capital expenditures for construction materials and purchases of property and equipment. A majority of these purchase commitments are expected to be satisfied in the next twelve months. These purchase commitments are primarily success based; that is, the Company has executed customer contracts that support the future capital expenditures.
Contingencies
In the normal course of business, the Company is party to various outstanding legal proceedings, asserted and unasserted claims, and carrier disputes. In the opinion of management, the ultimate disposition of these matters, both asserted and unasserted, will not have a material adverse effect on the Company’s financial condition, results of operations, or cash flows.
(12) RELATED PARTY TRANSACTIONS
As discussed in Note 3—Spin-off of Business, the Company spun-off the Onvoy business to CII on June 13, 2014.
Dan Caruso, the Company’s Chief Executive Officer, is a party to an aircraft charter (or membership) agreement through his affiliate, Bear Equity LLC, for business and personal travel. Under the terms of the charter agreement, all fees for the use of the aircraft are effectively variable in nature. For his business travel on behalf of the Company, Mr. Caruso is reimbursed for his use of the aircraft subject to quarterly and annual maximum reimbursement thresholds approved by the Company’s Nominating and Governance Committee. During the nine months ended March 31, 2014, the Company reimbursed Mr. Caruso $143 for his business use of the aircraft.
(13) SEGMENT REPORTING
The Company uses the management approach to determine the segment financial information that should be disaggregated and presented separately in the Company’s notes to its financial statements. The management approach is based on the manner by which management has organized the segments within the Company for making operating decisions, allocating resources, and assessing performance. The Company evaluates performance and makes decisions about allocating resources to its operating segments based on financial measures such as revenue and adjusted EBITDA (as defined below).
The Company’s eight SPGs are organized into three reportable segments based on the similarities of business activities: Physical Infrastructure, Lit Services, and Other. The Physical Infrastructure reporting segment is comprised of the following SPGs: Zayo Dark Fiber (“Dark Fiber”), Zayo Mobile Infrastructure Group (“MIG”), and Zayo Colocation (“zColo”). The Lit Services reporting segment is comprised of the following SPGs: Zayo Wavelength Services (“Waves”), Zayo SONET
F-79
Table of Contents
ZAYO GROUP HOLDINGS, INC. AND SUBSIDIARIES
NOTES TO THE CONDENSED CONSOLIDATED STATEMENTS (UNAUDITED) (CONTINUED)
(in thousands)
Services (“SONET”), Zayo Ethernet Services (“Ethernet”), and Zayo Internet Protocol Services (“IP”). The Other reporting segment is comprised of Zayo Professional Services (“ZPS”). SPGs report directly to the segment managers who are responsible for the operations and financial results for the Physical Infrastructure, Lit Services and Other reportable segments. The segment managers for each of the Physical Infrastructure, Lit Services and Other reportable segments report directly to the CODM, and it is the financial results of those segments that are evaluated and drive the resource allocation decisions.
As of March 31, 2014, the Company has three reportable segments as described below:
| • | Physical Infrastructure. Through the Physical Infrastructure segment, the Company provides raw bandwidth infrastructure to customers that require more control of their internal networks. These services include dark fiber, mobile infrastructure (fiber-to-the-tower and small cell), and colocation and interconnection. Dark fiber is a physically separate and secure, private platform for dedicated bandwidth. The Company leases dark fiber pairs (usually two to 12 total fibers) to its customers, who “light” the fiber using their own optronics. The Company’s mobile infrastructure services provide direct fiber connections to cell towers, small cells, hub sites, and mobile switching centers. The Company’s datacenters offer colocation and interconnection services to its customers, who then house and power the Company’s computing and networking equipment for the purpose of aggregating and distributing data, voice, Internet, and video traffic. Physical Infrastructure customers include carriers and other communication service providers, Internet service providers, wireless service providers, major media and content companies, large enterprises, and other companies that have the expertise to run their own fiber optic networks or require interconnected technical space. The contract terms in the Physical Infrastructure segment generally tend to range from three to twenty years. |
| • | Lit Services. The Lit Services segment provides bandwidth infrastructure solutions over the Company’s metro, regional, and long-haul fiber networks where it uses optronics to light the fiber and the Company’s customers pay for access based on the amount and type of bandwidth they purchase. The Company’s lit services include wavelength, Ethernet, IP, and SONET services with capacity ranging from 1.54Mb to 100G. The Company target customers who require a minimum of 10G of bandwidth across their networks. Lit Services customers include carriers, financial services companies, healthcare, government institutions, education institutions and other enterprises. The contract terms in this segment tend to range from two to five years. |
| • | Other. The Other segment is comprised of the ZPS SPG, which provides network and technical resources to customers in designing, acquiring and maintaining their networks. Services are typically provided for a term of one year for a fixed recurring monthly fee in the case of network and on an hourly basis for technical resources (usage revenue). |
Revenues for all of the Company’s products are included in one of the Company’s three reportable segments. The results of operations for each reportable segment include an allocation of certain indirect costs and corporate related costs, including overhead and third party-financed debt. The allocation is based on a percentage that represents management’s estimate of the relative burden each segment bears of indirect and corporate costs. Management has evaluated the allocation methods utilized to allocate these costs and determined they are systematic and rational. Identifiable assets for each reportable segment are reconciled to total consolidated assets including unallocated corporate assets and intersegment eliminations. Unallocated corporate assets consist primarily of cash and deferred tax assets.
F-80
Table of Contents
ZAYO GROUP HOLDINGS, INC. AND SUBSIDIARIES
NOTES TO THE CONDENSED CONSOLIDATED STATEMENTS (UNAUDITED) (CONTINUED)
(in thousands)
Segment Adjusted EBITDA
Segment Adjusted EBITDA is the primary measure used by the Company’s CODM to evaluate segment operating performance.
The Company defines Segment Adjusted EBITDA as earnings from continuing operations before interest, income taxes, depreciation and amortization (“EBITDA”) adjusted to exclude acquisition-related transaction costs, losses on extinguishment of debt, stock-based compensation, unrealized foreign currency translation gains on an intercompany loan, and impairment of cost method investment. The Company uses Segment Adjusted EBITDA to evaluate operating performance, and this financial measure is among the primary measures used by management for planning and forecasting future periods. The Company believes that the presentation of Segment Adjusted EBITDA is relevant and useful for investors because it allows investors to view results in a manner similar to the method used by management and facilitates comparison of the Company’s results with the results of other companies that have different financing and capital structures.
Segment Adjusted EBITDA results, along with other quantitative and qualitative information, are also utilized by the Company and its Compensation Committee for purposes of determining bonus payouts to employees.
Segment Adjusted EBITDA has limitations as an analytical tool and should not be considered in isolation from, or as a substitute for, analysis of the Company’s results from operations and operating cash flows as reported under GAAP. For example, Adjusted EBITDA:
| • | does not reflect capital expenditures, or future requirements for capital and major maintenance expenditures or contractual commitments; |
| • | does not reflect changes in, or cash requirements for, working capital needs; |
| • | does not reflect the significant interest expense, or the cash requirements necessary to service the interest payments, on the Company’s debt; and |
| • | does not reflect cash required to pay income taxes. |
The Company’s computation of Segment Adjusted EBITDA may not be comparable to other similarly titled measures computed by other companies because all companies do not calculate Adjusted EBITDA in the same fashion.
The following tables summarize significant financial information of each of the segments:
| As of and for the nine months ended March 31, 2013 | ||||||||||||||||||||
| Physical Infrastructure |
Lit Services | Other | Corp/ eliminations |
Total | ||||||||||||||||
| Revenue from external customers |
$ | 304,894 | $ | 425,021 | $ | 21,020 | $ | (8,288 | ) | $ | 742,647 | |||||||||
| Segment Adjusted EBITDA |
205,527 | 207,315 | 4,569 | (4,840 | ) | 412,571 | ||||||||||||||
| Capital expenditures, net of stimulus grant reimbursements |
127,379 | 93,918 | 31 | — | 221,328 | |||||||||||||||
F-81
Table of Contents
ZAYO GROUP HOLDINGS, INC. AND SUBSIDIARIES
NOTES TO THE CONDENSED CONSOLIDATED STATEMENTS (UNAUDITED) (CONTINUED)
(in thousands)
| As of and for the nine months ended March 31, 2014 | ||||||||||||||||||||
| Physical Infrastructure |
Lit Services | Other | Corp/ eliminations |
Total | ||||||||||||||||
| Revenue from external customers |
$ | 361,691 | $ | 454,292 | $ | 19,705 | $ | (9,151 | ) | $ | 826,537 | |||||||||
| Segment Adjusted EBITDA |
237,134 | 244,689 | 5,581 | (4,785 | ) | 482,619 | ||||||||||||||
| Capital expenditures, net of stimulus grant reimbursements |
149,036 | 116,836 | — | — | 265,872 | |||||||||||||||
Reconciliation from Total Segment Adjusted EBITDA to net earnings/(loss) from continuing operations before income taxes
| Nine months ended March 31, | ||||||||
| 2013 | 2014 | |||||||
| Total Segment Adjusted EBITDA |
$ | 412,571 | $ | 482,619 | ||||
| Interest expense |
(164,807 | ) | (150,905 | ) | ||||
| Depreciation and amortization expense |
(243,880 | ) | (246,922 | ) | ||||
| Transaction costs |
(13,089 | ) | (789 | ) | ||||
| Stock-based compensation |
(67,913 | ) | (165,134 | ) | ||||
| Loss on extinguishment of debt |
(77,253 | ) | (1,911 | ) | ||||
| Unrealized foreign currency translation gain |
42 | 944 | ||||||
|
|
|
|
|
|||||
| Net earnings/(loss) from continuing operations before provision for income taxes |
$ | (154,329 | ) | $ | (82,098 | ) | ||
|
|
|
|
|
|||||
(14) SUBSEQUENT EVENTS
See Note 2—Acquisitions, for a discussion of acquisitions closed subsequent to March 31, 2014 or that were pending.
See Note 3—Spin-Off of Business, for discussion of dispositions that have occurred subsequent to March 31, 2014.
Distribution to Employee
Effective May 1, 2014, Martin Snella, an employee of the Company, entered into a settlement agreement with CII and the Company in connection with his concurrent resignation. In connection with his voluntary resignation, all of Mr. Snella’s vested equity compensation awards of common units were redeemed in exchange for a purchase price of $9,050. All of the redeemed common units were transferred to CII and were cancelled upon his termination with the Company, with a corresponding reduction in the Company’s remaining liability for Mr. Snella’s vested common units.
Sixth Amendment to Credit Agreement
On May 16, 2014, ZGL and Zayo Capital Inc. entered into a Sixth Amendment (the “Sixth Amendment”) to the Credit Agreement dated as of July 2, 2012 (as amended, the “Credit Agreement”). Per the terms of the Sixth Amendment, the Company’s $1,740,900 Term Loan Facility was increased by $275,000 to $2,015,900 and bears interest at the existing rate of LIBOR plus 3.0 percent with a minimum LIBOR rate of 1.0 percent. The $275,000 add-on was priced at 99.5 percent. No other terms of the Credit Agreement were amended.
F-82
Table of Contents
ABOVENET, INC.
AUDITED CONSOLIDATED FINANCIAL STATEMENTS
F-83
Table of Contents
Report of Independent Registered Public Accounting Firm
The Board of Directors and Shareholders of
AboveNet, Inc.
White Plains, New York
We have audited the accompanying consolidated balance sheets of AboveNet, Inc. (the “Company”) as of December 31, 2011 and 2010 and the related consolidated statements of operations, comprehensive income, shareholders’ equity and cash flows for each of the three years in the period ended December 31, 2011. These financial statements are the responsibility of the Company’s management. Our responsibility is to express an opinion on these financial statements based on our audits.
We conducted our audits in accordance with auditing standards of the Public Company Accounting Oversight Board (United States). Those standards require that we plan and perform the audit to obtain reasonable assurance about whether the consolidated financial statements are free of material misstatement. An audit includes examining, on a test basis, evidence supporting the amounts and disclosures in the financial statements. An audit also includes assessing the accounting principles used and significant estimates made by management, as well as evaluating the overall financial statement presentation. We believe that our audits provide a reasonable basis for our opinion.
In our opinion, the consolidated financial statements referred to above present fairly, in all material respects, the financial position of AboveNet, Inc. at December 31, 2011 and 2010, and the results of its operations and its cash flows for each of the three years in the period ended December 31, 2011, in conformity with accounting principles generally accepted in the United States of America.
We also have audited, in accordance with the standards of the Public Company Accounting Oversight Board (United States), the effectiveness of AboveNet, Inc.’s internal control over financial reporting as of December 31, 2011, based on the criteria established in Internal Control—Integrated Framework issued by the Committee of Sponsoring Organization of the Treadway Commission (COSO) and our report dated February 29, 2012 expressed an unqualified opinion thereon.
/s/ BDO USA, LLP
New York, NY
February 30, 2012, except for Note 19 and Note 20 for which the date is July 12, 2012
F-84
Table of Contents
ABOVENET, INC. AND SUBSIDIARIES
CONSOLIDATED BALANCE SHEETS
(in millions, except share and per share information)
| December 31, | ||||||||
| 2011 | 2010 | |||||||
| ASSETS: |
||||||||
| Current assets: |
||||||||
| Cash and cash equivalents |
$ | 118.4 | $ | 61.6 | ||||
| Restricted cash and cash equivalents |
4.7 | 3.7 | ||||||
| Accounts receivable, net of allowances for doubtful accounts of $2.6 and $1.8 at December 31, 2011 and 2010, respectively |
35.7 | 27.5 | ||||||
| Prepaid costs and other current assets |
14.2 | 14.8 | ||||||
|
|
|
|
|
|||||
| Total current assets |
173.0 | 107.6 | ||||||
| Property and equipment, net of accumulated depreciation and amortization of $353.9 and $285.3 at December 31, 2011 and 2010, respectively |
611.5 | 540.8 | ||||||
| Deferred tax assets |
110.7 | 149.7 | ||||||
| Other assets |
15.8 | 9.7 | ||||||
|
|
|
|
|
|||||
| Total assets |
$ | 911.0 | $ | 807.8 | ||||
|
|
|
|
|
|||||
| LIABILITIES: |
||||||||
| Current liabilities: |
||||||||
| Accounts payable |
$ | 10.7 | $ | 9.4 | ||||
| Accrued expenses |
76.8 | 71.8 | ||||||
| Deferred revenue—current portion |
30.0 | 27.3 | ||||||
| Note payable—current portion |
— | 7.6 | ||||||
|
|
|
|
|
|||||
| Total current liabilities |
117.5 | 116.1 | ||||||
| Note payable |
55.0 | 42.1 | ||||||
| Deferred revenue |
79.3 | 87.0 | ||||||
| Other long-term liabilities |
11.3 | 10.1 | ||||||
|
|
|
|
|
|||||
| Total liabilities |
263.1 | 255.3 | ||||||
|
|
|
|
|
|||||
| Commitments and contingencies |
||||||||
| SHAREHOLDERS’ EQUITY: |
||||||||
| Preferred stock, 9,500,000 shares authorized, $0.01 par value, none issued or outstanding |
— | — | ||||||
| Junior preferred stock, 500,000 shares authorized, $0.01 par value, none issued or outstanding |
— | — | ||||||
| Common stock, 200,000,000 shares authorized, $0.01 par value, 26,914,108 issued and 26,255,173 outstanding at December 31, 2011 and 26,422,885 issued and 25,799,358 outstanding at December 31, 2010 |
0.3 | 0.3 | ||||||
| Additional paid-in capital |
357.7 | 332.4 | ||||||
| Treasury stock, at cost 658,935 and 623,527 shares at December 31, 2011 and 2010, respectively |
(25.0 | ) | (22.8 | ) | ||||
| Accumulated other comprehensive loss |
(9.6 | ) | (9.2 | ) | ||||
| Retained earnings |
324.5 | 251.8 | ||||||
|
|
|
|
|
|||||
| Total shareholders’ equity |
647.9 | 552.5 | ||||||
|
|
|
|
|
|||||
| Total liabilities and shareholders’ equity |
$ | 911.0 | $ | 807.8 | ||||
|
|
|
|
|
|||||
The accompanying notes are an integral part of these consolidated financial statements.
F-85
Table of Contents
ABOVENET, INC. AND SUBSIDIARIES
CONSOLIDATED STATEMENTS OF OPERATIONS
(in millions, except share and per share information)
| Years Ended December 31, | ||||||||||||
| 2011 | 2010 | 2009 | ||||||||||
| Revenue |
$ | 472.5 | $ | 409.7 | $ | 360.1 | ||||||
| Costs of revenue (excluding depreciation and amortization, shown separately below, and including provisions for impairment of $1.2, $2.0 and $1.2 for the years ended December 31, 2011, 2010 and 2009, respectively) |
162.7 | 142.8 | 130.7 | |||||||||
| Selling, general and administrative expenses |
116.4 | 96.6 | 82.5 | |||||||||
| Depreciation and amortization |
75.3 | 63.3 | 52.0 | |||||||||
|
|
|
|
|
|
|
|||||||
| Operating income |
118.1 | 107.0 | 94.9 | |||||||||
| Other income (expense): |
||||||||||||
| Interest income |
0.1 | 0.1 | 0.3 | |||||||||
| Interest expense |
(4.5 | ) | (5.2 | ) | (4.8 | ) | ||||||
| Other (expense) income, net |
(1.0 | ) | 2.0 | 3.6 | ||||||||
|
|
|
|
|
|
|
|||||||
| Income before income taxes |
112.7 | 103.9 | 94.0 | |||||||||
| Provision for (benefit from) income taxes |
40.0 | 34.5 | (187.6 | ) | ||||||||
|
|
|
|
|
|
|
|||||||
| Net income |
$ | 72.7 | $ | 69.4 | $ | 281.6 | ||||||
|
|
|
|
|
|
|
|||||||
| Income per share, basic: |
||||||||||||
| Basic net income per share |
$ | 2.81 | $ | 2.74 | $ | 11.98 | ||||||
|
|
|
|
|
|
|
|||||||
| Weighted average number of common shares |
25,902,123 | 25,293,188 | 23,504,077 | |||||||||
|
|
|
|
|
|
|
|||||||
| Income per share, diluted: |
||||||||||||
| Diluted net income per share |
$ | 2.71 | $ | 2.65 | $ | 11.06 | ||||||
|
|
|
|
|
|
|
|||||||
| Weighted average number of common shares |
26,822,614 | 26,242,696 | 25,468,405 | |||||||||
|
|
|
|
|
|
|
|||||||
The accompanying notes are an integral part of these consolidated financial statements.
F-86
Table of Contents
ABOVENET, INC. AND SUBSIDIARIES
CONSOLIDATED STATEMENTS OF COMPREHENSIVE INCOME
(in millions)
| Years Ended December 31, | ||||||||||||
| 2011 | 2010 | 2009 | ||||||||||
| Net income |
$ | 72.7 | $ | 69.4 | $ | 281.6 | ||||||
| Foreign currency translation adjustments |
(1.0 | ) | (0.8 | ) | (0.1 | ) | ||||||
| Change in fair value of interest rate swap contracts |
0.6 | 0.6 | 0.4 | |||||||||
|
|
|
|
|
|
|
|||||||
| Comprehensive income |
$ | 72.3 | $ | 69.2 | $ | 281.9 | ||||||
|
|
|
|
|
|
|
|||||||
The accompanying notes are an integral part of these consolidated financial statements.
F-87
Table of Contents
ABOVENET, INC. AND SUBSIDIARIES
CONSOLIDATED STATEMENTS OF SHAREHOLDERS’ EQUITY
(in millions, except share information)
| Common Stock | Treasury Stock | Other Shareholders’ Equity | ||||||||||||||||||||||||||||||
| Shares | Amount | Shares | Amount | Additional Paid-in Capital |
Accumulated Other Comprehensive Loss |
Retained Earnings |
Total Shareholders’ Equity |
|||||||||||||||||||||||||
| Balance at January 1, 2009 |
23,219,474 | $ | 0.2 | 502,872 | $ | (16.3 | ) | $ | 279.9 | $ | (9.3 | ) | $ | 29.8 | $ | 284.3 | ||||||||||||||||
| Issuance of common stock from exercise of warrants |
725,326 | — | — | — | 8.7 | — | — | 8.7 | ||||||||||||||||||||||||
| Issuance of common stock from vested restricted stock units |
584,362 | — | — | — | — | — | — | — | ||||||||||||||||||||||||
| Issuance of common stock from exercise of options to purchase shares of common stock |
742,626 | 0.1 | — | — | 9.9 | — | — | 10.0 | ||||||||||||||||||||||||
| Purchase of treasury stock |
— | — | 17,880 | (0.4 | ) | — | — | — | (0.4 | ) | ||||||||||||||||||||||
| Purchase of treasury stock in cashless exercise of stock warrants |
— | — | 476 | — | — | — | — | — | ||||||||||||||||||||||||
| Foreign currency translation adjustments |
— | — | — | — | — | (0.1 | ) | — | (0.1 | ) | ||||||||||||||||||||||
| Change in fair value of interest rate swap contracts |
— | — | — | — | — | 0.4 | — | 0.4 | ||||||||||||||||||||||||
| Amortization of stock-based compensation expense for stock options and restricted stock units |
— | — | — | — | 9.7 | — | — | 9.7 | ||||||||||||||||||||||||
| Net income |
— | — | — | — | — | — | 281.6 | 281.6 | ||||||||||||||||||||||||
|
|
|
|
|
|
|
|
|
|
|
|
|
|
|
|
|
|||||||||||||||||
| Balance at December 31, 2009 |
25,271,788 | 0.3 | 521,228 | (16.7 | ) | 308.2 | (9.0 | ) | 311.4 | 594.2 | ||||||||||||||||||||||
| Shares cancelled |
(54 | ) | — | — | — | — | — | — | — | |||||||||||||||||||||||
| Issuance of common stock from exercise of warrants |
858,530 | — | — | — | 10.3 | — | — | 10.3 | ||||||||||||||||||||||||
| Issuance of common stock from vested restricted stock units |
192,148 | — | — | — | — | — | — | — | ||||||||||||||||||||||||
| Issuance of common stock from exercise of options to purchase shares of common stock |
86,778 | — | — | — | 1.2 | — | — | 1.2 | ||||||||||||||||||||||||
| Issuance of common stock pursuant to the employee stock purchase plan |
4,414 | — | — | — | 0.2 | — | — | 0.2 | ||||||||||||||||||||||||
| Issuance of common stock to holders of vested unexercised options to purchase common shares |
9,281 | — | — | — | 0.5 | — | — | 0.5 | ||||||||||||||||||||||||
| Purchase of treasury stock |
— | — | 12,869 | (0.8 | ) | — | — | — | (0.8 | ) | ||||||||||||||||||||||
| Purchase of treasury stock in cashless exercises of stock warrants |
— | — | 89,430 | (5.3 | ) | — | — | — | (5.3 | ) | ||||||||||||||||||||||
| Foreign currency translation adjustments |
— | — | — | — | — | (0.8 | ) | — | (0.8 | ) | ||||||||||||||||||||||
| Change in fair value of interest rate swap contracts |
— | — | — | — | — | 0.6 | — | 0.6 | ||||||||||||||||||||||||
| Amortization of stock-based compensation expense for restricted stock units |
— | — | — | — | 11.9 | — | — | 11.9 | ||||||||||||||||||||||||
| Amortization of stock-based compensation expense for employee stock purchase plan |
— | — | — | — | 0.1 | — | — | 0.1 | ||||||||||||||||||||||||
| Cash dividend paid ($5.00 per share) |
— | — | — | — | — | — | (129.0 | ) | (129.0 | ) | ||||||||||||||||||||||
| Net income |
— | — | — | — | — | — | 69.4 | 69.4 | ||||||||||||||||||||||||
|
|
|
|
|
|
|
|
|
|
|
|
|
|
|
|
|
|||||||||||||||||
| Balance at December 31, 2010 |
26,422,885 | 0.3 | 623,527 | (22.8 | ) | 332.4 | (9.2 | ) | 251.8 | 552.5 | ||||||||||||||||||||||
| Issuance of common stock from vested restricted stock units |
454,408 | — | — | — | — | — | — | — | ||||||||||||||||||||||||
| Issuance of common stock from exercise of options to purchase shares of common stock |
24,527 | — | — | — | 0.3 | — | — | 0.3 | ||||||||||||||||||||||||
| Issuance of common stock pursuant to the employee stock purchase plan |
12,288 | — | — | — | 0.6 | — | — | 0.6 | ||||||||||||||||||||||||
| Purchase of treasury stock |
— | — | 5,951 | (0.3 | ) | — | — | — | (0.3 | ) | ||||||||||||||||||||||
| Foreign currency translation adjustments |
— | — | — | — | — | (1.0 | ) | — | (1.0 | ) | ||||||||||||||||||||||
| Settlement of interest rate swap contracts |
— | — | — | — | — | 0.6 | — | 0.6 | ||||||||||||||||||||||||
| Amortization of stock-based compensation expense for restricted stock units |
— | — | — | — | 24.3 | — | — | 24.3 | ||||||||||||||||||||||||
| Amortization of stock-based compensation expense for employee stock purchase plan |
— | — | — | — | 0.1 | — | — | 0.1 | ||||||||||||||||||||||||
| Stock purchased pursuant to the Repurchase Program |
— | — | 29,457 | (1.9 | ) | — | — | — | (1.9 | ) | ||||||||||||||||||||||
| Net income |
— | — | — | — | — | — | 72.7 | 72.7 | ||||||||||||||||||||||||
|
|
|
|
|
|
|
|
|
|
|
|
|
|
|
|
|
|||||||||||||||||
| Balance at December 31, 2011 |
26,914,108 | $ | 0.3 | 658,935 | $ | (25.0 | ) | $ | 357.7 | $ | (9.6 | ) | $ | 324.5 | $ | 647.9 | ||||||||||||||||
|
|
|
|
|
|
|
|
|
|
|
|
|
|
|
|
|
|||||||||||||||||
The accompanying notes are an integral part of these consolidated financial statements.
F-88
Table of Contents
ABOVENET, INC. AND SUBSIDIARIES
CONSOLIDATED STATEMENTS OF CASH FLOWS
(in millions)
| Years Ended December 31, | ||||||||||||
| 2011 | 2010 | 2009 | ||||||||||
| Cash flows provided by operating activities: |
||||||||||||
| Net income |
$ | 72.7 | $ | 69.4 | $ | 281.6 | ||||||
| Adjustments to reconcile net income to net cash provided by operations: |
||||||||||||
| Depreciation and amortization |
75.3 | 63.3 | 52.0 | |||||||||
| Loss on sale or disposition of property and equipment, net |
0.2 | 0.1 | 1.3 | |||||||||
| Provisions for impairment |
1.2 | 2.0 | 1.2 | |||||||||
| Provision for bad debts |
0.9 | 0.5 | 0.9 | |||||||||
| Non-cash stock-based compensation expense for restricted stock units |
24.3 | 12.4 | 9.7 | |||||||||
| Non-cash stock-based compensation expense for employee stock purchase plan |
0.1 | 0.1 | — | |||||||||
| Reversal of valuation allowance on deferred tax assets |
(9.2 | ) | (7.3 | ) | (183.0 | ) | ||||||
| Change in deferred tax assets |
47.9 | 40.5 | — | |||||||||
| Changes in operating working capital: |
||||||||||||
| Accounts receivable |
(9.1 | ) | (8.1 | ) | (1.2 | ) | ||||||
| Prepaid costs and other current assets |
1.7 | (1.2 | ) | (3.5 | ) | |||||||
| Other assets |
1.8 | (2.5 | ) | (1.3 | ) | |||||||
| Accounts payable |
(0.4 | ) | (1.2 | ) | (3.4 | ) | ||||||
| Accrued expenses |
3.8 | 0.8 | (4.6 | ) | ||||||||
| Deferred revenue |
(5.1 | ) | (6.8 | ) | 7.0 | |||||||
| Other long-term liabilities |
0.8 | 0.8 | 0.5 | |||||||||
|
|
|
|
|
|
|
|||||||
| Net cash provided by operating activities |
206.9 | 162.8 | 157.2 | |||||||||
|
|
|
|
|
|
|
|||||||
| Cash flows used in investing activities: |
||||||||||||
| Proceeds from sales of property and equipment |
0.1 | 0.4 | 0.3 | |||||||||
| Purchases of property and equipment |
(147.8 | ) | (135.7 | ) | (118.7 | ) | ||||||
|
|
|
|
|
|
|
|||||||
| Net cash used in investing activities |
(147.7 | ) | (135.3 | ) | (118.4 | ) | ||||||
|
|
|
|
|
|
|
|||||||
| Cash flows (used in) provided by financing activities: |
||||||||||||
| Proceeds from borrowing under $250 Million Secured Revolving Credit Facility, net of certain debt issuance costs |
50.0 | — | — | |||||||||
| Debt issuance costs |
(0.5 | ) | — | — | ||||||||
| Proceeds from exercise of options to purchase shares of common stock |
0.3 | 1.2 | 10.0 | |||||||||
| Proceeds from exercise of warrants |
— | 5.0 | 8.7 | |||||||||
| Proceeds from issuance of stock pursuant to the employee stock purchase plan |
0.6 | 0.2 | — | |||||||||
| Change in restricted cash and cash equivalents |
(1.0 | ) | — | (0.2 | ) | |||||||
| Proceeds from note payable, net of financing costs |
— | — | 24.5 | |||||||||
| Principal payments—note payable |
(49.7 | ) | (7.6 | ) | (3.2 | ) | ||||||
| Principal payments—capital lease obligation |
(0.2 | ) | — | (0.5 | ) | |||||||
| Purchase of treasury stock |
(2.2 | ) | (0.8 | ) | (0.4 | ) | ||||||
| Cash dividend paid to shareholders |
— | (129.0 | ) | — | ||||||||
|
|
|
|
|
|
|
|||||||
| Net cash (used in) provided by financing activities |
(2.7 | ) | (131.0 | ) | 38.9 | |||||||
|
|
|
|
|
|
|
|||||||
| Effect of exchange rates on cash |
0.3 | (0.2 | ) | 0.5 | ||||||||
|
|
|
|
|
|
|
|||||||
| Net increase (decrease) in cash and cash equivalents |
56.8 | (103.7 | ) | 78.2 | ||||||||
| Cash and cash equivalents, beginning of year |
61.6 | 165.3 | 87.1 | |||||||||
|
|
|
|
|
|
|
|||||||
| Cash and cash equivalents, end of year |
$ | 118.4 | $ | 61.6 | $ | 165.3 | ||||||
|
|
|
|
|
|
|
|||||||
| Supplemental cash flow information: |
||||||||||||
| Cash paid for interest |
$ | 2.2 | $ | 3.0 | $ | 2.7 | ||||||
|
|
|
|
|
|
|
|||||||
| Cash paid for income taxes |
$ | 1.9 | $ | 0.4 | $ | 2.8 | ||||||
|
|
|
|
|
|
|
|||||||
| Supplemental non-cash financing activities: |
||||||||||||
| Issuance of shares of common stock in cashless exercise of stock purchase warrants |
$ | — | $ | 5.3 | $ | — | ||||||
|
|
|
|
|
|
|
|||||||
| Non-cash purchase of shares into treasury in cashless exercise of stock purchase warrants |
$ | — | $ | 5.3 | $ | — | ||||||
|
|
|
|
|
|
|
|||||||
The accompanying notes are an integral part of these consolidated financial statements.
F-89
Table of Contents
ABOVENET, INC. AND SUBSIDIARIES
NOTES TO CONSOLIDATED FINANCIAL STATEMENTS
(in millions, except share and per share information)
NOTE 1: BACKGROUND AND ORGANIZATION
Bankruptcy Filing and Reorganization
On May 20, 2002, Metromedia Fiber Network, Inc. (“MFN”) and substantially all of its domestic subsidiaries (each a “Debtor” and collectively, the “Debtors”) filed voluntary petitions for reorganization under Chapter 11 of the United States Bankruptcy Code (the “Bankruptcy Code”) with the United States Bankruptcy Court for the Southern District of New York (the “Bankruptcy Court”). The Debtors remained in possession of their assets and properties and continued to operate their businesses and manage their properties as debtors-in-possession under the jurisdiction of the Bankruptcy Court.
On July 1, 2003, the Debtors filed an amended Plan of Reorganization (“Plan of Reorganization”) and amended Disclosure Statement (“Disclosure Statement”). On July 2, 2003, the Bankruptcy Court approved the Disclosure Statement and related voting procedures. On August 21, 2003, the Bankruptcy Court confirmed the Plan of Reorganization.
The Debtors emerged from proceedings under Chapter 11 of the Bankruptcy Code on September 8, 2003 (the “Effective Date”). In accordance with its Plan of Reorganization, MFN changed its name to AboveNet, Inc. (together with its subsidiaries, the “Company”) on August 29, 2003. Equity interests in MFN received no distribution under the Plan of Reorganization and the equity securities of MFN were cancelled.
Business
The Company is a facilities-based provider of technologically advanced, high-bandwidth, fiber optic communications infrastructure and co-location services to communications carriers and corporate and government customers, principally in the United States (“U.S.”) and Europe.
NOTE 2: BASIS OF PRESENTATION AND SIGNIFICANT ACCOUNTING POLICIES
A summary of the basis of presentation and the significant accounting policies followed in the preparation of these consolidated financial statements is as follows:
Stock Split
On August 3, 2009, the Board of Directors of the Company authorized a two-for-one common stock split, effected in the form of a 100% stock dividend, which was distributed on September 3, 2009. Each shareholder of record on August 20, 2009 received one additional share of common stock for each share of common stock held on that date. All share and per share information for prior periods, including warrants, options to purchase common shares, restricted stock units, warrant and option exercise prices, shares reserved under the Company’s 2003 Incentive Stock Option and Stock Unit Grant Plan (the “2003 Plan”) and the Company’s 2008 Equity Incentive Plan (the “2008 Plan”), weighted average fair value of options granted, common stock and additional paid-in capital accounts on the consolidated balance sheets and consolidated statement of shareholders’ equity, have been retroactively adjusted, where applicable, to reflect the two-for-one stock split.
Basis of Presentation and Use of Estimates
The accompanying consolidated financial statements have been prepared in accordance with accounting principles generally accepted in the United States of America (“U.S. GAAP”) and pursuant to the rules and regulations of the Securities and Exchange Commission (the “SEC”).
F-90
Table of Contents
The preparation of consolidated financial statements in conformity with U.S. GAAP requires management to make estimates and assumptions that affect the reported amounts of assets and liabilities as of the date of the consolidated financial statements, the disclosure of contingent assets and liabilities in the consolidated financial statements and the accompanying notes and the reported amounts of revenue and expenses during the periods presented. Estimates are used when accounting for certain items such as accounts receivable allowances, property taxes, transaction taxes and deferred taxes. The estimates the Company makes are based on historical factors, current circumstances and the experience and judgment of the Company’s management. The Company evaluates its assumptions and estimates on an ongoing basis and may employ outside experts to assist in the Company’s evaluations. Actual amounts and results could differ from such estimates due to subsequent events which could have a material effect on the Company’s financial statements covering future periods.
Fresh Start Accounting
On September 8, 2003, the Company authorized 10,000,000 shares of preferred stock (with a $0.01 par value) and 30,000,000 shares of common stock (with a $0.01 par value). On June 24, 2010, the shareholders approved an amendment to the Company’s certificate of incorporation, increasing the number of authorized shares of common stock from 30,000,000 to 200,000,000. See Note 10, “Shareholders’ Equity—Amendment to the Company’s Amended and Restated Certificate of Incorporation.”
The holders of common stock are entitled to one vote for each issued and outstanding share, and are entitled to receive dividends, subject to the rights of the holders of preferred stock, when and if declared by the Board of Directors. Preferred stock may be issued from time to time in one or more classes or series, each of which classes or series shall have such distributive designation as determined by the Board of Directors. During 2006, the Company reserved for issuance, from the 10,000,000 shares authorized of preferred stock described above, 500,000 shares of $0.01 par value junior preferred stock in connection with the adoption of the Amended and Restated Rights Agreement (as defined in Note 10, “Shareholders’ Equity,” below). In the event of any liquidation, the holders of the common stock will be entitled to receive the assets of the Company available for distribution, after payments to creditors and holders of preferred stock.
In 2003, the Company issued 17,500,000 shares of common stock, of which 17,498,276 were delivered and 1,724 shares were determined to be undeliverable and were cancelled, the rights to purchase 3,338,420 shares of common stock at a price of $14.97715 per share, under a rights offering (of which rights to purchase 3,337,930 shares of common stock have been exercised), five year stock purchase warrants to purchase 1,418,918 shares of common stock exercisable at a price of $10.00 per share, and seven year stock purchase warrants to purchase 1,669,316 shares of common stock exercisable at a price of $12.00 per share. In addition, 2,129,912 shares of common stock were originally reserved for issuance under the Company’s 2003 Plan. (See Note 12, “Stock-Based Compensation.”)
The Company’s emergence from bankruptcy resulted in a new reporting entity with no retained earnings or accumulated losses, effective as of September 8, 2003. Although the Effective Date of the Plan of Reorganization was September 8, 2003, the Company accounted for the consummation of the Plan of Reorganization as if it occurred on August 31, 2003 and implemented fresh start accounting as of that date. There were no significant transactions during the period from August 31, 2003 to September 8, 2003. Fresh start accounting requires the Company to allocate the reorganization value of its assets and liabilities based upon their estimated fair values, in accordance with Statement of Position 90-7, “Financial Reporting by Entities in Reorganization under the Bankruptcy Code” (now known as Financial Accounting Standards Board Accounting Standards Codification (“FASB ASC”) 852-10). The Company developed a set of financial projections, which were utilized by an expert to assist the Company in estimating the fair value of its assets and liabilities. The expert utilized various valuation methodologies, including (1) a comparison of the Company and its projected performance to that of comparable companies; (2) a review and analysis of several recent transactions of companies in similar industries to the Company; and (3) a calculation of the enterprise value based upon the future cash flows of the Company’s projections.
F-91
Table of Contents
Adopting fresh start accounting resulted in material adjustments to the historical carrying values of the Company’s assets and liabilities. The reorganization value was allocated by the Company to its assets and liabilities based upon their fair values. The Company engaged an independent appraiser to assist the Company in determining the fair market value of its property and equipment. The determination of fair values of assets and liabilities was subject to significant estimates and assumptions. The unaudited fresh start adjustments reflected at September 8, 2003 consisted of the following: (i) reduction of property and equipment; (ii) reduction of indebtedness; (iii) reduction of vendor payables; (iv) reduction of the carrying value of deferred revenue; (v) increase of deferred rent to fair market value; (vi) cancellation of MFN’s common stock and additional paid-in capital, in accordance with the Plan of Reorganization; (vii) issuance of new AboveNet, Inc. common stock and additional paid-in capital; and (viii) elimination of the accumulated other comprehensive loss and accumulated deficit accounts.
Principles of Consolidation
The consolidated financial statements include the accounts of the Company, and its wholly-owned subsidiaries. Consolidation is generally required for investments of more than 50% of the outstanding voting stock of an investee, except when control is not held by the majority owner. All significant intercompany accounts and transactions have been eliminated in consolidation.
Revenue Recognition
The Company follows SEC Staff Accounting Bulletin (“SAB”) No. 101, “Revenue Recognition in Financial Statements,” (now known as FASB ASC 605-10), as amended by SEC SAB No. 104, “Revenue Recognition,” (also now known as FASB ASC 605-10).
Revenue derived from leasing fiber optic telecommunications infrastructure and the provision of telecommunications and co-location services is recognized as services are provided. Non-refundable payments received from customers before the relevant criteria for revenue recognition are satisfied are included in deferred revenue in the accompanying consolidated balance sheets and are subsequently amortized into income over the fixed contract term.
Prior to October 1, 2009, the Company generally amortized revenue related to installation services on a straight-line basis over the contracted customer relationship (two to twenty years). In the fourth quarter of 2009, the Company completed a study of its historic customer relationship period. As a result, commencing October 1, 2009, the Company began amortizing revenue related to installation services on a straight-line basis generally over the estimated customer relationship period (generally ranging from three to twenty years).
Contract termination revenue is recognized when a customer discontinues service prior to the end of the contract period for which the Company had previously received consideration and for which revenue recognition was deferred. Contract termination revenue is also recognized when customers have made early termination payments to the Company to settle contractually committed purchase amounts that the customer no longer expects to meet or when the Company renegotiates or discontinues a contract with a customer and as a result is no longer obligated to provide services for consideration previously received and for which revenue recognition has been deferred. Additionally, the Company includes receipts of bankruptcy claim settlements from former customers as contract termination revenue when received. Contract termination revenue amounted to $4.4, $2.7, and $3.9 in 2011, 2010 and 2009, respectively.
Non-Monetary Transactions
The Company may exchange capacity with other capacity or service providers. In December 2004, the FASB issued Statement of Financial Accounting Standards (“SFAS”) No. 153, “Exchanges of Nonmonetary Assets—An Amendment of APB Opinion No. 29,” (“SFAS No. 153”), (now known as FASB ASC 845-10). SFAS No. 153 amends Accounting Principles Board Opinion No. 29, “Accounting for Nonmonetary Transactions,”
F-92
Table of Contents
(“APB No. 29”) (also now known as FASB ASC 845-10) to eliminate the exception for nonmonetary exchanges of similar productive assets and replaces it with a general exception for exchanges of nonmonetary assets that do not have commercial substance. SFAS No. 153 is to be applied prospectively for nonmonetary exchanges occurring in fiscal periods beginning after June 15, 2005. The Company’s adoption of SFAS No. 153 on July 1, 2005 did not have a material effect on the consolidated financial position or results of operations of the Company. Prior to the Company’s adoption of SFAS No. 153, nonmonetary transactions were accounted for in accordance with APB No. 29, where an exchange for similar capacity is recorded at a historical carryover basis and dissimilar capacity is accounted for at fair market value with recognition of any gain or loss. There were no gains or losses from nonmonetary transactions for the years ended December 31, 2011, 2010 and 2009.
Operating Leases
The Company leases office and equipment space, and maintains equipment rentals, right-of-way contracts, building access fees and network capacity under various non-cancelable operating leases. The lease agreements, which expire at various dates through 2030, are subject, in many cases, to renewal options and provide for the payment of taxes, utilities and maintenance. Certain lease agreements contain escalation clauses over the term of the lease related to scheduled rent increases resulting from the pass through of increases in operating costs, property taxes and the effect on costs from changes in consumer price indices. In accordance with SFAS No. 13, “Accounting for Leases,” (now known as FASB ASC 840), the Company recognizes rent expense on a straight-line basis and records a liability representing the difference between straight-line rent expense and the amount payable as an increase or decrease to a deferred liability. Any leasehold improvements related to operating leases are amortized over the lesser of their economic lives or the remaining lease term. Rent-free periods and other incentives granted under certain leases are recorded as reductions to rent expense on a straight-line basis over the related lease terms.
Cash and Cash Equivalents and Restricted Cash and Cash Equivalents
For the purposes of the consolidated statements of cash flows, the Company considers cash in banks and short-term highly liquid investments with an original maturity of three months or less to be cash and cash equivalents. Cash and cash equivalents and restricted cash and cash equivalents are stated at cost, which approximates fair value. Restricted cash and cash equivalents are comprised of amounts that secure outstanding letters of credit issued in favor of various third parties.
Accounts Receivable, Allowance for Doubtful Accounts and Sales Credits
Accounts receivable are customer obligations for services sold to such customers under normal trade terms. The Company’s customers are primarily communications carriers, and corporate enterprise and government customers, located primarily in the U.S. and the United Kingdom (“U.K.”). The Company performs periodic credit evaluations of its customers’ financial condition. The Company provides allowances for doubtful accounts and sales credits. Provisions for doubtful accounts are recorded in selling, general and administrative expenses, while allowances for sales credits are recorded as reductions of revenue. The adequacy of the reserves is evaluated utilizing several factors including length of time a receivable is past due, changes in the customer’s creditworthiness, customer’s payment history, the length of the customer’s relationship with the Company, current industry trends and the current economic climate.
Property and Equipment
Property and equipment owned at the Effective Date are stated at their estimated fair values as of the Effective Date based on the Company’s reorganization value, net of accumulated depreciation and amortization incurred since the Effective Date. Purchases of property and equipment subsequent to the Effective Date are stated at cost, net of depreciation and amortization. Major improvements are capitalized, while expenditures for repairs and maintenance are expensed when incurred. Costs incurred prior to a capital project’s completion are reflected as construction in progress and are part of network infrastructure assets, as described below and
F-93
Table of Contents
included in property and equipment on the respective balance sheets. At December 31, 2011 and December 31, 2010, the Company had $57.8 and $54.0, respectively, of construction in progress. Certain internal direct labor costs of constructing or installing property and equipment are capitalized. Capitalized direct labor is determined based upon a core group of project managers, field engineers, network infrastructure engineers and equipment engineers. Capitalized direct labor is based upon time spent on capitalized projects and consists of salary, plus certain related benefits. These individuals’ capitalized labor costs are directly associated with the construction and installation of network infrastructure and equipment and customer installations. The salaries and related benefits of non-engineers and supporting staff that are part of the operations and engineering departments are not considered part of the pool subject to capitalization. Capitalized direct labor amounted to $10.2, $10.0, and $11.4 for the years ended December 31, 2011, 2010 and 2009, respectively. Depreciation and amortization is provided on a straight-line basis over the estimated useful lives of the assets, with the exception of leasehold improvements, which are amortized over the lesser of the estimated useful life of the improvement or the term of the lease.
Estimated useful lives of the Company’s property and equipment are as follows:
| Network infrastructure assets and storage huts (except for risers and certain project installation costs, which are 5 years) |
20 years | |||
| HVAC and power equipment |
12 to 20 years | |||
| Transmission and IP equipment |
5 to 7 years | |||
| Furniture, fixtures and equipment |
4 to 7 years | |||
| Software and computer equipment |
3 to 5 years | |||
| Leasehold improvements |
|
Lesser of the estimated useful life of the improvement or the term of the lease |
|
When property and equipment is retired or otherwise disposed of, the cost and accumulated depreciation is removed from the accounts, and resulting gains or losses are reflected in net income.
From time to time, the Company is required to replace or re-route existing fiber due to structural changes such as construction and highway expansions, which is defined as “relocation.” In such instances, the Company fully depreciates the remaining carrying value of network infrastructure removed or rendered unusable and capitalizes the costs of the new infrastructure placed into service. In certain circumstances, the local municipality or agency is responsible for some or all of such amounts. The Company records its share of relocation costs in property and equipment and records the third party portion of such costs as accounts receivable. The Company capitalized relocation costs amounting to $1.8, $1.5 and $3.1 for the years ended December 31, 2011, 2010 and 2009, respectively. The Company fully depreciated the remaining carrying value of the network infrastructure rendered unusable, which on an original cost basis, totaled $0.31 ($0.15 on a net book value basis) for the year ended December 31, 2011 and, which on an original cost basis, totaled $0.21 ($0.14 on a net book value basis) for the year ended December 31, 2010 and, which on an original cost basis, totaled $0.3 ($0.2 on a net book value basis) for the year ended December 31, 2009. To the extent that relocation is temporary in nature, or requires only the movement of existing network infrastructure to another location or construction for an insignificant portion of the entire segment, the related costs are included in the Company’s results of operations.
In accordance with SFAS No. 34, “Capitalization of Interest Cost,” (now known as FASB ASC 835-20), interest on certain construction projects would be capitalized. Such amounts were considered immaterial, and accordingly, no such amounts were capitalized during each of the years ended December 31, 2011, 2010 and 2009.
In accordance with SFAS No. 144, “Accounting for the Impairment or Disposal of Long-Lived Assets,” (now known as FASB ASC 360-10-35), the Company periodically evaluates the recoverability of its long-lived assets and evaluates such assets for impairment whenever events or circumstances indicate that the carrying amount of such assets (or group of assets) may not be recoverable. Impairment is determined to exist if the estimated future undiscounted cash flows are less than the carrying value of such assets. The Company considers various factors
F-94
Table of Contents
to determine if an impairment test is necessary. The factors include: consideration of the overall economic climate, technological advances with respect to equipment, Company strategy, capital planning and certain operational issues. Since June 30, 2006, no event has occurred nor has the business environment changed to trigger an impairment test for assets in revenue service and operations. The Company also considers the removal of assets from the network as a triggering event for performing an impairment test. Once an item is removed from service, unless it is to be redeployed, it may have little or no future cash flows related to it. The Company performed annual physical counts of such assets that are not in revenue service or operations at or around September 30 of each year. With the assistance of a valuation report of the assets that are not in revenue service, prepared by an independent third party on a basis consistent with SFAS No. 157, “Fair Value Measurements,” (now known as FASB ASC 820-10), and pursuant to FASB ASC 360-10-35, the Company determined that the fair value of certain of these assets was less than the carrying value and accordingly, recorded provisions for impairment totaling $1.2 for the year ended December 31, 2011, $0.5 for the year ended December 31, 2010 and $0.4 for the year ended December 31, 2009. Additionally, at December 31, 2010, the Company recorded a $1.5 provision for impairment with respect to a discreet group of assets because of certain operational issues. The Company also recorded a provision for equipment impairment of $0.8 in the year ended December 31, 2009 to record the loss in value of certain equipment, most of which was eventually sold to an unaffiliated third party. (See Note 6, “Changes in Estimate.”)
Treasury Stock
Treasury stock is accounted for under the cost method.
Asset Retirement Obligations
In accordance with SFAS No. 143, “Accounting for Asset Retirement Obligations,” (now known as FASB ASC 410-20), the Company recognizes the fair value of a liability for an asset retirement obligation in the period in which it is incurred if a reasonable estimate of fair value can be made. The Company has asset retirement obligations related to the de-commissioning and removal of equipment, restoration of leased facilities and the removal of certain fiber and conduit systems. Considerable management judgment is required in estimating these obligations. Important assumptions include estimates of asset retirement costs, the timing of future asset retirement activities and the likelihood of contractual asset retirement provisions being enforced. Changes in these assumptions based on future information could result in adjustments to these estimated liabilities.
Asset retirement obligations are generally recorded as “other long-term liabilities,” are capitalized as part of the carrying amount of the related long-lived assets included in property and equipment, net, and are depreciated over the life of the associated asset. Asset retirement obligations aggregated $8.1 and $7.9 at December 31, 2011 and 2010, respectively, of which $4.5 and $4.3, respectively, were included in “Accrued expenses,” at such dates, and $3.6 was included in “Other long-term liabilities” at both dates. Accretion expense, which is included in “Interest expense,” amounted to $0.27 for each of the years ended December 31, 2011 and 2009 and $0.28 for the year ended December 31, 2010.
Income Taxes
The Company accounts for income taxes in accordance with SFAS No. 109, “Accounting for Income Taxes,” (now known as FASB ASC 740). Deferred tax assets and liabilities are recognized for the future tax consequences attributable to differences between financial statement carrying amounts of existing assets and liabilities and their respective tax basis and net operating losses and tax credit carryforwards. Deferred tax assets and liabilities are measured using enacted tax rates expected to apply to taxable income in the years in which those temporary differences are expected to be recovered or settled. After an evaluation of the realizability of the Company’s deferred tax assets, the Company reduced its valuation allowance by $9.1, $7.3 and $183.0 during 2011, 2010 and 2009, respectively. See Note 8, “Income Taxes,” for a further discussion of the Company’s provision for income taxes.
F-95
Table of Contents
The Company is subject to audits by various taxing authorities, and these audits may result in proposed assessments where the ultimate resolution results in the Company owing additional taxes. The Company is required to establish reserves under FASB Interpretation No. 48, “Accounting for Uncertainty in Income Taxes,” (now known as FASB ASC 740-10), when the Company believes there is uncertainty with respect to certain positions and the Company may not succeed in realizing the tax benefit. The Company believes that its tax return positions are appropriate and supportable under relevant tax law. The Company believes the estimates and assumptions used to support its evaluation of tax benefit realization are reasonable. Accordingly, no adjustments have been made to the consolidated financial statements for the years ended December 31, 2011, 2010 and 2009.
The Company’s reorganization resulted in a significantly modified capital structure as a result of applying fresh-start accounting in accordance with FASB ASC 852-10 on the Effective Date. Fresh start accounting has important consequences on the accounting for the realization of valuation allowances, related to net deferred tax assets that existed on the Effective Date but which arose in pre-emergence periods. Prior to 2009, fresh start accounting required the reversal of these allowances to be recorded as a reduction of intangible assets until exhausted and thereafter as additional paid in capital. Beginning in 2009, in accordance with SFAS141(R), “Business Combinations (Revised),” (now known as FASB ASC 805), future utilization of such benefit will reduce income tax expense. This treatment does not result in any change in liabilities to taxing authorities or in cash flows.
Undistributed earnings of the Company’s foreign subsidiaries are considered to be indefinitely reinvested and therefore, no provision for domestic taxes has been provided thereon. Upon repatriation of those earnings, in the form of dividends or otherwise, the Company would be subject to domestic income taxes, offset (in whole or in part) by foreign tax credits, related to income and withholding taxes payable to the various foreign countries. Determination of the amount of unrecognized deferred domestic income tax liability is not practicable due to the complexities associated with its hypothetical calculation; however, foreign tax credit carryforwards would be available to reduce some portion of the domestic liability.
The Company’s policy is to recognize interest and penalties accrued as a component of operating expense. As of the date of adoption of FASB ASC 740-10, the Company did not have any accrued interest or penalties associated with any unrecognized income tax benefits, nor was any interest expense recognized during the years ended December 31, 2011, 2010 and 2009.
Foreign Currency Translation and Transactions
The Company’s reporting currency is the U.S. dollar. For those subsidiaries not using the U.S. dollar as their functional currency, assets and liabilities are translated at exchange rates in effect at the balance sheet date and income and expense transactions are translated at average exchange rates during the period. Resulting translation adjustments are recorded directly to a separate component of shareholders’ equity and are reflected in the accompanying consolidated statements of comprehensive income. The Company’s foreign exchange transaction gains (losses) are generally included in “other income (expense), net” in the consolidated statements of operations.
Stock Options
On September 8, 2003, the Company adopted the fair value provisions of SFAS No. 148, “Accounting for Stock-Based Compensation Transition and Disclosure,” (“SFAS No. 148”), (now known as FASB ASC 718-10). SFAS No. 148 amended SFAS No. 123, “Accounting for Stock-Based Compensation,” (“SFAS No. 123”), (also now known as FASB ASC 718-10), to provide alternative methods of transition to SFAS No. 123’s fair value method of accounting for stock-based employee compensation. See Note 12, “Stock-Based Compensation.”
Under the fair value provisions of FASB ASC 718-10, the fair value of each stock-based compensation award is estimated at the date of grant, using the Black-Scholes option pricing model for stock option awards. The Company did not have a historical basis for determining the volatility and expected life assumptions in the model
F-96
Table of Contents
due to the Company’s limited market trading history; therefore, the assumptions used for these amounts are an average of those used by a select group of related industry companies. Most stock-based awards have graded vesting (i.e. portions of the award vest at different dates during the vesting period). The Company recognizes the related stock-based compensation expense of such awards on a straight-line basis over the vesting period for each tranche in an award. Upon consummation of the Company’s Plan of Reorganization, all then outstanding stock options were cancelled.
Effective January 1, 2006, the Company adopted SFAS No. 123(R), “Share-Based Payment,” (“SFAS No. 123(R)”), (now known as FASB ASC 718), using the modified prospective method. SFAS No. 123(R) requires all share-based awards granted to employees to be recognized as compensation expense over the vesting period, based on fair value of the award. The fair value method under SFAS No. 123(R) is similar to the fair value method under SFAS No. 123 with respect to measurement and recognition of stock-based compensation expense except that SFAS No. 123(R) requires an estimate of future forfeitures, whereas SFAS No. 123 allowed companies to estimate forfeitures or recognize the impact of forfeitures as they occur. As the Company recognized the impact of forfeitures as they occurred under SFAS No. 123, the adoption of SFAS No. 123(R) did result in different accounting treatment, but it did not have a material impact on the Company’s consolidated financial statements.
There were no options to purchase shares of common stock granted during the years ended December 31, 2011, 2010 and 2009.
Restricted Stock Units
Compensation cost for restricted stock unit awards that are not performance-based is measured based upon the quoted closing market price for the Company’s stock on the date of grant. The related compensation cost is recognized on a straight-line basis over the vesting period. Compensation expense for performance-based restricted stock unit awards is measured based upon the quoted market price for the Company’s stock on the date that the performance targets have been established and communicated to the grantee. Related compensation cost is recognized based upon a review of the performance targets and determination that such performance targets have been achieved, on a straight-line basis over the vesting period. See Note 12, “Stock-Based Compensation.”
Stock Warrants
In connection with the Plan of Reorganization described in Note 1, “Background and Organization,” the Company issued to holders of general unsecured claims as part of the settlement of such claims (i) five year warrants to purchase 1,418,918 shares of common stock with an exercise price of $10.00 per share (expired September 8, 2008) (the “Five Year Warrants”) and (ii) seven year warrants to purchase 1,669,316 shares of common stock with an exercise price of $12.00 per share (expired September 8, 2010) (the “Seven Year Warrants”). The stock warrants were treated as equity upon their exercise based upon the terms of the warrant and cash received. Stock warrants to purchase shares of common stock exercised totaled 858,530 and 725,326 in 2010 and 2009, respectively.
Under the terms of the five year and seven year warrant agreements (collectively, the “Warrant Agreements”), if the market price of the Company’s common stock, as defined in the Warrant Agreements, 60 days prior to the expiration date of the respective warrants, was greater than the warrant exercise price, the Company was required to give each warrant holder notice that at the warrant expiration date, the warrants would be deemed to have been exercised pursuant to the net exercise provisions of the respective Warrant Agreements (the “Net Exercise”), unless the warrant holder elected, by written notice, to not exercise its warrants. Under the Net Exercise, shares issued to the warrant holders would be reduced by the number of shares necessary to cover the aggregate exercise price of the shares, valuing such shares at the current market price, as defined in the Warrant Agreements. Any fractional shares, otherwise issuable, would be paid in cash.
F-97
Table of Contents
At September 8, 2008, the expiration date of the Five Year Warrants, the required conditions were met for the Net Exercise. In total, Five Year Warrants to purchase 318,526 shares of common stock were deemed exercised on a net exercise basis (including warrants to purchase 778 shares of common stock, which were exercised on a net exercise basis prior to expiration), of which 213,432 shares were issued to the warrant holders, 105,094 shares were returned to treasury and $0.004 was paid to recipients for fractional shares. In addition, Five Year Warrants to purchase 50 shares of common stock were cancelled in accordance with instructions from warrant holders. The exercises of the Five Year Warrants by holders generated cash of $11.0.
At September 8, 2010, the expiration date of the Seven Year Warrants, the required conditions were met for the Net Exercise and accordingly, Seven Year Warrants to purchase 13,626 shares of common stock were exercised at expiration, of which 10,409 shares were issued to warrant holders and 3,217 shares were returned to treasury and $0.004 was paid to recipients for fractional shares. In total, Seven Year Warrants to purchase 443,504 shares of common stock were deemed exercised on a net exercise basis (441,688 in 2010), of which 353,598 shares were issued to the warrant holders, 89,906 shares were returned to treasury and $0.004 was paid to recipients for fractional shares. In addition, Seven Year Warrants to purchase 26 shares of common stock were determined to be undeliverable and were cancelled. The exercises of the Seven Year Warrants by holders generated cash of $14.7.
Derivative Financial Instruments
The Company has utilized and may, from time to time in the future, utilize derivative financial instruments known as interest rate swaps (“derivatives”) to mitigate its exposure to interest rate risk. The Company purchased the first interest rate swap on August 4, 2008 to hedge the interest rate on the initial $24.0 (original principal) term loan under the Secured Credit Facility (as such term is defined in Note 9, “Long-Term Debt—Secured Credit Facility,” below) and the Company purchased a second interest rate swap on November 14, 2008 to hedge the interest rate on the additional $12.0 (original principal) term loan provided by SunTrust Bank. (See Note 9, “Long-Term Debt—Secured Credit Facility.”) The Company accounted for the derivatives under SFAS No. 133, “Accounting for Derivative Instruments and Hedging Activities,” (now known as FASB ASC 815). FASB ASC 815 requires that all derivatives be recognized in the financial statements and measured at fair value regardless of the purpose or intent for holding them. By policy, the Company has not historically entered into derivatives for trading purposes or for speculation. Based on criteria defined in FASB ASC 815, the interest rate swaps were considered cash flow hedges and were 100% effective. Accordingly, changes in the fair value of derivatives were recorded each period in other comprehensive loss. Changes in the fair value of the derivatives reported in accumulated other comprehensive loss were reclassified into earnings in the period in which earnings were impacted by the variability of the cash flows of the hedged item. The ineffective portion of all hedges, if any, would be recognized in current period earnings. The unrealized net loss recorded in accumulated other comprehensive loss at December 31, 2010 was $0.6 for the interest rate swaps. The mark-to-market value of the cash flow hedges was recorded in current assets, current liabilities, other non-current assets or other long-term liabilities, as applicable, and the offsetting gains or losses in other comprehensive loss. Both interest rate swaps were settled in January 2011.
On January 1, 2009, the Company adopted SFAS No. 161, “Disclosures about Derivative Instruments and Hedging Activities—an amendment of FASB Statement No. 133,” (now known as FASB ASC 815-10). FASB ASC 815-10 changes the disclosure requirements for derivatives and hedging activities. Entities are required to provide enhanced disclosures about (i) how and why an entity uses derivatives; (ii) how derivatives and related hedged items are accounted for under FASB ASC 815-10; and (iii) how derivatives and related hedged items affect an entity’s financial position and cash flows.
The Company has, when applicable, minimized its credit risk relating to counterparties of its derivatives by transacting with multiple, high quality counterparties, thereby limiting exposure to individual counterparties, and by monitoring the financial condition of its counterparties.
All derivatives were recorded on the Company’s consolidated balance sheets at fair value. Accounting for the gains and losses resulting from changes in the fair value of derivatives depends on the use of the derivative and
F-98
Table of Contents
whether it qualifies for hedge accounting in accordance with FASB ASC 815-10. At December 31, 2010, net interest rate swap derivative liabilities of $0.6 were included in “Accrued expenses” in the Company’s consolidated balance sheet. The swap agreements were settled in January 2011 as described below.
Derivatives recorded at fair value in the Company’s consolidated balance sheets as of December 31, 2011 and 2010 consisted of the following:
| Derivative Liabilities | ||||||||
| Derivatives designated as hedging instruments |
December 31, 2011 | December 31, 2010 | ||||||
| Interest rate swap agreement expiring August 1, 2011(*) |
$ | — | $ | 0.4 | ||||
| Interest rate swap agreement expiring November 1, 2011(*) |
— | 0.2 | ||||||
|
|
|
|
|
|||||
| Total derivatives designated as hedging instruments |
$ | — | $ | 0.6 | ||||
|
|
|
|
|
|||||
(*) The derivative liabilities are two interest rate swap agreements with original three year terms, which were included in “Accrued expenses” in the Company’s consolidated balance sheet at December 31, 2010.
Interest Rate Swap Agreements
The notional amounts provide an indication of the extent of the Company’s involvement in such agreements but do not represent its exposure to market risk. The following table shows the notional amount outstanding, maturity date, and the weighted average receive and pay rates of the interest rate swap agreements as of December 31, 2011 and 2010.
| Notional Amount | Weighted Average Rate | |||||||||||||||
| December 31, 2011 |
December 31, 2010 | Maturity Date |
Pay | Receive | ||||||||||||
| $ | — | $ | 18.9 | August 1, 2011 | 3.65 | % | 0.72 | % | ||||||||
| — | 9.5 | November 1, 2011 | 2.635 | % | 0.40 | % | ||||||||||
|
|
|
|
|
|||||||||||||
| $ | — | $ | 28.4 | |||||||||||||
|
|
|
|
|
|||||||||||||
Interest expense under these agreements, and the respective debt instruments that they hedge, are recorded at the net effective interest rate of the hedged transaction.
The swap agreements were settled in January 2011 in connection with the repayment of the term loans under the Secured Credit Facility and the closing of the $250 Million Secured Revolving Credit Facility (as such terms are defined in Note 9, “Long-Term Debt—$250 Million Secured Revolving Credit Facility,” below). The cost of $0.5 to settle the swap agreements was included in “Other (expense) income, net” in the Company’s consolidated statement of operations for the year ended December 31, 2011.
Fair Value of Financial Instruments
The Company adopted SFAS No. 157, “Fair Value Measurements,” (now known as FASB ASC 820-10), for the Company’s financial assets and liabilities effective January 1, 2008. This pronouncement defines fair value, establishes a framework for measuring fair value, and requires expanded disclosures about fair value measurements. FASB ASC 820-10 emphasizes that fair value is a market-based measurement, not an entity-specific measurement, and defines fair value as the price that would be received to sell an asset or transfer a liability in an orderly transaction between market participants at the measurement date. FASB ASC 820-10 discusses valuation techniques, such as the market approach (comparable market prices), the income approach (present value of future income or cash flow) and the cost approach (cost to replace the service capacity of an asset or replacement cost), which are each based upon observable and unobservable inputs. Observable inputs reflect market data obtained from independent sources, while unobservable inputs reflect the Company’s market
F-99
Table of Contents
assumptions. FASB ASC 820-10 utilizes a fair value hierarchy that prioritizes inputs to fair value measurement techniques into three broad levels:
| Level 1: |
Observable inputs such as quoted prices for identical assets or liabilities in active markets. | |
| Level 2: |
Observable inputs other than quoted prices that are directly or indirectly observable for the asset or liability, including quoted prices for similar assets or liabilities in active markets; quoted prices for similar or identical assets or liabilities in markets that are not active; and model-derived valuations whose inputs are observable or whose significant value drivers are observable. | |
| Level 3: |
Unobservable inputs that reflect the reporting entity’s own assumptions. | |
The Company’s investment in overnight money market institutional funds, which amounted to $110.0 and $48.2 at December 31, 2011 and December 31, 2010, respectively, is included in cash and cash equivalents on the accompanying balance sheets and is classified as a Level 1 asset.
The Company was party to two interest rate swaps, which were utilized to modify the Company’s interest rate risk. The Company recorded the mark-to-market value of the interest rate swap contracts of $0.6 (which was included in “Accrued expenses”) in the Company’s consolidated balance sheet at December 31, 2010. At December 31, 2010, the Company used third parties, as well as its own market analysis to determine the fair value of each of the interest rate swap agreements. The fair value of the interest rate swap contracts were classified as Level 2 liabilities. The swap agreements were settled in January 2011 in connection with the repayment of the term loans under the Secured Credit Facility and the closing of the $250 Million Secured Revolving Credit Facility. The cost of $0.5 to settle the swap agreements was included in “Other (expense) income, net” in the Company’s consolidated statement of operations for the year ended December 31, 2011.
The Company’s consolidated balance sheets include the following financial instruments: short-term cash investments, trade accounts receivable, trade accounts payable and note payable. The Company believes the carrying amounts in the financial statements approximate the fair value of these financial instruments due to the relatively short period of time between the origination of the instruments and their expected realization or the interest rates which approximate current market rates.
Concentration of Credit Risk
Financial instruments which potentially subject the Company to concentration of credit risk consist principally of short-term cash investments and accounts receivable. The Company does not enter into financial instruments for trading or speculative purposes. The Company’s cash and cash equivalents are invested in investment-grade, short-term investment instruments with high quality financial institutions. The Company’s trade receivables, which are unsecured, are geographically dispersed, and no single customer accounts for greater than 10% of consolidated revenue or accounts receivable, net. The Company performs ongoing credit evaluations of its customers’ financial condition. The allowance for non-collection of accounts receivable is based upon the expected collectability of all accounts receivable. The Company places its cash and cash equivalents primarily in commercial bank accounts in the U.S. Account balances generally exceed federally insured limits.
401(k) and Other Post-Retirement Benefits
The Company has a Profit Sharing and 401(k) Plan (the “Plan”) for its employees in the U.S., which permits employees to make contributions to the Plan on a pre-tax salary reduction basis in accordance with the provisions of the Internal Revenue Code and permits the employer to provide discretionary contributions. All full-time U.S. employees are eligible to participate in the Plan at the beginning of the month following three months of service. Eligible employees may make contributions subject to the limitations defined by the Internal Revenue Code. The Company matches 50% of a U.S. employee’s contributions, up to the amount set forth in the Plan. Matched amounts vest based upon an employee’s length of service. The Company’s subsidiaries in the U.K. have a different plan under which contributions are made up to a maximum of 8% when U.K. employee
F-100
Table of Contents
contributions reach 5% of salary. Under the U.K. plan, contributions are made at two levels. When a U.K. employee contributes 3% or more but less than 5% of their salary to the plan, the Company’s contribution is fixed at 5% of the salary. When a U.K. employee contributes over 5% of their salary to the plan, the Company’s contribution is fixed at 8% of the salary (regardless of the percentage of the contribution in excess of 5%).
The Company contributed $1.6 for the year ended December 31, 2011 and $1.5 for each of the years ended December 31, 2010 and 2009, net of forfeitures for its obligations under these plans.
Taxes Collected from Customers
In June 2006, the Emerging Issues Task Force (“EITF”) ratified the consensus on EITF No. 06-3, “How Taxes Collected from Customers and Remitted to Governmental Authorities Should Be Presented in the Income Statement (That Is, Gross versus Net Presentation),” (“EITF No. 06-3”), (now known as FASB ASC 605-45). FASB ASC 605-45 requires that companies disclose their accounting policies regarding the gross or net presentation of certain taxes. Taxes within the scope of FASB ASC 605-45 are any taxes assessed by a governmental authority that are directly imposed on a revenue-producing transaction between a seller and a customer and may include, but are not limited to, sales, use, value added and some excise taxes. In addition, if such taxes are significant, and are presented on a gross basis, the amounts of those taxes should be disclosed. The Company adopted EITF No. 06-3 effective January 1, 2007. The Company records Universal Service Fund (“USF”) contributions relating to certain services it provides on a net basis in accordance with the guidelines of EITF No. 99-19, “Reporting Revenue Gross as a Principal versus Net as an Agent,” (also now known as FASB ASC 605-45). The Company’s policy is to record all such fees, contributions and taxes within the scope of FASB ASC 605-45 on a net basis.
Reclassifications
Certain reclassifications have been made to the consolidated financial statements for the year ended December 31, 2011 to conform to the classifications used for the year ended December 31, 2010.
Recently Issued Accounting Pronouncements
In August 2009, the FASB issued ASU No. 2009-5, “Fair Value Measurements and Disclosures (Topic 820)—Measuring Liabilities at Fair Value.” ASU No. 2009-5 provides clarification that in circumstances in which a quoted price in an active market for the identical liability is not available, a reporting entity is required to measure fair value using a valuation technique that uses the quoted price of the identical liability when traded as an asset, quoted prices for similar liabilities or similar liabilities when traded as assets, or another valuation technique that is consistent with the principles of ASC Topic 820. ASU No. 2009-5 is effective for the first reporting period (including interim periods) beginning after issuance. The adoption of ASU No. 2009-5 did not have a material impact on the Company’s financial position, results of operations or cash flows.
In October 2009, the FASB issued ASU No. 2009-13, “Revenue Recognition (Topic 605)—Multiple Deliverable Revenue Arrangements.” ASU No. 2009-13 eliminates the residual method of allocation and requires that arrangement consideration be allocated at the inception of the arrangement to all deliverables using the relative selling price method and expands the disclosures related to multiple-deliverable revenue arrangements. ASU No. 2009-13 is effective prospectively for revenue arrangements entered into or materially modified in fiscal years beginning on or after June 15, 2010, with earlier adoption permitted. The adoption of ASU No. 2009-13 did not have a material impact on the Company’s financial position, results of operations or cash flows.
In January 2010, the FASB issued ASU No. 2010-02, “Consolidation (Topic 810)—Accounting and Reporting for Decreases in Ownership of a Subsidiary—a Scope Clarification.” ASU No. 2010-02 clarifies that the scope of the decrease in ownership provisions of Topic 810 applies to a subsidiary or group of assets that is a business, a subsidiary that is a business that is transferred to an equity method investee or a joint venture or an exchange of a group of assets that constitutes a business for a noncontrolling interest in an entity and does not
F-101
Table of Contents
apply to sales in substance of real estate. ASU No. 2010-02 is effective as of the beginning of the period in which an entity adopts SFAS No. 160 or, if SFAS No. 160 has been previously adopted, the first interim or annual period ending on or after December 15, 2009, applied retrospectively to the first period that the entity adopted SFAS No. 160. The adoption of ASU No. 2010-02 did not have a material impact on the Company’s financial position, results of operations or cash flows.
In January 2010, the FASB issued ASU No. 2010-06, “Fair Value Measurements and Disclosures (Topic 820)—Improving Disclosures about Fair Value Measurements.” ASU 2010-06 requires new disclosures regarding transfers in and out of the Level 1 and 2 and activity within Level 3 fair value measurements and clarifies existing disclosures of inputs and valuation techniques for Level 2 and 3 fair value measurements. ASU 2010-06 also includes conforming amendments to employers’ disclosures about postretirement benefit plan assets. The new disclosures and clarifications of existing disclosures are effective for interim and annual reporting periods beginning after December 15, 2009, except for the disclosure of activity within Level 3 fair value measurements, which is effective for fiscal years beginning after December 15, 2010, and for interim periods within those years. The adoption of ASU No. 2010-06 did not have a material impact on the Company’s financial position, results of operations or cash flows.
In February 2010, the FASB issued ASU 2010-09, “Subsequent Events (Topic 855)—Amendments to Certain Recognition and Disclosure Requirements.” ASU 2010-09 requires an entity that is an SEC filer to evaluate subsequent events through the date that the financial statements are issued and removes the requirement that an SEC filer disclose the date through which subsequent events have been evaluated. ASU 2010-09 was effective upon issuance. The adoption of ASU 2010-09 had no effect on the Company’s financial position, results of operations or cash flows.
In April 2010, the FASB issued ASU 2010-13, “Compensation—Stock Compensation (Topic 718)—Effect of Denominating the Exercise Price of a Share-Based Payment Award in the Currency of the Market in Which the Underlying Equity Security Trades.” ASU 2010-13 provides amendments to Topic 718 to clarify that an employee share-based payment award with an exercise price denominated in the currency of a market in which a substantial portion of the entity’s equity securities trades should not be considered to contain a condition that is not a market, performance, or service condition. Therefore, an entity would not classify such an award as a liability if it otherwise qualifies as equity. The amendments in ASU 2010-13 are effective for fiscal years, and interim periods within those fiscal years, beginning on or after December 15, 2010. The adoption of ASU 2010-13 did not have a material impact on the Company’s financial position, results of operations or cash flows.
F-102
Table of Contents
NOTE 3: PREPAID COSTS AND OTHER CURRENT ASSETS
Prepaid costs and other current assets as of December 31, 2011 and 2010 consist of the following:
| December 31, | ||||||||
| 2011 | 2010 | |||||||
| Prepaid property taxes |
$ | 2.8 | $ | 2.7 | ||||
| Prepaid right-of-way charges |
2.5 | 2.3 | ||||||
| Prepaid telecom |
2.1 | 1.5 | ||||||
| Prepaid insurance |
1.6 | 1.0 | ||||||
| Prepaid maintenance |
0.8 | 1.6 | ||||||
| Prepaid rent |
0.8 | 0.6 | ||||||
| Reimbursable relocation costs |
0.5 | 2.6 | ||||||
| State income tax deposits in 2011 and state and federal income tax deposits in 2010 |
0.2 | 0.4 | ||||||
| Other receivables |
1.7 | 0.8 | ||||||
| Other prepaids |
1.2 | 0.9 | ||||||
| Deposits |
— | 0.4 | ||||||
|
|
|
|
|
|||||
| Total |
$ | 14.2 | $ | 14.8 | ||||
|
|
|
|
|
|||||
NOTE 4: PROPERTY AND EQUIPMENT
Property and equipment as of December 31, 2011 and 2010 consist of the following:
| December 31, | ||||||||
| 2011 | 2010 | |||||||
| Leasehold improvements |
$ | 8.7 | $ | 5.8 | ||||
| Furniture, fixtures and equipment |
39.7 | 32.2 | ||||||
| Network infrastructure assets, including transmission and IP equipment |
917.0 | 788.1 | ||||||
|
|
|
|
|
|||||
| Total property and equipment |
965.4 | 826.1 | ||||||
| Accumulated depreciation and amortization |
(353.9 | ) | (285.3 | ) | ||||
|
|
|
|
|
|||||
| Property and equipment, net |
$ | 611.5 | $ | 540.8 | ||||
|
|
|
|
|
|||||
Included in network infrastructure assets was certain transmission and IP equipment held in inventory for future use, which had an original cost of $40.5 and $32.4, accumulated depreciation of $20.1 and $15.0 and net carrying values of $20.4 and $17.4 at December 31, 2011 and 2010, respectively.
In addition, at December 31, 2011 and 2010, the Company had assets held for sale or disposition with net book values totaling $0.1 and $0.6, respectively, (net of allowances for equipment impairment of $0.3 and $0.5 at December 31, 2011 and 2010, respectively), which were included in network infrastructure assets, including transmission and IP equipment above.
Depreciation and amortization expense related to property and equipment for the years ended December 31, 2011, 2010, and 2009 was approximately $75.3, $63.3 and $52.0, respectively.
Included in costs of revenue for the years ended December 31, 2011, 2010 and 2009 are provisions for impairment of $1.2, $2.0 and $1.2, respectively, with respect to certain assets removed from the network and either sold or disposed or made available for sale or disposition.
F-103
Table of Contents
NOTE 5: SUBORDINATED INVESTMENT
In January 2008, the Company became a strategic member, as defined, of MediaXstream, LLC, a newly formed limited liability company that was created to provide transport and managed network services for the production and broadcast industries (“MediaX”). MediaX was formed with preferred members who contributed cash and strategic members and management members who contribute services. The Company’s interest did not provide any voting rights on MediaX’s Board of Managers. The Company agreed to contribute certain monthly services pursuant to a 51 month contract, which commenced April 2008, for an interest in MediaX. Distributions to the Company were subordinated to distributions to the preferred members of their original investment plus a preferred return. Based upon amounts contributed, the Company’s nominal ownership interest was approximately 15.4% of equity. MediaX was a start-up company with no operating history. Distributions on the Company’s investment were subordinated to the distributions to the preferred members and the Company’s interest did not provide any level of control. These factors indicated that the fair value of the Company’s investment in MediaX was not significant. Accordingly, the Company has not reflected the services contributed as revenue or the corresponding investment in MediaX in its financial statements. The cost of providing such services is included in costs of revenue in the relevant period. The Company contributed services to MediaX of $1.7 in each of the years ended December 31, 2011, 2010 and 2009, which represents the estimated fair value of the services and not the actual costs of providing such services, which are not significant. In December 2009, all of the ownership interests in MediaX, including the ownership interest held by us, were purchased by Hibernia Group ehf. Pursuant to the purchase agreement, the Company is entitled to an earnout payment in the event that MediaX achieves certain financial performance results. The Company will continue to contribute services in accordance with the original contract. The Company will record distributions from its investment in MediaX, if any, as income when received.
Additionally, the Company provides other services to MediaX on the same basis as it provides to other customers. The Company billed MediaX for services and reimbursements of $0.7 during each of the years ended December 31, 2011 and 2010 and $0.6 during the year ended December 31, 2009.
NOTE 6: CHANGES IN ESTIMATE
Effective January 1, 2010, the Company changed the estimated useful lives for its IP equipment from seven years to five years. Additionally, the Company changed the estimated useful lives for certain capitalized labor from 20 years to seven years. Effective as of October 1, 2011, the Company changed the estimated useful lives for certain capitalized labor from seven to five years, and began depreciating assets under the Company’s sparing program, in accordance with their respective asset class lives. The effect of these changes on the Company’s operating results has not been and will not be material.
F-104
Table of Contents
NOTE 7: ACCRUED EXPENSES
Accrued expenses as of December 31, 2011 and 2010 consist of the following:
| December 31, | ||||||||
| 2011 | 2010 | |||||||
| Accrued transaction taxes |
$ | 21.5 | $ | 18.3 | ||||
| Accrued capital expenditures |
15.2 | 13.0 | ||||||
| Accrued payroll, bonuses and employee benefits |
12.8 | 12.2 | ||||||
| Accrued property tax |
5.8 | 7.6 | ||||||
| Accrued telecommunication costs |
4.6 | 3.7 | ||||||
| Asset retirement obligations |
4.5 | 4.3 | ||||||
| Accrued conduit, right-of-way and occupancy expenses |
3.7 | 3.7 | ||||||
| Current income taxes payable |
2.5 | 3.1 | ||||||
| Accrued repairs and maintenance |
1.8 | 1.0 | ||||||
| Accrued litigation costs |
0.7 | 0.7 | ||||||
| Current portion of deferred fair market value rent liability |
0.6 | 0.6 | ||||||
| Accrued other professional fees, including directors’ fees |
0.4 | 0.7 | ||||||
| Accrued utilities |
0.3 | 0.4 | ||||||
| Accrued accounting and auditing fees |
0.3 | 0.2 | ||||||
| Capital lease obligation, current |
0.2 | 0.1 | ||||||
| Accrued interest |
0.1 | 0.2 | ||||||
| Other |
1.8 | 2.0 | ||||||
|
|
|
|
|
|||||
| Total |
$ | 76.8 | $ | 71.8 | ||||
|
|
|
|
|
|||||
NOTE 8: INCOME TAXES
Income taxes have been provided based upon the tax laws and rates in the countries in which operations are conducted and income is earned. The provision for (benefit from) income taxes for the years ended December 31, 2011, 2010 and 2009 are as follows:
| Years Ended December 31, | ||||||||||||
| 2011 | 2010 | 2009 | ||||||||||
| Current |
||||||||||||
| Federal |
$ | — | $ | — | $ | (5.3 | ) | |||||
| State |
1.3 | 1.3 | 0.7 | |||||||||
| Foreign |
— | — | — | |||||||||
|
|
|
|
|
|
|
|||||||
| 1.3 | 1.3 | (4.6 | ) | |||||||||
|
|
|
|
|
|
|
|||||||
| Deferred |
||||||||||||
| Federal |
39.2 | 33.5 | (157.5 | ) | ||||||||
| State |
5.6 | 4.8 | (22.5 | ) | ||||||||
| Foreign |
(6.1 | ) | (5.1 | ) | (3.0 | ) | ||||||
|
|
|
|
|
|
|
|||||||
| 38.7 | 33.2 | (183.0 | ) | |||||||||
|
|
|
|
|
|
|
|||||||
| Total provision for (benefit from) income taxes |
$ | 40.0 | $ | 34.5 | $ | (187.6 | ) | |||||
|
|
|
|
|
|
|
|||||||
F-105
Table of Contents
Deferred income taxes result from temporary differences in the financial reporting basis and tax basis of assets and liabilities. The following is a summary of the significant items giving rise to the components of the Company’s deferred tax assets and liabilities.
| December 31, | ||||||||
| 2011 | 2010 | |||||||
| Deferred tax assets: |
||||||||
| Property and equipment |
$ | 70.9 | $ | 153.0 | ||||
| Net operating loss (“NOL”) carryforwards |
118.0 | 91.5 | ||||||
| Accruals and reserves |
13.0 | 12.9 | ||||||
| Rent |
0.4 | 0.6 | ||||||
| Deferred compensation |
4.9 | 2.4 | ||||||
| Other |
11.6 | 11.2 | ||||||
|
|
|
|
|
|||||
| Total deferred tax assets |
218.8 | 271.6 | ||||||
| Valuation allowance |
(49.1 | ) | (58.2 | ) | ||||
|
|
|
|
|
|||||
| Net deferred tax assets |
169.7 | 213.4 | ||||||
| Deferred tax liability: deferred revenue |
(59.0 | ) | (63.7 | ) | ||||
|
|
|
|
|
|||||
| Total net deferred tax assets |
$ | 110.7 | $ | 149.7 | ||||
|
|
|
|
|
|||||
For each of the years ended December 31, 2011 and 2010, the Company recorded a current net tax expense for capital-based state taxes of $1.3. The Company provided for income taxes at the statutory rate for 2011, 2010 and 2009. In 2011, 2010 and 2009, the Company recognized $9.2, $7.3 and $183.0 of non-cash tax benefits as a result of reducing certain valuation allowances previously established with respect to deferred tax assets in the U.S. and the U.K. We believe it is more likely than not that we will utilize these assets to reduce or eliminate tax payments in future periods. The Company’s evaluation encompassed (i) a review of its recent history of profitability in the U.S. and U.K. for the past three years; (ii) a review of internal financial forecasts demonstrating its expected capacity to utilize deferred tax assets; and (iii) a reassessment of tax benefits recognition under FASB ASC 740.
| Years Ended December 31, | ||||||||||||
| 2011 | 2010 | 2009 | ||||||||||
| Income before income taxes: |
||||||||||||
| Domestic |
$ | 103.9 | $ | 98.0 | $ | 89.5 | ||||||
| Foreign |
8.8 | 5.9 | 4.5 | |||||||||
|
|
|
|
|
|
|
|||||||
| Total |
$ | 112.7 | $ | 103.9 | $ | 94.0 | ||||||
|
|
|
|
|
|
|
|||||||
| Rate Reconciliation: |
||||||||||||
| Tax at statutory rate |
35.0 | % | 35.0 | % | 35.0 | % | ||||||
| State income tax, net of federal benefit |
5.7 | % | 4.7 | % | 0.5 | % | ||||||
| Valuation allowance |
(8.2 | )% | (7.1 | )% | (233.0 | )% | ||||||
| Permanent items |
3.0 | % | 0.6 | % | (2.1 | )% | ||||||
|
|
|
|
|
|
|
|||||||
| Tax provision (benefit) |
35.5 | % | 33.2 | % | (199.6 | )% | ||||||
|
|
|
|
|
|
|
|||||||
In connection with the Company’s emergence from bankruptcy, the Company realized substantial cancellation of debt income (“CODI”). This income was not taxable for U.S. income tax purposes because the CODI resulted from the Company’s reorganization under the Bankruptcy Code. However, for U.S. income tax reporting purposes, the Company is required to reduce certain tax attributes, including (a) net operating loss carryforwards, (b) capital losses, (c) certain tax credit carryforwards, and (d) tax basis in assets, in a total amount equal to the gain on the extinguishment of debt. The reorganization of the Company on the Effective Date constituted an ownership change under Section 382 of the Internal Revenue Code, and the use of any of the
F-106
Table of Contents
Company’s NOL’s, capital losses, and tax credit carryforwards, remaining after applying these provisions, and certain subsequently recognized “built-in” losses and deductions, if any, existing prior to the ownership change, were subject to an overall annual limitation through December 31, 2008.
As of December 31, 2011, the Company has domestic NOL carryforwards of $283.5 and foreign NOL carryforwards of $41.1. Certain of these NOL carryforwards begin to expire in 2024. The Company’s use of $137.7 of its domestic NOL carryforward is limited to $8.1 per annum and $145.8 is unlimited. These NOL carryforwards may be subject to future limitation by Section 382 of the United States Internal Revenue Code.
The Company and its subsidiaries’ income tax returns are routinely examined by various tax authorities. The statute of limitations is open with respect to tax years 2007 to 2010. The statute of limitations for returns filed with respect to these years will begin to expire in 2012.
NOTE 9: LONG-TERM DEBT
$250 Million Secured Revolving Credit Facility
On January 28, 2011, the Company closed a five year $250 secured revolving credit facility (the “$250 Million Secured Revolving Credit Facility”) with the lender parties thereto (the “Lenders”) and SunTrust Bank, as Administrative Agent (the “Administrative Agent”). The Lenders received a first priority security interest in and lien on substantially all of the Company’s domestic assets and 65% of the ownership interest in the Company’s principal foreign subsidiaries. Loans under the $250 Million Secured Revolving Credit Facility bear interest, for any interest period of one, two or three months or if agreed to, longer interest periods at the Company’s option, at either the Base Rate (as defined in the $250 Million Secured Revolving Credit Facility) plus the applicable margin ranging from 1.25% to 2.00%, or alternately, the Adjusted LIBO Rate (as defined in the $250 Million Secured Revolving Credit Facility) plus the applicable margin ranging from 2.25% to 3.00%. The Company is also required to pay an unused commitment fee ranging from 0.375% to 0.50% per annum based on the daily average undrawn portion of the $250 Million Secured Revolving Credit Facility. The applicable margin and the unused commitment fee will be determined based on the Company’s Leverage Ratio based on Consolidated Total Debt to Consolidated EBITDA (each as defined in the $250 Million Secured Revolving Credit Facility).
The $250 Million Secured Revolving Credit Facility includes an uncommitted accordion feature that permits the Company to increase the aggregate principal amount by up to $125.0 through one or more term loans or additional revolving credit, subject to the agreement by one or more Lenders to provide such additional principal amount.
The Company borrowed $55.0 at closing, of which $5.0 was used to pay bank fees and legal expenses, $49.9 was used to repay the Secured Credit Facility (as defined below) and $0.1 was used for general corporate purposes. The initial borrowings under the $250 Million Secured Revolving Credit Facility carried an interest rate of 4.50% (base rate of 3.25% plus applicable margin of 1.25%). The Company converted the interest rate to the Adjusted LIBO Rate option as of February 4, 2011, at which time the interest rate was changed to 2.52% (0.27% Adjusted LIBO Rate plus applicable margin of 2.25%). At December 31, 2011, the $250 Million Secured Revolving Credit Facility carried an interest rate of 2.53% (0.28% Adjusted LIBO Rate plus applicable margin of 2.25%).
The Company has the right to prepay any outstanding loan under the $250 Million Secured Revolving Credit Facility prior to its maturity without premium or penalty.
The Company is required to comply with a number of affirmative, negative and financial covenants. Among other things, these covenants require the Company to provide notices of material events and information regarding collateral, restrict the Company’s ability, subject to certain exceptions and baskets, to incur additional indebtedness, grant liens on assets, undergo fundamental changes, make investments, sell assets, make restricted
F-107
Table of Contents
payments (including the ability to pay dividends) and engage in affiliate transactions, and require the Company to maintain a Leverage Ratio not greater than 2.5 to 1.0 and an Interest Coverage Ratio (as such terms are defined in the $250 Million Secured Revolving Credit Facility) of not less than 3.0 to 1.0. At December 31, 2011, based upon the Company’s Leverage Ratio, its cash balance and its availability under the $250 Million Secured Revolving Credit Facility, $257.5 of retained earnings is unrestricted for dividend purposes and the balance is restricted.
The $250 Million Secured Revolving Credit Facility contains customary events of default (subject to customary grace periods, cure rights and materiality thresholds), including, among others, failure to pay principal, interest or fees, violation of covenants, material inaccuracy of representations and warranties, cross-default and cross-acceleration of material indebtedness, certain bankruptcy and insolvency events, certain judgments, certain ERISA events and a change of control.
Following an event of default under the $250 Million Secured Revolving Credit Facility, the Administrative Agent and the Lenders would be entitled to take various actions, including the acceleration of amounts due under the $250 Million Secured Revolving Credit Facility and seek other customary remedies that may be taken by secured creditors.
The outstanding principal amount of all revolving credit loans, together with accrued and unpaid interest thereon, will be due and payable on January 28, 2016.
In connection with the January 2011 closing of the $250 Million Secured Revolving Credit Facility, the Company also settled the two interest rate swaps at a total cost of $0.5, which is included in “Other income (expense), net” in the Company’s consolidated statement of operations for the year ended December 31, 2011. The Company also wrote-off $1.1 in unamortized debt issuance costs associated with the Secured Credit Facility, which is also included in “Other income (expense), net” in the Company’s consolidated statement of operations for the year ended December 31, 2011.
As of December 31, 2011, $195.0 was available for borrowings under the $250 Million Secured Revolving Credit Facility.
The Company was in compliance with all of its debt covenants as of December 31, 2011.
Secured Credit Facility
On February 29, 2008, the Company, excluding certain foreign subsidiaries, entered into a Credit and Guaranty Agreement (as amended, the “Credit Agreement”) providing for a $60.0 senior secured credit facility (the “Secured Credit Facility”), consisting of an $18.0 revolving credit facility (the “Revolver”) and a $42.0 term loan facility (the “Term Loan”), which was comprised of $24.0 advanced at closing and up to $18.0 of which originally could be drawn within nine months of closing at the Company’s option (the “Delayed Draw Term Loan”). The Secured Credit Facility was secured by substantially all of the Company’s domestic assets. In September 2008, the Delayed Draw Term Loan option, which was originally scheduled to expire on November 25, 2008, was extended to June 30, 2009 and then subsequently extended to December 31, 2009. The Revolver and the Term Loan each had a term of five years from February 29, 2008. The Company paid an upfront fee of 1.5% ($0.9) of the total amount of the Secured Credit Facility and paid $0.3 to its unaffiliated third party financial advisors who assisted the Company. The Company was also liable for an unused commitment fee of 0.75% per annum. Interest accrued at LIBOR (30, 60, 90 or 180 day rates) or at the announced base rate of the administrative agent at the Company’s option, plus the applicable margins, as defined. The Company chose 30 day LIBOR as the interest rate, plus the applicable margin of 3% effective September 30, 2008. Additionally, the Company was originally required to maintain an unrestricted cash balance at all times of at least $20.0. On February 29, 2008, the Company received proceeds, pursuant to the Term Loan of $24.0, less debt issuance costs. Under the provisions of the Term Loan, the initial advance was at the base rate of interest, plus the margin (8.25% at February 29, 2008) and converted to LIBOR, plus 3.25% per annum (6.26%) on March 5, 2008.
F-108
Table of Contents
The Company’s ability to draw upon the available commitments under the Revolver was subject to compliance with all of the covenants contained in the Credit Agreement and the Company’s continued ability to make certain representations and warranties. Among other things, these covenants imposed limits on annual capital expenditures (through 2010), provided that the Company’s net total funded debt ratio could not at any time exceed a specified amount and required that the Company maintained a minimum consolidated fixed charges coverage ratio. In addition, the Credit Agreement prohibited the Company from paying dividends (other than in its own shares or other equity securities) and from making certain other payments, including payments to acquire the Company’s equity securities other than under specified circumstances, which include the repurchase of the Company’s equity securities from employees and directors in an aggregate amount not to exceed $15.0. The Company obtained a waiver from the Lenders to effectuate the dividend paid in December 2010.
On September 26, 2008, the Company executed a joinder agreement to the Secured Credit Facility that added an additional lender and increased the amount of the Secured Credit Facility to $90.0 effective October 1, 2008; the Revolver increased to $27.0, the Term Loan increased to $36.0 and the available Delayed Draw Term Loan increased to $27.0. In connection with the joinder agreement, the Company paid a $0.45 fee at closing and an aggregate of $0.25 of advisory fees. The additional amount of the Term Loan of $12.0 was advanced on October 1, 2008.
Effective August 4, 2008, the Company entered into a swap arrangement under which it fixed its borrowing costs with respect to the $24.0 (original principal) Term Loan outstanding for three years at 3.65%, plus the applicable margin of 3.25%, which was reduced to 3.00% on September 30, 2008. On November 14, 2008, the Company entered into a swap arrangement under which it fixed its borrowing costs with respect to the additional $12.0 (original principal) under the Term Loan borrowed on October 1, 2008 for three years at 2.635% per annum, plus the applicable margin of 3.00%.
On June 29, 2009, the Company and the Lenders entered into an amendment to the Credit Agreement, which extended the availability of the Delayed Draw Term Loan commitments from June 30, 2009 to December 31, 2009, and provided for the reduction of these commitments by $0.81 on each of June 30, 2009, September 30, 2009 and December 31, 2009. In addition, the Company’s obligation to maintain a minimum balance of $20.0 in cash deposits at all times was eliminated.
On December 31, 2009, the Company borrowed $24.57 under the Delayed Draw Term Loan, which carried interest at 30 day LIBOR (0.25750% at December 31, 2010), plus the applicable margin of 3.00%. The Delayed Draw Term Loan provided for payment terms similar to the Term Loan.
The Term Loan provided for monthly payments of interest and quarterly installments of principal of $1.08, which commenced on June 30, 2009. The quarterly installment of principal increased to $1.89 beginning March 31, 2010 to take into consideration the Delayed Draw Term Loan repayment schedule. The aggregate quarterly principal repayment was scheduled to increase to $2.52 on June 30, 2012 with the balance of $32.76, plus accrued unpaid interest, due on February 28, 2013.
Additionally, the Company executed a $1.0 standby letter of credit in favor of the City of New York to secure the Company’s franchise agreement, which was collateralized by $1.0 of availability under the Revolver. The standby letter of credit, originally scheduled to expire May 1, 2010, was renewed and extended.
The Term Loan and the Delayed Draw Term Loan, plus accrued interest, totaling $49.9 were repaid on January 28, 2011 upon the closing of the $250 Million Secured Revolving Credit Facility. The standby letter of credit in favor of the City of New York was terminated in connection with the repayment and replaced by $1.0 standby letter of credit (secured by a $1.0 restricted cash balance) with a term scheduled to expire January 2013, subject to annual renewals at the Company’s option to January 2016.
F-109
Table of Contents
Obligation under Capital Lease
The Company is obligated under a capital lease for certain indefeasible rights-of-use, which is included as a network infrastructure asset in property and equipment, net.
At December 31, 2011, future minimum payments under the capital lease are as follows:
| Year |
Amount | |||
| 2012 |
$ | 0.3 | ||
| 2013 |
0.2 | |||
| 2014 |
0.3 | |||
| 2015 |
0.2 | |||
| 2016 |
0.3 | |||
| Thereafter |
0.2 | |||
|
|
|
|||
| Total minimum lease payments |
1.5 | |||
| Less: amount representing interest |
(0.3 | ) | ||
|
|
|
|||
| Obligation under capital lease |
1.2 | |||
| Less: current portion |
(0.2 | ) | ||
|
|
|
|||
| Total long-term obligation |
$ | 1.0 | ||
|
|
|
|||
The long-term portion is reported within “Other long-term liabilities.”
NOTE 10: SHAREHOLDERS’ EQUITY
Dividends
In November 2010, we obtained waivers from our lenders (Societe Generale, SunTrust Bank and CIT Lending Services Corporation) to permit a $5.00 per share dividend. On November 23, 2010, we announced that our Board of Directors declared a special one-time cash dividend of $5.00 per share on our common stock (the “Special Cash Dividend”). The Special Cash Dividend was paid on December 27, 2010 to the stockholders of record at the close of business on December 6, 2010. The aggregate amount of the payment made in connection with the Special Cash Dividend was approximately $129.0. On December 20, 2010, the Company’s Board of Directors granted restricted stock units (the “RSU Dividend”) to holders of unvested restricted stock units on the record date of the Special Cash Dividend in order to provide these holders with an amount that approximated the value of the Special Cash Dividend. In total, the Company granted 40,508 restricted stock units pursuant to the RSU Dividend, of which 1,246 restricted stock units vested in February 2011 based upon the achievement of certain performance targets established for fiscal year 2010, of which 28,656 restricted stock units vested on November 15, 2011, of which 9,360 vested on November 16, 2011 and of which 1,246 restricted stock units vested on February 10, 2012 based upon the determination by the Compensation Committee of the Board of Directors that certain performance targets established for fiscal year 2011 had been met.
Additionally, on December 20, 2010, the Company’s Board of Directors granted shares of common stock (the “Option Dividend”) to holders of vested unexercised options to purchase shares of common stock in order to provide these holders with an amount that approximated the value of the Special Cash Dividend. On December 27, 2010, the Company delivered 9,281 shares of common stock pursuant to the Option Dividend. Additionally, the Company paid cash to one former employee and to the estate of one deceased employee totaling $0.007. In the fourth quarter of 2010, the Company recorded stock-based compensation expense of $0.5 in connection with the Option Dividend.
F-110
Table of Contents
Stock Split
On August 3, 2009, the Board of Directors of the Company authorized a two-for-one common stock split, effected in the form of a 100% stock dividend, which was distributed on September 3, 2009. Each shareholder of record on August 20, 2009 received one additional share of common stock for each share of common stock held on that date. All share and per share information for prior periods, including warrants, options to purchase common shares, restricted stock units, warrant and option exercise prices, shares reserved under the 2003 Plan and the 2008 Plan, weighted average fair value of options granted, common stock and additional paid-in capital accounts on the consolidated balance sheets and consolidated statement of shareholders’ equity, have been retroactively adjusted, where applicable, to reflect the two-for-one stock split.
Amendment to the Company’s Amended and Restated Certificate of Incorporation
On June 24, 2010, the Company’s stockholders approved an amendment to the Company’s Amended and Restated Certificate of Incorporation (the “Amendment”) to increase the number of authorized shares of our common stock, par value $0.01 per share, from 30 million to 200 million. The number of authorized shares of preferred stock remained at 10 million.
The increase in the number of our authorized shares of common stock could have an anti-takeover effect by discouraging or hindering efforts to acquire control of the Company. The Company would be able to use the additional shares to oppose a hostile takeover attempt or delay or prevent changes in control or management of the Company. This was not the intent of the Board of Directors in adopting the Amendment, nor was the Amendment adopted in response to any known threat to acquire control of the Company.
The increase in the authorized shares of common stock became effective upon the filing of the Amendment with the Secretary of State of the State of Delaware on June 24, 2010.
Rights Agreement
On August 3, 2006, the Company entered into a Rights Agreement (the “Rights Agreement”) with American Stock Transfer & Trust Company, as rights agent, which was amended and restated on August 3, 2009 and subsequently amended as of January 26, 2010 (as amended, the “Amended and Restated Rights Agreement”). The Amended and Restated Rights Agreement was ratified by the Company’s stockholders at its annual meeting on June 24, 2010. As a result, the Rights (as defined below) under the Amended and Restated Rights Agreement will remain in effect until August 7, 2012, unless sooner terminated by the Company’s Board of Directors. The following description of the Amended and Restated Rights Agreement does not purport to be complete and is qualified in its entirety by reference to the Amended and Restated Rights Agreement included as Exhibit 4.1 to the Company’s Current Report on Form 8-K filed with the SEC on August 3, 2009, and the Amendment to Amended and Restated Rights Agreement, dated as of January 26, 2010, between AboveNet, Inc. and American Stock Transfer & Trust Company, LLC included as Exhibit 4.1 to the Company’s Current Report on Form 8-K filed with the SEC on January 28, 2010.
In connection with the initial Rights Agreement, the Company’s Board of Directors declared a dividend distribution of one preferred share purchase right (a “Right”) for each then outstanding share of the Company’s common stock, par value $0.01 per share (the “Common Shares”). The dividend was paid on August 7, 2006 to the stockholders of record on that date.
Until the earlier to occur of (i) the date that is 10 days following the date of a public announcement that a person, entity or group of affiliated or associated persons have acquired beneficial ownership of 15% or more of the outstanding Common Shares (an “Acquiring Person”) or (ii) 10 business days (or such later date as may be determined by action of the Company’s Board of Directors prior to such time as any person or entity becomes an Acquiring Person) following the commencement of, or announcement of an intention to commence, a tender offer or exchange offer the consummation of which would result in any person or entity becoming an Acquiring
F-111
Table of Contents
Person (the earlier of such dates being called the “Distribution Date”), the Rights will be evidenced by the Common Share certificates or book-entry shares.
The Rights are not exercisable until the Distribution Date. Each Right, upon becoming exercisable, will entitle the holder to purchase from the Company a specified fraction of a share of the Company’s Series A Junior Participating Preferred Stock (the “Preferred Shares”) at the then effective purchase price. The Rights will expire on August 7, 2012, unless earlier redeemed or exchanged.
The number of outstanding Rights and the number of Preferred Shares issuable upon exercise of the Rights are also subject to adjustment in the event of a stock split of the Common Shares or a stock dividend on the Common Shares payable in Common Shares or subdivisions, consolidation or combinations of the Common Shares occurring, in any case, prior to the Distribution Date. The purchase price payable and the number of preferred shares or other securities or other property issuable upon exercise of the Rights are subject to adjustment from time to time to prevent dilution as described in the Amended and Restated Rights Agreement. As a result of the Company’s stock split discussed above, appropriate adjustments under the Amended and Restated Rights Agreement have been made.
In the event that any person or group of affiliated or associated persons becomes an Acquiring Person, proper provision will be made so that each holder of a Right, other than Rights beneficially owned by the Acquiring Person and its associates and affiliates (which will thereafter be void), will have the right to receive upon exercise, in lieu of Preferred Shares, that number of Common Shares having a market value of two times the then effective exercise price of the Right (or, if such number of shares is not and cannot be authorized, the Company may issue preferred shares, cash, debt, stock or a combination thereof in exchange for the Rights).
In the event that the Company is acquired in a merger or other business combination transaction or 50% or more of its consolidated assets or earning power are sold to an Acquiring Person, its associates or affiliates or certain other persons, proper provision will be made so that each holder of a Right, other than Rights beneficially owned by the Acquiring Person and its associates and affiliates (which will thereafter be void), will thereafter have the right to receive, upon the exercise thereof at the then current exercise price of the Right, in lieu of Preferred Shares, that number of shares of common stock of the acquiring company, which at the time of such transaction will have a market value of two times the then effective exercise price per Right.
At any time after a person becomes an Acquiring Person and prior to the acquisition by such Acquiring Person of 50% or more of the outstanding Common Shares, the Company may exchange the Rights (other than Rights owned by such Acquiring Person or group which have become void), in whole or in part, at an exchange ratio of one share of common stock per Right (or, at the election of the Company, the Company may issue cash, debt, stock or a combination thereof in exchange for the Rights), subject to adjustment.
At any time prior to the earlier of (i) such time that a person has become an Acquiring Person or (ii) the final expiration date, the Company may redeem all, but not less than all, of the outstanding Rights at a price of $0.005 per Right (the “Redemption Price”). The Rights may also be redeemed at certain other times as described in the Amended and Restated Rights Agreement. Immediately upon any redemption of the Rights, the right to exercise the Rights will terminate and the only right of the holders of Rights will be to receive the Redemption Price.
The terms of the Rights may be amended by the Company’s Board of Directors without the consent of the holders of the Rights, except that from and after such time as the rights are distributed no such amendment may adversely affect the interest of the holders of the Rights other than the interests of an Acquiring Person or its affiliates or associates.
Until a Right is exercised, the holder thereof, as such, will have no rights as a stockholder of the Company, including, without limitation, the right to vote or to receive dividends.
F-112
Table of Contents
Repurchase Program
On December 7, 2011, the Board of Directors of the Company authorized a share repurchase program of up to $200.0 of the Company’s common stock through December 31, 2012 (the “Repurchase Program”). The Board also authorized management to enter into one or more prearranged stock repurchase plans under Rule 10b5-1 of the Securities Act of 1934 in connection with the Repurchase Program.
Through December 31, 2011, the Company purchased 29,457 shares pursuant to the Repurchase Program at a cost of $1.9. From January 1, 2012 through February 24, 2012, the Company purchased an additional 11,700 shares pursuant to the Repurchase Program at a cost of $0.8.
Stock Warrants
Under the Plan of Reorganization, unsecured note holder claims and general secured claims were settled, in part, by the distribution of the Five Year Warrants and the Seven Year Warrants. (See Note 1, “Background and Organization—Bankruptcy Filing and Reorganization.”)
The following table summarizes the activity for the Company’s warrants for the periods presented:
| Five Year Warrants |
Seven Year Warrants |
Weighted Average Warrant Exercise Price |
||||||||||
| Balance as of January 1, 2008 |
1,352,680 | 1,611,122 | $ | 11.08 | ||||||||
| Exercised |
(1,034,084 | ) | (27,240 | ) | $ | 10.05 | ||||||
| Exercised under the Net Exercise provisions of the Warrant Agreements |
(318,526 | )(1) | — | $ | 10.00 | |||||||
| Cancelled in connection with conclusion of the bankruptcy case |
(20 | ) | (24 | ) | $ | 11.09 | ||||||
| Cancelled in accordance with instructions from the warrant holders |
(50 | ) | — | $ | 10.00 | |||||||
|
|
|
|
|
|||||||||
| Balance as of December 31, 2008 |
— | 1,583,858 | $ | 12.00 | ||||||||
| Exercised |
— | (723,510 | ) | $ | 12.00 | |||||||
| Exercised under the Net Exercise provisions of the Warrant Agreements |
— | (1,816 | )(2) | $ | 12.00 | |||||||
| Cancelled |
— | (2 | ) | $ | 12.00 | |||||||
|
|
|
|
|
|||||||||
| Balance as of December 31, 2009 |
— | 858,530 | $ | 12.00 | ||||||||
| Exercised |
— | (416,842 | ) | $ | 12.00 | |||||||
| Exercised under the Net Exercise provisions of the Warrant Agreements |
— | (441,688 | )(3) | $ | 12.00 | |||||||
|
|
|
|
|
|||||||||
| Balance as of December 31, 2010 |
— | — | $ | — | ||||||||
|
|
|
|
|
|||||||||
(1) Includes 105,094 shares that were returned to treasury to settle the aggregate exercise price in connection with Net Exercises.
(2) Includes 476 shares that were returned to treasury to settle the aggregate exercise price in connection with Net Exercises.
(3) Includes 89,430 shares that were returned to treasury to settle the aggregate exercise price in connection with Net Exercises.
Under the terms of the Warrant Agreements described in Note 2, “Basis of Presentation and Significant Accounting Policies—Stock Warrants” if the market price of the Company’s common stock, as defined in the Warrant Agreements, 60 days prior to the expiration date of the respective warrants, was greater than the warrant exercise price, the Company was required to give each warrant holder notice that at the warrant expiration date, the warrants would be deemed to have been exercised pursuant to the net exercise provisions of the respective
F-113
Table of Contents
Warrant Agreements (the “Net Exercise”), unless the warrant holder elected, by written notice, to not exercise its warrants. Under the Net Exercise, shares issued to the warrant holders would be reduced by the number of shares necessary to cover the aggregate exercise price of the shares, valuing such shares at the current market price, as defined in the Warrant Agreements. Any fractional shares, otherwise issuable, would be paid in cash. Prior to the expiration date of the five year warrants, five year warrants to purchase 778 shares of common stock were exercised on a Net Exercise basis, resulting in the issuance of 520 common shares being issued and 258 common shares being returned to treasury. At September 8, 2008, the expiration date of the five year warrants, the required conditions were met for Net Exercise. Five year warrants to purchase 50 shares of common stock were cancelled in accordance with instructions from warrant holders. Additionally, five year warrants to purchase 317,748 shares of common stock were deemed exercised on a Net Exercise basis, of which 212,912 shares were issued to the warrant holders, an additional 104,836 shares were returned to treasury and $0.004 was paid to recipients for fractional shares.
At September 8, 2010, the expiration date of the seven year warrants, the required conditions were met for the Net Exercise and accordingly, seven year warrants to purchase 13,626 shares of common stock were exercised at expiration, of which 10,409 shares were issued to warrant holders and 3,217 shares were returned to treasury and $0.004 was paid to recipients for fractional shares. In total, seven year warrants to purchase 443,504 shares of common stock were deemed exercised on a net exercise basis, of which 353,598 shares were issued to the warrant holders, 89,906 shares were returned to treasury and $0.004 was paid to recipients for fractional shares. In addition, seven year warrants to purchase 26 shares of common stock were determined to be undeliverable and were cancelled.
NOTE 11: INCOME PER COMMON SHARE
Basic net income per common share is computed as net income divided by the weighted average number of common shares outstanding for the period. Total weighted average shares utilized in computing basic net income per common share were 25,902,123, 25,293,188 and 23,504,077 for the years ended December 31, 2011, 2010, and 2009, respectively. Total weighted average shares utilized in computing diluted net income per common share were 26,822,614, 26,242,696 and 25,468,405 for the years ended December 31, 2011, 2010, and 2009, respectively. Dilutive securities include options to purchase shares of common stock, restricted stock units and stock warrants. For the years ended December 31, 2011, 2009 and 2010, there were no potentially dilutive securities excluded from the calculation of diluted income per common share.
NOTE 12: STOCK-BASED COMPENSATION
2011 Equity Incentive Plan, 2008 Equity Incentive Plan and 2003 Plan
On May 11, 2011, the Board of Directors of the Company adopted the AboveNet, Inc. 2011 Equity Incentive Plan (the “2011 Plan”), which provides for the availability of a maximum of 1,600,000 shares of the Company’s common stock to be awarded to the Company’s employees (including officers), directors and consultants in the form of restricted stock unit awards, restricted stock awards, incentive stock options, non-qualified stock options, stock appreciation rights, performance-based awards and other stock- or cash-based awards. The 2011 Plan was approved by the Company’s stockholders at the Company’s 2011 annual meeting of stockholders held on June 23, 2011. The 2011 Plan will be administered by the Compensation Committee, which will, in its sole discretion, determine which individuals may participate in the 2011 Plan and the type, extent and terms of the awards to be granted. The number of shares available for grant and the terms of outstanding grants are subject to adjustment for stock splits, stock dividends and other capital adjustments. As of December 31, 2011, 396,200 common shares were reserved pursuant to outstanding restricted stock units and 1,203,800 common shares were available for future grants.
On August 29, 2008, the Board of Directors of the Company approved the Company’s 2008 Plan. The 2008 Plan is administered by the Company’s Compensation Committee. Any employee, officer, director or consultant of the Company or subsidiary of the Company selected by the Compensation Committee is eligible to receive
F-114
Table of Contents
awards under the 2008 Plan. Stock options, restricted and unrestricted stock, restricted and unrestricted stock units and stock appreciation rights may be awarded to eligible participants on a stand alone, combination or tandem basis. 1,500,000 shares of the Company’s common stock were initially reserved for issuance pursuant to awards granted under the 2008 Plan. The number of shares available for grant and the terms of outstanding grants are subject to adjustment for stock splits, stock dividends and other capital adjustments. Under the 2008 Plan, as of December 31, 2011, 940,418 common shares were issued pursuant to the delivery of vested restricted stock units (including shares repurchased by the Company), 3,288 common shares had been issued pursuant to the exercise of options to purchase shares of common stock, 9,281 common shares were issued pursuant to the Option Dividend on December 20, 2010, 403,196 common shares were reserved pursuant to outstanding restricted stock units, 6,712 common shares were reserved pursuant to outstanding options to purchase shares of common stock and 137,105 common shares were available for future grants.
On September 8, 2003, the 2003 Plan became effective. Under the 2003 Plan, the Company was authorized to issue, in the aggregate, share-based awards of up to 2,129,912 common shares to employees, directors and consultants who were selected to participate. The number of shares available for grant and the terms of outstanding grants are subject to adjustment for stock splits, stock dividends and other capital adjustments. Under the 2003 Plan, as of December 31, 2011, 1,169,432 common shares had been issued pursuant to vested restricted stock units (including shares repurchased by the Company), 850,643 common shares had been issued pursuant to options exercised to purchase common shares, 75,459 common shares were reserved pursuant to outstanding vested options to purchase shares of common stock and 34,378 common shares were cancelled. No shares are available for future grants under the 2003 Plan.
Stock-based compensation expense for each period presented relates to share-based awards granted under the Company’s 2011 Plan described above, the 2008 Plan described above and the Company’s 2003 Plan, as applicable, and reflects awards outstanding during the applicable period, including awards granted both prior to and during such period.
Stock Options
There were no options to purchase shares of common stock granted during the years ended December 31, 2011, 2010 and 2009.
The Company recognized non-cash stock-based compensation expense amounting to $0.2 for the year ended December 31, 2009 with respect to stock options granted, which had an effect of decreasing net income by $0.01 per basic common share and by $0.01 per diluted common share for the year ended December 31, 2009. There was no non-cash stock-based compensation expense recognized with respect to options to purchase shares of common stock during the years ended December 31, 2011 and 2010.
All such options are subject to forfeiture as specified in the respective award agreement.
F-115
Table of Contents
Information regarding options to purchase common stock granted, exercised and outstanding for the years ended December 31, 2011, 2010 and 2009 is summarized below:
| Number Outstanding |
Weighted Average Exercise Price Per Share |
Aggregate Intrinsic Value |
Weighted Average Grant Date Fair Value Per Share |
|||||||||||||
| Balance as of January 1, 2009 |
942,102 | $ | 13.84 | $ | 8.76 | |||||||||||
| Exercised |
(742,626 | ) | $ | 13.52 | $ | 8.62 | ||||||||||
| Forfeited |
(5,500 | ) | $ | 18.46 | $ | 12.09 | ||||||||||
|
|
|
|||||||||||||||
| Balance as of December 31, 2009 |
193,976 | $ | 14.93 | $ | 9.66 | |||||||||||
| Exercised |
(86,778 | ) | $ | 13.79 | $ | 8.91 | ||||||||||
| Forfeited |
(300 | ) | $ | 25.33 | $ | 16.99 | ||||||||||
|
|
|
|||||||||||||||
| Balance as of December 31, 2010 |
106,898 | $ | 15.83 | $ | 10.24 | |||||||||||
| Exercised |
(24,527 | ) | $ | 14.23 | $ | 9.28 | ||||||||||
| Forfeited |
(200 | ) | $ | 36.50 | $ | 24.58 | ||||||||||
|
|
|
|||||||||||||||
| Balance as of December 31, 2011 |
82,171 | $ | 16.25 | $ | 4.0 | $ | 10.50 | |||||||||
|
|
|
|
|
|||||||||||||
| Vested as of December 31, 2011 |
82,171 | $ | 16.25 | $ | 10.50 | |||||||||||
|
|
|
|||||||||||||||
| Exercisable as of December 31, 2011 |
82,171 | $ | 16.25 | $ | 4.0 | $ | 10.50 | |||||||||
|
|
|
|
|
|||||||||||||
The grant date fair value of vested options to purchase common stock was as follows at December 31:
| Number of Options to Purchase Common Stock Vested |
Total Grant Date Fair Value of Vested Options |
|||||||
| 2011 |
82,171 | $ | 0.9 | |||||
| 2010 |
106,898 | $ | 1.1 | |||||
| 2009 |
193,976 | $ | 1.9 | |||||
The aggregate grant date fair value of options to purchase shares of common stock that vested during the year ended December 31, 2009 was $0.2 (10,000 shares). No options to purchase shares of common stock vested during the years ended December 31, 2011 and 2010.
At December 31, 2010, all options to purchase shares of common stock were vested and, accordingly, the Company had no unearned stock-based compensation expense associated with options to purchase shares of common stock.
In November 2005, the FASB issued FASB Staff Position No. SFAS 123(R)-3, “Transition Election Related to Accounting for the Tax Effects of Share-Based Payment Awards.” The alternative transition method includes simplified methods to establish the beginning balance of the additional paid-in capital pool (“APIC Pool”) related to the tax effects of employee share-based compensation, and to determine the subsequent impact on the APIC Pool and consolidated statements of cash flows of the tax effects of employee share-based compensation awards that are outstanding upon adoption of SFAS No. 123(R). The Company has adopted this method and determined the APIC Pool to be $2.8. The Company reduced the APIC Pool by $0.1 in 2008 to reflect the tax effect of the delivery of common shares underlying restricted stock units in 2008. There were 24,527, 86,778 and 742,626 options to purchase common shares exercised in the years ended December 31, 2011, 2010 and 2009, respectively.
F-116
Table of Contents
The following table summarizes information concerning outstanding and exercisable options to purchase common stock at December 31, 2011:
| Exercise Prices |
Options Outstanding and Exercisable |
Weighted Average Remaining Contractual Life (Years) |
Weighted Average Exercise Price Per Share of Options Outstanding and Exercisable |
|||||||||
| $10.48 |
34,259 | 1.7 | $ | 10.48 | ||||||||
| $12.50 |
15,265 | 3.6 | $ | 12.50 | ||||||||
| $15.00 - $19.99 |
12,660 | 2.7 | $ | 16.42 | ||||||||
| $20.00 - $24.99 |
3,300 | 3.9 | $ | 20.00 | ||||||||
| $25.00 - $29.99 |
5,975 | 4.7 | $ | 27.52 | ||||||||
| $30.00 |
6,712 | 6.7 | $ | 30.00 | ||||||||
| $36.50 |
4,000 | 5.6 | $ | 36.50 | ||||||||
|
|
|
|||||||||||
| Total |
82,171 | 3.1 | $ | 16.25 | ||||||||
|
|
|
|||||||||||
Restricted Stock Units
On December 1, 2011, pursuant to the 2011 Plan, the Board of Directors of the Company awarded 381,200 restricted stock units to certain employees, including 3,000 each to the five non-employee members of the Board of Directors and an aggregate 152,000 restricted stock units to the Company’s named executive officers as follows:
| Name |
Total | |||
| William G. LaPerch |
65,000 | |||
| Rajiv Datta |
45,000 | |||
| Joseph P. Ciavarella |
21,000 | |||
| Robert Sokota |
21,000 | |||
The fair value of the grants was $59.49 per share, the closing price of the Company’s common stock on the New York Stock Exchange on that day. The restricted stock units are scheduled to vest 127,059, 127,059 and 127,082 on November 16, 2012, November 16, 2013 and November 16, 2014, respectively.
On August 26, 2011, pursuant to the 2011 Plan, the Board of Directors of the Company awarded 15,000 restricted stock units to a named executive officer. The fair value of the grant was $57.54 per share, the closing price of the Company’s common stock on the New York Stock Exchange on that day. The restricted stock units are scheduled to vest 10,000 shares on November 16, 2012 and 5,000 shares on November 16, 2013.
On January 25, 2011, pursuant to the 2008 Plan, the Company granted an aggregate 213,100 restricted stock units, of which 190,000 were granted to the Company’s named executive officers as follows (including the 15,000 restricted stock units granted to Mr. Datta in connection with his appointment as Chief Operating Officer):
| Name |
Total | |||
| William G. LaPerch |
65,000 | |||
| Rajiv Datta |
60,000 | |||
| Joseph P. Ciavarella |
21,000 | |||
| Robert Sokota |
21,000 | |||
| John Jacquay |
23,000 | |||
The fair value of each restricted stock unit granted was $59.25, the closing price of the Company’s common stock on the New York Stock Exchange on January 25, 2011. The 213,100 restricted stock units were originally
F-117
Table of Contents
scheduled to vest as follows: 15,000 on November 16, 2011, 132,066 on November 16, 2012 and 66,034 on November 16, 2013. Mr. Jacquay’s restricted stock units that were scheduled to vest in 2012 and 2013 were forfeited upon his resignation effective December 31, 2011. An additional 21,000 restricted stock units granted in 2011 were forfeited in 2011.
On December 20, 2010, pursuant to the 2008 Plan, the Company awarded 254,700 restricted stock units to certain employees and the non-employee members of the Board of Directors. The fair value of the grants was $56.82 per share, the closing price of the Company’s common stock on that day. 10,800 of these restricted stock units, granted to employees, vested on November 16, 2011. Of the balance of 243,900 restricted stock units (including 3,000 restricted stock units to each of the five non-employee members of the Board of Directors), 161,267 were originally scheduled to vest on November 16, 2012 and 82,633 are scheduled to vest on November 16, 2013. To date, 10,050 restricted stock units pursuant to this grant have been forfeited.
Additionally, on December 20, 2010, pursuant to the 2008 Plan, the Board of Directors of the Company awarded 40,508 restricted stock units pursuant to the RSU Dividend. 24,918 of such restricted stock units vested on November 15, 2011, 8,846 of such restricted stock units vested on November 16, 2011, 1,246 vested, along with 14,000 previously granted restricted stock units, in February 2011 based upon the attainment of certain performance-based metrics with respect to fiscal year 2010, 1,246 restricted stock units vested along with 14,000 previously granted restricted stock units, on February 10, 2012 based upon the determination by the Compensation Committee of the Board of Directors that certain performance targets established for fiscal year 2011 had been met, and 4,252 restricted stock units were forfeited.
On December 2, 2010, pursuant to the 2008 Plan, the Company awarded 5,900 restricted stock units (i.e., an agreement to provide common shares in the future) to certain employees. The fair value of the grant was $56.57 per share, the closing of the Company’s common stock on that day. Such restricted stock units vested on November 16, 2011.
On December 3, 2009, pursuant to the 2008 Plan, the Company awarded 182,700 restricted stock units, originally scheduled to vest on November 16, 2010, to certain employees and the non-employee members of the Board of Directors. The fair value of the grant was $53.90 per share, the closing price of the Company’s common stock on that day. 1,600 of these restricted stock units were accelerated and vested and delivered on October 25, 2010, 74,220 restricted stock units vested and were delivered on November 16, 2010, 93,690 restricted stock units vested and were delivered on November 16, 2011 and 13,190 restricted stock units were forfeited.
On September 8, 2011, 222,008 restricted stock units originally granted on September 8, 2008 vested. On November 15, 2011, 58,000 restricted stock units vested, 16,000 of which were granted on September 8, 2008 and 42,000 of which were granted on October 27, 2008. These restricted stock units were delivered on November 15, 2011. Additionally, 42,000 restricted stock units granted on September 8, 2008 and originally scheduled to vest on September 8, 2011 were forfeited in 2011.
The Company records as stock-based compensation expense, the fair value of restricted stock units awarded as of the grant date, ratably over the vesting period. The Company recognized non-cash stock-based compensation expense amounting to $24.3, $11.9 and $9.5 for the years ended December 31, 2011, 2010 and 2009, respectively, with respect to restricted stock units awarded, which had the effect of decreasing net income by $0.56 per basic common share and by $0.54 per diluted common share for the year ended December 31, 2011, $0.28 per basic common share and $0.27 per diluted common share for the year ended December 31, 2010 and $0.40 per basic common share and $0.37 per diluted common share for the year ended December 31, 2009.
F-118
Table of Contents
The following schedule summarizes the activity for the Company’s “Restricted Stock Units” for the periods presented.
| Number of Restricted Stock Units |
Weighted Average Grant Date Fair Market Value |
|||||||
| Balance as of January 1, 2009 |
1,016,700 | $ | 31.65 | |||||
| Granted |
182,700 | $ | 53.90 | |||||
| Issued |
(584,362 | ) | $ | 34.35 | ||||
| Forfeited |
(2,666 | ) | $ | 30.00 | ||||
|
|
|
|||||||
| Balance as of December 31, 2009 |
612,372 | $ | 36.29 | |||||
| Restricted stock units previously granted, which were earned based on the achievement of certain performance targets for fiscal 2009 and included in Issued below |
14,000 | $ | 20.00 | |||||
| Granted(1) |
315,108 | $ | 57.09 | |||||
| Issued |
(192,148 | ) | $ | 38.32 | ||||
| Forfeited |
(12,736 | ) | $ | 57.67 | ||||
|
|
|
|||||||
| Balance as of December 31, 2010(2) |
736,596 | $ | 44.22 | |||||
| Granted(3) |
623,300 | $ | 59.48 | |||||
| Issued |
(454,408 | ) | $ | 38.98 | ||||
| Forfeited |
(106,092 | ) | $ | 47.05 | ||||
|
|
|
|||||||
| Balance as of December 31, 2011 |
799,396 | $ | 57.59 | |||||
|
|
|
|||||||
(1) Includes 14,000 restricted stock units previously granted and 1,246 granted pursuant to the RSU Dividend, which vested in 2011 based on the achievement of certain performance targets established in February 2010 for fiscal 2010. Also includes another 1,246 restricted stock units granted pursuant to the RSU Dividend, which vested in February 2012 based upon the achievement of certain performance targets established in February 2011 for fiscal 2011.
(2) Excludes 14,000 restricted stock units previously granted, which vested in 2012 based on the achievement of certain performance targets established in February 2011 for fiscal 2011. These 14,000 restricted stock units are referenced in footnote (3) below.
(3) Includes the 14,000 restricted stock units previously granted, which vested in 2012 based on the achievement of certain performance targets established in February 2011 for fiscal 2011.
The Company had $22.8, $8.1 and $2.1 of unearned stock-based compensation expense associated with the expected future vesting of the restricted stock unit awards outstanding at December 31, 2011, which is expected to be recognized in 2012, 2013 and 2014, respectively.
2010 Employee Stock Purchase Plan
On June 24, 2010, the Company’s stockholders approved the AboveNet, Inc. 2010 Employee Stock Purchase Plan, which was adopted by the Board of Directors on April 28, 2010 (as amended, the “Stock Purchase Plan”). The Stock Purchase Plan is administered by the Compensation Committee of the Board of Directors. The aggregate number of shares of common stock that may be issued pursuant to the Stock Purchase Plan is 300,000, subject to increase or decrease by reason of stock splits, reclassifications, stock dividends, or similar corporate events as determined by the Compensation Committee.
Eligibility and Participation
All employees of the Company, or any of its designated subsidiaries, who have completed at least ninety (90) days of employment on or before the first day of the applicable offering period are eligible to participate in the Stock Purchase Plan, subject to certain limitations imposed by the Internal Revenue Code and certain other
F-119
Table of Contents
limitations set forth in the Stock Purchase Plan. An employee may not participate in the Stock Purchase Plan if, immediately after he or she joined, he or she would own stock and/or hold rights to purchase stock possessing 5% or more of the total combined voting power or value of all classes of stock of the Company or of any subsidiary of the Company. Officers of the Company that are subject to the reporting requirements of Section 16(a) under the Securities Exchange Act of 1934 (“Section 16 Officers”) are also not eligible to participate. The Stock Purchase Plan also limits an employee’s rights to purchase stock under all employee stock purchase plans (those subject to Section 423 of the Internal Revenue Code) of the Company and its subsidiaries so that such rights may not accrue at a rate that exceeds $0.025 of fair market value of such stock (determined as of the first day of the offering period) for each calendar year in which such right to purchase stock is outstanding at any time. In addition, no employee may purchase more than 200 shares of common stock under the Stock Purchase Plan in any offering period. Employees may withdraw from the Stock Purchase Plan at any time prior to the end of the then current offering period. As of December 31, 2011, we had a total of approximately 700 employees who were eligible to participate in the Stock Purchase Plan.
Offering Periods; Purchase Price
The Stock Purchase Plan operates by a series of offering periods of approximately 10 months in duration commencing on each January 16 and ending on November 15 (except that the 2010 offering period was from September 1, 2010 to November 15, 2010). The purchases are made for participants at the end of each offering period by applying payroll deductions accumulated over the course of the offering period towards such purchases. The payroll deductions accumulated over the course of the offering period are included in “Accrued expenses” in the Company’s consolidated balance sheet. The price at which these purchases will be made will equal 85% of the lesser of the fair market value of the common stock as of the first day of the offering period or the fair market value on the last day of the offering period.
Offering Periods
108 employees participated in the January 16, 2011 to November 15, 2011 offering period. Payroll withholdings to make purchases were $0.6 over the 2011 offering period. 86 employees participated in the September 1, 2010 to November 15, 2010 offering pursuant to which $0.2 was withheld over the 2010 offering period. The Company follows FASB Technical Bulletin No. 97-1, “Accounting under Statement 123 for Certain Employee Stock Purchase Plans with a Look-Back Option,” (now known as FASB ASC 718) and SFAS No. 123(R) (also now known as FASB ASC 718) to account for the Stock Purchase Plan. Because the Stock Purchase Plan provides for a discount greater than 5%, it is a compensatory plan and qualifies for fair value accounting. Accordingly, the fair market value of the grant is calculated as of the grant date in accordance with SFAS No. 123(R). Additionally, the fair value of the look-back option is calculated on a similar basis. The Company also estimates future forfeitures (withdrawals) from the Stock Purchase Plan as provided under FASB ASC 718. The Company recognized non-cash stock-based compensation expense with respect to the Stock Purchase Plan of $0.12 for the year ended December 31, 2011. The Company issued 12,288 shares with respect to the 2011 Offering Period. Stock-based compensation expense recognized with respect to the Stock Purchase Plan in the year ended December 31, 2010 was $0.02. The Company issued 4,414 common shares with respect to the 2010 offering period.
F-120
Table of Contents
NOTE 13: OTHER (EXPENSE) INCOME, NET
Other income (expense), net consists of the following:
| Years Ended December 31, | ||||||||||||
| 2011 | 2010 | 2009 | ||||||||||
| Settlement of interest rate swap agreements and write-off of unamortized debt issuance costs associated with the repayment of amounts due under the Secured Credit Facility |
$ | (1.6 | ) | $ | — | $ | — | |||||
| (Loss) gain on foreign currency |
(0.4 | ) | (0.6 | ) | 1.9 | |||||||
| (Loss) on sale or disposition of property and equipment |
(0.2 | ) | (0.2 | ) | (1.3 | ) | ||||||
| Gain on settlement or reversal of liabilities(*) |
0.4 | 2.2 | 2.9 | |||||||||
| Gain on recovery of property taxes previously paid |
0.4 | — | — | |||||||||
| Gain on settlement of insurance claim |
0.1 | 0.3 | — | |||||||||
| Other |
0.3 | 0.3 | 0.1 | |||||||||
|
|
|
|
|
|
|
|||||||
| Total |
$ | (1.0 | ) | $ | 2.0 | $ | 3.6 | |||||
|
|
|
|
|
|
|
|||||||
(*) Represents the reversal of certain transaction tax liabilities resulting primarily from the expiration of statute of limitations.
NOTE 14: COMMITMENTS AND CONTINGENCIES
The Company has commitments under various non-cancelable operating leases for office and equipment space, equipment rentals, right-of-way contracts, building access, franchise fees and network capacity contracts with terms expiring through 2030. The Company has various sublet arrangements with third parties. Estimated future payments, net of receipts with respect to these contractual obligations are as follows:
| 2012 |
$ | 69.6 | ||
| 2013 |
48.1 | |||
| 2014 |
36.3 | |||
| 2015 |
31.8 | |||
| 2016 |
28.3 | |||
| Thereafter |
145.8 | |||
|
|
|
|||
| Total |
$ | 359.9 | ||
|
|
|
Rent expense, which is a component of the above table, was $36.1, $35.0 and $33.2 for the years ended December 31, 2011, 2010 and 2009, respectively, which is net of sublease rents of $1.5, $1.2 and $2.2 for the respective years. Rent expense reflected is also net of the amortization of deferred fair value rent liability, which represents the difference between the present value of the contractual obligations under the leases in place as of the fresh start date and the fair market value of such obligations. The Company recorded $0.6, $0.8 and $1.2 in the years ended December 31, 2011, 2010 and 2009, respectively, as reductions to rent expense. At December 31, 2011 and 2010, the deferred fair value rent liability was $1.1 and $1.5, respectively, of which $0.6 is included in accrued expenses at both dates, and $0.5 and $0.9, respectively, are included in other long-term liabilities on the related consolidated balance sheets.
At December 31, 2011, the Company had commitments for customer build-outs and infrastructure totaling $17.7.
Appointment of Chief Operating Officer
On January 25, 2011, the Board of Directors of the Company appointed Rajiv Datta, its Senior Vice President and Chief Technology Officer, as the Company’s Chief Operating Officer. In connection with this appointment,
F-121
Table of Contents
the Company’s Board of Directors approved the increase in Mr. Datta’s annual base salary from $0.3 to $0.4 and made a special grant to Mr. Datta of 15,000 restricted stock units, all of which vested and were delivered on November 16, 2011.
Employment Contracts
The Company maintains employment agreements with its key executives. The agreements include, among other things, certain change in control and severance provisions.
In September 2008, the Company entered into new employment agreements with each of William G. LaPerch, Chief Executive Officer and President; Mr. Datta; John Jacquay, Senior Vice President, Sales and Marketing and Robert Sokota, Senior Vice President and General Counsel (collectively with Mr. Joseph P. Ciavarella described below, the “Named Executive Officers”). Each of the contracts provides for a base rate of compensation, which may increase (but cannot decrease) during the term of the contract. Additionally, each contract provides for incentive cash bonus targets for each of the Named Executive Officers. Each of the Named Executive Officers will generally be entitled to the same benefits offered to the Company’s other executives. Each of the employment contracts provides for the payment of severance and the provision of certain other benefits in connection with certain termination events. The employment contracts also include confidentiality, non-compete and assignment of intellectual property covenants by each of the Named Executive Officers.
In October 2008, the Company entered into an employment agreement with Mr. Joseph P. Ciavarella under which Mr. Ciavarella agreed to become the Company’s Senior Vice President and Chief Financial Officer. The employment agreement is on substantially the same general terms as the September 2008 employment agreements described above.
The employment agreements were amended effective as of January 25, 2011. These amendments (a) extend the term of each Named Executive Officer’s employment agreement from November 16, 2011 through December 31, 2011, subject to automatic extensions for additional one-year periods unless cancelled by any of the Named Executive Officers or the Company in writing at least 120 days prior to the end of the applicable term, and (b) clarify that if the Named Executive Officer is employed by the Company on December 31 of the calendar year in which a bonus is being earned, the Named Executive Officer would be entitled to receive any bonus payable for that year. Mr. Datta’s employment agreement was also amended to reflect his new title and base salary. The employment agreements with each of Messrs. Ciavarella, Jacquay and Sokota were also amended to clarify that if so determined in the discretion of the Company’s Chief Executive Officer, such officer would report to the Company’s Chief Operating Officer. As of September 4, 2011, the employment agreements with each of Messrs. LaPerch, Datta, Ciavarella and Sokota automatically renewed for one year terms until December 31, 2012.
On April 27, 2011, the Company and John Jacquay, the Company’s Senior Vice President for Sales and Marketing, agreed that Mr. Jacquay would resign from his position as Senior Vice President of Sales and Marketing as of July 15, 2011. Mr. Jacquay continued to be employed by the Company and provided services on other projects through December 31, 2011, the expiration date of his employment agreement with the Company (the “Contract Expiration Date”), at which time he separated from the Company. In connection with his separation from the Company on the Contract Expiration Date, Mr. Jacquay forfeited any unvested stock units held by him as of that date. The Company and Mr. Jacquay also agreed that his bonus target amount for 2011 would be $0.3.
On July 25, 2011, the Company entered into an employment agreement with Mr. Nicholas Ridolfi under which Mr. Ridolfi agreed to become the Company’s Senior Vice President for Sales. The employment agreement provides for an annual base salary of $0.25, a target bonus of $0.1 for 2011 and $0.25 for 2012, and a term extending to December 31, 2012. Mr. Ridolfi’s employment agreement provides for the payment of severance in connection with certain termination events and includes confidentiality, non-compete and assignment of intellectual property covenants.
F-122
Table of Contents
Effective November 30, 2011, the Company and each of William G. LaPerch (Chief Executive Officer and President), Rajiv Datta (Chief Operating Officer), Joseph P. Ciavarella (Senior Vice President and Chief Financial Officer) and Robert Sokota (Senior Vice President and General Counsel) entered into amendments to their respective employment agreements providing for the extension of the termination date from December 31, 2012 to December 31, 2013. No other changes to these employment agreements were effected. Each of these employment agreements currently provides that its term shall be automatically extended, unless sooner terminated as provided therein, for successive additional one-year periods, unless at least 120 days prior to the end of the term, the Company or the respective executive has notified the other that the term will not be extended.
Internal Revenue Service
In September 2008, the Company was notified by the Internal Revenue Service (the “IRS”) that it was reclassifying certain individuals, classified by the Company as independent contractors, to employees and, accordingly, assessing certain payroll taxes and penalties totaling $0.3. The Company disputed this position citing relief provided by IRC Section 530 and IRC Section 3509. On January 13, 2009, the IRS made a settlement offer to the Company, which the Company executed on March 10, 2009 and the IRS countersigned on May 11, 2009. Under the terms of the settlement agreement, the Company agreed to pay $0.015 to the IRS to fully discharge any federal employment tax liability it may have owed for 2005. The IRS agreed not to dispute the classification of “such workers” for federal employment tax purposes for any period from January 1, 2005 to March 31, 2009. Beginning April 1, 2009, the Company agreed to treat “Consultants,” as described in the settlement agreement, who perform equivalent duties as employees of the Company as employees. Finally, the Company agreed to extend the statute of limitations with respect to federal employment tax payments for the period covered by the settlement agreement (January 1, 2005 to March 31, 2009) to April 1, 2012.
New York City Franchise Agreement
As a result of certain ongoing litigation with a third party, for several years, the Department of Information Technology and Telecommunications of the City of New York (“DOITT”) suspended any discussions regarding renewals of telecommunications franchises in the City of New York. As a result, it is the Company’s understanding that DOITT has not renewed any recently expired franchise agreement, including the Company’s franchise agreement which expired on December 20, 2008. Prior to the expiration of the Company’s franchise agreement, the Company sought out and received written confirmation from DOITT that the Company’s franchise agreement provides a basis for the Company to continue to operate in the City of New York pending conclusion of renewal discussions. The Company believes that a number of other operators in the City of New York are operating on a similar basis.
DOITT recently issued a solicitation for bids for franchises authorizing the installation of landline facilities in the City of New York’s right-of-way for the provision of information services and telecommunication services. Based on the Company’s review of the solicitation and its discussion with officials for DOITT, the Company understands that franchises to be issued in connection with the solicitation will replace the existing broadband franchise for services providers in the City of New York. The fees for providers proposed in the solicitation are substantially higher than the franchise fees paid by the Company. The Company plans to submit an application for a franchise under such solicitation.
Capital Investments and Network Expansion
The Company, from time to time, commits capital for, among other things, (i) customer capital (to connect customers to the network); (ii) expansion and improvement of infrastructure; and (iii) equipment. The Company also commits capital for investments in selected markets. In 2010, the Company incurred expenses to open up Denver as a market and expand into Paris, Amsterdam and Frankfurt in Europe. Additionally, the Company connected Miami to its long haul network and received a favorable ruling from the Canadian authorities regarding its ability to lease and light fiber for its operations in Toronto. The Company intends to open Toronto
F-123
Table of Contents
as a market in 2012. The Company may increase its presence in these markets or the Company may develop other markets in the U.S. or internationally. The Company believes it has the liquidity/capacity to execute such plans.
Environmental Protection Agency Obligations
The Company recently became aware of certain reports that the Environmental Protection Agency (the “EPA”) requires the Company to file. The reports relate to the storage of sulfuric acid, fuel and lead by the Company. The rules governing the EPA reporting provide for penalties for failure to timely file these reports. The rules include provisions that allow companies to voluntarily disclose the failure to file and potentially mitigate penalties otherwise due. The Company has disclosed to the EPA its failure to file in the past and has subsequently made the required filings. The Company believes that under these rules, it can mitigate substantially all of the penalties. Accordingly, the consolidated financial statements included herein do not include an accrual for such penalties as of and for the period ended December 31, 2011.
Lease Amendment
On June 24, 2011, the Company, as lessee, entered into the Fourth Amendment to Lease originally dated April 23, 1999 (the “Lease Amendment”) with respect to the facilities leased by the Company for one of its main POP locations. Under the terms of the Lease Amendment, the expiration date of the lease for a portion of the space was extended from September 30, 2014 to September 30, 2029. Simultaneously, the Company entered into an amendment to a coterminous sublease (the “Sublease”) for a portion of the space extending its term out to September 29, 2029. Under the terms of the Lease Amendment, the Company is obligated for rents aggregating $29.4 commencing October 1, 2014. The sublease provides for sublease rents aggregating $12.0 over the same period. The effect of the Lease Amendment and the sublease renewal is to increase net rent expense from $0.4 per annum to $1.0 per annum, beginning June 2011. Additionally, pursuant to the Lease Amendment, the Company agreed to surrender a portion of the space originally leased through September 30, 2014 in exchange for a release of any remaining financial obligations with respect to such space. The Company vacated this space on September 30, 2011, at which time the Company recorded a gain of $0.2. On June 30, 2011, the Company entered into a ten year lease for replacement space, which provides for rent of $0.6 per annum for the first five years and $0.7 per annum for the second five years of the term. During the term of this lease, the landlord will provide a four month rent holiday and a $0.6 improvement allowance.
NOTE 15: LITIGATION
The Company is subject to various legal proceedings and claims which arise in the normal course of business. The Company evaluates, among other things, the degree of probability of an unfavorable outcome and ability to estimate the amount of potential loss. We do not anticipate that the outcome of such matters (or the other matters described below) will have a material adverse effect on our business, financial condition or results of operations.
Global Voice Networks Limited (“GVN”)
AboveNet Communications UK Limited, the Company’s U.K. operating subsidiary (“ACUK”), was a party to a duct purchase and fiber lease agreement (the “Duct Purchase Agreement”) with EU Networks Fiber UK Ltd, formerly GVN. A dispute between the parties arose regarding the extent of the network duct that was sold and fiber that was leased to GVN pursuant to the Duct Purchase Agreement. As a result of this dispute, in 2006, GVN filed a claim against ACUK in the High Court of Justice in London seeking ownership of the disputed portion of the network duct, the right to lease certain fiber and associated damages. In December 2007, the court ruled in favor of GVN with respect to the disputed duct and fiber. In early February 2008, ACUK delivered most of the disputed duct and fiber to GVN. Additionally, under the original ruling, the Company was also required to construct the balance of the disputed duct and fiber and deliver it to GVN pursuant to a schedule ordered by the court. Additional portions of the disputed duct and fiber were constructed and subsequently delivered and other
F-124
Table of Contents
portions are scheduled for delivery. The Company also had certain repair and maintenance obligations that it must perform with respect to such duct. GVN was also seeking to enforce an option requiring ACUK to construct 180 to 200 chambers for GVN along the network. In June 2008, the Company paid $3.0 in damages pursuant to the liability trial. Additionally, the Company reimbursed GVN $1.8 for legal fees. Additionally, the Company’s legal fees aggregated $2.4. Further, the Company has incurred or is obligated for costs totaling $2.7 to build additional network. In early August 2008, the Company reached a settlement agreement under which the Company paid GVN $0.6 and agreed to provide additional construction of duct at an estimated cost of $1.2 and provide GVN limited additional access to ACUK’s network. GVN and ACUK provided mutual releases of all claims against each other, including ACUK’s repair obligation and chamber construction obligations discussed above. The Company recorded a loss on litigation of $11.7 at December 31, 2007. Through December 31, 2010, the Company paid $10.9 in connection with this litigation. During 2010, the Company recorded an additional provision of $0.9 to record additional expenses for repairs covered by the settlement. The obligations were denominated in British pounds, and accordingly, the amounts have been adjusted for changes in currency translation rates as appropriate. The Company has a remaining accrual balance of $0.7 relating to this litigation included in the Company’s consolidated balance sheets at both December 31, 2011 and 2010.
Employment Contract Termination
On July 11, 2011, the Company terminated the employment of Douglas Jendras, its former Senior Vice President of Operations. On August 3, 2011, Mr. Jendras filed a complaint in the United States District Court for the Southern District of New York alleging breach of his employment contract and seeking damages of $0.4 for salary and benefits and approximately $4.6 and specific performance with respect to 66,738 restricted stock units that were cancelled in connection with the termination of Mr. Jendras’ employment, plus recovery of legal fees and costs, and punitive damages. On September 30, 2011, the Company filed an answer to the complaint. The Company believes it has meritorious defenses that it intends to pursue vigorously.
From time to time, other legal matters in which the Company may be named as a defendant arise in the normal course of its business activities. The resolution of these legal matters against the Company cannot be accurately predicted. The Company does not anticipate that the outcome of such matters (or the other matters described above) will have a material adverse effect on its business, financial condition or results of operations.
NOTE 16: RELATED PARTY TRANSACTIONS
A member of the Company’s Board of Directors, Richard Postma, is also the Co-Chairman, Chief Executive Officer and co-founder of a telecommunications company. The Company sold services and/or material in the normal course of business to this telecommunications company in the amount of $0.44, $0.39 and $0.35 in the years ended December 31, 2011, 2010 and 2009, respectively. No amounts were outstanding at each of December 31, 2011 and December 31, 2010. Mr. Postma also serves as the Chief Executive Officer of and holds a minority ownership interest in a construction company. The Company purchased certain installation and construction services totaling $0.002 in 2010 and $0.03 in 2009 from such construction firm. The Company had no purchases from such construction firm in 2011. All activities between the Company and these entities were conducted as independent arms length transactions consistent with similar terms and circumstances with any other customers or vendors. All accounts between the two parties are settled in accordance with invoice terms.
NOTE 17: SEGMENT REPORTING
SFAS No. 131, “Disclosures about Segments of an Enterprise and Related Information,” (now known as FASB ASC 280-10), defines operating segments as components of an enterprise for which separate financial information is available and which is evaluated regularly by the Company’s chief operating decision maker in deciding how to assess performance and allocate resources. The Company operates its business as one operating segment.
F-125
Table of Contents
Geographic Information
Below is the Company’s revenue based on the location of its entity providing service. Long-lived assets are based on the physical location of the assets. The following table presents revenue and long-lived asset information for geographic areas:
| Years Ended December 31, | ||||||||||||
| 2011 | 2010 | 2009 | ||||||||||
| Revenue |
||||||||||||
| United States |
$ | 428.5 | $ | 372.8 | $ | 328.0 | ||||||
| United Kingdom and Others |
51.3 | 42.6 | 35.9 | |||||||||
| Eliminations |
(7.3 | ) | (5.7 | ) | (3.8 | ) | ||||||
|
|
|
|
|
|
|
|||||||
| Consolidated Worldwide |
$ | 472.5 | $ | 409.7 | $ | 360.1 | ||||||
|
|
|
|
|
|
|
|||||||
| December 31, | ||||||||
| 2011 | 2010 | |||||||
| Long-lived assets |
||||||||
| United States |
$ | 561.7 | $ | 502.9 | ||||
| United Kingdom and Others |
49.8 | 37.9 | ||||||
|
|
|
|
|
|||||
| Consolidated Worldwide |
$ | 611.5 | $ | 540.8 | ||||
|
|
|
|
|
|||||
NOTE 18: QUARTERLY FINANCIAL DATA (UNAUDITED)
The following table presents the unaudited quarterly consolidated results for the year ended December 31, 2011.
| 2011 Quarter Ended | ||||||||||||||||
| March 31 | June 30 | September 30 | December 31 | |||||||||||||
| Revenue |
$ | 114.4 | $ | 118.3 | $ | 118.2 | $ | 121.6 | ||||||||
| Costs of revenue |
40.2 | 40.7 | (1) | 37.8 | 44.0 | (2) | ||||||||||
| Selling, general and administrative expenses |
29.8 | 30.4 | 30.1 | 26.1 | ||||||||||||
| Depreciation and amortization |
18.3 | 19.2 | 18.9 | 18.9 | ||||||||||||
|
|
|
|
|
|
|
|
|
|||||||||
| Operating income |
26.1 | 28.0 | 31.4 | 32.6 | ||||||||||||
| Other income (expense): |
||||||||||||||||
| Interest income |
— | — | 0.1 | — | ||||||||||||
| Interest expense |
(1.2 | ) | (1.1 | ) | (1.2 | ) | (1.0 | ) | ||||||||
| Other (expense) income, net |
(0.7 | ) | 0.3 | (0.1 | ) | (0.5 | ) | |||||||||
|
|
|
|
|
|
|
|
|
|||||||||
| Income before income taxes |
24.2 | 27.2 | 30.2 | 31.1 | ||||||||||||
| Provision for income taxes |
9.7 | 11.1 | 12.2 | 7.0 | (3) | |||||||||||
|
|
|
|
|
|
|
|
|
|||||||||
| Net income |
$ | 14.5 | $ | 16.1 | $ | 18.0 | $ | 24.1 | ||||||||
|
|
|
|
|
|
|
|
|
|||||||||
| Basic net income per share |
$ | 0.56 | $ | 0.63 | $ | 0.69 | $ | 0.93 | ||||||||
|
|
|
|
|
|
|
|
|
|||||||||
| Weighted average number of common shares |
25,803,904 | 25,818,689 | 25,821,643 | 26,161,213 | ||||||||||||
|
|
|
|
|
|
|
|
|
|||||||||
| Diluted net income per share |
$ | 0.54 | $ | 0.60 | $ | 0.67 | $ | 0.90 | ||||||||
|
|
|
|
|
|
|
|
|
|||||||||
| Weighted average number of common shares |
26,772,811 | 26,837,305 | 26,776,938 | 26,902,481 | ||||||||||||
|
|
|
|
|
|
|
|
|
|||||||||
F-126
Table of Contents
Fluctuations in revenue reported by period were impacted by contract termination revenue recognized by quarter as follows:
| Quarter ended March 31, 2011 |
$ | 2.1 | ||
| Quarter ended June 30, 2011 |
$ | 1.0 | ||
| Quarter ended September 30, 2011 |
$ | 0.8 | ||
| Quarter ended December 31, 2011 |
$ | 0.5 |
(1) Includes provision for equipment impairment of $0.1.
(2) Includes provisions for equipment impairment totaling $1.1.
(3) During the fourth quarter of 2011, based upon the Company’s review of its profitability in the U.K. and internal financial forecasts demonstrating its expected capacity to utilize deferred tax assets, the Company reduced the valuation allowance by $9.1 with respect to deferred tax assets associated with its U.K. operations, which was comprised of a $9.2 tax benefit recognized, partially offset by $0.1 due to foreign currency translation.
The following table presents the unaudited quarterly consolidated results for the year ended December 31, 2010.
| 2010 Quarter Ended | ||||||||||||||||
| March 31 | June 30 | September 30 | December 31 | |||||||||||||
| Revenue |
$ | 97.2 | $ | 100.7 | $ | 103.7 | $ | 108.1 | ||||||||
| Costs of revenue |
33.1 | 34.1 | (1) | 35.7 | (2) | 39.9 | (3) | |||||||||
| Selling, general and administrative expenses |
23.6 | 23.0 | 23.1 | 26.9 | ||||||||||||
| Depreciation and amortization |
15.5 | 15.2 | 15.8 | 16.8 | ||||||||||||
|
|
|
|
|
|
|
|
|
|||||||||
| Operating income |
25.0 | 28.4 | 29.1 | 24.5 | ||||||||||||
| Other income (expense): |
||||||||||||||||
| Interest income |
— | — | 0.1 | — | ||||||||||||
| Interest expense |
(1.2 | ) | (1.2 | ) | (1.3 | ) | (1.5 | ) | ||||||||
| Other (expense) income, net |
(0.6 | ) | 0.2 | 1.0 | 1.4 | |||||||||||
|
|
|
|
|
|
|
|
|
|||||||||
| Income before income taxes |
23.2 | 27.4 | 28.9 | 24.4 | ||||||||||||
| Provision for income taxes |
9.6 | 11.1 | 11.7 | 2.1 | (4) | |||||||||||
|
|
|
|
|
|
|
|
|
|||||||||
| Net income |
$ | 13.6 | $ | 16.3 | $ | 17.2 | $ | 22.3 | ||||||||
|
|
|
|
|
|
|
|
|
|||||||||
| Basic net income per share |
$ | 0.55 | $ | 0.64 | $ | 0.68 | $ | 0.87 | ||||||||
|
|
|
|
|
|
|
|
|
|||||||||
| Weighted average number of common shares |
24,944,514 | 25,145,224 | 25,340,842 | 25,732,982 | ||||||||||||
|
|
|
|
|
|
|
|
|
|||||||||
| Diluted net income per share |
$ | 0.52 | $ | 0.62 | $ | 0.66 | $ | 0.85 | ||||||||
|
|
|
|
|
|
|
|
|
|||||||||
| Weighted average number of common shares |
26,218,755 | 26,194,883 | 26,249,408 | 26,288,375 | ||||||||||||
|
|
|
|
|
|
|
|
|
|||||||||
Fluctuations in revenue reported by period were impacted by contract termination revenue recognized by quarter as follows:
| Quarter ended March 31, 2010 |
$ | 1.0 | ||
| Quarter ended June 30, 2010 |
$ | 0.6 | ||
| Quarter ended September 30, 2010 |
$ | 0.7 | ||
| Quarter ended December 31, 2010 |
$ | 0.4 |
(1) Includes provision for equipment impairment of $0.2.
(2) Includes provision for equipment impairment of $0.2.
(3) Includes provision for impairment of $1.6.
(4) During the fourth quarter of 2010, based upon the Company’s review of its profitability in the U.K. and internal financial forecasts demonstrating its expected capacity to utilize deferred tax assets, the Company reduced the valuation allowance by $7.7 with respect to deferred tax assets associated with its U.K. operations, which was comprised of a $7.3 tax benefit recognized, $1.0 attributable to the reduction in U.K. tax rates, partially offset by $0.6 due to foreign currency translation.
F-127
Table of Contents
NOTE 19: MERGER AGREEMENT WITH ZAYO GROUP, LLC
On March 18, 2012, the Company entered into an Agreement and Plan of Merger (the “Merger Agreement”) with Zayo Group, LLC, a Delaware limited liability company (“Parent”), and Voila Sub, Inc., a Delaware corporation and a wholly owned subsidiary of Parent (“Merger Sub”), providing for the merger of Merger Sub with and into the Company (the “Merger”), with the Company surviving the Merger as a wholly owned subsidiary of Parent. The Merger Agreement was unanimously approved by the Company’s Board of Directors.
On July 2, 2012, the Company completed the Merger.
At the effective time of the Merger, each share of Common Stock issued and outstanding immediately prior to the effective time (other than shares (i) held in the Company’s treasury or held by any wholly-owned subsidiary of the Company, (ii) owned by Parent, Merger Sub or any wholly-owned subsidiary of Parent, or (iii) owned by stockholders who have perfected and not withdrawn a demand for appraisal rights under Delaware law) was automatically cancelled and converted into the right to receive $84.00 in cash (the “Per Share Amount”), without interest, on the terms and subject to the conditions set forth in the Merger Agreement.
At the effective time of the Merger, (i) each outstanding option to purchase Common Stock, whether vested or unvested, was converted into cash equal to the amount (if any) by which the Per Share Amount exceeds the exercise price payable under that option, (ii) each outstanding restricted stock unit issued by the Company, whether vested or unvested, was converted into cash equal to the number of shares of the Common Stock subject to that restricted stock unit multiplied by the Per Share Amount, and (iii) each participant in the Stock Purchase Plan was paid an amount equal to the product of (x) the amount, if any, by which the Per Share Amount exceeds the applicable exercise price and (y) the number of shares of the Common Stock the participant purchased with his or her accumulated payroll deductions as of the business day immediately prior to the closing of the Merger at the applicable exercise price.
Prior to approving the transaction contemplated by the Merger Agreement, the Company’s Board of Directors received fairness opinions from its financial advisors. In connection with these fairness opinions, the Company recorded $3.5, which was included in “Prepaid costs and other current assets” in the Company’s consolidated balance sheet at March 31, 2012, and was recognized in the Company’s consolidated statement of operations during the three months ended June 30, 2012.
NOTE 20. CONDENSED CONSOLIDATING FINANCIAL INFORMATION
Upon Zayo Group LLC’s acquisition of the Company, the Company’s domestic restricted subsidiaries became guarantors of Zayo Group LLC’s Secured Notes. Effective July 2, 2012, each of the Company’s subsidiary guarantors were 100% owned by Zayo Group LLC. Zayo Group LLC’s Senior Secured Notes are fully and unconditionally guaranteed, jointly and severally, on a senior secured basis by its current and future domestic restricted subsidiaries, inclusive of AboveNet’s domestic subsidiaries as of July 2, 2012.
There are no significant restrictions on the ability of the Company or any of its subsidiaries to obtain funds from or provide funds to the other via dividends or loans.
The accompanying condensed consolidating financial information has been prepared and presented pursuant to SEC Regulation S-X Rule 3-10, “Financial Statements of Guarantors and Issuers of Guaranteed Securities Registered or Being Registered.”
The following supplemental tables present condensed consolidating balance sheets for the Company and its subsidiary guarantors as of December 31, 2011, the condensed consolidating statements of operations for the year ended December 31, 2011, and the condensed consolidating statements of cash flows for the year ended December 31, 2011.
F-128
Table of Contents
CONDENSED CONSOLIDATING BALANCE SHEETS
DECEMBER 31, 2011
(in millions)
| AboveNet, Inc. | Guarantor subsidiaries |
Other non- guarantor subsidiaries |
Eliminations | Total | ||||||||||||||||
| ASSETS: |
||||||||||||||||||||
| Current assets: |
||||||||||||||||||||
| Cash and cash equivalents |
$ | — | $ | 112.5 | $ | 5.9 | $ | — | $ | 118.4 | ||||||||||
| Restricted cash and cash equivalents |
— | 4.6 | 0.1 | — | 4.7 | |||||||||||||||
| Accounts receivable, net |
— | 31.5 | 4.2 | — | 35.7 | |||||||||||||||
| Prepaid costs and other current assets |
— | 12.2 | 2.0 | — | 14.2 | |||||||||||||||
| Due from affiliates—current |
— | 8.8 | — | (8.8 | ) | — | ||||||||||||||
|
|
|
|
|
|
|
|
|
|
|
|||||||||||
| Total current assets |
— | 169.6 | 12.2 | (8.8 | ) | 173.0 | ||||||||||||||
| Property and equipment, net |
— | 561.7 | 49.8 | — | 611.5 | |||||||||||||||
| Deferred tax assets |
— | 96.8 | 13.9 | — | 110.7 | |||||||||||||||
| Due from affiliates—non-current |
— | 20.9 | (20.9 | ) | — | |||||||||||||||
| Investment in subsidiaries |
647.9 | 23.1 | — | (671.0 | ) | — | ||||||||||||||
| Other assets |
— | 14.4 | 1.4 | — | 15.8 | |||||||||||||||
|
|
|
|
|
|
|
|
|
|
|
|||||||||||
| Total assets |
$ | 647.9 | $ | 886.5 | $ | 77.3 | $ | (700.7 | ) | $ | 911.0 | |||||||||
|
|
|
|
|
|
|
|
|
|
|
|||||||||||
| LIABILITIES: |
||||||||||||||||||||
| Current liabilities: |
||||||||||||||||||||
| Accounts payable |
$ | — | $ | 10.1 | $ | 0.6 | $ | — | $ | 10.7 | ||||||||||
| Accrued expenses |
— | 64.5 | 12.3 | — | 76.8 | |||||||||||||||
| Deferred revenue—current |
— | 25.8 | 4.2 | — | 30.0 | |||||||||||||||
| Due to affiliates—current |
— | — | 8.8 | (8.8 | ) | — | ||||||||||||||
|
|
|
|
|
|
|
|
|
|
|
|||||||||||
| Total current liabilities |
— | 100.4 | 25.9 | (8.8 | ) | 117.5 | ||||||||||||||
| Note payable |
— | 55.0 | — | — | 55.0 | |||||||||||||||
| Deferred revenue |
— | 71.9 | 7.4 | — | 79.3 | |||||||||||||||
| Due to affiliates—non-current |
— | — | 20.9 | (20.9 | ) | — | ||||||||||||||
| Other long-term liabilities |
— | 11.3 | — | — | 11.3 | |||||||||||||||
|
|
|
|
|
|
|
|
|
|
|
|||||||||||
| Total liabilities |
— | 238.6 | 54.2 | (29.7 | ) | 263.1 | ||||||||||||||
|
|
|
|
|
|
|
|
|
|
|
|||||||||||
| Commitments and contingencies |
||||||||||||||||||||
| SHAREHOLDERS’ EQUITY: |
||||||||||||||||||||
| Total shareholders’ equity |
647.9 | 647.9 | 23.1 | (671.0 | ) | 647.9 | ||||||||||||||
|
|
|
|
|
|
|
|
|
|
|
|||||||||||
| Total liabilities and shareholders’ equity |
$ | 647.9 | $ | 886.5 | $ | 77.3 | $ | (700.7 | ) | $ | 911.0 | |||||||||
|
|
|
|
|
|
|
|
|
|
|
|||||||||||
F-129
Table of Contents
CONDENSED CONSOLIDATING STATEMENT OF OPERATIONS
YEAR ENDED DECEMBER 31, 2011
(in millions)
| AboveNet, Inc. | Guarantor subsidiaries |
Other non- guarantor subsidiaries |
Eliminations | Total | ||||||||||||||||
| Revenue |
$ | — | $ | 428.5 | $ | 44.9 | $ | (0.9 | ) | $ | 472.5 | |||||||||
| Costs of revenue, excluding depreciation and amortization |
— | 150.1 | 13.5 | (0.9 | ) | 162.7 | ||||||||||||||
| Selling, general and administrative expenses |
— | 102.2 | 14.2 | — | 116.4 | |||||||||||||||
| Depreciation and amortization |
— | 67.2 | 8.1 | — | 75.3 | |||||||||||||||
|
|
|
|
|
|
|
|
|
|
|
|||||||||||
| Operating income |
— | 109.0 | 9.1 | — | 118.1 | |||||||||||||||
| Other income (expense): |
||||||||||||||||||||
| Interest expense |
— | (4.5 | ) | (0.4 | ) | 0.4 | (4.5 | ) | ||||||||||||
| Equity in net earnings/(loss) of subsidiaries |
72.7 | — | — | (72.7 | ) | — | ||||||||||||||
| Other income (expense), net |
— | (0.2 | ) | (0.3 | ) | (0.4 | ) | (0.9 | ) | |||||||||||
|
|
|
|
|
|
|
|
|
|
|
|||||||||||
| Income before income taxes |
72.7 | 104.3 | 8.4 | (72.7 | ) | 112.7 | ||||||||||||||
| Provision/(benefit) for income taxes |
— | 46.1 | (6.1 | ) | — | 40.0 | ||||||||||||||
|
|
|
|
|
|
|
|
|
|
|
|||||||||||
| Net income |
72.7 | 58.2 | 14.5 | (72.7 | ) | 72.7 | ||||||||||||||
| Other comprehensive income, net of income taxes |
(0.4 | ) | 0.6 | — | (0.6 | ) | (0.4 | ) | ||||||||||||
|
|
|
|
|
|
|
|
|
|
|
|||||||||||
| Comprehensive income |
$ | 72.3 | $ | 58.8 | $ | 14.5 | $ | (73.3 | ) | $ | 72.3 | |||||||||
|
|
|
|
|
|
|
|
|
|
|
|||||||||||
F-130
Table of Contents
CONDENSED CONSOLIDATING STATEMENT OF CASH FLOWS
YEAR ENDED DECEMBER 31, 2011
(in millions)
| AboveNet, Inc. | Guarantor subsidiaries |
Other non- guarantor subsidiaries |
Eliminations | Total | ||||||||||||||||
| Cash flows provided by operating activities: |
$ | — | $ | 191.4 | $ | 15.5 | $ | — | $ | 206.9 | ||||||||||
|
|
|
|
|
|
|
|
|
|
|
|||||||||||
| Cash flows used in investing activities: |
||||||||||||||||||||
| Proceeds from sales of property and equipment |
— | 0.1 | — | — | 0.1 | |||||||||||||||
| Purchases of property and equipment |
— | (123.5 | ) | (24.3 | ) | — | (147.8 | ) | ||||||||||||
|
|
|
|
|
|
|
|
|
|
|
|||||||||||
| Net cash used in investing activities |
— | (123.4 | ) | (24.3 | ) | — | (147.7 | ) | ||||||||||||
|
|
|
|
|
|
|
|
|
|
|
|||||||||||
| Cash flows used in financing activities: |
||||||||||||||||||||
| Proceeds from exercise of options to purchase shares of common stock |
— | 0.3 | — | — | 0.3 | |||||||||||||||
| Proceeds from issuance of stock pursuant to the employee stock purchase plan |
— | 0.6 | — | — | 0.6 | |||||||||||||||
| Change in restricted cash and cash equivalents |
— | (1.1 | ) | 0.1 | — | (1.0 | ) | |||||||||||||
| Purchase of treasury stock |
— | (2.2 | ) | — | — | (2.2 | ) | |||||||||||||
| Principal payment—capital lease obligation |
— | (0.2 | ) | — | — | (0.2 | ) | |||||||||||||
| Proceeds from borrowing under $250 Million Secured Revolving Credit Facility, net of certain debt issuance costs |
— | 50.0 | — | — | 50.0 | |||||||||||||||
| Debt issuance costs |
— | (0.5 | ) | — | — | (0.5 | ) | |||||||||||||
| Principal payment—note payable |
— | (49.7 | ) | — | — | (49.7 | ) | |||||||||||||
| Loan to subsidiary |
— | (3.6 | ) | 3.6 | — | — | ||||||||||||||
|
|
|
|
|
|
|
|
|
|
|
|||||||||||
| Net cash (used in)/provided by financing activities |
— | (6.4 | ) | 3.7 | — | (2.7 | ) | |||||||||||||
|
|
|
|
|
|
|
|
|
|
|
|||||||||||
| Effect of exchange rates on cash |
— | — | 0.3 | — | 0.3 | |||||||||||||||
|
|
|
|
|
|
|
|
|
|
|
|||||||||||
| Net increase/(decrease) in cash and cash equivalents |
— | 61.6 | (4.8 | ) | — | 56.8 | ||||||||||||||
| Cash and cash equivalents, beginning of period |
— | 50.9 | 10.7 | — | 61.6 | |||||||||||||||
|
|
|
|
|
|
|
|
|
|
|
|||||||||||
| Cash and cash equivalents, end of period |
$ | — | $ | 112.5 | $ | 5.9 | $ | — | $ | 118.4 | ||||||||||
|
|
|
|
|
|
|
|
|
|
|
|||||||||||
F-131
Table of Contents
ABOVENET, INC.
UNAUDITED CONSOLIDATED FINANCIAL STATEMENTS
F-132
Table of Contents
ABOVENET, INC. AND SUBSIDIARIES
CONSOLIDATED BALANCE SHEETS
(in millions, except share and per share information)
| June 30, 2012 |
December 31, 2011 |
|||||||
| (Unaudited) | ||||||||
| ASSETS: |
||||||||
| Current assets: |
||||||||
| Cash and cash equivalents |
$ | 142.5 | $ | 118.4 | ||||
| Restricted cash and cash equivalents |
3.8 | 4.7 | ||||||
| Accounts receivable, net of allowances for doubtful accounts of $2.6 at June 30, 2012 and December 31, 2011 |
35.6 | 35.7 | ||||||
| Prepaid costs and other current assets |
17.6 | 14.2 | ||||||
|
|
|
|
|
|||||
| Total current assets |
199.5 | 173.0 | ||||||
| Property and equipment, net of accumulated depreciation and amortization of $389.7 and $353.9 at June 30, 2012 and December 31, 2011, respectively |
643.1 | 611.5 | ||||||
| Deferred tax assets |
90.9 | 110.7 | ||||||
| Other assets |
14.6 | 15.8 | ||||||
|
|
|
|
|
|||||
| Total assets |
$ | 948.1 | $ | 911.0 | ||||
|
|
|
|
|
|||||
| LIABILITIES: |
||||||||
| Current liabilities: |
||||||||
| Accounts payable |
$ | 11.9 | $ | 10.7 | ||||
| Accrued expenses |
72.8 | 76.8 | ||||||
| Deferred revenue—current portion |
28.7 | 30.0 | ||||||
|
|
|
|
|
|||||
| Total current liabilities |
113.4 | 117.5 | ||||||
| Note payable |
55.0 | 55.0 | ||||||
| Deferred revenue |
75.3 | 79.3 | ||||||
| Other long-term liabilities |
13.3 | 11.3 | ||||||
|
|
|
|
|
|||||
| Total liabilities |
257.0 | 263.1 | ||||||
|
|
|
|
|
|||||
| Commitments and contingencies |
||||||||
| SHAREHOLDERS’ EQUITY: |
||||||||
| Preferred stock, 9,500,000 shares authorized, $0.01 par value, none issued or outstanding |
— | — | ||||||
| Junior preferred stock, 500,000 shares authorized, $0.01 par value, none issued or outstanding |
— | — | ||||||
| Common stock, 200,000,000 shares authorized, $0.01 par value, 26,944,850 issued and 26,272,242 outstanding at June 30, 2012 and 26,914,108 issued and 26,255,173 outstanding at December 31, 2011 |
0.3 | 0.3 | ||||||
| Additional paid-in capital |
371.1 | 357.7 | ||||||
| Treasury stock at cost, 672,608 and 658,935 shares at June 30, 2012 and December 31, 2011, respectively |
(25.9 | ) | (25.0 | ) | ||||
| Accumulated other comprehensive loss |
(9.1 | ) | (9.6 | ) | ||||
| Retained earnings |
354.7 | 324.5 | ||||||
|
|
|
|
|
|||||
| Total shareholders’ equity |
691.1 | 647.9 | ||||||
|
|
|
|
|
|||||
| Total liabilities and shareholders’ equity |
$ | 948.1 | $ | 911.0 | ||||
|
|
|
|
|
|||||
The accompanying notes are an integral part of these consolidated financial statements.
F-133
Table of Contents
ABOVENET, INC. AND SUBSIDIARIES
CONSOLIDATED STATEMENTS OF OPERATIONS
(in millions, except share and per share information)
(Unaudited)
| Three Months Ended June 30, | Six Months Ended June 30, | |||||||||||||||
| 2012 | 2011 | 2012 | 2011 | |||||||||||||
| Revenue |
$ | 129.0 | $ | 118.3 | $ | 256.7 | $ | 232.7 | ||||||||
| Costs of revenue (excluding depreciation and amortization, shown separately below, and including provisions for impairment of $0.1 for the three months ended June 30, 2011 and $0.1 for each of the six months ended June 30, 2012 and 2011) |
43.6 | 40.7 | 87.5 | 80.9 | ||||||||||||
| Selling, general and administrative expenses |
41.8 | 30.4 | 73.8 | 60.2 | ||||||||||||
| Depreciation and amortization |
21.7 | 19.2 | 42.4 | 37.5 | ||||||||||||
|
|
|
|
|
|
|
|
|
|||||||||
| Operating income |
21.9 | 28.0 | 53.0 | 54.1 | ||||||||||||
| Other income (expense): |
||||||||||||||||
| Interest expense |
(1.1 | ) | (1.1 | ) | (2.2 | ) | (2.3 | ) | ||||||||
| Other (expense) income, net |
(0.1 | ) | 0.3 | 0.7 | (0.4 | ) | ||||||||||
|
|
|
|
|
|
|
|
|
|||||||||
| Income before income taxes |
20.7 | 27.2 | 51.5 | 51.4 | ||||||||||||
| Provision for income taxes |
8.9 | 11.1 | 21.3 | 20.8 | ||||||||||||
|
|
|
|
|
|
|
|
|
|||||||||
| Net income |
$ | 11.8 | $ | 16.1 | $ | 30.2 | $ | 30.6 | ||||||||
|
|
|
|
|
|
|
|
|
|||||||||
| Income per share, basic: |
||||||||||||||||
| Basic net income per share |
$ | 0.45 | $ | 0.63 | $ | 1.15 | $ | 1.19 | ||||||||
|
|
|
|
|
|
|
|
|
|||||||||
| Weighted average number of common shares |
26,282,486 | 25,818,689 | 26,270,912 | 25,811,337 | ||||||||||||
|
|
|
|
|
|
|
|
|
|||||||||
| Income per share, diluted: |
||||||||||||||||
| Diluted net income per share |
$ | 0.43 | $ | 0.60 | $ | 1.11 | $ | 1.14 | ||||||||
|
|
|
|
|
|
|
|
|
|||||||||
| Weighted average number of common shares |
27,114,859 | 26,837,305 | 27,110,795 | 26,805,236 | ||||||||||||
|
|
|
|
|
|
|
|
|
|||||||||
The accompanying notes are an integral part of these consolidated financial statements.
F-134
Table of Contents
ABOVENET, INC. AND SUBSIDIARIES
CONSOLIDATED STATEMENTS OF COMPREHENSIVE INCOME
(in millions)
(Unaudited)
| Three Months Ended June 30, | Six Months Ended June 30, | |||||||||||||||
| 2012 | 2011 | 2012 | 2011 | |||||||||||||
| Net income |
$ | 11.8 | $ | 16.1 | $ | 30.2 | $ | 30.6 | ||||||||
| Foreign currency translation adjustments |
(1.0 | ) | (0.1 | ) | 0.5 | 0.5 | ||||||||||
| Change in fair value of interest rate swap contracts upon settlement |
— | — | — | 0.6 | ||||||||||||
|
|
|
|
|
|
|
|
|
|||||||||
| Comprehensive income |
$ | 10.8 | $ | 16.0 | $ | 30.7 | $ | 31.7 | ||||||||
|
|
|
|
|
|
|
|
|
|||||||||
The accompanying notes are an integral part of these consolidated financial statements.
F-135
Table of Contents
ABOVENET, INC. AND SUBSIDIARIES
CONSOLIDATED STATEMENT OF SHAREHOLDERS’ EQUITY
(in millions, except share information)
(Unaudited)
| Common Stock | Treasury Stock | Other Shareholders’ Equity | ||||||||||||||||||||||||||||||
| Shares | Amount | Shares | Amount | Additional Paid-in Capital |
Accumulated Other Comprehensive Loss |
Retained Earnings |
Total Shareholders’ Equity |
|||||||||||||||||||||||||
| Balance at January 1, 2012 |
26,914,108 | $ | 0.3 | 658,935 | $ | (25.0 | ) | $ | 357.7 | $ | (9.6 | ) | $ | 324.5 | $ | 647.9 | ||||||||||||||||
| Issuance of common stock from vested restricted stock |
17,219 | — | — | — | — | — | — | — | ||||||||||||||||||||||||
| Issuance of common stock from exercise of options to purchase shares of common stock |
13,523 | — | — | — | 0.2 | — | — | 0.2 | ||||||||||||||||||||||||
| Purchase of treasury stock |
— | — | 1,973 | (0.1 | ) | — | — | — | (0.1 | ) | ||||||||||||||||||||||
| Purchase of common stock pursuant to the Repurchase Program |
— | — | 11,700 | (0.8 | ) | — | — | — | (0.8 | ) | ||||||||||||||||||||||
| Foreign currency translation adjustments |
— | — | — | — | — | 0.5 | — | 0.5 | ||||||||||||||||||||||||
| Amortization of stock-based compensation expense for restricted stock units |
— | — | — | — | 13.1 | — | — | 13.1 | ||||||||||||||||||||||||
| Amortization of stock-based compensation expense for employee stock purchase plan |
— | — | — | — | 0.1 | — | — | 0.1 | ||||||||||||||||||||||||
| Net income |
— | — | — | — | — | — | 30.2 | 30.2 | ||||||||||||||||||||||||
|
|
|
|
|
|
|
|
|
|
|
|
|
|
|
|
|
|||||||||||||||||
| Balance at June 30, 2012 |
26,944,850 | $ | 0.3 | 672,608 | $ | (25.9 | ) | $ | 371.1 | $ | (9.1 | ) | $ | 354.7 | $ | 691.1 | ||||||||||||||||
|
|
|
|
|
|
|
|
|
|
|
|
|
|
|
|
|
|||||||||||||||||
The accompanying notes are an integral part of these consolidated financial statements.
F-136
Table of Contents
ABOVENET, INC. AND SUBSIDIARIES
CONSOLIDATED STATEMENTS OF CASH FLOWS
(in millions)
(Unaudited)
| Six Months Ended June 30, | ||||||||
| 2012 | 2011 | |||||||
| Cash flows provided by operating activities: |
||||||||
| Net income |
$ | 30.2 | $ | 30.6 | ||||
| Adjustments to reconcile net income to net cash provided by operations: |
||||||||
| Depreciation and amortization |
42.4 | 37.5 | ||||||
| Loss on sale or disposition of property and equipment, net |
0.2 | 0.1 | ||||||
| Provisions for impairment and asset abandonment |
4.5 | 0.1 | ||||||
| Non-cash stock-based compensation expense for restricted stock units |
13.1 | 13.8 | ||||||
| Non-cash stock-based compensation expense for employee stock purchase plan |
0.1 | 0.1 | ||||||
| Provision for bad debts |
0.5 | 0.3 | ||||||
| Change in deferred tax assets |
19.3 | 20.3 | ||||||
| Changes in operating working capital: |
||||||||
| Accounts receivable |
(0.4 | ) | (2.3 | ) | ||||
| Prepaid costs and other current assets |
(3.5 | ) | 2.6 | |||||
| Other assets |
1.1 | 2.1 | ||||||
| Accounts payable |
1.7 | 3.0 | ||||||
| Accrued expenses |
(3.0 | ) | 2.4 | |||||
| Deferred revenue |
(5.3 | ) | (6.9 | ) | ||||
| Other long-term liabilities |
1.6 | 0.6 | ||||||
|
|
|
|
|
|||||
| Net cash provided by operating activities |
102.5 | 104.3 | ||||||
|
|
|
|
|
|||||
| Cash flows used in investing activities: |
||||||||
| Proceeds from sales of property and equipment |
0.4 | 0.1 | ||||||
| Purchases of property and equipment |
(79.5 | ) | (68.4 | ) | ||||
|
|
|
|
|
|||||
| Net cash used in investing activities |
(79.1 | ) | (68.3 | ) | ||||
|
|
|
|
|
|||||
| Cash flows used in financing activities: |
||||||||
| Proceeds from exercise of options to purchase shares of common stock |
0.2 | 0.2 | ||||||
| Change in restricted cash and cash equivalents |
0.9 | (1.0 | ) | |||||
| Purchase of treasury stock |
(0.9 | ) | (0.3 | ) | ||||
| Principal payment—capital lease obligation |
(0.2 | ) | (0.2 | ) | ||||
| Proceeds from borrowing under $250 Million Secured Revolving Credit Facility, net of certain debt issuance costs |
— | 50.0 | ||||||
| Debt issuance costs |
— | (0.5 | ) | |||||
| Principal payment—note payable |
— | (49.7 | ) | |||||
|
|
|
|
|
|||||
| Net cash used in financing activities |
— | (1.5 | ) | |||||
|
|
|
|
|
|||||
| Effect of exchange rates on cash |
0.7 | 0.3 | ||||||
|
|
|
|
|
|||||
| Net increase in cash and cash equivalents |
24.1 | 34.8 | ||||||
| Cash and cash equivalents, beginning of period |
118.4 | 61.6 | ||||||
|
|
|
|
|
|||||
| Cash and cash equivalents, end of period |
$ | 142.5 | $ | 96.4 | ||||
|
|
|
|
|
|||||
| Supplemental cash flow information: |
||||||||
| Cash paid for interest |
$ | 0.9 | $ | 1.1 | ||||
|
|
|
|
|
|||||
| Cash paid for income taxes |
$ | 2.5 | $ | 1.3 | ||||
|
|
|
|
|
|||||
The accompanying notes are an integral part of these consolidated financial statements.
F-137
Table of Contents
ABOVENET, INC. AND SUBSIDIARIES
NOTES TO UNAUDITED CONSOLIDATED FINANCIAL STATEMENTS
(in millions, except share and per share information)
NOTE 1: BACKGROUND AND ORGANIZATION
AboveNet, Inc. (which together with its subsidiaries is sometimes hereinafter referred to as the “Company,” “AboveNet,” “we,” “us,” “our” or “our Company”) is a facilities-based provider of technologically advanced, high-bandwidth, fiber optic communications infrastructure and co-location services to communications carriers and corporate and government customers, principally in the United States (“U.S.”) and Europe.
NOTE 2: BASIS OF PRESENTATION AND SIGNIFICANT ACCOUNTING POLICIES
A summary of the basis of presentation and the significant accounting policies followed in the preparation of these consolidated financial statements is as follows:
Stock Split
On August 3, 2009, the Board of Directors of the Company authorized a two-for-one split of the Company’s common stock, par value $0.01 per share (the “Common Stock”), effected in the form of a 100% stock dividend, which was distributed on September 3, 2009. Each shareholder of record on August 20, 2009 received one additional share of Common Stock for each share of Common Stock held on that date. All share and per share information for prior periods, including warrants, options to purchase Common Stock, restricted stock units, warrant and option exercise prices, shares reserved under the Company’s 2003 Incentive Stock Option and Stock Unit Grant Plan (the “2003 Plan”) and the Company’s 2008 Equity Incentive Plan (the “2008 Plan”), weighted average fair value of options granted, Common Stock and additional paid-in capital accounts on the consolidated balance sheets and consolidated statement of shareholders’ equity, have been retroactively adjusted, where applicable, to reflect the two-for-one stock split.
Basis of Presentation and Use of Estimates
The accompanying consolidated financial statements have been prepared in accordance with accounting principles generally accepted in the U.S. (“U.S. GAAP”) and pursuant to the rules and regulations of the Securities and Exchange Commission (the “SEC”). These consolidated financial statements include the accounts of the Company, as applicable. They do not include all of the information and footnotes required by U.S. GAAP for complete financial statements. In the opinion of management, all adjustments (consisting of normal recurring accruals) considered necessary for a fair presentation have been included. These unaudited consolidated financial statements should be read in conjunction with the Company’s consolidated financial statements and related notes included in the Company’s Annual Report on Form 10-K for the fiscal year ended December 31, 2011. Operating results for the six months ended June 30, 2012 are not necessarily indicative of the results that may be expected for the year ending December 31, 2012.
The preparation of consolidated financial statements in conformity with U.S. GAAP requires management to make estimates and assumptions that affect the reported amounts of assets and liabilities as of the date of the consolidated financial statements, the disclosure of contingent assets and liabilities in the consolidated financial statements and the accompanying notes and the reported amounts of revenue and expenses during the periods presented. The estimates the Company makes are based on historical factors, current circumstances and the experience and judgment of the Company’s management. The Company evaluates its assumptions and estimates on an ongoing basis and may employ outside experts to assist in the Company’s evaluations. Actual amounts and results could differ from such estimates due to subsequent events which could have a material effect on the Company’s financial statements covering future periods.
F-138
Table of Contents
Principles of Consolidation
The consolidated financial statements include the accounts of the Company, and its wholly-owned subsidiaries. Consolidation is generally required for investments of more than 50% of the outstanding voting stock of an investee, except when control is not held by the majority owner. All significant intercompany accounts and transactions have been eliminated in consolidation.
Revenue Recognition
The Company follows SEC Staff Accounting Bulletin (“SAB”) No. 101, “Revenue Recognition in Financial Statements,” (now known as FASB ASC 605-10), as amended by SEC SAB No. 104, “Revenue Recognition,” (also now known as FASB ASC 605-10).
Revenue derived from leasing fiber optic telecommunications infrastructure and the provision of telecommunications and co-location services is recognized as services are provided. Non-refundable payments received from customers before the relevant criteria for revenue recognition are satisfied are included in deferred revenue in the accompanying consolidated balance sheets and are subsequently amortized into income over the fixed contract term.
Prior to October 1, 2009, the Company generally amortized revenue related to installation services on a straight-line basis over the contracted customer relationship (two to twenty years). In the fourth quarter of 2009, the Company completed a study of its historic customer relationship period. As a result, commencing October 1, 2009, the Company began amortizing revenue related to installation services on a straight-line basis generally over the estimated customer relationship period (generally ranging from three to twenty years).
Contract termination revenue is recognized when a customer discontinues service prior to the end of the contract period for which the Company had previously received consideration and for which revenue recognition was deferred. Contract termination revenue is also recognized when customers have made early termination payments to the Company to settle contractually committed purchase amounts that the customer no longer expects to meet or when the Company renegotiates or discontinues a contract with a customer and as a result is no longer obligated to provide services for consideration previously received and for which revenue recognition has been deferred. Additionally, the Company includes receipts of bankruptcy claim settlements from former customers as contract termination revenue when received. Contract termination revenue amounted to $0.7 and $1.0 in the three months ended June 30, 2012 and 2011, respectively, and $1.4 and $3.1 in the six months ended June 30, 2012 and 2011, respectively.
Non-Monetary Transactions
The Company may exchange capacity with other capacity or service providers. In December 2004, the FASB issued Statement of Financial Accounting Standards (“SFAS”) No. 153, “Exchanges of Nonmonetary Assets—An Amendment of APB Opinion No. 29,” (“SFAS No. 153”), (now known as FASB ASC 845-10). SFAS No. 153 amends Accounting Principles Board Opinion No. 29, “Accounting for Nonmonetary Transactions,” (“APB No. 29”) (also now known as FASB ASC 845-10) to eliminate the exception for nonmonetary exchanges of similar productive assets and replaces it with a general exception for exchanges of nonmonetary assets that do not have commercial substance. SFAS No. 153 is to be applied prospectively for nonmonetary exchanges occurring in fiscal periods beginning after June 15, 2005. The Company’s adoption of SFAS No. 153 on July 1, 2005 did not have a material effect on the consolidated financial position or results of operations of the Company. Prior to the Company’s adoption of SFAS No. 153, nonmonetary transactions were accounted for in accordance with APB No. 29, where an exchange for similar capacity is recorded at a historical carryover basis and dissimilar capacity is accounted for at fair market value with recognition of any gain or loss. There were no gains or losses from nonmonetary transactions for each of the three and six months ended June 30, 2012 and 2011.
F-139
Table of Contents
Operating Leases
The Company leases office and equipment space, and maintains equipment rentals, right-of-way contracts, building access fees and network capacity under various non-cancelable operating leases. The lease agreements, which expire at various dates through 2030, are subject, in many cases, to renewal options and provide for the payment of taxes, utilities and maintenance. Certain lease agreements contain escalation clauses over the term of the lease related to scheduled rent increases resulting from the pass through of increases in operating costs, property taxes and the effect on costs from changes in consumer price indices. In accordance with SFAS No. 13, “Accounting for Leases,” (now known as FASB ASC 840), the Company recognizes rent expense on a straight-line basis and records a liability representing the difference between straight-line rent expense and the amount payable as an increase or decrease to a deferred liability. Any leasehold improvements related to operating leases are amortized over the lesser of their economic lives or the remaining lease term. Rent-free periods and other incentives granted under certain leases are recorded as reductions to rent expense on a straight-line basis over the related lease terms.
Cash and Cash Equivalents and Restricted Cash and Cash Equivalents
For the purposes of the consolidated statements of cash flows, the Company considers cash in banks and short-term highly liquid investments with an original maturity of three months or less to be cash and cash equivalents. Cash and cash equivalents and restricted cash and cash equivalents are stated at cost, which approximates fair value. Restricted cash and cash equivalents are comprised of amounts that secure outstanding letters of credit issued in favor of various third parties.
Accounts Receivable, Allowance for Doubtful Accounts and Sales Credits
Accounts receivable are customer obligations for services sold to such customers under normal trade terms. The Company’s customers are primarily communications carriers, and corporate enterprise and government customers, located primarily in the U.S. and the United Kingdom (“U.K.”). The Company performs periodic credit evaluations of its customers’ financial condition. The Company provides allowances for doubtful accounts and sales credits. Provisions for doubtful accounts are recorded in selling, general and administrative expenses, while allowances for sales credits are recorded as reductions of revenue. The adequacy of the reserves is evaluated utilizing several factors including length of time a receivable is past due, changes in the customer’s creditworthiness, customer’s payment history, the length of the customer’s relationship with the Company, current industry trends and the current economic climate.
Property and Equipment
Property and equipment owned at September 8, 2003, the effective date (the “Effective Date”) of the amended bankruptcy plan of reorganization of Metromedia Fiber Network, Inc. and substantially all of its domestic subsidiaries (the “Plan of Reorganization”), are stated at their estimated fair values as of the Effective Date based on the Company’s reorganization value, net of accumulated depreciation and amortization incurred since the Effective Date. Purchases of property and equipment subsequent to the Effective Date are stated at cost, net of depreciation and amortization. Major improvements are capitalized, while expenditures for repairs and maintenance are expensed when incurred. Costs incurred prior to a capital project’s completion are reflected as construction in progress and are part of network infrastructure assets, as described below and included in property and equipment on the respective balance sheets. At June 30, 2012 and December 31, 2011, the Company had $45.7 and $57.8, respectively, of construction in progress. Certain internal direct labor costs of constructing or installing property and equipment are capitalized. Capitalized direct labor is determined based upon a core group of project managers, field engineers, network infrastructure engineers and equipment engineers. Capitalized direct labor is based upon time spent on capitalized projects and consists of salary, plus certain related benefits. These individuals’ capitalized labor costs are directly associated with the construction and installation of network infrastructure and equipment and customer installations. The salaries and related benefits of non-engineers and supporting staff that are part of the operations and engineering departments are not
F-140
Table of Contents
considered part of the pool subject to capitalization. Capitalized direct labor amounted to $2.5 and $2.7 for the three months ended June 30, 2012 and 2011, respectively, and was $5.2 in each of the six months ended June 30, 2012 and 2011. Depreciation and amortization is provided on a straight-line basis over the estimated useful lives of the assets, with the exception of leasehold improvements, which are amortized over the lesser of the estimated useful life of the improvement or the term of the lease.
Estimated useful lives of the Company’s property and equipment are as follows:
| Network infrastructure assets and storage huts (except for risers and certain project installation costs, which are 5 years) |
20 years | |
| HVAC and power equipment |
12 to 20 years | |
| Transmission and IP equipment |
5 to 7 years | |
| Furniture, fixtures and equipment |
4 to 7 years | |
| Software and computer equipment |
3 to 5 years | |
| Leasehold improvements |
Lesser of the estimated useful life of the improvement or the term of the lease |
When property and equipment is retired or otherwise disposed of, the cost and accumulated depreciation is removed from the accounts, and resulting gains or losses are reflected in net income.
From time to time, the Company is required to replace or re-route existing fiber due to structural changes such as construction and highway expansions, which is defined as “relocation.” In such instances, the Company fully depreciates the remaining carrying value of network infrastructure removed or rendered unusable and capitalizes the costs of the new fiber and associated construction placed into service. In certain circumstances, the local municipality or agency is responsible for some or all of such amounts. The Company records its share of relocation costs in property and equipment and records the third party portion of such costs as accounts receivable. The Company capitalized relocation costs amounting to $0.3 and $0.4 for the three months ended June 30, 2012 and 2011, respectively, and $0.6 and $0.9 for the six months ended June 30, 2012 and 2011, respectively. The Company fully depreciated the remaining carrying value of the network infrastructure rendered unusable, which on an original cost basis, totaled $0.07 and $0.12 ($0.03 and $0.05 on a net book value basis) for the three and six months ended June 30, 2012, respectively, and, which on an original cost basis, totaled $0.06 and $0.15 ($0.03 and $0.07 on a net book value basis) for the three and six months ended June 30, 2011, respectively. To the extent that relocation is temporary in nature, or requires only the movement of existing network infrastructure to another location or construction for an insignificant portion of the entire segment, the related costs are included in the Company’s results of operations.
In accordance with SFAS No. 34, “Capitalization of Interest Cost,” (now known as FASB ASC 835-20), interest on certain construction projects would be capitalized. Such amounts were considered immaterial, and accordingly, no such amounts were capitalized during each of the three and six months ended June 30, 2012 and 2011.
In accordance with SFAS No. 144, “Accounting for the Impairment or Disposal of Long-Lived Assets,” (now known as FASB ASC 360-10-35), the Company periodically evaluates the recoverability of its long-lived assets and evaluates such assets for impairment whenever events or circumstances indicate that the carrying amount of such assets (or group of assets) may not be recoverable. Impairment is determined to exist if the estimated future undiscounted cash flows are less than the carrying value of such assets. The Company considers various factors to determine if an impairment test is necessary. The factors include: consideration of the overall economic climate, technological advances with respect to equipment, Company strategy, capital planning and certain operational issues. Since June 30, 2006, no event has occurred nor has the business environment changed to trigger an impairment test for assets in revenue service and operations. The Company also considers the removal of assets from the network as a triggering event for performing an impairment test. Once an item is removed from service, unless it is to be redeployed, it may have little or no future cash flows related to it. The Company
F-141
Table of Contents
performs annual physical counts of such assets that are not in revenue service or operations (e.g., inventory, primarily spare parts) at or around September 30 of each year. With the assistance of a valuation report of the assets in inventory, prepared by an independent third party on a basis consistent with SFAS No. 157, “Fair Value Measurements,” (now known as FASB ASC 820-10), and pursuant to FASB ASC 360-10-35, the Company determined that the fair value of certain of these assets was less than the carrying value and accordingly, recorded a provision for impairment totaling $1.2 for the year ended December 31, 2011. The Company provided allowances for impairment of $0.1 in each of the six months ended June 30, 2012 and 2011, which were recorded in the three months ended March 31, 2012 and June 30, 2011, respectively.
Asset Abandonment
In June 2011, the Company entered into an agreement for the purchase and implementation of e-business software for an integrated, global business application (the “E-Business System”), which was expected to be the Company’s primary information technology platform. In June 2012, management made a decision to abandon the implementation of the E-Business System. Accordingly, the Company recorded an impairment charge of $4.4 to write-off previously capitalized project costs. In addition, the Company incurred an additional $2.2 in costs related to the settlement and termination of the contract. The aggregate charge of $6.6 is reflected in “Selling, general and administrative expenses” in the Company’s consolidated statement of operations for each of the three and six months ended June 30, 2012.
Treasury Stock
Treasury stock is accounted for under the cost method.
Asset Retirement Obligations
In accordance with SFAS No. 143, “Accounting for Asset Retirement Obligations,” (now known as FASB ASC 410-20), the Company recognizes the fair value of a liability for an asset retirement obligation in the period in which it is incurred if a reasonable estimate of fair value can be made. The Company has asset retirement obligations related to the de-commissioning and removal of equipment, restoration of leased facilities and the removal of certain fiber and conduit systems. Considerable management judgment is required in estimating these obligations. Important assumptions include estimates of asset retirement costs, the timing of future asset retirement activities and the likelihood of contractual asset retirement provisions being enforced. Changes in these assumptions based on future information could result in adjustments to these estimated liabilities.
Asset retirement obligations, generally recorded as “Other long-term liabilities,” are capitalized as part of the carrying amount of the related long-lived assets included in property and equipment, net, and are depreciated over the life of the associated asset. Asset retirement obligations aggregated $8.5 and $8.1 at June 30, 2012 and December 31, 2011, respectively, of which $4.4 and $4.5, respectively, was included in “Accrued expenses,” at such dates, and $4.1 and $3.6, respectively, was included in “Other long-term liabilities,” at such dates. Accretion expense, which is included in “Interest expense,” amounted to $0.14 and $0.07 for the three months ended June 30, 2012 and 2011, respectively, and $0.28 and $0.14 for the six months ended June 30, 2012 and 2011, respectively.
Income Taxes
The Company accounts for income taxes in accordance with SFAS No. 109, “Accounting for Income Taxes,” (now known as FASB ASC 740). Deferred tax assets and liabilities are recognized for the future tax consequences attributable to differences between financial statement carrying amounts of existing assets and liabilities and their respective tax basis and net operating losses and tax credit carryforwards. Deferred tax assets and liabilities are measured using enacted tax rates expected to apply to taxable income in the years in which those temporary differences are expected to be recovered or settled. After an evaluation of the realizability of the Company’s deferred tax assets, the Company reduced its valuation allowance by $9.1, $7.3 and $183.0 during
F-142
Table of Contents
2011, 2010 and 2009, respectively. See Note 5, “Income Taxes,” for a further discussion of the Company’s provision for income taxes.
The Company is subject to audits by various taxing authorities, and these audits may result in proposed assessments where the ultimate resolution results in the Company owing additional taxes. The Company is required to establish reserves under FASB Interpretation No. 48, “Accounting for Uncertainty in Income Taxes,” (now known as FASB ASC 740-10), when the Company believes there is uncertainty with respect to certain positions and the Company may not succeed in realizing the tax benefit. The Company believes that its tax return positions are appropriate and supportable under relevant tax law. The Company believes the estimates and assumptions used to support its evaluation of tax benefit realization are reasonable. Accordingly, no adjustments were made to the consolidated financial statements for each of the three and six months ended June 30, 2012 and 2011.
The Company’s reorganization resulted in a significantly modified capital structure as a result of applying fresh-start accounting in accordance with FASB ASC 852-10 on the Effective Date. Fresh start accounting has important consequences on the accounting for the realization of valuation allowances, related to net deferred tax assets that existed on the Effective Date but which arose in pre-emergence periods. Prior to 2009, fresh start accounting required the reversal of these allowances to be recorded as a reduction of intangible assets until exhausted and thereafter as additional paid in capital. Beginning in 2009, in accordance with SFAS141(R), “Business Combinations (Revised),” (now known as FASB ASC 805), future utilization of such benefit will reduce income tax expense. This treatment does not result in any change in liabilities to taxing authorities or in cash flows.
Undistributed earnings of the Company’s foreign subsidiaries are considered to be indefinitely reinvested and therefore, no provision for domestic taxes has been provided thereon. Upon repatriation of those earnings, in the form of dividends or otherwise, the Company would be subject to domestic income taxes, offset (in whole or in part) by foreign tax credits, related to income and withholding taxes payable to the various foreign countries. Determination of the amount of unrecognized deferred domestic income tax liability is not practicable due to the complexities associated with its hypothetical calculation; however, foreign tax credit carryforwards would be available to reduce some portion of the domestic liability.
The Company’s policy is to recognize interest and penalties accrued as a component of operating expense. As of the date of adoption of FASB ASC 740-10, the Company did not have any accrued interest or penalties associated with any unrecognized income tax benefits, nor was any interest expense recognized during each of the three and six months ended June 30, 2012 and 2011.
Foreign Currency Translation and Transactions
The Company’s functional currency is the U.S. dollar. For those subsidiaries not using the U.S. dollar as their functional currency, assets and liabilities are translated at exchange rates in effect at the balance sheet date and income and expense transactions are translated at average exchange rates during the period. Resulting translation adjustments are recorded directly to a separate component of shareholders’ equity and are reflected in the accompanying consolidated statements of comprehensive income. The Company’s foreign exchange transaction gains (losses) are generally included in “Other (expense) income, net” in the consolidated statements of operations.
Stock Options
On September 8, 2003, the Company adopted the fair value provisions of SFAS No. 148, “Accounting for Stock-Based Compensation Transition and Disclosure,” (“SFAS No. 148”), (now known as FASB ASC 718-10). SFAS No. 148 amended SFAS No. 123, “Accounting for Stock-Based Compensation,” (“SFAS No. 123”), (also now known as FASB ASC 718-10), to provide alternative methods of transition to SFAS No. 123’s fair value method of accounting for stock-based employee compensation. See Note 7, “Stock-Based Compensation.”
Under the fair value provisions of SFAS No. 123, the fair value of each stock-based compensation award is estimated at the date of grant, using the Black-Scholes option pricing model for stock option awards. The Company
F-143
Table of Contents
did not have a historical basis for determining the volatility and expected life assumptions in the model due to the Company’s limited market trading history; therefore, the assumptions used for these amounts are an average of those used by a select group of related industry companies. Most stock-based awards have graded vesting (i.e. portions of the award vest at different dates during the vesting period). The Company recognizes the related stock-based compensation expense of such awards on a straight-line basis over the vesting period for each tranche in an award. Upon consummation of the Plan of Reorganization, all then outstanding stock options were cancelled.
Effective January 1, 2006, the Company adopted SFAS No. 123(R), “Share-Based Payment,” (“SFAS No. 123(R)”), (now known as FASB ASC 718), using the modified prospective method. SFAS No. 123(R) requires all share-based awards granted to employees to be recognized as compensation expense over the vesting period, based on fair value of the award. The fair value method under SFAS No. 123(R) is similar to the fair value method under SFAS No. 123 with respect to measurement and recognition of stock-based compensation expense except that SFAS No. 123(R) requires an estimate of future forfeitures, whereas SFAS No. 123 allowed companies to estimate forfeitures or recognize the impact of forfeitures as they occur. As the Company recognized the impact of forfeitures as they occurred under SFAS No. 123, the adoption of SFAS No. 123(R) did result in different accounting treatment, but it did not have a material impact on the Company’s consolidated financial statements.
There were no options to purchase shares of Common Stock granted during each of the three and six months ended June 30, 2012 and 2011.
Restricted Stock Units
Compensation cost for restricted stock unit awards that are not performance-based is measured based upon the quoted closing market price for the Company’s stock on the date of grant. The related compensation cost is recognized on a straight-line basis over the vesting period. Compensation expense for performance-based restricted stock unit awards is measured based upon the quoted market price for the Company’s stock on the date that the performance targets have been established and communicated to the grantee. Related compensation cost is recognized based upon a review of the performance targets and determination that such performance targets have been achieved, on a straight-line basis over the vesting period. See Note 7, “Stock-Based Compensation.”
Stock Warrants
In connection with the Plan of Reorganization described in this Note 2, “Basis of Presentation and Significant Accounting Policies—Property and Equipment,” the Company issued to holders of general unsecured claims as part of the settlement of such claims (i) five year warrants to purchase 1,418,918 shares of Common Stock with an exercise price of $10.00 per share, which expired September 8, 2008 (the “Five Year Warrants”) and (ii) seven year warrants to purchase 1,669,316 shares of Common Stock with an exercise price of $12.00 per share, which expired September 8, 2010 (the “Seven Year Warrants”). The stock warrants were treated as equity upon their exercise based upon the terms of the warrant and cash received. Stock warrants to purchase shares of Common Stock exercised totaled 858,530 in 2010.
Under the terms of the five year and seven year warrant agreements (collectively, the “Warrant Agreements”), if the Common Stock market price, as defined in the Warrant Agreements, 60 days prior to the expiration date of the respective warrants, was greater than the warrant exercise price, the Company was required to give each warrant holder notice that at the warrant expiration date, the warrants would be deemed to have been exercised pursuant to the net exercise provisions of the respective Warrant Agreements (the “Net Exercise”), unless the warrant holder elected, by written notice, to not exercise its warrants. Under the Net Exercise, shares issued to the warrant holders would be reduced by the number of shares necessary to cover the aggregate exercise price of the shares, valuing such shares at the current market price, as defined in the Warrant Agreements. Any fractional shares, otherwise issuable, would be paid in cash.
At September 8, 2008, the expiration date of the Five Year Warrants, the required conditions were met for the Net Exercise. In total, Five Year Warrants to purchase 318,526 shares of Common Stock were deemed exercised
F-144
Table of Contents
on a net exercise basis (including warrants to purchase 778 shares of Common Stock, which were exercised on a net exercise basis prior to expiration), of which 213,432 shares were issued to the warrant holders, 105,094 shares were returned to treasury and $0.004 was paid to recipients for fractional shares. In addition, Five Year Warrants to purchase 50 shares of Common Stock were cancelled in accordance with instructions from warrant holders. In total, the exercises of the Five Year Warrants by holders generated cash of $11.0.
At September 8, 2010, the expiration date of the Seven Year Warrants, the required conditions were met for the Net Exercise and accordingly, Seven Year Warrants to purchase 13,626 shares of Common Stock were exercised at expiration, of which 10,409 shares were issued to warrant holders and 3,217 shares were returned to treasury and $0.004 was paid to recipients for fractional shares. In total, Seven Year Warrants to purchase 443,504 shares of Common Stock were deemed exercised on a net exercise basis (441,688 in 2010), of which 353,598 shares were issued to the warrant holders, 89,906 shares were returned to treasury and $0.004 was paid to recipients for fractional shares. In addition, Seven Year Warrants to purchase 26 shares of Common Stock were determined to be undeliverable and were cancelled. In total, the exercises of the Seven Year Warrants by holders generated cash of $14.7.
Derivative Financial Instruments
The Company has utilized and may, from time to time in the future, utilize derivative financial instruments known as interest rate swaps (“derivatives”) to mitigate its exposure to interest rate risk. The Company purchased the first interest rate swap on August 4, 2008 to hedge the interest rate on the initial $24.0 (original principal) term loan under the Secured Credit Facility (as such term is defined in Note 4, “Note Payable—Secured Credit Facility,” below) and the Company purchased a second interest rate swap on November 14, 2008 to hedge the interest rate on the additional $12.0 (original principal) term loan provided by SunTrust Bank. See Note 4, “Note Payable.” The Company accounted for the derivatives under SFAS No. 133, “Accounting for Derivative Instruments and Hedging Activities,” (now known as FASB ASC 815). FASB ASC 815 requires that all derivatives be recognized in the financial statements and measured at fair value regardless of the purpose or intent for holding them. By policy, the Company has not historically entered into derivatives for trading purposes or for speculation. Based on criteria defined in FASB ASC 815, the interest rate swaps were considered cash flow hedges and were 100% effective. Accordingly, changes in the fair value of derivatives were recorded each period in other comprehensive loss. Changes in the fair value of the derivatives reported in accumulated other comprehensive loss were reclassified into earnings in the period in which earnings were impacted by the variability of the cash flows of the hedged item. The ineffective portion of all hedges, if any, would be recognized in current period earnings. The unrealized net loss recorded in accumulated other comprehensive loss at December 31, 2010 was $0.6 for the interest rate swaps. The mark-to-market value of the cash flow hedges was recorded in current assets, current liabilities, other non-current assets or other long-term liabilities, as applicable, and the offsetting gains or losses in other comprehensive loss. Both interest rate swaps were settled in January 2011.
On January 1, 2009, the Company adopted SFAS No. 161, “Disclosures about Derivative Instruments and Hedging Activities—an amendment of FASB Statement No. 133,” (now known as FASB ASC 815-10). FASB ASC 815-10 changes the disclosure requirements for derivatives and hedging activities. Entities are required to provide enhanced disclosures about: (i) how and why an entity uses derivatives; (ii) how derivatives and related hedged items are accounted for under FASB ASC 815-10; and (iii) how derivatives and related hedged items affect an entity’s financial position and cash flows.
The Company has, when applicable, minimized its credit risk relating to counterparties of its derivatives by transacting with multiple, high quality counterparties, thereby limiting exposure to individual counterparties, and by monitoring the financial condition of its counterparties.
All derivatives have been recorded on the Company’s consolidated balance sheets at fair value. Accounting for the gains and losses resulting from changes in the fair value of derivatives depends on the use of the derivative and whether it qualifies for hedge accounting in accordance with FASB ASC 815-10.
F-145
Table of Contents
The swap agreements were settled in January 2011 in connection with the repayment of the term loans under the Secured Credit Facility and the closing of the $250 Million Secured Revolving Credit Facility (as such term is defined in Note 4, “Note Payable—$250 Million Secured Revolving Credit Facility,” below). The cost of $0.5 to settle the swap agreements was included in “Other (expense) income, net” in the Company’s consolidated statement of operations for the six months ended June 30, 2011.
Fair Value of Financial Instruments
The Company adopted SFAS No. 157, “Fair Value Measurements,” (now known as FASB ASC 820-10), for the Company’s financial assets and liabilities effective January 1, 2008. This pronouncement defines fair value, establishes a framework for measuring fair value, and requires expanded disclosures about fair value measurements. FASB ASC 820-10 emphasizes that fair value is a market-based measurement, not an entity-specific measurement, and defines fair value as the price that would be received to sell an asset or transfer a liability in an orderly transaction between market participants at the measurement date. FASB ASC 820-10 discusses valuation techniques, such as the market approach (comparable market prices), the income approach (present value of future income or cash flow) and the cost approach (cost to replace the service capacity of an asset or replacement cost), which are each based upon observable and unobservable inputs. Observable inputs reflect market data obtained from independent sources, while unobservable inputs reflect the Company’s market assumptions. FASB ASC 820-10 utilizes a fair value hierarchy that prioritizes inputs to fair value measurement techniques into three broad levels:
| Level 1: |
Observable inputs such as quoted prices for identical assets or liabilities in active markets. | |
| Level 2: |
Observable inputs other than quoted prices that are directly or indirectly observable for the asset or liability, including quoted prices for similar assets or liabilities in active markets; quoted prices for similar or identical assets or liabilities in markets that are not active; and model-derived valuations whose inputs are observable or whose significant value drivers are observable. | |
| Level 3: |
Unobservable inputs that reflect the reporting entity’s own assumptions. | |
The Company’s investment in overnight money market institutional funds, which amounted to $130.4 and $110.0 at June 30, 2012 and December 31, 2011, respectively, is included in cash and cash equivalents on the accompanying balance sheets and is classified as a Level 1 asset.
The Company was party to two interest rate swaps, which were utilized to modify the Company’s interest rate risk. The Company recorded the mark-to-market value of the interest rate swap contracts of $0.6 (which was included in “Accrued expenses”) in the Company’s consolidated balance sheet at December 31, 2010. At December 31, 2010, the Company used third parties, as well as its own market analysis to determine the fair value of each of the interest rate swap agreements. The fair value of the interest rate swap contracts were classified as Level 2 liabilities. The swap agreements were settled in January 2011 in connection with the repayment of the term loans under the Secured Credit Facility and the closing of the $250 Million Secured Revolving Credit Facility. The cost of $0.5 to settle the swap agreements was included in “Other (expense) income, net” in the Company’s consolidated statement of operations for the six months ended June 30, 2011.
The Company’s consolidated balance sheets include the following financial instruments: short-term cash investments, trade accounts receivable, trade accounts payable and note payable. The Company believes the carrying amounts in the financial statements approximate the fair value of these financial instruments due to the relatively short period of time between the origination of the instruments and their expected realization or the interest rates which approximate current market rates.
F-146
Table of Contents
Concentration of Credit Risk
Financial instruments which potentially subject the Company to concentration of credit risk consist principally of short-term cash investments and accounts receivable. The Company does not enter into financial instruments for trading or speculative purposes. The Company’s cash and cash equivalents are invested in investment-grade, short-term investment instruments with high quality financial institutions. The Company’s trade receivables, which are unsecured, are geographically dispersed, and no single customer accounts for greater than 10% of consolidated revenue or accounts receivable, net. The Company performs ongoing credit evaluations of its customers’ financial condition. The allowance for non-collection of accounts receivable is based upon the expected collectability of all accounts receivable. The Company places its cash and cash equivalents primarily in commercial bank accounts in the U.S. Account balances generally exceed federally insured limits.
401(k) and Other Post-Retirement Benefits
The Company has a Profit Sharing and 401(k) Plan (the “Plan”) for its employees in the U.S., which permits employees to make contributions to the Plan on a pre-tax salary reduction basis in accordance with the provisions of the Internal Revenue Code and permits the employer to provide discretionary contributions. All full-time U.S. employees are eligible to participate in the Plan at the beginning of the month following three months of service. Eligible employees may make contributions subject to the limitations defined by the Internal Revenue Code. The Company matches 50% of a U.S. employee’s contributions, up to the amount set forth in the Plan. Matched amounts vest based upon an employee’s length of service. The Company’s subsidiaries in the U.K. have a different plan under which contributions are made up to a maximum of 8% when U.K. employee contributions reach 5% of salary. Under the U.K. plan, contributions are made at two levels. When a U.K. employee contributes 3% or more but less than 5% of their salary to the plan, the Company’s contribution is fixed at 5% of the salary. When a U.K. employee contributes over 5% of their salary to the plan, the Company’s contribution is fixed at 8% of the salary (regardless of the percentage of the contribution in excess of 5%).
The Company contributed $0.4 for each of the three months ended June 30, 2012 and 2011 and contributed $1.1 for each of the six months ended June 30, 2012 and 2011, net of forfeitures for its obligations under these plans.
Taxes Collected from Customers
In June 2006, the Emerging Issues Task Force (“EITF”) ratified the consensus on EITF No. 06-3, “How Taxes Collected from Customers and Remitted to Governmental Authorities Should Be Presented in the Income Statement (That Is, Gross versus Net Presentation),” (“EITF No. 06-3”), (now known as FASB ASC 605-45). FASB ASC 605-45 requires that companies disclose their accounting policies regarding the gross or net presentation of certain taxes. Taxes within the scope of FASB ASC 605-45 are any taxes assessed by a governmental authority that are directly imposed on a revenue-producing transaction between a seller and a customer and may include, but are not limited to, sales, use, value added and some excise taxes. In addition, if such taxes are significant, and are presented on a gross basis, the amounts of those taxes should be disclosed. The Company adopted EITF No. 06-3 effective January 1, 2007. The Company records Universal Service Fund (“USF”) contributions relating to certain services it provides on a net basis in accordance with the guidelines of EITF No. 99-19, “Reporting Revenue Gross as a Principal versus Net as an Agent,” (also now known as FASB ASC 605-45). The Company’s policy is to record all such fees, contributions and taxes within the scope of FASB ASC 605-45 on a net basis.
Reclassifications
Certain reclassifications have been made to the consolidated financial statements for the three and six months ended June 30, 2011 to conform to the classifications used for the three and six months ended June 30, 2012.
F-147
Table of Contents
Recently Issued Accounting Pronouncements
In August 2009, the FASB issued ASU No. 2009-5, “Fair Value Measurements and Disclosures (Topic 820)—Measuring Liabilities at Fair Value.” ASU No. 2009-5 provides clarification that in circumstances in which a quoted price in an active market for the identical liability is not available, a reporting entity is required to measure fair value using a valuation technique that uses the quoted price of the identical liability when traded as an asset, quoted prices for similar liabilities or similar liabilities when traded as assets, or another valuation technique that is consistent with the principles of ASC Topic 820. ASU No. 2009-5 is effective for the first reporting period (including interim periods) beginning after issuance. The adoption of ASU No. 2009-5 did not have a material impact on the Company’s financial position, results of operations or cash flows.
In October 2009, the FASB issued ASU No. 2009-13, “Revenue Recognition (Topic 605)—Multiple Deliverable Revenue Arrangements.” ASU No. 2009-13 eliminates the residual method of allocation and requires that arrangement consideration be allocated at the inception of the arrangement to all deliverables using the relative selling price method and expands the disclosures related to multiple-deliverable revenue arrangements. ASU No. 2009-13 is effective prospectively for revenue arrangements entered into or materially modified in fiscal years beginning on or after June 15, 2010, with earlier adoption permitted. The adoption of ASU No. 2009-13 did not have a material impact on the Company’s financial position, results of operations or cash flows.
In January 2010, the FASB issued ASU No. 2010-02, “Consolidation (Topic 810)—Accounting and Reporting for Decreases in Ownership of a Subsidiary—a Scope Clarification.” ASU No. 2010-02 clarifies that the scope of the decrease in ownership provisions of Topic 810 applies to a subsidiary or group of assets that is a business, a subsidiary that is a business that is transferred to an equity method investee or a joint venture or an exchange of a group of assets that constitutes a business for a noncontrolling interest in an entity and does not apply to sales in substance of real estate. ASU No. 2010-02 is effective as of the beginning of the period in which an entity adopts SFAS No. 160 or, if SFAS No. 160 has been previously adopted, the first interim or annual period ending on or after December 15, 2009, applied retrospectively to the first period that the entity adopted SFAS No. 160. The adoption of ASU No. 2010-02 did not have a material impact on the Company’s financial position, results of operations or cash flows.
In January 2010, the FASB issued ASU No. 2010-06, “Fair Value Measurements and Disclosures (Topic 820)—Improving Disclosures about Fair Value Measurements.” ASU 2010-06 requires new disclosures regarding transfers in and out of the Level 1 and 2 and activity within Level 3 fair value measurements and clarifies existing disclosures of inputs and valuation techniques for Level 2 and 3 fair value measurements. ASU 2010-06 also includes conforming amendments to employers’ disclosures about postretirement benefit plan assets. The new disclosures and clarifications of existing disclosures are effective for interim and annual reporting periods beginning after December 15, 2009, except for the disclosure of activity within Level 3 fair value measurements, which is effective for fiscal years beginning after December 15, 2010, and for interim periods within those years. The adoption of ASU No. 2010-06 did not have a material impact on the Company’s financial position, results of operations or cash flows.
In February 2010, the FASB issued ASU 2010-09, “Subsequent Events (Topic 855)—Amendments to Certain Recognition and Disclosure Requirements.” ASU 2010-09 requires an entity that is an SEC filer to evaluate subsequent events through the date that the financial statements are issued and removes the requirement that an SEC filer disclose the date through which subsequent events have been evaluated. ASU 2010-09 was effective upon issuance. The adoption of ASU 2010-09 had no effect on the Company’s financial position, results of operations or cash flows.
In April 2010, the FASB issued ASU 2010-13, “Compensation—Stock Compensation (Topic 718)—Effect of Denominating the Exercise Price of a Share-Based Payment Award in the Currency of the Market in Which the Underlying Equity Security Trades.” ASU 2010-13 provides amendments to Topic 718 to clarify that an employee share-based payment award with an exercise price denominated in the currency of a market in which a
F-148
Table of Contents
substantial portion of the entity’s equity securities trades should not be considered to contain a condition that is not a market, performance, or service condition. Therefore, an entity would not classify such an award as a liability if it otherwise qualifies as equity. The amendments in ASU 2010-13 are effective for fiscal years, and interim periods within those fiscal years, beginning on or after December 15, 2010. The adoption of ASU 2010-13 did not have a material impact on the Company’s financial position, results of operations or cash flows.
NOTE 3: CHANGE IN ESTIMATE
Effective as of October 1, 2011, the Company changed the estimated useful lives for certain capitalized labor from seven to five years, and began depreciating assets under the Company’s sparing program, in accordance with their respective asset class lives. The effect of these changes on the Company’s operating results has not been and will not be material.
NOTE 4: NOTE PAYABLE
$250 Million Secured Revolving Credit Facility
On January 28, 2011, the Company closed a five year $250 secured revolving credit facility (the “$250 Million Secured Revolving Credit Facility”) with the lender parties thereto (the “Lenders”) and SunTrust Bank, as Administrative Agent (the “Administrative Agent”). The Lenders received a first priority security interest in and lien on substantially all of the Company’s domestic assets and 65% of the ownership interest in the Company’s principal foreign subsidiaries. Loans under the $250 Million Secured Revolving Credit Facility bear interest, for any interest period of one, two or three months or if agreed to, longer interest periods at the Company’s option, at either the Base Rate (as defined in the $250 Million Secured Revolving Credit Facility) plus the applicable margin ranging from 1.25% to 2.00%, or alternately, the Adjusted LIBO Rate (as defined in the $250 Million Secured Revolving Credit Facility) plus the applicable margin ranging from 2.25% to 3.00%. The Company is also required to pay an unused commitment fee ranging from 0.375% to 0.50% per annum based on the daily average undrawn portion of the $250 Million Secured Revolving Credit Facility. The applicable margin and the unused commitment fee will be determined based on the Company’s Leverage Ratio based on Consolidated Total Debt to Consolidated EBITDA (each as defined in the $250 Million Secured Revolving Credit Facility).
The $250 Million Secured Revolving Credit Facility includes an uncommitted accordion feature that permits the Company to increase the aggregate principal amount by up to $125.0 through one or more term loans or additional revolving credit, subject to the agreement by one or more Lenders to provide such additional principal amount.
The Company borrowed $55.0 at closing, of which $5.0 was used to pay bank fees and legal expenses, $49.9 was used to repay the Secured Credit Facility (as defined below) and $0.1 was used for general corporate purposes. The initial borrowings under the $250 Million Secured Revolving Credit Facility carried an interest rate of 4.50% (base rate of 3.25% plus applicable margin of 1.25%). The Company converted the interest rate to the Adjusted LIBO Rate option as of February 4, 2011, at which time the interest rate was changed to 2.52% (0.27% Adjusted LIBO Rate plus applicable margin of 2.25%). At June 30, 2012, the $250 Million Secured Revolving Credit Facility carried an interest rate of 2.50% (0.25% Adjusted LIBO Rate plus applicable margin of 2.25%).
The Company has the right to prepay any outstanding loan under the $250 Million Secured Revolving Credit Facility prior to its maturity without premium or penalty.
The Company is required to comply with a number of affirmative, negative and financial covenants. Among other things, these covenants require the Company to provide notices of material events and information regarding collateral, restrict the Company’s ability, subject to certain exceptions and baskets, to incur additional indebtedness, grant liens on assets, undergo fundamental changes, make investments, sell assets, make restricted
F-149
Table of Contents
payments (including the ability to pay dividends) and engage in affiliate transactions, and require the Company to maintain a Leverage Ratio not greater than 2.5 to 1.0 and an Interest Coverage Ratio (as such terms are defined in the $250 Million Secured Revolving Credit Facility) of not less than 3.0 to 1.0. At June 30, 2012, based upon the Company’s Leverage Ratio, its cash balance and its availability under the $250 Million Secured Revolving Credit Facility, $279.6 of retained earnings is unrestricted for dividend purposes and the balance is restricted.
The $250 Million Secured Revolving Credit Facility contains customary events of default (subject to customary grace periods, cure rights and materiality thresholds), including, among others, failure to pay principal, interest or fees, violation of covenants, material inaccuracy of representations and warranties, cross-default and cross-acceleration of material indebtedness, certain bankruptcy and insolvency events, certain judgments, certain ERISA events and a change of control.
Following an event of default under the $250 Million Secured Revolving Credit Facility, the Administrative Agent and the Lenders would be entitled to take various actions, including the acceleration of amounts due under the $250 Million Secured Revolving Credit Facility and seek other remedies that may be taken by secured creditors.
The outstanding principal amount of all revolving credit loans, together with accrued and unpaid interest thereon, will be due and payable on January 28, 2016.
In connection with the January 2011 closing of the $250 Million Secured Revolving Credit Facility, the Company also settled the two interest rate swaps at a total cost of $0.5, which was included in “Other (expense) income, net” in the Company’s consolidated statement of operations for the six months ended June 30, 2011. The Company also wrote-off $1.1 in unamortized debt issuance costs associated with the Secured Credit Facility, which was also included in “Other (expense) income, net” in the Company’s consolidated statement of operations for the six months ended June 30, 2011.
As of June 30, 2012, $195.0 was available for borrowings under the $250 Million Secured Revolving Credit Facility.
The Company was in compliance with all of its debt covenants as of June 30, 2012.
On July 2, 2012, in conjunction with the closing of the Merger, the Company repaid in full and terminated the $250 Million Secured Revolving Credit Facility. See Note 14, “Merger Agreement with Zayo Group, LLC.”
Secured Credit Facility
On February 29, 2008, the Company, excluding certain foreign subsidiaries, entered into a Credit and Guaranty Agreement (as amended, the “Credit Agreement”) providing for a $60.0 senior secured credit facility (the “Secured Credit Facility”), consisting of an $18.0 revolving credit facility (the “Revolver”) and a $42.0 term loan facility (the “Term Loan”), which was comprised of $24.0 advanced at closing and up to $18.0 of which originally could be drawn within nine months of closing at the Company’s option (the “Delayed Draw Term Loan”). The Secured Credit Facility was secured by substantially all of the Company’s domestic assets. In September 2008, the Delayed Draw Term Loan option, which was originally scheduled to expire on November 25, 2008, was extended to June 30, 2009 and then subsequently extended to December 31, 2009. The Revolver and the Term Loan each had a term of five years from February 29, 2008. The Company paid an upfront fee of 1.5% ($0.9) of the total amount of the Secured Credit Facility and paid $0.3 to its unaffiliated third party financial advisors who assisted the Company. The Company was also liable for an unused commitment fee of 0.75% per annum. Interest accrued at 30 day LIBOR, plus the applicable margin of 3% effective September 30, 2008. Additionally, the Company was originally required to maintain an unrestricted cash balance at all times of at least $20.0. On February 29, 2008, the Company received proceeds, pursuant to the Term Loan of $24.0, less debt issuance costs.
F-150
Table of Contents
The Company’s ability to draw upon the available commitments under the Revolver was subject to compliance with all of the covenants contained in the Credit Agreement and the Company’s continued ability to make certain representations and warranties. Among other things, these covenants imposed limits on annual capital expenditures (through 2010), provided that the Company’s net total funded debt ratio could not at any time exceed a specified amount and required that the Company maintained a minimum consolidated fixed charges coverage ratio. In addition, the Credit Agreement prohibited the Company from paying dividends (other than in its own shares or other equity securities) and from making certain other payments, including payments to acquire the Company’s equity securities other than under specified circumstances, which include the repurchase of the Company’s equity securities from employees and directors in an aggregate amount not to exceed $15.0. The Company obtained a waiver from the Lenders to effectuate the dividend paid in December 2010.
On September 26, 2008, the Company executed a joinder agreement to the Secured Credit Facility that added an additional lender and increased the amount of the Secured Credit Facility to $90.0 effective October 1, 2008; the Revolver increased to $27.0, the Term Loan increased to $36.0 and the available Delayed Draw Term Loan increased to $27.0. In connection with the joinder agreement, the Company paid a $0.45 fee at closing and an aggregate of $0.25 of advisory fees. The additional amount of the Term Loan of $12.0 was advanced on October 1, 2008.
Effective August 4, 2008, the Company entered into a swap arrangement under which it fixed its borrowing costs with respect to the $24.0 (original principal) Term Loan outstanding for three years at 3.65%, plus the applicable margin of 3.25%, which was reduced to 3.00% on September 30, 2008. On November 14, 2008, the Company entered into a swap arrangement under which it fixed its borrowing costs with respect to the additional $12.0 (original principal) under the Term Loan borrowed on October 1, 2008 for three years at 2.635% per annum, plus the applicable margin of 3.00%.
On June 29, 2009, the Company and the Lenders entered into an amendment to the Credit Agreement, which extended the availability of the Delayed Draw Term Loan commitments from June 30, 2009 to December 31, 2009, and provided for the reduction of these commitments by $0.81 on each of June 30, 2009, September 30, 2009 and December 31, 2009. In addition, the Company’s obligation to maintain a minimum balance of $20.0 in cash deposits at all times was eliminated.
On December 31, 2009, the Company borrowed $24.57 under the Delayed Draw Term Loan. The Delayed Draw Term Loan provided for interest and payment terms similar to the Term Loan.
The Term Loan provided for monthly payments of interest and quarterly installments of principal of $1.08, which commenced on June 30, 2009. The quarterly installment of principal increased to $1.89 beginning March 31, 2010 to take into consideration the Delayed Draw Term Loan repayment schedule.
The Term Loan and the Delayed Draw Term Loan, plus accrued interest, totaling $49.9 were repaid on January 28, 2011 upon the closing of the $250 Million Secured Revolving Credit Facility.
NOTE 5: INCOME TAXES
Income taxes have been provided based upon the tax laws and rates in the countries in which operations are conducted and income is earned. The provision for income taxes for the three and six months ended June 30, 2012 and 2011 are as follows:
| Three Months Ended June 30, | Six Months Ended June 30, | |||||||||||||||
| 2012 | 2011 | 2012 | 2011 | |||||||||||||
| Federal |
$ | 6.5 | $ | 9.1 | $ | 16.1 | $ | 16.7 | ||||||||
| State |
1.7 | 1.6 | 3.6 | 3.0 | ||||||||||||
| Foreign |
0.7 | 0.4 | 1.6 | 1.1 | ||||||||||||
|
|
|
|
|
|
|
|
|
|||||||||
| Total provision for income taxes |
$ | 8.9 | $ | 11.1 | $ | 21.3 | $ | 20.8 | ||||||||
|
|
|
|
|
|
|
|
|
|||||||||
F-151
Table of Contents
At the end of each interim period, the Company estimates the annual effective tax rate and applies that rate to its ordinary year to date earnings. The tax expense or benefit related to significant, unusual or extraordinary items that will be separately reported or reported net of their related tax effect, and are individually computed, are recognized in the interim period in which those items occur. In addition, the effect of changes in enacted tax laws or rates or tax status is recognized in the interim period in which the change occurs.
The computation of the annual estimated effective tax rate at each interim period requires certain estimates and significant judgment including, but not limited to, the expected operating income for the year, projections of the proportion of income earned and taxed in various jurisdictions, permanent and temporary differences, and the likelihood of recovering deferred tax assets generated in the current year. The accounting estimates used to compute the provision for income taxes may change as new events occur, more experience is acquired, additional information is obtained or as the tax environment changes.
For the three months ended June 30, 2012 and 2011, the consolidated effective income tax rates were approximately 42.6% and 40.6, respectively. For the six months ended June 30, 2012 and 2011, the effective income tax rates were approximately 41.3% and 40.5%, respectively. The effective tax rates in the U.K. for the six months ended June 30, 2012, based upon consolidated pre-tax income in the U.K., was approximately 27.4%. AboveNet Communications UK Limited (“ACUK”) receives no benefit from the operating loss generated by AboveNet Communications Europe Limited (“ACE”), which files its U.K. income tax return on a stand alone basis. ACE is a foreign disregarded entity whose operating results are consolidated with the U.S. for federal income tax reporting purposes.
As part of the Company’s evaluation of deferred tax assets in the fourth quarter of 2011, the Company recognized a non-cash tax benefit of $9.2 at December 31, 2011 relating to the reduction of certain valuation allowances established with respect to deferred tax assets in the U.S. and the U.K. The Company believes it is more likely than not that it will utilize these assets to reduce or eliminate tax payments in future periods. The Company’s evaluation encompassed (i) a review of its recent history of profitability in the U.S. and U.K. for the past three years; (ii) a review of internal financial forecasts demonstrating its expected capacity to utilize deferred tax assets; and (iii) a reassessment of tax benefits recognition under FASB ASC 740.
NOTE 6: INCOME PER SHARE OF COMMON STOCK
Basic net income per common share is computed as net income divided by the weighted average number of shares of Common Stock outstanding for the period. Total weighted average shares utilized in computing basic net income per share of Common Stock were 26,282,486 and 25,818,689 for the three months ended June 30, 2012 and 2011, respectively. Total weighted average shares utilized in computing diluted net income per share of Common Stock were 27,114,859 and 26,837,305 for the three months ended June 30, 2012 and 2011, respectively. Dilutive securities include options to purchase shares of Common Stock, restricted stock units and stock warrants. For each of the three months ended June 30, 2012 and 2011, there were no potentially dilutive securities excluded from the calculation of diluted net income per share of Common Stock. For the six months ended June 30, 2012 and 2011, total weighted average shares utilized in computing basic net income per share of Common Stock were 26,270,912 and 25,811,337, respectively. For the six months ended June 30, 2012 and 2011, total weighted average shares utilized in computing diluted net income per share of Common Stock were 27,110,795 and 26,805,236, respectively. For each of the six months ended June 30, 2012 and 2011, there were no potentially dilutive securities excluded from the calculation of diluted net income per share of Common Stock.
NOTE 7: STOCK-BASED COMPENSATION
2011 Equity Incentive Plan, 2008 Equity Incentive Plan and 2003 Plan
On May 11, 2011, the Board of Directors of the Company adopted the AboveNet, Inc. 2011 Equity Incentive Plan (the “2011 Plan”), which provides for the availability of a maximum of 1,600,000 shares of Common Stock
F-152
Table of Contents
to be awarded to the Company’s employees (including officers), directors and consultants in the form of restricted stock unit awards, restricted stock awards, incentive stock options, non-qualified stock options, stock appreciation rights, performance-based awards and other stock- or cash-based awards. The 2011 Plan was approved by the Company’s stockholders at the Company’s 2011 Annual Meeting of Stockholders held on June 23, 2011. The 2011 Plan will be administered by the Compensation Committee, which will, in its sole discretion, determine which individuals may participate in the 2011 Plan and the type, extent and terms of the awards to be granted. The number of shares available for grant and the terms of outstanding grants are subject to adjustment for stock splits, stock dividends and other capital adjustments. As of June 30, 2012, 405,300 shares of Common Stock were reserved pursuant to outstanding restricted stock units and 1,194,700 shares of Common Stock were available for future grants.
On August 29, 2008, the Board of Directors of the Company approved the Company’s 2008 Plan. The 2008 Plan is administered by the Company’s Compensation Committee. Any employee, officer, director or consultant of the Company or subsidiary of the Company selected by the Compensation Committee is eligible to receive awards under the 2008 Plan. Stock options, restricted and unrestricted stock, restricted and unrestricted stock units and stock appreciation rights may be awarded to eligible participants on a stand alone, combination or tandem basis. 1,500,000 shares of Common Stock were initially reserved for issuance pursuant to awards granted under the 2008 Plan. The number of shares available for grant and the terms of outstanding grants are subject to adjustment for stock splits, stock dividends and other capital adjustments. Under the 2008 Plan, as of June 30, 2012, 957,637 shares of Common Stock were issued pursuant to the delivery of vested restricted stock units (including shares repurchased by the Company), 5,288 shares of Common Stock had been issued pursuant to the exercise of options to purchase shares of Common Stock, 9,281 shares of Common Stock were issued pursuant to the Option Dividend (as such term is defined in Note 8, “Shareholders’ Equity—Dividends,” below) on December 20, 2010, 374,977 shares of Common Stock were reserved pursuant to outstanding restricted stock units, 4,712 shares of Common Stock were reserved pursuant to outstanding options to purchase shares of Common Stock and 148,105 shares of Common Stock were available for future grants.
On September 8, 2003, the 2003 Plan became effective. Under the 2003 Plan, the Company was authorized to issue, in the aggregate, share-based awards of up to 2,129,912 shares of Common Stock to employees, directors and consultants who were selected to participate. The number of shares available for grant and the terms of outstanding grants are subject to adjustment for stock splits, stock dividends and other capital adjustments. Under the 2003 Plan, as of June 30, 2012, 1,169,432 shares of Common Stock had been issued pursuant to vested restricted stock units (including shares repurchased by the Company), 862,166 shares of Common Stock had been issued pursuant to options exercised to purchase shares of Common Stock, 63,936 shares of Common Stock were reserved pursuant to outstanding vested options to purchase shares of Common Stock and 34,378 shares of Common Stock were cancelled. No shares are available for future grants under the 2003 Plan.
Stock-based compensation expense for each period presented relates to share-based awards granted under the 2011 Plan described above, the 2008 Plan described above and the 2003 Plan described above, as applicable, and reflects awards outstanding during the applicable period, including awards granted both prior to and during such period.
Stock Options
There were no options to purchase shares of Common Stock granted during each of the three and six months ended June 30, 2012 and 2011. There was no non-cash stock-based compensation expense recognized with respect to options to purchase shares of Common Stock during each of the three and six months ended June 30, 2012 and 2011.
F-153
Table of Contents
Restricted Stock Units
On May 21, 2012, pursuant to the 2011 Plan, the Board of Directors of the Company awarded 500 restricted stock units to a certain employee. The fair value of the grant was $83.23 per share, the closing price of the Common Stock on the New York Stock Exchange on that day. The restricted stock units are scheduled to vest on November 16, 2012.
On April 9, 2012, pursuant to the 2011 Plan, the Board of Directors of the Company awarded 500 restricted stock units to a certain employee. The fair value of the grant was $82.89 per share, the closing price of the Common Stock on the New York Stock Exchange on that day. The restricted stock units are scheduled to vest on November 16, 2012.
On February 1, 2012, pursuant to the 2011 Plan, the Board of Directors of the Company awarded 12,000 restricted stock units to certain employees. The fair value of the grants was $70.19 per share, the closing price of the Common Stock on the New York Stock Exchange on that day. The restricted stock units are scheduled to vest 5,000, 4,000 and 3,000 on November 16, 2012, November 16, 2013 and November 16, 2014, respectively.
On December 1, 2011, pursuant to the 2011 Plan, the Board of Directors of the Company awarded 381,200 restricted stock units to certain employees, including 3,000 each to the five non-employee members of the Board of Directors and an aggregate 152,000 restricted stock units to the Company’s named executive officers as follows:
| Name |
Total | |||
| William G. LaPerch |
65,000 | |||
| Rajiv Datta |
45,000 | |||
| Joseph P. Ciavarella |
21,000 | |||
| Robert Sokota |
21,000 | |||
The fair value of the grants was $59.49 per share, the closing price of the Common Stock on the New York Stock Exchange on that day. The restricted stock units are scheduled to vest 127,059, 127,059 and 127,082 on November 16, 2012, November 16, 2013 and November 16, 2014, respectively.
On August 26, 2011, pursuant to the 2011 Plan, the Board of Directors of the Company awarded 15,000 restricted stock units to Mr. Nicholas Ridolfi, who became the Company’s Senior Vice President for Sales and a named executive officer on July 25, 2011. The fair value of the grant was $57.54 per share, the closing price of the Common Stock on the New York Stock Exchange on that day. The restricted stock units are scheduled to vest 10,000 shares on November 16, 2012 and 5,000 shares on November 16, 2013.
On January 25, 2011, pursuant to the 2008 Plan, the Company granted an aggregate 213,100 restricted stock units, of which 190,000 were granted to the Company’s named executive officers as follows (including the 15,000 restricted stock units granted to Mr. Datta in connection with his appointment as Chief Operating Officer):
| Name |
Total | |||
| William G. LaPerch |
65,000 | |||
| Rajiv Datta |
60,000 | |||
| Joseph P. Ciavarella |
21,000 | |||
| Robert Sokota |
21,000 | |||
| John Jacquay |
23,000 | |||
The fair value of each restricted stock unit granted was $59.25, the closing price of the Common Stock on the New York Stock Exchange on January 25, 2011. The 213,100 restricted stock units were originally scheduled to vest as follows: 15,000 on November 16, 2011; 132,066 on November 16, 2012; and 66,034 on November 16, 2013. Mr. Jacquay’s restricted stock units that were scheduled to vest in 2012 and 2013 were forfeited upon his resignation effective December 31, 2011. An additional 21,000 restricted stock units granted in 2011 were forfeited in 2011.
F-154
Table of Contents
On September 8, 2011, 222,008 restricted stock units originally granted on September 8, 2008 vested. On November 15, 2011, 58,000 restricted stock units vested, 16,000 of which were granted on September 8, 2008 and 42,000 of which were granted on October 27, 2008. These restricted stock units were delivered on November 15, 2011. Additionally, 42,000 restricted stock units granted on September 8, 2008 and originally scheduled to vest on September 8, 2011 were forfeited in 2011.
The Company recognized non-cash stock-based compensation expense related to restricted stock units of $6.4 and $6.8 for the three months ended June 30, 2012 and 2011, respectively, which had the effect of decreasing net income by $0.15 per basic share of Common Stock and by $0.14 per diluted share of Common Stock for the three months ended June 30, 2012 and by $0.16 per basic share of Common Stock and by $0.15 per diluted share of Common Stock for the three months ended June 30, 2011. The Company recognized non-cash stock-based compensation expense related to restricted stock units of $13.1 and $13.8 for the six months ended June 30, 2012 and 2011, respectively, which had the effect of decreasing net income by $0.30 per basic share of Common Stock and by $0.29 per diluted share of Common Stock for the six months ended June 30, 2012 and by $0.32 per basic share of Common Stock and by $0.31 per diluted share of Common Stock for the six months ended June 30, 2011.
Additionally, during the six months ended June 30, 2012, the Company delivered 15,246 shares of Common Stock to its Chief Executive Officer, William LaPerch, pursuant to the 14,000 vested performance-based restricted stock units granted to him in September 2008 and 1,246 restricted stock units granted pursuant to the RSU Dividend (as such term is defined in Note 8, “Shareholders’ Equity—Dividends,” below).
NOTE 8: SHAREHOLDERS’ EQUITY
Dividends
In November 2010, the Company obtained waivers from its lenders (Societe Generale, SunTrust Bank and CIT Lending Services Corporation) to permit a $5.00 per share dividend. On November 23, 2010, we announced that its Board of Directors declared a special one-time cash dividend of $5.00 per share on its Common Stock (the “Special Cash Dividend”). The Special Cash Dividend was paid on December 27, 2010 to the stockholders of record at the close of business on December 6, 2010. The aggregate amount of the payment made in connection with the Special Cash Dividend was approximately $129.0. On December 20, 2010, the Company’s Board of Directors granted restricted stock units (the “RSU Dividend”) to holders of unvested restricted stock units on the record date of the Special Cash Dividend in order to provide these holders with an amount that approximated the value of the Special Cash Dividend. In total, the Company granted 40,508 restricted stock units pursuant to the RSU Dividend, of which up to 1,246 restricted stock units vested in February 2011 based upon the achievement of certain performance targets established for fiscal year 2010, 28,656 restricted stock units are scheduled to vest on November 15, 2011, 9,360 are scheduled to vest November 16, 2011 and up to 1,246 restricted stock units are scheduled to vest on or before March 15, 2012 based upon the achievement of certain performance targets established for fiscal year 2011.
Additionally, on December 20, 2010, the Company’s Board of Directors granted shares of Common Stock (the “Option Dividend”) to holders of vested unexercised options to purchase shares of Common Stock in order to provide these holders with an amount that approximated the value of the Special Cash Dividend. On December 27, 2010, the Company delivered 9,281 shares of Common Stock pursuant to the Option Dividend. Additionally, the Company paid cash to one former employee and to the estate of one deceased employee totaling $0.007. In the fourth quarter of 2010, the Company recorded stock-based compensation expense of $0.5 in connection with the Option Dividend.
Stock Split
On August 3, 2009, the Board of Directors of the Company authorized a two-for-one Common Stock split, effected in the form of a 100% stock dividend, which was distributed on September 3, 2009. Each shareholder of
F-155
Table of Contents
record on August 20, 2009 received one additional share of Common Stock for each share of Common Stock held on that date. All share and per share information for prior periods, including warrants, options to purchase shares of Common Stock, restricted stock units, warrant and option exercise prices, shares reserved under the 2003 Plan and the 2008 Plan, weighted average fair value of options granted, Common Stock and additional paid-in capital accounts on the consolidated balance sheets and consolidated statement of shareholders’ equity, have been retroactively adjusted, where applicable, to reflect the two-for-one stock split.
Amendment to the Company’s Amended and Restated Certificate of Incorporation
On June 24, 2010, the Company’s stockholders approved an amendment to the Company’s Amended and Restated Certificate of Incorporation (the “Amendment”) to increase the number of authorized shares of its Common Stock from 30 million to 200 million. The number of authorized shares of preferred stock remained at 10 million.
The increase in the number of the Company’s authorized shares of Common Stock could have an anti-takeover effect by discouraging or hindering efforts to acquire control of the Company. The Company would be able to use the additional shares to oppose a hostile takeover attempt or delay or prevent changes in control or management of the Company. This was not the intent of the Board of Directors in adopting the Amendment, nor has the Amendment been adopted in response to any known threat to acquire control of the Company.
The increase in the authorized shares of Common Stock became effective upon the filing of the Amendment with the Secretary of State of the State of Delaware on June 24, 2010.
Rights Agreement
On August 3, 2006, the Company entered into a Rights Agreement (the “Rights Agreement”) with American Stock Transfer & Trust Company, as rights agent, which was amended and restated on August 3, 2009 and subsequently amended as of January 26, 2010 and March 18, 2012 (as amended, the “Amended and Restated Rights Agreement”). The Amended and Restated Rights Agreement was ratified by the Company’s stockholders at its annual meeting on June 24, 2010. As a result, the Rights (as defined below) under the Amended and Restated Rights Agreement will remain in effect until August 7, 2012, unless sooner terminated by the Company’s Board of Directors. The following description of the Amended and Restated Rights Agreement does not purport to be complete and is qualified in its entirety by reference to the Amended and Restated Rights Agreement included as Exhibit 4.1 to the Company’s Current Report on Form 8-K filed with the SEC on August 3, 2009, the Amendment to Amended and Restated Rights Agreement, dated as of January 26, 2010, between AboveNet, Inc. and American Stock Transfer & Trust Company, LLC included as Exhibit 4.1 to the Company’s Current Report on Form 8-K filed with the SEC on January 28, 2010 and the Second Amendment to the Amended and Restated Rights Agreement, dated as of March 18, 2012, between AboveNet, Inc. and American Stock Transfer & Trust Company, LLC included as Exhibit 4.6 to the Company’s Current Report on Form 8-K filed with the SEC on March 19, 2012.
In connection with the initial Rights Agreement, the Company’s Board of Directors declared a dividend distribution of one preferred share purchase right (a “Right”) for each then outstanding share of Common Stock. The dividend was paid on August 7, 2006 to the stockholders of record on that date.
Until the earlier to occur of (i) the date that is 10 days following the date of a public announcement that a person, entity or group of affiliated or associated persons have acquired beneficial ownership of 15% or more of the outstanding shares of Common Stock (an “Acquiring Person”) or (ii) 10 business days (or such later date as may be determined by action of the Company’s Board of Directors prior to such time as any person or entity becomes an Acquiring Person) following the commencement of, or announcement of an intention to commence, a tender offer or exchange offer the consummation of which would result in any person or entity becoming an Acquiring Person (the earlier of such dates being called the “Distribution Date”), the Rights will be evidenced by the Common Stock certificates or book-entry shares.
F-156
Table of Contents
The Rights are not exercisable until the Distribution Date. Each Right, upon becoming exercisable, will entitle the holder to purchase from the Company a specified fraction of a share of the Company’s Series A Junior Participating Preferred Stock (the “Preferred Shares”) at the then effective purchase price. The Rights will expire on August 7, 2012, unless earlier redeemed or exchanged.
The number of outstanding Rights and the number of Preferred Shares issuable upon exercise of the Rights are also subject to adjustment in the event of a stock split of the Common Stock or a stock dividend on the Common Stock payable in Common Stock or subdivisions, consolidation or combinations of the Common Stock occurring, in any case, prior to the Distribution Date. The purchase price payable and the number of Preferred Shares or other securities or other property issuable upon exercise of the Rights are subject to adjustment from time to time to prevent dilution as described in the Amended and Restated Rights Agreement. As a result of the Company’s stock split discussed above, appropriate adjustments under the Amended and Restated Rights Agreement have been made.
In the event that any person or group of affiliated or associated persons becomes an Acquiring Person, proper provision will be made so that each holder of a Right, other than Rights beneficially owned by the Acquiring Person and its associates and affiliates (which will thereafter be void), will have the right to receive upon exercise, in lieu of Preferred Shares, that number of shares of Common Stock having a market value of two times the then effective exercise price of the Right (or, if such number of shares is not and cannot be authorized, the Company may issue Preferred Shares, cash, debt, stock or a combination thereof in exchange for the Rights).
In the event that the Company is acquired in a merger or other business combination transaction or 50% or more of its consolidated assets or earning power are sold to an Acquiring Person, its associates or affiliates or certain other persons, proper provision will be made so that each holder of a Right, other than Rights beneficially owned by the Acquiring Person and its associates and affiliates (which will thereafter be void), will thereafter have the right to receive, upon the exercise thereof at the then current exercise price of the Right, in lieu of Preferred Shares, that number of shares of Common Stock of the acquiring company which at the time of such transaction will have a market value of two times the then effective exercise price per Right.
At any time after a person becomes an Acquiring Person and prior to the acquisition by such Acquiring Person of 50% or more of the outstanding shares of Common Stock, the Company may exchange the Rights (other than Rights owned by such Acquiring Person or group which have become void), in whole or in part, at an exchange ratio of one share of Common Stock per Right (or, at the election of the Company, the Company may issue cash, debt, stock or a combination thereof in exchange for the Rights), subject to adjustment.
At any time prior to the earlier of (i) such time that a person has become an Acquiring Person or (ii) the final expiration date, the Company may redeem all, but not less than all, of the outstanding Rights at a price of $0.005 per Right (the “Redemption Price”). The Rights may also be redeemed at certain other times as described in the Amended and Restated Rights Agreement. Immediately upon any redemption of the Rights, the right to exercise the Rights will terminate and the only right of the holders of Rights will be to receive the Redemption Price.
The terms of the Rights may be amended by the Company’s Board of Directors without the consent of the holders of the Rights, except that from and after such time as the rights are distributed no such amendment may adversely affect the interest of the holders of the Rights other than the interests of an Acquiring Person or its affiliates or associates.
Until a Right is exercised, the holder thereof, as such, will have no rights as a stockholder of the Company, including, without limitation, the right to vote or to receive dividends.
The March 18, 2012 amendment to the Rights Agreement permits the execution of the Merger Agreement (as such term is defined in Note 14, “Merger Agreement with Zayo Group, LLC,” below) and the performance and consummation of the transactions contemplated by the Merger Agreement, including the Merger (as such term is defined in Note 14, “Merger Agreement with Zayo Group, LLC,” below), without triggering the provisions of the Rights Agreement. See Note 14, “Merger Agreement with Zayo Group, LLC.”
F-157
Table of Contents
Repurchase Program
On December 7, 2011, the Board of Directors of the Company authorized a share repurchase program of up to $200.0 of the Common Stock through December 31, 2012 (the “Repurchase Program”). The Board also authorized management to enter into one or more prearranged stock repurchase plans under Rule 10b5-1 of the Securities Act of 1934 in connection with the Repurchase Program.
Through June 30, 2012, the Company purchased 41,157 shares pursuant to the Repurchase Program at a cost of $2.7, of which 11,700 shares were purchased during the three months ended March 31, 2012 at an aggregate cost of $0.8.
2010 Employee Stock Purchase Plan
On June 24, 2010, the Company’s stockholders approved the AboveNet, Inc. 2010 Employee Stock Purchase Plan, which was adopted by the Board of Directors on April 28, 2010 (as amended, the “Stock Purchase Plan”). The Stock Purchase Plan is administered by the Compensation Committee of the Board of Directors. The aggregate number of shares of Common Stock that may be issued pursuant to the Stock Purchase Plan is 300,000, subject to increase or decrease by reason of stock splits, reclassifications, stock dividends, or similar corporate events as determined by the Compensation Committee.
Eligibility and Participation
All employees of the Company, or any of its designated subsidiaries, who have completed at least ninety (90) days of employment on or before the first day of the applicable offering period are eligible to participate in the Stock Purchase Plan, subject to certain limitations imposed by the Internal Revenue Code and certain other limitations set forth in the Stock Purchase Plan. An employee may not participate in the Stock Purchase Plan if, immediately after he or she joined, he or she would own stock and/or hold rights to purchase stock possessing 5% or more of the total combined voting power or value of all classes of stock of the Company or of any subsidiary of the Company. Officers of the Company that are subject to the reporting requirements of Section 16(a) under the Securities Exchange Act of 1934 (the “Exchange Act”) are also not eligible to participate. The Stock Purchase Plan also limits an employee’s rights to purchase stock under all employee stock purchase plans (those subject to Section 423 of the Internal Revenue Code) of the Company and its subsidiaries so that such rights may not accrue at a rate that exceeds $0.025 of fair market value of such stock (determined as of the first day of the offering period) for each calendar year in which such right to purchase stock is outstanding at any time. In addition, no employee may purchase more than 200 shares of Common Stock under the Stock Purchase Plan in any offering period. Employees may withdraw from the Stock Purchase Plan at any time prior to the end of the then current offering period. As of December 31, 2011, the Company had a total of approximately 700 employees who were eligible to participate in the Stock Purchase Plan.
Offering Periods; Purchase Price
The Stock Purchase Plan operates by a series of offering periods of approximately 10 months in duration commencing on each January 16 and ending on November 15 (except that the 2010 offering period was from September 1, 2010 to November 15, 2010). The purchases are made for participants at the end of each offering period by applying payroll deductions accumulated over the course of the offering period towards such purchases. The payroll deductions accumulated over the course of the offering period are included in “Accrued expenses” in the Company’s consolidated balance sheet. The price at which these purchases will be made will equal 85% of the lesser of the fair market value of the Common Stock as of the first day of the offering period or the fair market value on the last day of the offering period.
F-158
Table of Contents
2012, 2011 and 2010 Offering Periods
117 employees are participating in the January 16, 2012 to November 16, 2012 offering period. Payroll withholdings to make purchases are scheduled to be $0.6 over the 2012 offering period, of which $0.1 and $0.3 was withheld during the three and six months ended June 30, 2012. 108 employees participated in the January 16, 2011 to November 15, 2011 offering period. Payroll withholdings to make purchases were $0.6 over the 2011 offering period. 86 employees participated in the September 1, 2010 to November 15, 2010 offering pursuant to which $0.2 was withheld over the 2010 offering period. The Company follows FASB Technical Bulletin No. 97-1, “Accounting under Statement 123 for Certain Employee Stock Purchase Plans with a Look-Back Option,” (now known as FASB ASC 718) and SFAS No. 123(R) (also now known as FASB ASC 718) to account for the Stock Purchase Plan. Because the Stock Purchase Plan provides for a discount greater than 5%, it is a compensatory plan and qualifies for fair value accounting. Accordingly, the fair market value of the grant is calculated as of the grant date in accordance with SFAS No. 123(R). Additionally, the fair value of the look-back option is calculated on a similar basis. The Company also estimates future forfeitures (withdrawals) from the Stock Purchase Plan as provided under FASB ASC 718. The Company recognized non-cash stock-based compensation expense with respect to the Stock Purchase Plan of $0.03 and $0.06 for the three and six months ended June 30, 2012, respectively, and $0.04 and $0.07 for the three and six months ended June 30, 2011, respectively. The Company issued 12,288 shares with respect to the 2011 Offering Period. The Company issued 4,414 shares of Common Stock with respect to the 2010 offering period.
NOTE 9: LITIGATION
The Company is subject to various legal proceedings and claims which arise in the normal course of business. The Company evaluates, among other things, the degree of probability of an unfavorable outcome and ability to estimate the amount of potential loss. The Company does not anticipate that the outcome of such matters (or the other matters described below) will have a material adverse effect on its business, financial condition or results of operations.
Global Voice Networks Limited (“GVN”)
AboveNet Communications UK Limited, the Company’s U.K. operating subsidiary (“ACUK”), was a party to a duct purchase and fiber lease agreement (the “Duct Purchase Agreement”) with EU Networks Fiber UK Ltd, formerly GVN. A dispute between the parties arose regarding the extent of the network duct that was sold and fiber that was leased to GVN pursuant to the Duct Purchase Agreement. As a result of this dispute, in 2006, GVN filed a claim against ACUK in the High Court of Justice in London seeking ownership of the disputed portion of the network duct, the right to lease certain fiber and associated damages. In December 2007, the court ruled in favor of GVN with respect to the disputed duct and fiber. In early February 2008, ACUK delivered most of the disputed duct and fiber to GVN. Additionally, under the original ruling, the Company was also required to construct the balance of the disputed duct and fiber and deliver it to GVN pursuant to a schedule ordered by the court. Additional portions of the disputed duct and fiber were constructed and subsequently delivered and other portions are scheduled for delivery. The Company also had certain repair and maintenance obligations that it must perform with respect to such duct. GVN was also seeking to enforce an option requiring ACUK to construct 180 to 200 chambers for GVN along the network. In June 2008, the Company paid $3.0 in damages pursuant to the liability trial. Additionally, the Company reimbursed GVN $1.8 for legal fees. Additionally, the Company’s legal fees aggregated $2.4. Further, the Company has incurred or is obligated for costs totaling $2.7 to build additional network. In early August 2008, the Company reached a settlement agreement under which the Company paid GVN $0.6 and agreed to provide additional construction of duct at an estimated cost of $1.2 and provide GVN limited additional access to ACUK’s network. GVN and ACUK provided mutual releases of all claims against each other, including ACUK’s repair obligation and chamber construction obligations discussed above. The Company recorded a loss on litigation of $11.7 at December 31, 2007. Through December 31, 2010, the Company paid $10.9 in connection with this litigation. During 2010, the Company recorded an additional provision of $0.9 to record additional expenses for repairs covered by the settlement. The obligations were
F-159
Table of Contents
denominated in British pounds, and accordingly, the amounts have been adjusted for changes in currency translation rates as appropriate. The Company has a remaining accrual balance of $0.7 relating to this litigation included in the Company’s consolidated balance sheets at both June 30, 2012 and December 31, 2011.
Employment Contract Termination
On July 11, 2011, the Company terminated the employment of Douglas Jendras, its former Senior Vice President of Operations. On August 3, 2011, Mr. Jendras filed a complaint in the United States District Court for the Southern District of New York alleging breach of his employment contract and seeking damages of $0.4 for salary and benefits and approximately $4.6 and specific performance with respect to 66,738 restricted stock units that were cancelled in connection with the termination of Mr. Jendras’ employment, plus recovery of legal fees and costs, and punitive damages. On September 30, 2011, the Company filed an answer to the complaint. The Company believes it has meritorious defenses that it intends to pursue vigorously.
Litigation Relating to the Merger
On March 22, 2012 and March 28, 2012, two class actions on behalf of the stockholders of the Company, respectively styled Raul v. LaPerch, et al., Index. No. 54232/2012 (the “Raul Action”), and Wachsler v. AboveNet Inc., et al., Index No. 54662/2012 (the “Wachsler Action”), were filed in the Supreme Court for the State of New York, County of Westchester. On March 30, 2012, a class action on behalf of the stockholders of the Company, styled Miramar Firefighters Pension Fund v. AboveNet, Inc., Case No. 7376, was filed in the Court of Chancery of the State of Delaware (the “Delaware action,” and together with the Raul Action and the Wachsler Action, the “Actions”). The Actions name as defendants the Company, Zayo Group, LLC and the members of the Company’s Board of Directors, Jeffrey Brodsky, Michael J. Embler, William LaPerch, Richard Postma, Richard Shorten, Jr. and Stuart Subotnick. The Raul Action and Delaware Action also name Voila Sub, Inc. as a defendant. The Actions allege that the members of the Company’s Board of Directors violated their fiduciary duties to the Company’s stockholders in connection with the Merger. The Raul Action and the Delaware Action further allege that the Company, Zayo Group, LLC and Voila Sub, Inc. aided and abetted those purported breaches, and the Wachlser Action further alleges that Company and Zayo Group, LLC aided and abetted those purported breaches. On April 17, 2012, the plaintiffs in the Delaware action filed an Amended Verified Class Action Complaint adding additional allegations in support of their breach of fiduciary duty claims, and on April 18, 2012 filed motions to expedite proceedings and for a preliminary injunction. On April 21, 2012, an Amended Class Action Complaint was filed in the Raul Action. On April 27, 2012, the parties in the Raul Action and the Wachsler Action filed stipulations providing that all further proceedings related to the merger would take place in the Delaware action and that the Raul Action and the Wachsler Action would be stayed through and including June 20, 2012. The stipulations also provided that all motions filed in either action would be adjourned. The Court approved these stipulations on April 30, 2012. On April 30, 2012, the defendants in the Delaware action filed a stipulated order and case management schedule. This order reflects, among other things, the parties’ agreement that the defendants will provide certain limited discovery to the plaintiffs. The Actions seek, among other things, an order enjoining the Merger as well as unspecified damages. The defendants deny the allegations in the Actions and intend to defend the Actions vigorously. See Note 14, “Merger Agreement with Zayo Group, LLC.”
From time to time, other legal matters in which the Company may be named as a defendant arise in the normal course of its business activities. The resolution of these legal matters against the Company cannot be accurately predicted. The Company does not anticipate that the outcome of such matters (or the other matters described above) will have a material adverse effect on its business, financial condition or results of operations.
NOTE 10: RELATED PARTY TRANSACTIONS
A member of the Company’s Board of Directors, Richard Postma, is also the Co-Chairman, Chief Executive Officer and co-founder of a telecommunications company. The Company sold services and/or material in the normal course of business to this telecommunications company in the amount of $ 0.1 for each of the three
F-160
Table of Contents
months ended June 30, 2012 and 2011 and $0.2 for each of the six months ended June 30, 2012 and 2011. No amounts were outstanding at each of June 30, 2012 and December 31, 2011. Mr. Postma also serves as the Chief Executive Officer of and holds a minority ownership interest in a construction company. The Company purchased certain installation and construction services totaling $0.002 in 2010, $0.03 in 2009 and $0.13 in 2008 from such construction firm. The Company had no purchases from such construction firm for each of the three and six months ended June 30, 2012 and 2011. All activities between the Company and these entities were conducted as independent arms length transactions consistent with similar terms and circumstances with any other customers or vendors. All accounts between the two parties are settled in accordance with invoice terms.
NOTE 11: SEGMENT REPORTING
SFAS No. 131, “Disclosures about Segments of an Enterprise and Related Information,” (now known as FASB ASC 280-10), defines operating segments as components of an enterprise for which separate financial information is available and which is evaluated regularly by the Company’s chief operating decision maker in deciding how to assess performance and allocate resources. The Company operates its business as one operating segment.
Geographic Information
Below is the Company’s revenue based on the location of its entity providing service. Long-lived assets are based on the physical location of the assets. The following table presents revenue and long-lived asset information for geographic areas:
| Three Months Ended June 30, | Six Months Ended June 30, | |||||||||||||||
| 2012 | 2011 | 2012 | 2011 | |||||||||||||
| Revenue |
||||||||||||||||
| United States |
$ | 116.7 | $ | 107.4 | $ | 232.2 | $ | 211.5 | ||||||||
| United Kingdom and Others |
15.8 | 12.5 | 31.3 | 24.4 | ||||||||||||
| Eliminations |
(3.5 | ) | (1.6 | ) | (6.8 | ) | (3.2 | ) | ||||||||
|
|
|
|
|
|
|
|
|
|||||||||
| Consolidated Worldwide |
$ | 129.0 | $ | 118.3 | $ | 256.7 | $ | 232.7 | ||||||||
|
|
|
|
|
|
|
|
|
|||||||||
| As of | ||||||||
| June 30, 2012 | December 31, 2011 | |||||||
| Long-lived assets |
||||||||
| United States |
$ | 588.0 | $ | 561.7 | ||||
| United Kingdom and Others |
55.1 | 49.8 | ||||||
|
|
|
|
|
|||||
| Consolidated Worldwide |
$ | 643.1 | $ | 611.5 | ||||
|
|
|
|
|
|||||
F-161
Table of Contents
NOTE 12: OTHER (EXPENSE) INCOME, NET
Other (expense) income, net consists of the following:
| Three Months Ended June 30, |
Six Months Ended June 30, |
|||||||||||||||
| 2012 | 2011 | 2012 | 2011 | |||||||||||||
| Gain on settlement or reversal of liabilities |
$ | 0.5 | $ | — | $ | 0.5 | $ | — | ||||||||
| Gain on settlement of insurance claim |
0.1 | — | 0.1 | — | ||||||||||||
| (Loss) gain on foreign currency |
(0.7 | ) | — | 0.1 | 0.8 | |||||||||||
| Loss on sale or disposition of property and equipment |
(0.1 | ) | (0.1 | ) | (0.1 | ) | (0.1 | ) | ||||||||
| Gain on recovery of property taxes previously paid |
— | 0.3 | — | 0.3 | ||||||||||||
| Settlement of interest rate swap agreements and write-off of unamortized debt issuance costs associated with the repayment of the Secured Credit Facility |
— | — | — | (1.6 | ) | |||||||||||
| Other, net |
0.1 | 0.1 | 0.1 | 0.2 | ||||||||||||
|
|
|
|
|
|
|
|
|
|||||||||
| Total |
$ | (0.1 | ) | $ | 0.3 | $ | 0.7 | $ | (0.4 | ) | ||||||
|
|
|
|
|
|
|
|
|
|||||||||
NOTE 13: COMMITMENTS AND CONTINGENCIES
Appointment of Chief Operating Officer
On January 25, 2011, the Board of Directors of the Company appointed Rajiv Datta, its Senior Vice President and Chief Technology Officer, as the Company’s Chief Operating Officer. In connection with this appointment, the Company’s Board of Directors approved the increase in Mr. Datta’s annual base salary from $0.3 to $0.4 and made a special grant to Mr. Datta of 15,000 restricted stock units, all of which vested and were delivered on November 16, 2011.
Employment Contracts
The Company maintains employment agreements with its key executives. The agreements include, among other things, certain change in control and severance provisions.
In September 2008, the Company entered into new employment agreements with each of William G. LaPerch, Chief Executive Officer and President; Mr. Datta; John Jacquay, Senior Vice President, Sales and Marketing and Robert Sokota, Senior Vice President and General Counsel (collectively with Mr. Joseph P. Ciavarella described below, the “Named Executive Officers”). Each of the contracts provides for a base rate of compensation, which may increase (but cannot decrease) during the term of the contract. Additionally, each contract provides for incentive cash bonus targets for each of the Named Executive Officers. Each of the Named Executive Officers will generally be entitled to the same benefits offered to the Company’s other executives. Each of the employment contracts provides for the payment of severance and the provision of certain other benefits in connection with certain termination events. The employment contracts also include confidentiality, non-compete and assignment of intellectual property covenants by each of the Named Executive Officers.
In October 2008, the Company entered into an employment agreement with Mr. Joseph P. Ciavarella under which Mr. Ciavarella agreed to become the Company’s Senior Vice President and Chief Financial Officer. The employment agreement is on substantially the same general terms as the September 2008 employment agreements described above.
The employment agreements were amended effective as of January 25, 2011. These amendments (a) extend the term of each Named Executive Officer’s employment agreement from November 16, 2011 through December 31, 2011, subject to automatic extensions for additional one-year periods unless cancelled by any of
F-162
Table of Contents
the Named Executive Officers or the Company in writing at least 120 days prior to the end of the applicable term, and (b) clarify that if the Named Executive Officer is employed by the Company on December 31 of the calendar year in which a bonus is being earned, the Named Executive Officer would be entitled to receive any bonus payable for that year. Mr. Datta’s employment agreement was also amended to reflect his new title and base salary. The employment agreements with each of Messrs. Ciavarella, Jacquay and Sokota were also amended to clarify that if so determined in the discretion of the Company’s Chief Executive Officer, such officer would report to the Company’s Chief Operating Officer. As of September 4, 2011, the employment agreements with each of Messrs. LaPerch, Datta, Ciavarella and Sokota automatically renewed for one year terms until December 31, 2012.
On April 27, 2011, the Company and John Jacquay, the Company’s Senior Vice President for Sales and Marketing, agreed that Mr. Jacquay would resign from his position as Senior Vice President of Sales and Marketing as of July 15, 2011. Mr. Jacquay continued to be employed by the Company and provided services on other projects through December 31, 2011, the expiration date of his employment agreement with the Company (the “Contract Expiration Date”), at which time he separated from the Company. In connection with his separation from the Company on the Contract Expiration Date, Mr. Jacquay forfeited any unvested stock units held by him as of that date. The Company and Mr. Jacquay also agreed that his bonus target amount for 2011 would be $0.3.
On July 25, 2011, the Company entered into an employment agreement with Mr. Nicholas Ridolfi under which Mr. Ridolfi agreed to become the Company’s Senior Vice President for Sales. The employment agreement provides for an annual base salary of $0.25, a target bonus of $0.1 for 2011 and $0.25 for 2012, and a term extending to December 31, 2012. Mr. Ridolfi’s employment agreement provides for the payment of severance in connection with certain termination events and includes confidentiality, non-compete and assignment of intellectual property covenants.
Effective November 30, 2011, the Company and each of William G. LaPerch (Chief Executive Officer and President), Rajiv Datta (Chief Operating Officer), Joseph P. Ciavarella (Senior Vice President and Chief Financial Officer) and Robert Sokota (Senior Vice President and General Counsel) entered into amendments to their respective employment agreements providing for the extension of the termination date from December 31, 2012 to December 31, 2013. No other changes to these employment agreements were effected. Each of these employment agreements currently provides that its term shall be automatically extended, unless sooner terminated as provided therein, for successive additional one-year periods, unless at least 120 days prior to the end of the term, the Company or the respective executive has notified the other that the term will not be extended.
Internal Revenue Service
In September 2008, the Company was notified by the Internal Revenue Service (the “IRS”) that it was reclassifying certain individuals, classified by the Company as independent contractors, to employees and, accordingly, assessing certain payroll taxes and penalties totaling $0.3. The Company disputed this position citing relief provided by IRC Section 530 and IRC Section 3509. On January 13, 2009, the IRS made a settlement offer to the Company, which the Company executed on March 10, 2009 and the IRS countersigned on May 11, 2009. Under the terms of the settlement agreement, the Company agreed to pay $0.015 to the IRS to fully discharge any federal employment tax liability it may have owed for 2005. The IRS agreed not to dispute the classification of “such workers” for federal employment tax purposes for any period from January 1, 2005 to March 31, 2009. Beginning April 1, 2009, the Company agreed to treat “Consultants,” as described in the settlement agreement, who perform equivalent duties as employees of the Company as employees. Finally, the Company agreed to extend the statute of limitations with respect to federal employment tax payments for the period covered by the settlement agreement (January 1, 2005 to March 31, 2009) to April 1, 2012.
F-163
Table of Contents
New York City Franchise Agreement
As a result of certain ongoing litigation with a third party, for several years, the Department of Information Technology and Telecommunications of the City of New York (“DOITT”) suspended any discussions regarding renewals of telecommunications franchises in the City of New York. As a result, it is the Company’s understanding that DOITT has not renewed any recently expired franchise agreement, including the Company’s franchise agreement which expired on December 20, 2008. Prior to the expiration of the Company’s franchise agreement, the Company sought out and received written confirmation from DOITT that the Company’s franchise agreement provides a basis for the Company to continue to operate in the City of New York pending conclusion of renewal discussions. The Company believes that a number of other operators in the City of New York are operating on a similar basis.
DOITT recently issued a solicitation for bids for franchises authorizing the installation of landline facilities in the City of New York’s right-of-way for the provision of information services and telecommunication services. Based on the Company’s review of the solicitation and its discussion with officials for DOITT, the Company understands that franchises to be issued in connection with the solicitation will replace the existing broadband franchise for services providers in the City of New York. The fees for providers proposed in the solicitation are substantially higher than the franchise fees paid by the Company. The Company will continue its efforts to negotiate a mutually acceptable replacement franchise arrangement with DOITT.
Capital Investments and Network Expansion
The Company, from time to time, commits capital for, among other things, (i) customer capital (to connect customers to the network); (ii) expansion and improvement of infrastructure; and (iii) equipment. The Company also commits capital for investments in selected markets. In 2010, the Company incurred expenses to open up Denver as a market and expand into Paris, Amsterdam and Frankfurt in Europe. Additionally, the Company connected Miami to its long haul network and received a favorable ruling from the Canadian authorities regarding its ability to lease and light fiber for its operations in Toronto. The Company intends to open Toronto as a market in 2012. The Company may increase its presence in these markets or the Company may develop other markets in the U.S. or internationally. The Company believes it has the liquidity and capacity to execute such plans.
Environmental Protection Agency Obligations
The Company recently became aware of certain reports that the Environmental Protection Agency (the “EPA”) requires the Company to file. The reports relate to the storage of sulfuric acid, fuel and lead by the Company. The rules governing the EPA reporting provide for penalties for failure to timely file these reports. The rules include provisions that allow companies to voluntarily disclose the failure to file and potentially mitigate penalties otherwise due. The Company has disclosed to the EPA its failure to file in the past and has subsequently made the required filings. The Company believes that under these rules, it can mitigate substantially all of the penalties. Accordingly, the consolidated financial statements included herein do not include an accrual for such penalties as of and for the period ended June 30, 2012.
NOTE 14: MERGER AGREEMENT WITH ZAYO GROUP, LLC
On March 18, 2012, the Company entered into an Agreement and Plan of Merger (the “Merger Agreement”) with Zayo Group, LLC, a Delaware limited liability company (“Parent”), and Voila Sub, Inc., a Delaware corporation and a wholly owned subsidiary of Parent (“Merger Sub”), providing for the merger of Merger Sub with and into the Company (the “Merger”), with the Company surviving the Merger as a wholly owned subsidiary of Parent. The Merger Agreement was unanimously approved by the Company’s Board of Directors.
At the effective time of the Merger, each share of Common Stock issued and outstanding immediately prior to the effective time (other than shares (i) held in the Company’s treasury or held by any wholly-owned subsidiary
F-164
Table of Contents
of the Company, (ii) owned by Parent, Merger Sub or any wholly-owned subsidiary of Parent, or (iii) owned by stockholders who have perfected and not withdrawn a demand for appraisal rights under Delaware law) was automatically cancelled and converted into the right to receive $84.00 in cash (the “Per Share Amount”), without interest, on the terms and subject to the conditions set forth in the Merger Agreement.
At the effective time of the Merger, (i) each outstanding option to purchase Common Stock, whether vested or unvested, was converted into cash equal to the amount (if any) by which the Per Share Amount exceeded the exercise price payable under that option, (ii) each outstanding restricted stock unit issued by the Company, whether vested or unvested, was converted into cash equal to the number of shares of the Common Stock subject to that restricted stock unit multiplied by the Per Share Amount, and (iii) if the closing of the Merger occurred prior to the end of the offering period underway under the Stock Purchase Plan, each participant in that offering was paid an amount equal to the product of (x) the amount, if any, by which the Per Share Amount exceeded the applicable exercise price and (y) the number of shares of the Common Stock the participant could purchase with his or her accumulated payroll deductions as of the business day immediately prior to the closing of the Merger at the applicable exercise price.
Parent and Merger Sub obtained equity and debt financing commitments for the transaction contemplated by the Merger Agreement, the proceeds of which was used by Parent to pay the aggregate Per Share Amount and all other amounts, fees and expenses due in connection with the transactions contemplated by the Merger Agreement.
The Company filed its definitive proxy statement with the SEC on May 3, 2012, for a special meeting of stockholders held on June 5, 2012 at which the stockholders voted upon a proposal to adopt the Merger Agreement and certain related proposals. On June 5, 2012, the Company announced that its stockholders had approved the proposal to adopt the Merger Agreement and certain related proposals.
On July 2, 2012, the Company completed its merger (the “Merger”) with the Merger Sub, pursuant to the Merger Agreement. Pursuant to the Merger Agreement, Merger Sub merged with and into the Company, with the Company surviving the Merger as a wholly-owned subsidiary of Parent.
In conjunction with the closing of the Merger, the Company repaid in full and terminated its existing Revolving Credit Agreement, dated as of January 28, 2011, and as amended by the First Amendment dated as of March 28, 2011, among the Company, its subsidiaries AboveNet Communications, Inc., AboveNet of Utah, L.L.C., AboveNet of VA, L.L.C. and AboveNet International, Inc., the lenders a party thereto and SunTrust Bank, as administrative agent.
In connection with the closing of the Merger, the Company also notified the New York Stock Exchange (the “NYSE”) that each outstanding share of common stock, par value $0.01 per share, of the Company (the “Common Stock”) was cancelled and automatically converted into the right to receive $84.00 per share in cash, without interest and less any applicable withholding taxes (other than (i) shares held by the Company, Parent, Merger Sub or their subsidiaries and (ii) shares for which appraisal rights have been perfected), and requested that the NYSE file with the Securities and Exchange Commission (the “SEC”) an application on Form 25 to delist and deregister the Common Stock under Section 12(b) of the Securities Exchange Act of 1934, as amended. Trading of the Common Stock on the NYSE was suspended prior to the opening of trading on July 2, 2012.
Effective as of the closing of the Merger, each outstanding share of Common Stock (other than (i) shares held by the Company, Parent, Merger Sub or their subsidiaries; and (ii) shares for which appraisal rights have been perfected) was cancelled and automatically converted into the right to receive $84.00 in cash, without interest and less any applicable withholding taxes.
Prior to approving the transactions contemplated by the Merger Agreement, the Company’s Board of Directors received fairness opinions from its financial advisors. In connection with these fairness opinions, the
F-165
Table of Contents
Company paid $3.5, which is reflected in “Selling, general and administrative expenses” in the Company’s consolidated statement of operations for each of the three and six months ended June 30, 2012.
The aggregate purchase price paid for all equity securities of the Company was approximately $2.2 billion, net of cash acquired by Parent. The aggregate purchase price and related fees and expenses were funded by new credit facilities and private offerings of debt securities, as well as by equity financing provided by investment funds affiliated with GTCR, LLC, together with other co-investors, including existing indirect owners of Parent.
All of the members of the Board of Directors of the Company prior to the Merger voluntarily resigned from the Company’s Board of Directors and all committees thereof, effective as of the effective time of the Merger. The members of the Board of Directors of the Company immediately after consummation of the Merger are Daniel P. Caruso, Gillis Cashman, Michael Choe, John A. Downer, John Siegel, Rick Connor, Phillip A. Canfield and Lawrence Fey.
At the effective time of the Merger, on July 2, 2012, the certificate of incorporation and the bylaws of the Company, each as in effect immediately prior to the Merger, were amended in their entirety in accordance with the terms of the Merger Agreement.
F-166
Table of Contents

360networks Corporation
CONSOLIDATED FINANCIAL STATEMENTS
F-167
Table of Contents
REPORT OF INDEPENDENT REGISTERED PUBLIC ACCOUNTING FIRM
The Board of Directors and Shareholders
360networks Corporation
We have audited the accompanying consolidated balance sheets of 360networks Corporation (the “Company”) as of December 31, 2010 and 2009, and the related consolidated statements of income, changes in stockholders’ equity, and cash flows for each of the three years in the period ended December 31, 2010. These consolidated financial statements are the responsibility of the Company’s management. Our responsibility is to express an opinion on these consolidated financial statements based on our audits.
We conducted our audits in accordance with the standards of the Public Company Accounting Oversight Board (United States). Those standards require that we plan and perform the audit to obtain reasonable assurance about whether the consolidated financial statements are free of material misstatement. The Company is not required to have, nor were we engaged to perform, an audit of its internal control over financial reporting. Our audit included consideration of internal control over financial reporting as a basis for designing audit procedures that are appropriate in the circumstances, but not for the purpose of expressing an opinion on the effectiveness of the Company’s internal control over financial reporting. Accordingly, we express no such opinion. An audit also includes examining, on a test basis, evidence supporting the amounts and disclosures in the consolidated financial statements, assessing the accounting principles used and significant estimates made by management, as well as evaluating the overall consolidated financial statement presentation. We believe that our audits provide a reasonable basis for our opinion.
In our opinion, the consolidated financial statements referred to above present fairly, in all material respects, the consolidated financial position of 360networks Corporation as of December 31, 2010 and 2009, and the consolidated results of its operations and its cash flows for each of the three years in the period ended December 31. 2010, in conformity with accounting principles generally accepted in the United States of America.
/s/ Moss Adams LLP
Spokane, Washington
July 11, 2012
F-168
Table of Contents
360networks Corporation
| Unaudited September 30, |
December 31, | |||||||||||
| 2011 | 2010 | 2009 | ||||||||||
| ASSETS |
||||||||||||
| Cash and cash equivalents |
$ | 15,453,484 | $ | 9,222,367 | $ | 12,404,949 | ||||||
| Accounts receivable, net |
8,411,865 | 4,142,024 | 14,269,888 | |||||||||
| Note receivable, current portion |
181,343 | 172,305 | 160,689 | |||||||||
| Income tax refund receivable |
— | — | — | |||||||||
| Prepaid expenses |
1,951,631 | 1,860,552 | 1,491,906 | |||||||||
|
|
|
|
|
|
|
|||||||
| Total current assets |
25,998,323 | 15,397,248 | 28,327,432 | |||||||||
| Restricted cash |
357,500 | 357,500 | 466,775 | |||||||||
| Investments |
87,622,322 | 34,698,432 | 8,185,209 | |||||||||
| Restricted investments |
27,988,093 | 27,988,093 | — | |||||||||
| Note receivable |
860,346 | 997,634 | 1,169,939 | |||||||||
| Property and equipment, net |
77,826,810 | 73,855,994 | 61,682,009 | |||||||||
| Intangible assets |
245,189 | 260,817 | 281,655 | |||||||||
|
|
|
|
|
|
|
|||||||
| Total assets |
$ | 220,898,583 | $ | 153,555,718 | $ | 100,113,019 | ||||||
|
|
|
|
|
|
|
|||||||
| LIABILITIES |
||||||||||||
| Accounts payable |
$ | 7,117,308 | $ | 10,531,507 | $ | 6,210,542 | ||||||
| Wages payable |
5,662,850 | 5,177,391 | 3,952,322 | |||||||||
| Leases payable, current portion |
49,353 | 35,699 | 43,658 | |||||||||
| Income tax payable |
366,008 | 525,161 | 28,190 | |||||||||
| Other accrued liabilities |
17,634,316 | 17,176,009 | 22,251,707 | |||||||||
| Deferred revenue, current portion |
3,308,027 | 3,279,361 | 2,935,786 | |||||||||
|
|
|
|
|
|
|
|||||||
| Total current liabilities |
34,137,862 | 36,725,128 | 35,422,205 | |||||||||
| Deferred revenue |
39,611,743 | 35,873,832 | 36,365,739 | |||||||||
| Other long-term liabilities |
354,326 | 288,951 | 3,657,680 | |||||||||
|
|
|
|
|
|
|
|||||||
| Total liabilities |
74,103,931 | 72,887,911 | 75,445,624 | |||||||||
| COMMITMENTS AND CONTINGENCIES |
||||||||||||
| STOCKHOLDERS’ EQUITY |
||||||||||||
| Common Stock ($0 par value, 10,713,726; 10,607,573; and 10,545,855 shares issued, authorized and outstanding as of December 31, 2010, 2009, and 2008, respectively) |
75,725,498 | 75,709,898 | 75,708,112 | |||||||||
| Additional paid in capital |
27,658,409 | 26,017,607 | 25,995,855 | |||||||||
| Accumulated other comprehensive income |
76,870,142 | 19,847,571 | 1,456,165 | |||||||||
| Retained deficit |
(33,459,397 | ) | (40,907,269 | ) | (78,492,737 | ) | ||||||
|
|
|
|
|
|
|
|||||||
| Total Stockholders’ Equity |
146,794,652 | 80,667,807 | 24,667,395 | |||||||||
|
|
|
|
|
|
|
|||||||
| Total Liabilities & Stockholders’ Equity |
$ | 220,898,583 | $ | 153,555,718 | $ | 100,113,019 | ||||||
|
|
|
|
|
|
|
|||||||
See accompanying notes
F-169
Table of Contents
360networks Corporation
Consolidated Statements of Income
| Unaudited Nine Months Ended September 30, |
Year
Ended December 31, |
|||||||||||||||||||
| 2011 | 2010 | 2010 | 2009 | 2008 | ||||||||||||||||
| Network and communication services |
$ | 57,100,211 | $ | 45,330,921 | $ | 62,160,754 | $ | 53,655,717 | $ | 44,448,803 | ||||||||||
| Infrastructure |
10,978,864 | 10,304,296 | 13,967,665 | 13,458,884 | 12,824,015 | |||||||||||||||
|
|
|
|
|
|
|
|
|
|
|
|||||||||||
| Operating revenue |
$ | 68,079,065 | $ | 55,635,217 | $ | 76,128,419 | $ | 67,114,601 | $ | 57,272,818 | ||||||||||
| Direct operating costs (excluding depreciation) |
27,671,457 | 23,487,722 | 31,354,399 | 28,744,876 | 24,911,980 | |||||||||||||||
| Selling, general and administrative |
21,588,944 | 20,392,908 | 27,200,978 | 25,773,945 | 23,426,052 | |||||||||||||||
| Depreciation |
9,194,044 | 6,582,361 | 9,050,821 | 7,099,024 | 6,006,234 | |||||||||||||||
| Accretion |
189,717 | (1,358,546 | ) | (1,285,410 | ) | 780,141 | (263,471 | ) | ||||||||||||
| Restructuring expense |
66,445 | 299,320 | 216,303 | 88,870 | 540,024 | |||||||||||||||
|
|
|
|
|
|
|
|
|
|
|
|||||||||||
| Operating income |
9,368,458 | 6,231,452 | 9,591,328 | 4,627,745 | 2,651,999 | |||||||||||||||
| Net gain (loss) on settlements |
(3,255,445 | ) | 37,000 | 37,000 | 9,725,000 | 441,003 | ||||||||||||||
| Net gain (loss) on sale or transfer of assets |
7,946 | 23,401,172 | 23,401,172 | 23,126 | (239,405 | ) | ||||||||||||||
| Interest expense |
(46,922 | ) | (66,535 | ) | (79,415 | ) | (80,645 | ) | (72,669 | ) | ||||||||||
| Interest and dividend income |
1,622,371 | 1,768,087 | 1,911,078 | 262,675 | 465,214 | |||||||||||||||
| Other income |
(97,722 | ) | 4,389,448 | 3,256,065 | 1,075,515 | 7,952,533 | ||||||||||||||
|
|
|
|
|
|
|
|
|
|
|
|||||||||||
| Income before income taxes |
7,598,686 | 35,760,624 | 38,117,228 | 15,633,416 | 11,198,675 | |||||||||||||||
| Provision for income taxes |
150,814 | 526,592 | 531,760 | 77,240 | 133,759 | |||||||||||||||
|
|
|
|
|
|
|
|
|
|
|
|||||||||||
| Net income |
$ | 7,447,872 | $ | 35,234,032 | $ | 37,585,468 | $ | 15,556,176 | $ | 11,064,916 | ||||||||||
|
|
|
|
|
|
|
|
|
|
|
|||||||||||
See accompanying notes
F-170
Table of Contents
360networks Corporation
Consolidated Changes in Stockholders’ Equity
| Common Shares | Other Capital Accounts | |||||||||||||||||||||||
| Number of shares |
Amount | Additional paid in capital |
Accumulated other comprehensive income |
Retained deficit |
Total | |||||||||||||||||||
| Balance, December 31, 2007 |
12,747,184 | $ | 97,717,748 | $ | 20,212,154 | $ | 2,011,731 | $ | (105,113,829 | ) | $ | 14,827,804 | ||||||||||||
| Share options exercised |
12,285 | 17,561 | 17,561 | |||||||||||||||||||||
| Repurchase of issued and outstanding common stock |
(2,217,989 | ) | (22,098,905 | ) | 3,575,188 | (18,523,717 | ) | |||||||||||||||||
| Issuance of restricted stock |
4,375 | 60,523 | 60,523 | |||||||||||||||||||||
| Stock based compensation |
1,297,115 | 1,297,115 | ||||||||||||||||||||||
| Comprehensive income |
||||||||||||||||||||||||
| Net income |
11,064,916 | 11,064,916 | ||||||||||||||||||||||
| Other comprehensive income |
||||||||||||||||||||||||
| Reclassification of realized loss on available for sale securities |
336,409 | 336,409 | ||||||||||||||||||||||
| Unrealized loss on available-for-sale equity securities |
(696,412 | ) | (696,412 | ) | ||||||||||||||||||||
| Foreign currency translation |
(96,323 | ) | (96,323 | ) | ||||||||||||||||||||
|
|
|
|
|
|
|
|||||||||||||||||||
| Total comprehensive income |
10,608,590 | |||||||||||||||||||||||
|
|
|
|
|
|
|
|
|
|
|
|
|
|||||||||||||
| Balance, December 31, 2008 |
10,545,855 | $ | 75,636,404 | $ | 25,144,980 | $ | 1,555,405 | $ | (94,048,913 | ) | $ | 8,287,876 | ||||||||||||
|
|
|
|
|
|
|
|
|
|
|
|
|
|||||||||||||
| Share options exercised |
39,836 | 92,970 | 92,970 | |||||||||||||||||||||
| Repurchase of issued and outstanding common stock |
(21,680 | ) | (21,262 | ) | (308,876 | ) | (330,138 | ) | ||||||||||||||||
| Issuance of restricted stock |
43,562 | 225,058 | 225,058 | |||||||||||||||||||||
| Stock based compensation |
934,693 | 934,693 | ||||||||||||||||||||||
| Comprehensive income |
||||||||||||||||||||||||
| Net income |
15,556,176 | 15,556,176 | ||||||||||||||||||||||
| Other comprehensive income |
||||||||||||||||||||||||
| Unrealized loss on available-for-sale equity securities |
(167,387 | ) | (167,387 | ) | ||||||||||||||||||||
| Foreign currency translation |
68,147 | 68,147 | ||||||||||||||||||||||
|
|
|
|
|
|
|
|||||||||||||||||||
| Total comprehensive income |
15,456,936 | |||||||||||||||||||||||
|
|
|
|
|
|
|
|
|
|
|
|
|
|||||||||||||
| Balance, December 31, 2009 |
10,607,573 | 75,708,112 | 25,995,855 | 1,456,165 | (78,492,737 | ) | $ | 24,667,395 | ||||||||||||||||
|
|
|
|
|
|
|
|
|
|
|
|
|
|||||||||||||
F-171
Table of Contents
360networks Corporation
Consolidated Changes in Stockholders’ Equity
| Common Shares | Other Capital Accounts | |||||||||||||||||||||||
| Number of shares |
Amount | Additional paid in Capital |
Accumulated other comprehensive income |
Retained Deficit |
Total | |||||||||||||||||||
| Balance, December 31, 2009 |
10,607,573 | $ | 75,708,112 | $ | 25,995,855 | $ | 1,456,165 | $ | (78,492,737 | ) | $ | 24,667,395 | ||||||||||||
|
|
|
|
|
|
|
|
|
|
|
|
|
|||||||||||||
| Share options exercised |
3,207 | 1,786 | 1,786 | |||||||||||||||||||||
| Repurchase of vested stock options |
(492,425 | ) | (492,425 | ) | ||||||||||||||||||||
| Issuance of restricted stock |
102,946 | |||||||||||||||||||||||
| Stock based compensation |
514,177 | 514,177 | ||||||||||||||||||||||
| Comprehensive income |
||||||||||||||||||||||||
| Net income |
37,585,468 | 37,585,468 | ||||||||||||||||||||||
| Other comprehensive income |
||||||||||||||||||||||||
| Reclassification of realized gain on available-for-sale securities |
105,147 | 105,147 | ||||||||||||||||||||||
| Unrealized gain on available-for-sale equity securities |
15,525,867 | 15,525,867 | ||||||||||||||||||||||
| Foreign currency translation |
2,760,392 | 2,760,392 | ||||||||||||||||||||||
|
|
|
|
|
|
|
|||||||||||||||||||
| Total comprehensive income |
55,976,874 | |||||||||||||||||||||||
|
|
|
|
|
|
|
|
|
|
|
|
|
|||||||||||||
| Balance, December 31, 2010 |
10,713,726 | $ | 75,709,898 | $ | 26,017,607 | $ | 19,847,571 | $ | (40,907,269 | ) | $ | 80,667,807 | ||||||||||||
|
|
|
|
|
|
|
|
|
|
|
|
|
|||||||||||||
| Unaudited | ||||||||||||||||||||||||
| Share options exercised |
15,000 | 15,600 | 15,600 | |||||||||||||||||||||
| Repurchase of vested stock options |
(29,265 | ) | (29,265 | ) | ||||||||||||||||||||
| Issuance of restricted stock |
119,280 | |||||||||||||||||||||||
| Stock based compensation |
1,670,067 | 1,670,067 | ||||||||||||||||||||||
| Comprehensive income |
||||||||||||||||||||||||
| Net income |
7,447,872 | 7,447,872 | ||||||||||||||||||||||
| Other comprehensive income |
||||||||||||||||||||||||
| Unrealized gain on available-for-sale equity securities |
63,591,530 | 63,591,530 | ||||||||||||||||||||||
| Foreign currency translation |
(6,568,959 | ) | (6,568,959 | ) | ||||||||||||||||||||
|
|
|
|
|
|
|
|||||||||||||||||||
| Total comprehensive income |
64,470,443 | |||||||||||||||||||||||
|
|
|
|
|
|
|
|
|
|
|
|
|
|||||||||||||
| Balance, September 30, 2011 |
10,848,006 | $ | 75,725,498 | $ | 27,658,409 | $ | 76,870,142 | ($ | 33,459,397 | ) | $ | 146,794,652 | ||||||||||||
|
|
|
|
|
|
|
|
|
|
|
|
|
|||||||||||||
See accompanying notes
F-172
Table of Contents
360networks Corporation
Consolidated Statements of Cash Flows
| Unaudited Nine Months Ended September 30, |
Year Ended December 31, | |||||||||||||||||||
| 2011 | 2010 | 2010 | 2009 | 2008 | ||||||||||||||||
| Operating activities |
||||||||||||||||||||
| Net income for the period |
$ | 7,447,872 | $ | 35,234,032 | $ | 37,585,468 | $ | 15,556,176 | $ | 11,064,916 | ||||||||||
| Add (deduct) items to reconcile to net cash from operating activities |
||||||||||||||||||||
| Stock based compensation |
1,670,067 | 407,741 | 514,177 | 1,159,751 | 1,357,638 | |||||||||||||||
| Provision for bad debts |
(808,700 | ) | 211,687 | 145,896 | 285,612 | 211,498 | ||||||||||||||
| Depreciation and accretion |
9,383,761 | 5,223,815 | 7,765,411 | 7,879,165 | 5,742,763 | |||||||||||||||
| Net gain on settlements |
3,255,445 | (37,000 | ) | (37,000 | ) | (9,725,000 | ) | (441,003 | ) | |||||||||||
| Net gain on sale of assets |
(7,946 | ) | (23,401,172 | ) | (23,401,172 | ) | (23,126 | ) | (97,004 | ) | ||||||||||
| Net gain on extinguishment of liabilities |
— | (4,346,131 | ) | (4,551,623 | ) | — | (2,040,015 | ) | ||||||||||||
| Loss on unsecured creditor settlement |
— | — | 1,475,691 | — | — | |||||||||||||||
| Loss on sale of investments |
— | — | 21,622 | 3,216 | 336,409 | |||||||||||||||
| Changes in operating working capital items |
(6,237,582 | ) | 7,903,953 | 10,803,853 | (5,302,452 | ) | 11,076,561 | |||||||||||||
|
|
|
|
|
|
|
|
|
|
|
|||||||||||
| Cash from operating activities |
14,702,917 | 21,196,925 | 30,322,323 | 9,833,342 | 27,211,763 | |||||||||||||||
|
|
|
|
|
|
|
|
|
|
|
|||||||||||
| Investing activities |
||||||||||||||||||||
| Additions to property and equipment |
(13,043,557 | ) | (11,915,776 | ) | (23,067,713 | ) | (9,064,413 | ) | (15,104,999 | ) | ||||||||||
| Purchase of investments |
— | (11,271,817 | ) | (11,044,905 | ) | (8,000,000 | ) | (889,843 | ) | |||||||||||
| Proceeds from sale of investments |
4,485,648 | — | — | 324,293 | 15,442,816 | |||||||||||||||
| Proceeds from sale of assets |
7,946 | 907,746 | 907,746 | 23,126 | 103,499 | |||||||||||||||
| Change in restricted cash |
— | 109,275 | 109,275 | 193,225 | 374,726 | |||||||||||||||
| Payments on note receivable |
128,250 | 119,639 | 160,689 | 149,856 | 139,448 | |||||||||||||||
|
|
|
|
|
|
|
|
|
|
|
|||||||||||
| Cash from investing activities |
(8,421,713 | ) | (22,050,933 | ) | (32,934,908 | ) | (16,373,913 | ) | 65,647 | |||||||||||
|
|
|
|
|
|
|
|
|
|
|
|||||||||||
| Financing activities |
||||||||||||||||||||
| Payments on capital leases |
(36,422 | ) | (32,976 | ) | (79,358 | ) | (43,658 | ) | (21,967 | ) | ||||||||||
| Repurchase of issued and outstanding stock |
(29,265 | ) | (396,656 | ) | (492,425 | ) | (330,138 | ) | (18,523,717 | ) | ||||||||||
| Exercise of stock options |
15,600 | — | 1,786 | 92,970 | 17,561 | |||||||||||||||
|
|
|
|
|
|
|
|
|
|
|
|||||||||||
| Cash from financing activities |
(50,087 | ) | (429,632 | ) | (569,997 | ) | (280,826 | ) | (18,528,123 | ) | ||||||||||
|
|
|
|
|
|
|
|
|
|
|
|||||||||||
| Net change in cash and cash equivalents |
6,231,117 | (1,283,640 | ) | (3,182,582 | ) | (6,821,397 | ) | 8,749,287 | ||||||||||||
| Cash and cash equivalents-beginning of period |
9,222,367 | 12,404,949 | 12,404,949 | 19,226,346 | 10,477,059 | |||||||||||||||
|
|
|
|
|
|
|
|
|
|
|
|||||||||||
| Cash and cash equivalents-end of period |
$ | 15,453,484 | $ | 11,121,309 | $ | 9,222,367 | $ | 12,404,949 | $ | 19,226,346 | ||||||||||
|
|
|
|
|
|
|
|
|
|
|
|||||||||||
See accompanying notes
F-173
Table of Contents
360networks Corporation
Notes to Consolidated Financial Statements
1 SUMMARY OF SIGNIFICANT ACCOUNTING POLICIES
The Company
360networks Corporation and its subsidiaries (the Company) provide fiber optic network communications products and related services to both telecommunication carriers and commercial enterprises. The Company provides these services primarily in the western United States and prior to November 19, 2004, in Canada.
In June 2001, the Company’s former parent company, 360networks, Inc., and certain of its subsidiaries voluntarily filed for creditors protection under the Companies’ Creditors Arrangement Act (Canada) (CCAA) in the Supreme Court of British Columbia, Canada, or under Chapter 11 of the U.S. Bankruptcy Code. In November 2002, the Company and certain of its subsidiaries successfully completed their financial restructuring in Canada and the United States and emerged from creditor protection.
As of November 12, 2002, the Company adopted fresh-start reporting pursuant to the guidance provided by the American Institute of Certified Public Accountants. In connection with the adoption of fresh-start reporting, a new entity was created for financial reporting purposes. The effective date of the Company’s emergence from bankruptcy protection is considered to be the close of business on November 11, 2002, for financial reporting purposes.
Basis of presentation
The accompanying consolidated financial statements have been prepared in accordance with accounting principles generally accepted in the United States (U.S. GAAP) and include the accounts of the Company and its wholly-owned subsidiaries. The unaudited interim consolidated financial statements for the nine-month periods ended September 30, 2011 and 2010 include all adjustments that, in the opinion of management, are necessary to present fairly the Company’s financial position and its results of operations and cash flows. All significant inter-company transactions and balances have been eliminated in consolidation.
On April 18, 2008, Polaris Connect, a wholly-owned subsidiary of the Company, filed for bankruptcy under Chapter 7 of the District Court of Colorado (the Court) due to an exceedingly high historical fixed cost structure tied to long-term contracts and optical switches that could neither be repaired nor upgraded. Operations and cash flows at Polaris Connect were insignificant during 2008. When the bankruptcy petition was filed, 360networks effectively relinquished its ownership to a trustee of the Court. A gain related to the liabilities extinguished as a result of the ownership transfer is presented as other income (see Note 6).
Use of estimates
The preparation of consolidated financial statements in conformity with GAAP requires management to make estimates and assumptions that affect the reported amounts of assets and liabilities and the disclosure of contingent assets and liabilities at the date of the consolidated financial statements and revenues and expenses for the periods reported. Actual results could differ from those estimates.
The Company’s significant estimates and assumptions are the estimated useful lives of assets, the recoverability of tangible assets, the composition and valuation of deferred income tax assets and deferred income tax liabilities, the accruals for payroll and other employee-related liabilities, the accruals for restructuring, and the fair values applicable to asset retirement obligations.
F-174
Table of Contents
Cash and cash equivalents
Cash and cash equivalents consist of cash on deposit and highly liquid short-term, interest-bearing securities with terms at the date of purchase of three months or less, which are generally held to maturity.
Accounts receivable
Accounts receivable are stated at the amount management expects to collect on outstanding balances. Receivables from customers are due 30 days after issuance of the invoice. Delinquent accounts are charged to the receivable provision when it is determined that the account will not be collected and the account is sent to collection. The final determination of the account’s status is made at a minimum of 45 days past due. Management provides for probable uncollectible amounts through a provision for bad debts and an allowance for doubtful accounts based on its assessment of the current status of the accounts.
Restricted cash
Restricted cash represents cash applicable to letters of credit, cash held in escrow, and other deposits.
Investments
The Company’s policy for investment securities is as follows:
Securities available for sale: Securities not classified as held to maturity or trading are classified as available for sale. Available for sale securities are stated at fair value, with any unrealized gains and losses reported as a separate component of stockholders’ equity.
Trading securities: Trading securities consist of debt and equity securities that are bought and held principally for the purpose of selling in the near term and are reported at fair value, with unrealized gains and losses included in earnings. The Company did not hold any trading securities during 2010, 2009, or 2008.
Securities held to maturity: Debt securities for which the Company has the positive intent and ability to hold to maturity are classified as held to maturity. Held to maturity securities are stated at amortized cost. The Company did not hold any of these securities during 2010, 2009, or 2008.
Restricted investments
Restricted investments represent the maximum value of Trilogy Energy Trust shares recorded as securities available for sale that are subject to holdback under a pledge agreement pursuant to the restructure of 360networks (CDN fiber) ltd., a Canadian Limited Liability Corporation (see Note 6(a)).
Property and equipment
Fiber optic network assets constructed for the Company’s own use are recorded at cost, which includes direct expenditures on materials and labor and an allocation of indirect costs and interest. Acquired network assets, including the use of dark fiber and conduit under indefeasible rights of use (IRU), are recorded at cost. Other property and equipment is recorded at cost.
Property and equipment are depreciated using the following rates and methods:
| • | Fiber optic network assets—straight-line basis ranging from 20 to 25 years. |
| • | Operating equipment—straight-line basis ranging from 2 to 10 years. |
| • | Buildings—straight-line basis ranging from 15 to 20 years. |
| • | Leasehold improvements—straight-line basis over the term of the lease. |
F-175
Table of Contents
Network assets under construction and land are not subject to depreciation.
Fiber optic network assets include rights of way, conduit, fiber, shelters, and point of presence racks. Operating equipment includes network equipment, other equipment necessary to operate the network, and furniture, fixtures and office equipment. Repairs and maintenance costs are charged to operations when incurred.
The Company’s policy is to depreciate and amortize its long-lived assets over their remaining useful lives and to write down such assets if the net carrying value is not recoverable from future cash flows. The assessment as to whether a write down is required is based on the Company’s estimates of future cash flows and the Company’s assumptions about the use of the assets. When the Company determines the carrying value is not recoverable, the assets are written down to their estimated fair value.
Intangible assets
As-built drawings are being amortized on a straight-line basis over 20 years. This amortization period is based on the expected life of the intangible asset.
The Company reviews the carrying amount of intangible assets annually for impairment. The determination of impairments is based on a comparison of undiscounted estimated future cash flows anticipated to be generated during the remaining life of the asset to the net carrying value of the asset. If impairment is determined, the intangible asset is written down to estimated fair value.
Asset retirement obligations
The Company recognizes a liability for asset retirement obligations in the period in which the obligation is incurred if a reasonable estimate of fair value can be made. The associated retirement costs are capitalized as part of the carrying value of the long-lived assets and amortized over the period of the useful life of the asset. The obligation is increased annually by accretion that is charged to the statement of operations and reduced to reflect assets that have been disposed of during the year.
Revenue recognition—network and communication services
Network services revenue primarily includes revenue from network capacity leased to others and related network and maintenance services. Revenue from communication services is derived from private line, data and local telecommunication services. Revenues from these services are recognized based either on customer usage as measured by the Company’s switches or by contractual agreements.
Revenues are recognized monthly as services are provided. Advance payments on maintenance contracts are included in deferred revenue.
Certain IRUs of dark fiber and other assets are accounted for as operating leases or service arrangements depending on the whether the customer has the exclusive right to use the assets. Revenue is recognized on both operating leases and service arrangements on a straight-line basis over the term of the contract. The Company also leases facilities to customers for placement of equipment. Revenues on these facilities are recognized on a straight-line basis over the term of the lease arrangement. Payments received in advance of revenue recognition are included in deferred revenue.
Under dark fiber and capacity contracts, the Company is required to operate and maintain the network in accordance with industry standards. Under these contracts, customers are charged for certain operating and maintenance fees for the term of each contract. This revenue is recognized over the life of the contract. These contracts require the Company to provide certain service level commitments. If the Company does not meet the required service levels, it may be obligated to provide credits, usually in the form of free service for a short period of time. Services provided under these credits are not included in revenue.
F-176
Table of Contents
Revenue recognition—infrastructure
Infrastructure revenue includes revenue from construction, operations and maintenance contracts, and sales or leases of dark fiber and related assets when the customer retains title of the assets after the transaction is complete. Advances received on contracts in excess of billings are reflected as deferred revenue. The Company does not recognize any revenue on joint-build construction projects where the Company and the counterparty share in the risks and rewards of the project. Cash received applicable to joint-build construction projects is recorded as a recovery of the construction costs incurred by the Company. Construction related revenue was not material during 2011 (unaudited), 2010, 2009, and 2008.
Sales of dark fiber and/or conduit and grants of IRU where the customer obtains title to specific assets are accounted for as a sale when acceptance has occurred, title has passed to the customer, collection is reasonably assured, and the Company has no continuing involvement with the assets, other than providing operating and maintenance services for a fee. When there is a continuing involvement with the assets, the transaction is accounted for as a service arrangement and the revenue is recognized over the expected life of the assets unless the contracted term is shorter. Advances received on such contracts are reflected as deferred revenue.
Gains and losses on settlements, terminations or modifications of contracts
The Company recognizes a gain on a termination of a contract when the customer or supplier and the Company have reached a settlement/termination agreement, the Company has received the consideration required under the settlement/termination agreement or the Company is no longer obligated to provide additional products or services to the counterparty under the original agreement. Gains on settlement and/or termination of contracts are recognized as nonoperating income.
The Company recognizes a loss on a termination of a contract when it is probable that the customer or supplier and the Company will reach an agreement and the amount of the loss can be reasonably estimated. Subsequent adjustments may be made when the Company has entered into a contract termination or settlement agreement. In general, these transactions are entered into in order to reduce costs in future periods. These losses are accounted for as losses on settlements.
Transactions that are generally of an ongoing operating nature are not accounted for as losses on settlements. Examples of such transactions are:
| • | Settlements applicable to the granting of current price adjustments, concession and/or rebates under the original revenue contract are accounted for as a reduction of revenue. |
| • | Assets returned by customers to whom they were originally sold to or constructed for are accounted for as a reduction in revenue and an increase in assets at the lower of cost or fair value at the date the assets are returned. |
| • | Cost incurred in situations where the Company is obligated to provide additional product and services for no further consideration are accounted for as operating costs. |
| • | Uncollectable customer receivables when a customer has entered creditor protection or similar financial restructuring proceedings are accounted for as a bad debt expense. |
Operating costs
Costs applicable to network infrastructure sales and sales-type leases, particularly dark fiber and conduit, consist of direct costs such as the conduit, fiber optic cable, construction of regeneration facilities, labor and an allocation of indirect costs such as rights-of-way, site restoration, equipment costs, insurance, and interest charges. These costs are allocated proportionately to individual fiber strands based on the number of fiber strands installed on a particular route.
F-177
Table of Contents
Operating costs applicable to providing network services include only the direct costs of operating, provisioning and maintaining the network. These costs also include lease costs, rights-of-way costs, access charges, and other third party circuit costs directly attributable to the network.
Nonmonetary exchange transactions
The Company is a party to nonmonetary exchange transactions when the Company sells fiber assets, IRUs, capacity, or services or enters into operating leases with a counter party from which the Company receives assets or services in order to complete and complement its network. The Company accounts for such exchanges of telecommunications capacity based on the fair value of the assets given up. When these exchanges result in the Company paying net monetary consideration, such consideration is recorded as an additional cost of the fiber assets. When these exchanges result in the Company receiving net monetary consideration that is significant, the monetary portion is recognized as revenue, and the related cost of the assets disposed of is recorded as cost of sales.
Stock-based compensation
The Company accounts for its stock-based compensation using the calculated value method. The Company recognizes an expense over the term of each vesting period using a straight-line attribution method.
Foreign currency translation and transactions
Transactions in currencies other than the U.S. dollar are recorded at the exchange rate at the transaction date. Changes in exchange rates applicable to foreign currency denominated assets and liabilities result in gains and losses, which are included in the statement of operations.
Assets and liabilities of the Company’s subsidiaries and operations that have a functional currency other than the U.S. dollar are translated into U.S. dollars at the year end exchange rate. Revenues and expenses for these businesses are translated at average exchange rates effective during the year. Gains and losses resulting from foreign currency translations are included in other capital. Although the Company no longer has foreign operations, it maintains bank accounts, holds investments, and incurs professional service costs that result in translation adjustments.
Income taxes
Income taxes are accounted for using the liability method, which requires the recognition of taxes payable or refundable for the current period and deferred tax liabilities and assets for future tax consequences of events that have been recognized in the Company’s financial statements or tax returns. The measurement of current and deferred tax liabilities and assets is based on provisions of enacted tax laws; the effects of future changes in tax laws or rates are not anticipated. The measurement of deferred tax assets is reduced, if necessary, by a valuation allowance, where, based on available evidence, the probability of realization of the deferred tax asset does not meet a more likely than not criterion.
The Company records uncertain tax positions if the outcome was considered probable and could reasonably be estimated. As of December 31, 2010, 2009, and 2008, the Company had no accrued amounts related to uncertain tax positions. The Company records interest and penalties associated with late tax payments as other expense.
F-178
Table of Contents
Accumulated other comprehensive income
Accumulated other comprehensive income consists of net income, foreign currency translation adjustments and unrealized gains and losses arising from available for sale equity securities as follows:
| 2010 | 2009 | 2008 | ||||||||||
| Foreign currency translation adjustment |
4,321,704 | 1,561,312 | 1,493,166 | |||||||||
| Unrealized gains (losses) from available for sale securities |
15,525,867 | (105,147 | ) | 62,239 | ||||||||
|
|
|
|
|
|
|
|||||||
| 19,847,571 | 1,456,165 | 1,555,405 | ||||||||||
|
|
|
|
|
|
|
|||||||
Net gain on transfer of assets
During 2010, the Company entered into a transaction with Trilogy Energy Trust (Trilogy) wherein the Company received shares of Trilogy in exchange for restructuring 360’s wholly-owned subsidiary, 360networks (CDN fiber) ltd. This transaction is described in detail in Note 6 (a) and resulted in a nonoperating gain of $23,450,076 being recorded in the consolidated statement of income.
New accounting pronouncements
We have reviewed all new accounting pronouncements and have concluded that none of the recently issued pronouncements will have a material impact on our consolidated results of operations, financial condition or financial disclosure.
Subsequent events
Subsequent events are events or transactions that occur after the balance sheet date but before financial statements are available to be issued. The Company recognizes in the financial statements the effects of all subsequent events that provide additional evidence about conditions that existed at the date of the balance sheet, including the estimates inherent in the process of preparing financial statements. The Company’s financial statements do not recognize subsequent events that provide evidence about conditions that did not exist at the date of the balance sheet but arose after the balance sheet date and before financial statements are available to be issued (see Note 16).
2 RESTRUCTURING LIABILITIES
The Company has liabilities related primarily to operating lease commitments that do not provide economic benefit to the Company and have not been terminated. The Company continues to incur costs in the form of monthly payments. A liability is recognized and measured at fair value in the year the lease ceases to be used in operations. The initial recognition of the liability and subsequent adjustment to the fair value of the lease obligation are charged to restructuring expense. The detail of the Company’s restructuring liability accruals are:
| Unaudited
nine months ended September 30, 2011 |
Year ended December 31, | |||||||||||
| 2010 | 2009 | |||||||||||
| Balance beginning of period |
$ | 2,830,059 | $ | 3,284,706 | $ | 3,977,012 | ||||||
| Accrual for total anticipated restructuring expenses |
66,444 | 216,304 | 88,870 | |||||||||
| Less payments and settlements completed in the year |
(243,000 | ) | (670,951 | ) | (781,176 | ) | ||||||
|
|
|
|
|
|
|
|||||||
| Balance end of period |
$ | 2,653,503 | $ | 2,830,059 | $ | 3,284,706 | ||||||
|
|
|
|
|
|
|
|||||||
F-179
Table of Contents
3 SETTLEMENTS
The Company reached a settlement agreement in December 2009 on its bankruptcy claim against Asia Global Crossing for $11,750,000. Historically, this claim had been reviewed annually for impairment and due to the uncertain outcome of the claim and adverse rulings in similar cases the carrying value of the asset had been written down to $2,000,000 in 2008.
The Company recorded income from this claim settlement of $9,725,000 and recorded a receivable of $11,750,000 in 2009. This receivable was paid in full in February 2010.
4 ASSET RETIREMENT OBLIGATIONS
The Company has asset retirement obligations related to certain fiber, conduit, and other facilities that are primarily included in fiber optic network assets. Under certain rights-of-way arrangements, the Company is required to remove the fiber and conduit upon termination of the arrangement. Other rights-of-way arrangements permit the Company to abandon its underground assets upon termination of the arrangement if permission is obtained from the counter party to the arrangement. In addition, under certain lease agreements for facilities, the Company is required to remove equipment and other assets and restore the leased property to its original condition. Management determined no additional obligations arose in 2011 (unaudited), 2010, 2009, and 2008 related to plant additions.
Management reviews the assumptions that create the asset retirement obligation estimate on an annual basis for reasonableness and applicability. Based upon prevailing industry practice and knowledge, the Company reduced their estimate regarding the future probability in 2010 and 2008 to remove equipment, fiber and other assets upon termination of leases and right-of-ways.
The Company has estimated the fair value of asset retirement obligations on expected future cash outlays and an imputed interest rate from 11.00% to 13.10%.
These obligations are not secured by any assets of the Company.
| Unaudited
nine months ended September 30, 2011 |
Year Ended December 31, | |||||||||||
| 2010 | 2009 | |||||||||||
| Balance beginning of period |
$ | 261,166 | $ | 3,594,196 | $ | 3,191,400 | ||||||
| Changes due to: |
||||||||||||
| Accretion and other adjustments |
9,777 | (3,333,030 | ) | 402,796 | ||||||||
|
|
|
|
|
|
|
|||||||
| Balance end of period |
$ | 270,943 | $ | 261,166 | $ | 3,594,196 | ||||||
|
|
|
|
|
|
|
|||||||
F-180
Table of Contents
5 BALANCE SHEET COMPONENTS
| Unaudited September 30, 2011 |
December 31, | |||||||||||
| 2010 | 2009 | |||||||||||
| Accounts receivable |
||||||||||||
| Trade |
$ | 7,737,603 | $ | 4,937,056 | $ | 3,982,403 | ||||||
| Other |
1,345,653 | 847,111 | 11,726,380 | |||||||||
| Allowance for doubtful accounts |
(671,391 | ) | (1,642,143 | ) | (1,438,895 | ) | ||||||
|
|
|
|
|
|
|
|||||||
| $ | 8,411,865 | $ | 4,142,024 | $ | 14,269,888 | |||||||
|
|
|
|
|
|
|
|||||||
| Restricted cash |
||||||||||||
| Deposits |
$ | 357,500 | $ | 357,500 | $ | 466,775 | ||||||
|
|
|
|
|
|
|
|||||||
| $ | 357,500 | $ | 357,500 | $ | 466,775 | |||||||
|
|
|
|
|
|
|
|||||||
| Note receivable |
||||||||||||
| Note receivable(a) |
$ | 1,041,689 | $ | 1,169,939 | $ | 1,330,628 | ||||||
| Less current portion |
(181,343 | ) | (172,305 | ) | (160,689 | ) | ||||||
|
|
|
|
|
|
|
|||||||
| $ | 860,346 | $ | 997,634 | $ | 1,169,939 | |||||||
|
|
|
|
|
|
|
|||||||
| Investments |
||||||||||||
| Securities available for sale(b) |
$ | 87,622,322 | $ | 34,698,432 | $ | 8,185,209 | ||||||
| Securities available for sale-restricted(b) |
27,988,093 | 27,988,093 | — | |||||||||
|
|
|
|
|
|
|
|||||||
| $ | 115,610,415 | $ | 62,686,525 | $ | 8,185,209 | |||||||
|
|
|
|
|
|
|
|||||||
| Unaudited September 30, 2011 |
December 31, | |||||||||||
| 2010 | 2009 | |||||||||||
| Property and equipment |
||||||||||||
| Fiber optic network assets(c) |
||||||||||||
| Assets in service |
$ | 86,585,809 | $ | 77,756,487 | $ | 58,716,223 | ||||||
| Assets under lease to customers(d) |
14,814,377 | 14,903,027 | 14,903,027 | |||||||||
| Assets not in service(e) |
— | 409,603 | ||||||||||
| Land building and leasehold improvements |
7,164,778 | 7,147,656 | 6,057,488 | |||||||||
| Equipment |
8,280,732 | 8,840,663 | 10,282,345 | |||||||||
| Network assets under construction |
12,692,020 | 7,840,134 | 5,107,023 | |||||||||
|
|
|
|
|
|
|
|||||||
| 129,537,716 | 116,487,967 | 95,475,709 | ||||||||||
| Less: accumulated depreciation |
(51,710,906 | ) | (42,631,973 | ) | (33,793,700 | ) | ||||||
|
|
|
|
|
|
|
|||||||
| Property and equipment—net |
$ | 77,826,810 | $ | 73,855,994 | $ | 61,682,009 | ||||||
|
|
|
|
|
|
|
|||||||
| Intangible assets |
||||||||||||
| Trademark |
$ | 10,945 | $ | 11,754 | $ | 13,433 | ||||||
| As-built drawing |
234,244 | 249,063 | 268,222 | |||||||||
|
|
|
|
|
|
|
|||||||
| $ | 245,189 | $ | 260,817 | $ | 281,655 | |||||||
|
|
|
|
|
|
|
|||||||
F-181
Table of Contents
| Unaudited September 30, 2011 |
December 31, | |||||||||||
| 2010 | 2009 | |||||||||||
| Accounts payable |
||||||||||||
| Trade |
$ | 4,516,903 | $ | 7,041,327 | $ | 3,399,988 | ||||||
| Other |
2,600,405 | 3,490,180 | 2,810,554 | |||||||||
|
|
|
|
|
|
|
|||||||
| $ | 7,117,308 | $ | 10,531,507 | $ | 6,210,542 | |||||||
|
|
|
|
|
|
|
|||||||
| Other accrued liabilities |
||||||||||||
| Property and capital taxes |
$ | 943,913 | $ | 697,325 | $ | 1,562,801 | ||||||
| Restructuring |
2,653,503 | 2,830,059 | 3,284,706 | |||||||||
| Pre-petition(f) |
174,138 | 173,376 | 1,588,731 | |||||||||
| Deferred credit(g) |
11,224,014 | 11,224,014 | 11,224,014 | |||||||||
| Rights of way and other |
2,368,748 | 2,251,235 | 4,591,455 | |||||||||
|
|
|
|
|
|
|
|||||||
| $ | 17,634,316 | $ | 17,176,009 | $ | 22,251,707 | |||||||
|
|
|
|
|
|
|
|||||||
| Unaudited September 30 2011 |
December 31, | |||||||||||
| 2010 | 2009 | |||||||||||
| Deferred revenue |
||||||||||||
| Deferred revenue(h) |
$ | 42,919,770 | $ | 39,153,193 | $ | 39,301,525 | ||||||
| Less current portion |
(3,308,027 | ) | (3,279,361 | ) | (2,935,786 | ) | ||||||
|
|
|
|
|
|
|
|||||||
| $ | 39,611,743 | $ | 35,873,832 | $ | 36,365,739 | |||||||
|
|
|
|
|
|
|
|||||||
| Other long-term liabilities |
||||||||||||
| Long term lease obligation |
$ | 83,383 | $ | 27,785 | $ | 63,484 | ||||||
| Asset retirement obligations |
270,943 | 261,166 | 3,594,196 | |||||||||
|
|
|
|
|
|
|
|||||||
| $ | 354,326 | $ | 288,951 | $ | 3,657,680 | |||||||
|
|
|
|
|
|
|
|||||||
(a) On September 7, 2006, the Company entered into a 20-year IRU agreement and related note receivable to lease four fibers from Seattle, Washington, to Klamath Falls, Oregon, and six fibers from Merrill, Oregon, to Klamath Falls, Oregon. The IRU fee was $1,785,000 and the term of the IRU ends May 31, 2026. The IRU fee is payable in 120 consecutive months over 10 years with an annual interest rate of 7%.
(b) Investment in securities available for sale includes the fair value of the Trilogy stock retained by the Company pursuant to the February 5, 2010, transaction discussed in Note 6 (a). Investment in securities available for sale—restricted, represents the value of the Trilogy stock held in escrow pursuant to the provisions of the arrangement agreement.
(c) Certain of the Company’s network assets leased from third parties are capitalized and included in fiber optic network assets. The carrying amount of such assets at December 31, 2010, is $1,269,962, net of accumulated depreciation of $637,195 (December 31, 2009—$1,365,320, net of accumulated depreciation of $541,837).
(d) Certain of the Company’s network assets are leased to third parties under operating leases. At December 31, 2010, the carrying amount of these assets included in fiber optic network assets is $9,244,855, net of accumulated depreciation of $5,658,172 (December 31, 2009—$10,116,654, net of accumulated depreciation of $4,786,373).
(e) Fiber optic network assets not in service represent network assets that the Company owns or holds under capital leases that are not currently utilized in providing network services. These assets are classified as held for sale and not depreciated at the same rates as assets in service.
(f) Pre-petition liabilities are comprised of accrued expenses and settlements that occurred prior to bankruptcy that were not dismissed by the court.
(g) The Company has elected to defer nonoperating income recognition on a portion of the preference recoveries due to litigation uncertainty regarding the final settlement amount (see Note 15).
(h) The deferred revenue will be recognized in varying amounts between one and twenty years and is based on the contractual terms of each agreement.
F-182
Table of Contents
6 STATEMENT OF OPERATIONS COMPONENTS
| Unaudited nine months ended September 30, |
Year ended December 31, | |||||||||||||||||||
| 2011 | 2010 | 2010 | 2009 | 2008 | ||||||||||||||||
| Net gain on settlements |
||||||||||||||||||||
| Proceeds |
||||||||||||||||||||
| Receivables settlements award |
— | $ | 37,000 | $ | 37,000 | $ | 11,750,000 | $ | — | |||||||||||
| Available for sale securities |
— | — | — | — | 1,717,974 | |||||||||||||||
| Disposals |
||||||||||||||||||||
| Accrued liabilities incurred |
(3,255,445 | ) | — | — | (25,000 | ) | (1,276,971 | ) | ||||||||||||
| Property, plant, and equipment |
— | — | — | (2,000,000 | ) | — | ||||||||||||||
|
|
|
|
|
|
|
|
|
|
|
|||||||||||
| $ | (3,255,445 | ) | $ | 37,000 | $ | 37,000 | $ | 9,725,000 | $ | 441,003 | ||||||||||
|
|
|
|
|
|
|
|
|
|
|
|||||||||||
| Net gain (loss) on sale or transfer of assets |
||||||||||||||||||||
| Proceeds(a) |
$ | 7,946 | $ | 23,646,230 | $ | 23,646,230 | $ | 23,126 | $ | 1,463,720 | ||||||||||
| Carrying value |
— | (245,058 | ) | (245,058 | ) | — | (1,703,125 | ) | ||||||||||||
|
|
|
|
|
|
|
|
|
|
|
|||||||||||
| $ | 7,946 | $ | 23,401,172 | $ | 23,401,172 | $ | 23,126 | $ | (239,405 | ) | ||||||||||
|
|
|
|
|
|
|
|
|
|
|
|||||||||||
| Other income (expense) |
||||||||||||||||||||
| Accrual releases(b) |
— | $ | 3,968,295 | $ | 4,551,623 | $ | 1,016,988 | $ | (198,832 | ) | ||||||||||
| Realized gains |
— | 15,393 | 87,701 | |||||||||||||||||
| Other(c) |
(97,722 | ) | 421,153 | (1,295,558 | ) | 43,134 | 8,063,664 | |||||||||||||
|
|
|
|
|
|
|
|
|
|
|
|||||||||||
| $ | (97,722 | ) | $ | 4,389,448 | $ | 3,256,065 | $ | 1,075,515 | $ | 7,952,533 | ||||||||||
|
|
|
|
|
|
|
|
|
|
|
|||||||||||
(a) During the respective periods, the Company sold certain investment securities and surplus assets that were either held for sale or were no longer in service.
On February 5, 2010, 360networks (fiber holdco) ltd. completed the restructure of 360networks (CDN fiber) ltd., a Canadian Limited Liability Corporation. The restructure involved an exchange of 100% of the shares of 360networks (CDN fiber) ltd. with outstanding stock of Trilogy Energy Trust (Trilogy), a publicly traded energy trust based in Canada not previously affiliated with 360networks. The provisions of the transaction include 360networks receiving 4,165,653 shares of the new entity (Trilogy) and an agreement to pledge 2,185,884 shares of Trilogy in escrow under 360networks’ name as a holdback contingency for possible changes in the value of the 360networks (CDN fiber) ltd stock occurring after 2010. The remaining 1,979,769 shares were released during 2010 and have been recognized as income in the statement of operations.
The value of the 360networks (CDN fiber) ltd stock to Trilogy was attributed to approximately $730 million of tax loss pools that could be available to offset future Trilogy income under applicable Canadian tax law. The net value of the Trilogy shares at the date of the transaction was $30,081,390. Given the complex and contingent nature of the transition, 360networks has estimated that $22,493,426 of the Trilogy stock proceeds is recognizable in 2010 based on management’s estimate of fulfillment of the conditions outlined the final arrangement agreement. The remaining value of the Trilogy shares will be recognized in the statement of operations in the years after 2012 when provisions of the arrangement agreement requiring the pledge and holdback have been met.
(b) Historically, the Company has recognized disputed and/or estimated liabilities, and as updated information becomes available the Company adjusts their accruals. These accruals were evaluated and reduced during 2010 and 2009 and increased in 2008.
F-183
Table of Contents
(c) During 2010, the Company has recognized nonoperating expenses due to the payment of unsecured creditor claims allowed under the First Amended Joint Plan of Reorganization (the Plan) filed by 360networks (USA) inc. and certain affiliates (Debtors), in November 2002.
During 2008, the Company has recognized non operating income from the collection of preference recoveries allowed under the First Amended Joint Plan of Reorganization (the Plan) filed by 360networks (USA) inc. and certain affiliates (Debtors), in November of 2002, and from the dissolution of six dormant subsidiaries (the Polaris Connect or Dynegy entities) of 360networks Corporation (see Note 15).
7 SUPPLEMENTAL CASH FLOW INFORMATION
| Unaudited nine months ended September 30, |
Year ended December 31, | |||||||||||||||||||
| 2011 | 2010 | 2010 | 2009 | 2008 | ||||||||||||||||
| Changes in operating working capital items |
||||||||||||||||||||
| Accounts receivable |
$ | (3,848,108 | ) | $ | 10,409,911 | $ | 10,048,120 | $ | (2,017,932 | ) | $ | 300,045 | ||||||||
| Prepaid expenses and other assets |
(91,079 | ) | 97,834 | (368,646 | ) | (243,845 | ) | 320,879 | ||||||||||||
| Accounts payable and other accrued liabilities |
(5,905,819 | ) | (3,181,684 | ) | 775,742 | (2,303,446 | ) | 11,151,432 | ||||||||||||
| Income taxes payable |
(159,153 | ) | (33,968 | ) | 496,970 | 160,085 | 99,427 | |||||||||||||
| Deferred revenue |
3,766,577 | 611,860 | (148,333 | ) | (897,314 | ) | (795,222 | ) | ||||||||||||
|
|
|
|
|
|
|
|
|
|
|
|||||||||||
| $ | (6,237,582 | ) | $ | 7,903,953 | $ | 10,803,853 | $ | (5,302,452 | ) | $ | 11,076,561 | |||||||||
|
|
|
|
|
|
|
|
|
|
|
|||||||||||
| Cash paid for income taxes |
$ | 682,062 | $ | 552,561 | $ | 552,712 | $ | 48,112 | $ | 140,761 | ||||||||||
| Cash paid for interest |
47,766 | 66,535 | 79,415 | 80,645 | 70,059 | |||||||||||||||
| Unaudited nine months ended September 30, |
Year ended December 31, | |||||||||||||||||||
| 2011 | 2010 | 2010 | 2009 | 2008 | ||||||||||||||||
| Noncash investing activities |
||||||||||||||||||||
| Changes in unrealized gain (loss) on securities available for sale |
$ | 63,591,530 | $ | 12,213,032 | $ | 15,631,015 | $ | (167,387 | ) | $ | (696,412 | ) | ||||||||
| Change in unrealized foreign currency translation |
(6,568,959 | ) | 1,589,999 | 2,760,392 | 68,147 | (96,323 | ) | |||||||||||||
| Purchase of plant and property on long term lease |
— | — | — | — | 104,318 | |||||||||||||||
| Reduction in fixed assets due to changes in ARO assumptions |
(1,863,746 | ) | (1,863,746 | ) | — | — | ||||||||||||||
| Reconciliation of activities from Trilogy stock exchange: |
||||||||||||||||||||
| Value of shares received |
— | 32,703,742 | 32,703,742 | — | — | |||||||||||||||
| Valuation allowance |
— | (7,587,963 | ) | (7,587,963 | ) | — | — | |||||||||||||
| Closing costs |
— | (2,622,352 | ) | (2,622,352 | ) | — | — | |||||||||||||
| Proceeds from sale of fiber |
— | 1,200,000 | 1,200,000 | — | — | |||||||||||||||
| Net book value of fiber |
— | (243,351 | ) | (243,351 | ) | — | — | |||||||||||||
|
|
|
|
|
|
|
|
|
|
|
|||||||||||
| Net gain |
— | 23,450,076 | 23,450,076 | — | — | |||||||||||||||
F-184
Table of Contents
8 INCOME TAXES
The components of income before income taxes are:
| Unaudited nine months ended September 30, |
Year ended December 31, | |||||||||||||||||||
| 2011 | 2010 | 2010 | 2009 | 2008 | ||||||||||||||||
| United States |
$ | 8,544,617 | $ | 12,056,361 | $ | 16,238,895 | $ | 7,500,714 | $ | 35,833,223 | ||||||||||
| Canada |
(945,931 | ) | 23,704,263 | 21,878,333 | 8,132,702 | (24,634,548 | ) | |||||||||||||
|
|
|
|
|
|
|
|
|
|
|
|||||||||||
| $ | 7,598,686 | $ | 35,760,624 | $ | 38,117,228 | $ | 15,633,416 | 11,198,675 | ||||||||||||
|
|
|
|
|
|
|
|
|
|
|
|||||||||||
The components of the expense for current income taxes are:
| Unaudited nine months ended September 30, |
Year ended December 31, | |||||||||||||||||||
| 2011 | 2010 | 2010 | 2009 | 2008 | ||||||||||||||||
| United States |
$ | — | $ | 696 | $ | 40,618 | $ | 77,240 | $ | 133,759 | ||||||||||
| Canada |
150,814 | 525,896 | 491,142 | — | — | |||||||||||||||
|
|
|
|
|
|
|
|
|
|
|
|||||||||||
| $ | 150,814 | $ | 526,592 | $ | 531,760 | $ | 77,240 | $ | 133,759 | |||||||||||
|
|
|
|
|
|
|
|
|
|
|
|||||||||||
The components of the provision for deferred income taxes are:
| Year ended December 31, | ||||||||||||
| 2010 | 2009 | 2008 | ||||||||||
| United States |
$ | — | $ | — | $ | — | ||||||
| Canada |
— | — | — | |||||||||
|
|
|
|
|
|
|
|||||||
| $ | — | $ | — | $ | — | |||||||
|
|
|
|
|
|
|
|||||||
The provision for income taxes differs from the amount computed by applying the statutory income tax rate to net income (loss) before taxes due to nondeductible items, foreign tax rate differences, and the effect of the valuation allowance.
F-185
Table of Contents
A reconciliation of the actual income tax provision and the tax computed by applying the U.S. federal and state rates (35%) and the Canadian federal rates of 28.5%, 30.0%, and 34.87% to the income before income taxes for each of the three years in the three-year period ended December 31, 2010, 2009, and 2008 is as follows:
| Year ended December 31, | ||||||||||||||||||||||||
| 2010 | 2009 | 2008 | ||||||||||||||||||||||
| U.S. | Canada | U.S. | Canada | U.S. | Canada | |||||||||||||||||||
| Current |
||||||||||||||||||||||||
| Expected provision (recovery at statutory rates of: |
||||||||||||||||||||||||
| United States |
$ | 5,683,613 | — | $ | 2,625,250 | — | $ | 12,494,812 | — | |||||||||||||||
| Canada |
— | $ | 6,235,325 | — | $ | 2,439,811 | — | $ | (8,590,067 | ) | ||||||||||||||
| Increase(decrease) from: |
||||||||||||||||||||||||
| Permanent differences |
18,560 | (626,828 | ) | 14,917 | 13,015,832 | 15,100 | 121,679 | |||||||||||||||||
| State taxes, net of federal benefit |
812,147 | — | 374,538 | — | 1,689,610 | — | ||||||||||||||||||
| Worthless security write-offs |
— | — | — | (24,300,000 | ) | — | — | |||||||||||||||||
| Change in tax rate |
— | 6,693,022 | — | — | — | — | ||||||||||||||||||
| Intercompany debt basis |
33,348,695 | — | — | — | — | — | ||||||||||||||||||
| Deconsolidation of subsidiary |
— | 204,579,248 | — | — | — | 381,218 | ||||||||||||||||||
| Suspended capital losses |
— | (2,928,217 | ) | — | (106,962,276 | ) | — | 313,396,189 | ||||||||||||||||
| Expiration of net operating losses |
— | — | — | 14,818,640 | — | 112,786,842 | ||||||||||||||||||
| Dissolution of dormant subsidiaries |
— | — | — | — | — | 112,579,721 | ||||||||||||||||||
| Correction of deferred balances |
— | — | — | 31,755,987 | — | |||||||||||||||||||
| Tax credit carryforwards |
— | — | — | — | — | (747,495 | ) | |||||||||||||||||
| CDN Fiber adjustment |
— | — | — | — | — | 13,560,865 | ||||||||||||||||||
| Other |
— | (650,690 | ) | — | 939,686 | — | 74,215 | |||||||||||||||||
| Change in valuation allowance |
(39,822,397 | ) | (212,810,718 | ) | (2,937,465 | ) | 100,048,307 | (45,821,750 | ) | (543,563,167 | ) | |||||||||||||
|
|
|
|
|
|
|
|
|
|
|
|
|
|||||||||||||
| Provision for income taxes |
$ | 40,618 | $ | 491,142 | $ | 77,240 | $ | 0 | $ | 133,759 | $ | 0 | ||||||||||||
|
|
|
|
|
|
|
|
|
|
|
|
|
|||||||||||||
F-186
Table of Contents
Significant components of the Company’s deferred tax asset and liability are estimated below.
| Year Ended December 31, | ||||||||
| 2010 | 2009 | |||||||
| Current |
||||||||
| Deferred tax assets |
||||||||
| Expenses not deducted for tax in current year |
$ | 1,250,924 | $ | 1,332,540 | ||||
| Capital loss carryforward |
3,205,313 | — | ||||||
| Valuation allowance |
(1,250,924 | ) | (1,332,540 | ) | ||||
|
|
|
|
|
|||||
| 3,205,313 | — | |||||||
|
|
|
|
|
|||||
| Deferred tax liabilities |
||||||||
| Investment basis difference |
(3,205,313 | ) | — | |||||
|
|
|
|
|
|||||
| Total current |
$ | — | $ | — | ||||
|
|
|
|
|
|||||
| Long-term |
||||||||
| Deferred tax assets |
||||||||
| Tax loss carry forwards |
185,527,606 | 182,577,159 | ||||||
| Property and equipment |
94,535,613 | 271,899,229 | ||||||
| Capital loss carry forwards |
21,083,253 | 4,829,412 | ||||||
| Deferred revenue |
15,598,463 | 36,284,123 | ||||||
| Suspended capital losses |
72,879,576 | 113,085,044 | ||||||
| Investments and other |
241,869 | 475,632 | ||||||
| Valuation allowance |
(356,517,685 | ) | (609,150,599 | ) | ||||
|
|
|
|
|
|||||
| 33,348,695 | — | |||||||
|
|
|
|
|
|||||
| Deferred tax liabilities |
||||||||
| Intercompany debt basis |
(33,348,695 | ) | — | |||||
|
|
|
|
|
|||||
| Total long-term |
$ | — | $ | — | ||||
|
|
|
|
|
|||||
At December 31, 2010, the Company has operating loss carryforwards applicable to Canada and the United States available to reduce taxable income of $466,724,807 that expire as follows:
| Year ended December 31, |
2011 | 2012 | 2013 | 2014 | 2015 | Thereafter | ||||||||||||||||||
| Canada |
$ | — | $ | — | $ | — | $ | 2,818,253 | $ | — | $ | 7,288,854 | ||||||||||||
| United States |
$ | — | $ | — | $ | — | $ | — | $ | — | $ | 456,617,700 | ||||||||||||
Of the $456,617,700 of U.S. loss carry forwards beyond 2014, $228,000,000 is subject to certain restrictions.
Due to uncertainty regarding the ability to utilize the deferred tax assets, a full valuation allowance has been provided against the Company’s net deferred tax assets in the financial statements.
As a result of the adopting fresh start reporting, any reversal in future periods of the valuation allowances established upon emergence will be first applied to reduce the carrying amount of intangible assets and secondly as an adjustment to stockholders’ equity.
F-187
Table of Contents
9 401(k) RETIREMENT AND SAVINGS PLAN
The Company sponsors a qualified 401(k) plan covering all employees who have reached 21 years of age and two or more months of service. The 401(k) plan provides for discretionary employer contributions and a mandatory matching of 50% of employees’ contributions limited to 6% of basic annual compensation. Participants’ interest become fully vested after three years and may be withdrawn upon termination or upon attaining age 65, whichever occurs first. The Company’s matching and discretionary contributions totaled $341,971, $309,982, and $298,714 for the years ended December 31, 2010, 2009, and 2008, respectively.
10 CAPITAL STOCK
The Company is authorized to issue an unlimited number of common voting shares and an unlimited number of preferred nonvoting shares, issuable in series.
The Company issued 3,207, 39,836, and 12,285 common shares upon the exercise of stock options in 2010, 2009 and 2008 respectively. In 2010, the Company issued 104,283 (237,500 in 2009, 120,250 in 2008) restricted common shares for distribution to certain employees.
During 2009, the Company purchased and cancelled 21,680 issued and outstanding common shares at a price of $8.20. During 2008, the Company purchased and cancelled 2,217,989 issued and outstanding common shares at prices ranging from $7.50 to $9.50.
| Common Shares |
Issued and outstanding |
Reserved | Total | |||||||||
| Balance December 31, 2007 |
12,381,639 | 365,545 | 12,747,184 | |||||||||
| Shares repurchased |
(2,217,989 | ) | — | (2,217,989 | ) | |||||||
| Restricted shares issued to certain employees |
4,375 | — | 4,375 | |||||||||
| Shares issued upon exercise of stock options |
12,285 | — | 12,285 | |||||||||
|
|
|
|
|
|
|
|||||||
| Balance December 31, 2008 |
10,180,310 | 365,545 | 10,545,855 | |||||||||
| Shares repurchased |
(21,680 | ) | — | (21,680 | ) | |||||||
| Restricted shares issued to certain employees |
43,562 | — | 43,562 | |||||||||
| Shares issued upon exercise of stock options |
39,836 | — | 39,836 | |||||||||
|
|
|
|
|
|
|
|||||||
| Balance December 31, 2009 |
10,242,028 | 365,545 | 10,607,573 | |||||||||
| Restricted shares issued to certain employees |
102,946 | — | 102,946 | |||||||||
| Shares issued upon exercise of stock options |
3,207 | — | 3,207 | |||||||||
|
|
|
|
|
|
|
|||||||
| Balance December 31, 2010 |
10,348,181 | 365,545 | 10,713,726 | |||||||||
| Restricted shares issued to certain employees (unaudited) |
119,280 | — | 119,280 | |||||||||
| Shares issued upon exercise of stock options (unaudited) |
15,000 | — | 15,000 | |||||||||
|
|
|
|
|
|
|
|||||||
| Balance September 30, 2011 (unaudited) |
10,482,461 | 365,545 | 10,848,006 | |||||||||
|
|
|
|
|
|
|
|||||||
11 STOCK BASED COMPENSATION
The Company has a Long-Term Incentive and Share Award Plan that permits the grant of share based awards including stock options, share appreciation rights, restricted shares, performance shares, performance units, dividend equivalents and other share based awards to employees and directors. At December 31, 2008, 393,458 common shares were reserved for awards under the plan. The Company elected to issue restricted shares in lieu of stock options in 2010 and 2009. Stock awards and stock options that have been granted vest over a period of two to four years. Stock options have terms ranging from eight to ten years.
F-188
Table of Contents
Stock options
During 2008, the Company granted 240,500 stock options to directors and employees. The calculated value of these stock options using the Black-Sholes valuation model was $464,819 and is being amortized over their respective vesting period. Stock options were not issued in 2011(unaudited), 2010, and 2009.
The following table summarizes the Company’s stock option activity.
| Number of options outstanding |
Weighted average remaining option life |
Weighted average exercise price |
Weighted average value of options granted |
Number of options exercisable |
Weighted average exercise price |
|||||||||||||||||||
| Balance December 31, 2007 |
2,106,083 | 7.9 | $ | 3.70 | $ | 0.80 | 1,171,430 | $ | 2.31 | |||||||||||||||
| Option granted |
240,500 | $ | 8.20 | |||||||||||||||||||||
| Options forfeited |
(4,000 | ) | $ | 3.38 | ||||||||||||||||||||
| Options purchased |
(5,752 | ) | $ | 6.12 | ||||||||||||||||||||
| Options exercised |
(12,285 | ) | $ | 1.43 | ||||||||||||||||||||
|
|
|
|||||||||||||||||||||||
| Balance December 31, 2008 |
2,324,546 | 7.2 | $ | 4.18 | $ | 0.92 | 1,623,718 | $ | 3.12 | |||||||||||||||
| Option granted |
— | $ | 0.00 | |||||||||||||||||||||
| Options forfeited |
(17,500 | ) | $ | 7.36 | ||||||||||||||||||||
| Options purchased |
(37,885 | ) | $ | 3.84 | ||||||||||||||||||||
| Options exercised |
(39,836 | ) | $ | 2.33 | ||||||||||||||||||||
|
|
|
|||||||||||||||||||||||
| Balance December 31, 2009 |
2,229,325 | 6.2 | $ | 4.19 | $ | 0.88 | 1,884,701 | $ | 3.64 | |||||||||||||||
| Option granted |
— | $ | 0.00 | |||||||||||||||||||||
| Options forfeited |
(3,625 | ) | $ | 3.02 | ||||||||||||||||||||
| Options purchased |
(84,549 | ) | $ | 5.82 | ||||||||||||||||||||
| Options exercised |
(3,207 | ) | $ | 0.56 | ||||||||||||||||||||
|
|
|
|||||||||||||||||||||||
| Balance December 31, 2010 |
2,137,944 | 5.2 | $ | 4.22 | $ | 0.86 | 2,014,346 | $ | 3.99 | |||||||||||||||
| Options granted (unaudited) |
— | $ | 0.00 | |||||||||||||||||||||
| Options forfeited (unaudited) |
— | $ | 0.00 | |||||||||||||||||||||
| Options purchased (unaudited) |
(4,475 | ) | $ | 6.68 | ||||||||||||||||||||
| Options exercised (unaudited) |
(15,000 | ) | $ | 1.04 | ||||||||||||||||||||
|
|
|
|||||||||||||||||||||||
| Balance September 30, 2011 (unaudited) |
2,118,469 | 4.5 | $ | 4.24 | $ | 0.86 | 2,081,250 | $ | 4.17 | |||||||||||||||
The following tables summarize information about stock options outstanding at December 31, 2010.
| Options Outstanding | ||||||||||||||||
| Number Outstanding at End of Year |
Weighted- Average Remaining Contractual Life |
Weighted- Average Exercise Price |
Number Exercisable at End of Year |
|||||||||||||
| Option exercise price |
||||||||||||||||
| $1.04 |
479,810 | 3.5 | $ | 1.04 | 479,810 | |||||||||||
| $3.00 |
513,009 | 4.5 | $ | 3.00 | 513,759 | |||||||||||
| $3.75 |
472,150 | 5.5 | $ | 3.75 | 472,150 | |||||||||||
| $7.50 |
449,475 | 6.5 | $ | 7.50 | 399,564 | |||||||||||
| $8.20 |
223,500 | 7.5 | $ | 8.20 | 149,063 | |||||||||||
|
|
|
|
|
|
|
|
|
|||||||||
| Outstanding at end of year |
2,137,944 | 5.2 | $ | 4.22 | 2,014,346 | |||||||||||
|
|
|
|
|
|
|
|
|
|||||||||
F-189
Table of Contents
Restricted Shares
The Company issuesrestricted shares under the terms of the Long-Term Incentive and Share Award Plan. The following tables summarize information about the restricted shares outstanding at December 31, 2010.
| Shares issued subject to vesting |
Number of shares outstanding |
Shares subject to vesting |
Remaining vesting period |
|||||||||
| Balance December 31, 2007 |
— | — | ||||||||||
| Shares issued during the year |
120,250 | 120,250 | ||||||||||
| Shares vested during the year |
— | (4,375 | ) | |||||||||
| Balance December 31, 2008 |
120,250 | 115,875 | 3.4 | |||||||||
| Shares issued during the year |
237,500 | 237,500 | ||||||||||
| Shares vested during the year |
— | (43,562 | ) | |||||||||
| Balance December 31, 2009 |
357,250 | 322,813 | 3.1 | |||||||||
| Shares issued during the year |
104,283 | 104,283 | ||||||||||
| Shares vested during the year |
— | (102,946 | ) | |||||||||
| Balance December 31, 2010 |
461,533 | 311,150 | 2.6 | |||||||||
| Shares issued during the year (unaudited) |
73,055 | 73,055 | ||||||||||
| Shares vested during the year (unaudited) |
— | (119,280 | ) | |||||||||
| Balance September 30, 2011 (unaudited) |
534,588 | 264,924 | 2.35 | |||||||||
Stock based compensation expense
The deferred stock-based compensation amortization and charge to income applicable to both stock options and other stock awards for the year ended December 31, 2010, was $514,177 (for the year ended December 31, 2009—$1,159,751, for the year ended December 31, 2008—$1,357,638). The stock based compensation expense for 2010 was comprised of the following: stock options-$196,156; restricted stock-$318,021.
The following table summarizes stock based compensation expense to be recognized in each of the following years related to unvested options:
| Year ended December 31, |
2011 | 2012 | 2013 | 2014 | Total | |||||||||||||||
| Stock based compensation expense |
$ | 1,742,846 | $ | 775,539 | $ | 238,542 | $ | 36,620 | $ | 2,973,547 | ||||||||||
Stock-based compensation costs are based on the calculated value of grants calculated as of the grant date using the Black-Scholes option-pricing model. The calculated value of the grants is amortized as compensation expense on a straight-line basis over the vesting period of the options. Compensation expense recognized is shown in the operating activities section of the statement of cash flows.
The value of the Company’s stock options was estimated using the Black-Scholes option-pricing model assuming no dividend yield and the following weighted average assumptions for options granted in 2008: expected volatility of 22.41%, risk free interest rate of 3.32%; expected life of 4 years.
Calculation of the expected volatility used in the Black-Scholes model is based on the volatility of the Dow Jones Telecom Index. The expected term for use in the model was calculated based in part on an analysis of historical exercises of stock options. The Company based the estimated risk-free rate on the U.S. treasury yield curve in effect at the time of grant. The Company has not paid nor does it currently have any plans to pay cash dividends, thus a 0% dividend yield has been assumed for the model.
The Company estimates potential forfeitures of stock options and adjusts compensation accordingly. The Company has a limited number of option holders and historically low employee turnover with no anticipated changes. Therefore, the best estimate of forfeitures is zero and will be adjusted over the requisite service period
F-190
Table of Contents
to the extent that actual forfeitures differ, or are expected to differ from such estimates. Changes in the estimated forfeitures will be recognized in earnings in the period of change.
It should be noted that the Black-Scholes model is only one of the methods available for estimating the value of stock options and the Company’s use of the model should not be interpreted as a prediction as to the actual value that may be realized on the exercise of options. The actual value of the options may be significantly different, and the value actually realized, if any, will depend upon the excess of the market value of the Company’s common stock over the option exercise price at the time of exercise.
13 INVESTMENTS IN DEBT AND MARKETABLE SECURITIES
The following is a summary of the Company’s investment in available for sale securities at December 31:
| Unaudited September 30, 2011 | ||||||||||||
| Cost | Fair Market Value |
Unrealized Gain (Loss) |
||||||||||
| Corporate bonds |
$ | 10,823,757 | $ | 10,823,757 | $ | — | ||||||
| Government securities |
4,108,655 | 4,108,655 | — | |||||||||
| Trilogy stock |
33,127,686 | 108,689,910 | 75,562,224 | |||||||||
| Trilogy stock holdback reserve |
(8,011,907 | ) | (8,011,907 | ) | — | |||||||
|
|
|
|
|
|
|
|||||||
| $ | 40,048,191 | $ | 115,610,415 | $ | 75,562,224 | |||||||
|
|
|
|
|
|
|
|||||||
| December 31, 2010 | ||||||||||||
| Cost | Fair Market Value |
Unrealized Gain (Loss) |
||||||||||
| Corporate bonds |
$ | 15,305,306 | $ | 15,305,306 | $ | — | ||||||
| Government securities |
4,008,333 | 4,008,333 | — | |||||||||
| Trilogy stock |
35,858,926 | 51,384,793 | 15,525,867 | |||||||||
| Trilogy stock holdback reserve |
(8,011,907 | ) | (8,011,907 | ) | — | |||||||
|
|
|
|
|
|
|
|||||||
| $ | 47,160,658 | $ | 62,686,525 | $ | 15,525,867 | |||||||
|
|
|
|
|
|
|
|||||||
| December 31, 2009 | ||||||||||||
| Corporate bonds |
$ | 236,449 | $ | 152,924 | $ | (83,525 | ) | |||||
| Government securities |
8,032,285 | 8,032,285 | — | |||||||||
| Stocks |
21,622 | — | (21,622 | ) | ||||||||
|
|
|
|
|
|
|
|||||||
| $ | 8,290,356 | $ | 8,185,209 | $ | (105,147 | ) | ||||||
|
|
|
|
|
|
|
|||||||
Management has recorded the fair value of the Trilogy shares received as consideration for the restructuring of 360networks (CDN fiber) as securities available for sale. A holdback reserve has been recorded to reflect management’s estimate of the fair value of the securities that have not been earned pursuant to the Agreement at the date the transaction closed (February 5, 2010). This holdback reserve may be released after 2013 as the final provisions of the agreement are met by the Company (see Note 6(a)).
An unrealized gain (loss) on investment securities during the years ended December 31, 2010 and 2009, was reported as a separate component of stockholders’ equity and consisted of the following:
| 2010 | 2009 | |||||||
| Unrealized holding gains (loss) |
$ | 15,525,867 | $ | (105,147 | ) | |||
F-191
Table of Contents
A summary of investment earnings recognized in income during the years ended December 31, 2010 and 2009, is as follows:
| 2010 | 2009 | 2008 | ||||||||||
| Available for sale securities |
||||||||||||
| Realized gains (losses) |
$ | (8,822 | ) | $ | — | $ | 336,409 | |||||
| Interest earned |
303,971 | 63,008 | 159,980 | |||||||||
| Dividends earned |
1,473,572 | — | 60,441 | |||||||||
|
|
|
|
|
|
|
|||||||
| $ | 1,768,721 | $ | 63,008 | $ | 556,830 | |||||||
|
|
|
|
|
|
|
|||||||
14 FINANCIAL INSTRUMENTS
Concentration of credit risk
The Company is subject to credit risks applicable to cash and cash equivalents, short-term investments, and accounts receivable. The Company limits its exposure to credit loss by placing its cash and cash equivalents and short-term investments with various financial institutions. The Company limits its exposure to concentrations of credit risk with respect to accounts receivable by performing ongoing evaluations of the credit quality of its customers, and obtains advance payments, collateral or guarantees as considered necessary.
Fair value of Assets
The Company measures certain assets at fair value based on generally accepted accounting principles.
Fair value is defined as the price that would be received to sell an asset or paid to transfer a liability in an orderly transaction between market participants at the measurement date. The method employed by the company also establishes a fair value hierarchy which requires an entity to maximize the use of observable inputs and minimize the use of unobservable inputs when measuring fair value. The standard describes three levels of inputs that may be used to measure fair value:
| Level 1 |
Quoted prices in active markets for identical assets or liabilities | |
| Level 2 |
Observable inputs other than Level 1 prices, such as quoted prices for similar assets or liabilities; quoted prices in markets that are not active; or other inputs that are observable or can be corroborated by observable market data for substantially the full term of the assets or liabilities | |
| Level 3 |
Unobservable inputs that are supported by little or no market activity and that are significant to the fair value of the assets or liabilities | |
Following is a description of the valuation methodologies used for instruments measured at fair value on a recurring basis and recognized in the accompanying balance sheet, as well as the general classification of such instruments pursuant to the valuation hierarchy.
Available for sale Securities
Where quoted market prices are available in an active market, securities are classified within Level 1 of the valuation hierarchy. Level 1 securities include corporate bonds, government securities, and stock in publicly traded entities. The Company’s available for sale securities are all valued within Level 1 of the hierarchy and are recorded at fair value. The fair values are based on quoted market prices (see Note 13).
F-192
Table of Contents
15 COMMITMENTS AND CONTINGENCIES
Operating leases, rights-of-way, and other periodic commitments
The Company has various operating leases relating to land, network assets, equipment and other assets. In addition to lease payments, certain of these leases also include payments for insurance, operating and maintenance, property taxes and other related costs. The Company also has entered into various agreements to secure the rights-of-way along its network routes. In general, most agreements have an option renewal clause stating that grantors cannot unjustly withhold their acceptance of a renewal. Other periodic commitments are primarily related to operating and maintenance services applicable to operating the Company’s fiber optic network.
Rental expenses, net of amounts capitalized under lease agreements were $5,565,751 for the year ended December 31, 2010 (for the year ended December 31, 2009—$5,548,225, for the year ended December 31, 2008—$4,985,360).
| Year ended December 31 |
2011 | 2012 | 2013 | 2014 | 2015 | |||||||||||||||
| Future minimum payments |
||||||||||||||||||||
| Lease and rights-of-way |
$ | 6,887,888 | $ | 6,547,835 | $ | 5,936,449 | $ | 5,558,535 | $ | 5,059,815 | ||||||||||
| Other |
2,985,379 | 3,000,556 | 3,036,706 | 3,073,854 | 3,112,030 | |||||||||||||||
Contingent liability-preference recoveries
Pursuant to the First Amended Joint Plan of Reorganization (the Plan) filed by 360networks (USA) inc. and certain affiliates (Debtors), between 2003 and 2008, Dreier LLP, counsel for the Official Committee of Unsecured Creditors (the Creditors), recovered approximately $74 million as a result of recovering preference payments that the Debtors had made to its creditors in the 90 days prior to its Chapter 11 bankruptcy filing in 2001 (Preference Recoveries). Based on a formula in the Plan, the Preference Recoveries were then to be distributed to the Creditors (Creditor Distribution) and to the Company (Debtor Distribution). In addition, as part of a settlement with a third party creditor, an allowed unsecured claim in the Debtor’s own bankruptcy was assigned to the Company entitling it to a portion of the Creditor Distribution as well (the Claim Distribution). The Claim Distribution and Debtor Distribution were expected to total $17.4 million. Accordingly, on September 6, 2008, the Company requested and received a distribution of $4.5 million from the Preference Recoveries and then a second distribution of $11.9 million on November 17, 2008, leaving approximately $1 million yet to be distributed on its Claim Distribution. On or about December 3, 2008, the Company learned that the managing partner of Dreier LLP, Marc Dreier, had stolen approximately $38.6 million from the attorney escrow account that represented the balance of the Preference Recoveries that were to be distributed to the Creditors and the Company. Shortly thereafter, Dreier was arrested and pled guilty to a number of securities and wire fraud charges arising from his sale of approximately $670 million in fictitious securities. Subsequently, a postconfirmation representative was appointed to represent the Creditors and investigate the $38.6 million stolen by Dreier and to pursue claims relating to those funds. The postconfirmation representative has stated that he is still considering the extent to which the distributions to the Company may be recovered for the benefit of the Creditors. In addition, Dreier LLC has filed bankruptcy and the trustee in that case may try to recover some or all of the distributions that were made to the Company. The Company believes that it has a variety of substantive legal defenses to any claims by the Creditor’s postconfirmation representative or the trustee of the Dreier LLC estate for the return of the $16.4 million in distributions previously received by the Company. The Company believes that the amount of the final recovery cannot be reasonably estimated at this time and as a result, has deferred recognition of a portion of the income related to distributions (see Note 5(g)).
In relation to the theft of funds by Marc Dreier, on February 1, 2010, 360networks Corporation had a contingent liability related to two adversary proceedings filed against 360networks (USA) inc. (360USA). The first adversary proceeding captioned Steven J. Reisman, As Post Confirmation Representative of the Chapter 11 Estates of 360networks (USA) inc. vs. 360networks (USA) inc., Bankr. S.D.N.Y Adv. Pro. No. 10-02792 (ALG)
F-193
Table of Contents
(the Reisman Action) was filed on February 1, 2010, seeking restitution to recover $16.1 million in payments made to 360USA. A second adversary proceeding captioned Gowan v. 360networks (USA) inc., Bankr. S.D.N.Y. Adv. Pro. No. 10-03904 (SMB) (the DLLP Action) was filed October 18, 2010, and sought to recover $11.9 million in alleged preference payments from 360USA. Both the Reisman Action and DLLP Action were settled pursuant to a tripartite settlement agreement (the Settlement) dated August 4, 2011, that was subsequently approved by the courts in both the Reisman Action and the DLLP Preference Action. Pursuant to the Settlement, on October 25, 2011, 360USA paid $5,325,000 to the representative in the Reisman Action and $2,875,000 to the trustee in the DLLP Action. The Reisman Action was then dismissed with prejudice on October 31, 2011, and dismissal with prejudice of the DLLP Action occurred on November 7, 2011. 360networks (USA)inc recognized other income of $3.02M in November as a result of these settlements.
Litigation
The Company is a party to certain legal actions arising in the normal course of its business. The Company is neither involved in, nor threatened by, proceedings for which the Company believes it is not adequately insured or indemnified or which, if determined adversely, would have a material adverse effect on the financial position, results of operations, or cash flows.
The case styled 360networks Tennessee L.L.C., et. al. v. Illinois Central Railroad Company pending in the United States District Court for the Northern District of Illinois was tried before a jury in the second week of June 2010. This case concerns responsibility for relocating 360networks’ fibers on the Chicago-New Orleans route in the vicinity of certain specified wooden bridges being replaced by Illinois Central. The jury returned a verdict awarding Illinois Central damages in the amount of $232,996. In response to this verdict, 360networks filed a motion with the court seeking judgment as a matter of law, or in the alternative, a new trial. The case styled 360networks Tennessee L.L.C., et. al. v. Illinois Central Railroad Company in the United States District Court for the Northern District of Illinois was settled in June 2011. The amount of the settlement was $982,966. The final settlement amount related to a broader agreement that covered the entire Chicago to New Orleans route versus the initial claim that related to the Tennessee route. The loss on the settlement is included in Net gain on settlements in the statement of income for the nine month period ended September 30, 2011.
16 SUBSEQUENT EVENTS
In relation to a Dark Fiber IRU Agreement between Williams Communications, Inc. and 360networks(USA)inc. dated September 25, 2000, the Company and Level 3 have reached a settlement in September 2011 on the use of fibers in its commercial operations after the Post-Abatement period. The settlement amount of $2,272,449 was fully paid as of November 1, 2011, and is included in Net loss on settlements in the statement of income for the nine month period ended September 30, 2011. Additionally, the Company will incur a monthly cost of $38,302 for collocation and maintenance costs along this route for the remainder of the term of the IRU.
On October 7, 2011, the Company entered into a Stock Purchase Agreement to sell 100 percent of the outstanding capital stock of 360networks Holdings (USA) Inc. to Zayo LLC. 360networks Holdings (USA) is a wholly-owned subsidiary of 360networks Corporation that holds substantially all operating assets and generates substantially all operating margins for the Company. The transaction closed in December 2011.
F-194
Table of Contents
Our industry uses many terms and acronyms that may not be familiar to you. To assist you in reading this prospectus, we have provided definitions of some of these terms below.
3G—Third generation of cellular wireless standards and successor to the 2G standard.
4G—Fourth generation of cellular wireless standards. It is a successor to 3G and 2G standards, with the aim to provide a wide range of data services, with rates up to gigabit-speed Internet access for mobile as well as stationary users.
Bandwidth infrastructure—Dark fiber, mobile infrastructure and lit bandwidth services provided over fiber networks, and datacenter-based colocation and interconnection services. Fiber-based bandwidth infrastructure services that are lit (i.e., provided by using optronics that “light” the fiber) include wavelengths, Ethernet, IP and SONET; fiber-based services that are not lit are sold as dark fiber capacity. Datacenter-based bandwidth infrastructure services include colocation (space and power) as well as interconnection within facilities.
Capacity—The information-carrying ability of a telecommunications service. Below is a list of some common units of capacity for various lit bandwidth services:
DS-0, DS-1 and DS-3—Data communication circuits capable of transmitting over SONET (or similar) at 64 Kbps, 1.544 Mb and 45 Mb, respectively.
OC-3, OC-12, OC-48 and OC-192—Data communication circuits capable of transmitting over SONET at 155 Mb, 622 Mb, 2.5 G and 10 G, respectively.
1G, 2.5G, 10G, 40G and 100G—Data communication circuits capable of transmitting over Wavelengths at 1 G, 2.5 G, 10 G, 40 G and 100 G, respectively.
10Mb and 100Mb—Data communication circuits capable of transmitting over Ethernet at 10 Mb and 100 Mb, respectively.
GigE and 10GigE—Data communication circuit capable of transmitting over Ethernet at 1G and 10 G.
Carrier—A provider of communications services that commonly include voice, data, and Internet services.
Carrier hotel—A building containing many carriers, and other telecommunications service providers that are widely interconnected. These facilities generally have high-capacity power service, backup batteries and generators, fuel storage, riser cable systems, large cooling capability, and advanced fire suppression systems.
Cellular tower—An outdoor structure primarily used to attach and house antennae used by wireless carriers to aggregate and transmit mobile voice and data.
CLEC—Competitive local exchange carrier; provides local telecommunications services in competition with the ILEC.
Cloud computing—An Internet-based or intranet-based computing environment wherein computing resources are distributed across the network (i.e., the “cloud”), dynamically allocated on an individual or pooled basis, and increased or reduced as circumstances warrant, to handle the computing task at hand.
Colocation—The housing of transport equipment, other communications equipment, servers and storage devices within the same location. Operators of these colocation facilities typically also sell interconnection services to their customers, enabling them to cross connect with other customers located within the same facility and/or with Bandwidth Infrastructure providers.
G-1
Table of Contents
Conduit—A pipe usually made of metal, ceramic, or plastic that protects buried fiber optic cables.
Datacenter—A facility used to house computer systems, backup storage devices, routers, services and other Internet and other telecommunications equipment. Datacenters generally have environmental controls (air conditioning, fire suppression, etc.), redundant/backup power supplies, redundant data communications connections and high security.
Dark fiber—Fiber that has not yet been connected to telecommunications transmission equipment or optronics and, therefore, has not yet been activated or “lit” by the fiber cable owner.
DS—Digital signal level; a measure of the transmission rate of digital telecommunications traffic. For example, DS-1 corresponds to 1.544 Mb and DS-3 corresponds to 45 Mb. See the definition of “Capacity” above.
DWDM—Dense wavelength-division multiplexing. The term “dense” refers to the number of channels being multiplexed. A DWDM system typically has the capability to multiplex up to 40 wavelength channels.
Ethernet—The standard local area network (LAN) protocol. Ethernet was originally specified to connect devices on a company or home network as well as to a cable modem or DSL modem for Internet access. Due to its ubiquity in the LAN, Ethernet has become a popular transmission protocol in metropolitan, regional and long haul networks as well.
Fiber miles—The number of route miles in a network multiplied by the number of fiber strands within each cable on the network. For example, if a ten-mile network segment has a 144 count fiber installed, it would represent a 10x144 or 1,440 fiber miles.
Fiber—Fiber, or fiber optic cables, are thin filaments of glass through which light beams are transmitted over long distances.
Fiber-to-the-Tower or FTT—The connection of cellular towers to the wider terrestrial network via fiber connections.
G—Gigabits per second, a measure of telecommunications transmission speed. One gigabit equals one billion bits of information.
ILEC—Incumbent local exchange carrier; a traditional telecommunications provider that, prior to the Telecommunications Act of 1996, had the exclusive right and responsibility for providing local telecommunications services in its local service area.
Interconnection service—A service that is used to connect two customers who are located within a single building or within a single colocation space using either fiber or other means.
IP—Internet protocol; the transmission protocol used in the transmission of data over the Internet.
IRU and IRU contract—Indefeasible right of use. The exclusive, unrestricted, and indefeasible right to use one, a pair, or more strands of fiber of a fiber cable. IRU contracts are typically long-term in nature (20 years) and may or may not contain restrictions on the use of the fiber by the lessee.
ISP—Internet service provider; provides access to the Internet for consumers and businesses.
Lateral—An extension from the main or core portion of a network to a customer’s premises or other connection point.
Mb—Megabits per second; a measure of telecommunications transmission speed. One megabit equals one million bits of information.
G-2
Table of Contents
Meet-Me Room—A physical location in a building, usually a datacenter or carrier hotel, where voice carriers, Internet service providers, data service providers and others physically interconnect so that traffic can be passed between their respective networks. At any given colocation facility or datacenter, network owners may also be able to interconnect outside the Meet-Me Room.
Mobile switching centers—Buildings where wireless service providers house their Internet routers and voice switching equipment.
NOC—Network operations center; a location that is used to monitor networks, troubleshoot network degradations and outages, and ensure customer network outages and other network degradations are restored.
OC—Optical carrier level; a measure of the transmission rate of optical telecommunications traffic. For example, OC-3 corresponds to 155 Mb. See the definition of “Capacity,” above.
On-net—Describes a location or service that is directly and fully supported by fiber.
Optronics—Various types of equipment that are commonly used to light fiber. Optronics include systems that are capable of providing wavelength, Ethernet, IP, SONET, and other service over fiber optic cable.
POP—Point-of-presence; a location in a building separate from colocation facilities and datacenters that houses equipment used to provide telecom or Bandwidth Infrastructure services.
Private line—Dedicated private bandwidth circuit that generally utilizes SONET, Ethernet and Wavelength technology used to connect various locations.
Route miles—The length, measured in non-overlapping miles, of a fiber network. That is the actual number of miles that a network cable traverses. Route miles are distinct from fiber miles (see fiber miles definition).
Small cell—A location other than a cellular tower or building that is used to attach an antennae used by a wireless carriers to aggregate and transmit mobile voice and data. Typically, the location is a light pole, traffic light, or other small separate purpose structure.
SONET—Synchronous optical network; a network protocol traditionally used to support private line services. This protocol enables transmission of voice, data and video at high speeds. Protected SONET networks provide for virtually instantaneous restoration of service in the event of a fiber cut or equipment failure.
Switch—An electronic device that selects the path that voice, data and Internet traffic take or use on a network.
Transport—A dedicated telecommunication service to move data, Internet, voice, video or wireless traffic from one location to another.
Wavelength—A channel of light that carries telecommunications traffic through the process of wavelength-division multiplexing.
G-3
Table of Contents
Zayo Group Holdings, Inc.
Shares
Common Stock
PROSPECTUS
| Morgan Stanley | Barclays | Goldman, Sachs & Co. |
| RBC Capital Markets | Citigroup | SunTrust Robinson Humphrey |
| Cowen and Company | Oppenheimer & Co. | Raymond James | Stephens Inc. | Wells Fargo Securities | William Blair |
, 2014
Through and including , 2014 (the 25th day after the date of this prospectus), all dealers effecting transactions in these securities, whether or not participating in this offering, may be required to deliver a prospectus. This is in addition to a dealer’s obligation to deliver a prospectus when acting as an underwriter and with respect to an unsold allotment or subscription.
Table of Contents
PART II
INFORMATION NOT REQUIRED IN THE PROSPECTUS
| Item 13. | Other Expenses of Issuance and Distribution |
The following table sets forth the costs and expenses, other than the underwriting discount, payable in connection with the sale and distribution of the securities being registered. All amounts are estimated except the SEC registration fee and the FINRA filing fee. Except as otherwise noted, all the expenses below will be paid by us.
| Amount to be paid |
||||
| SEC Registration Fee |
$ | 12,880 | ||
| FINRA Filing Fee |
15,500 | |||
| Listing Fee |
* | |||
| Legal Fees and Expenses |
* | |||
| Accounting Fees and Expenses |
* | |||
| Printing and Engraving Expenses |
* | |||
| Blue Sky Fees and Expenses |
* | |||
| Transfer Agent and Registrar Fees |
* | |||
| Director and Officer Insurance |
* | |||
| Miscellaneous Expenses |
* | |||
| Total |
$ | * | ||
| * | To be completed by amendment. |
| Item 14. Indemnification | of Directors and Officers |
We are a Delaware corporation. Section 145(a) of the DGCL provides that a Delaware corporation may indemnify any person who was or is a party or is threatened to be made a party to any threatened, pending or completed action, suit or proceeding, whether civil, criminal, administrative or investigative, other than an action by or in the right of the corporation, by reason of the fact that such person is or was a director, officer, employee or agent of the corporation, or is or was serving at the request of the corporation as a director, officer, employee or agent of another corporation, partnership, joint venture, trust or other enterprise, against expenses (including attorney fees), judgments, fines and amounts paid in settlement actually and reasonably incurred by the person in connection with such action, suit or proceeding if the person acted in good faith and in a manner the person reasonably believed to be in or not opposed to the best interests of the corporation, and, with respect to any criminal action or proceeding, had no reasonable cause to believe his or her conduct was unlawful.
Section 145(b) of the DGCL provides that a Delaware corporation may indemnify any person who was or is a party or is threatened to be made a party to any threatened, pending or completed action or suit by or in the right of the corporation to procure a judgment in its favor by reason of the fact that such person acted in any of the capacities set forth above, against expenses (including attorney fees) actually and reasonably incurred by such person in connection with the defense or settlement of such action or suit if the person acted in good faith and in a manner the person reasonably believed to be in or not opposed to the best interests of the corporation, except that no indemnification shall be made in respect of any claim, issue or matter as to which such person shall have been adjudged to be liable to the corporation, unless and only to the extent that the Court of Chancery or the court in which such action or suit was brought shall determine that, despite the adjudication of liability but in view of all the circumstances of the case, such person is fairly and reasonably entitled to indemnity for such expenses which the court shall deem proper.
II-1
Table of Contents
Further subsections of DGCL Section 145 provide that:
(1) to the extent a present or former director or officer of a corporation has been successful on the merits or otherwise in the defense of any action, suit or proceeding referred to in subsections (a) and (b) of Section 145 or in the defense of any claim, issue or matter therein, such person shall be indemnified against expenses, including attorneys’ fees, actually and reasonably incurred by such person in connection therewith;
(2) the indemnification and advancement of expenses provided for pursuant to Section 145 shall not be deemed exclusive of any other rights to which those seeking indemnification or advancement of expenses may be entitled under any bylaw, agreement, vote of stockholders or disinterested directors or otherwise; and
(3) the corporation shall have the power to purchase and maintain insurance of behalf of any person who is or was a director, officer, employee or agent of the corporation, or is or was serving at the request of the corporation as a director, officer, employee or agent of another corporation, partnership, joint venture, trust or other enterprise, against any liability asserted against such person and incurred by such person in any such capacity, or arising out of such person’s status as such, whether or not the corporation would have the power to indemnify such person against such liability under Section 145.
As used in this Item 14, the term “proceeding” means any threatened, pending, or completed action, suit, or proceeding, whether or not by or in the right of us, and whether civil, criminal, administrative, investigative or otherwise.
Section 145 of the DGCL makes provision for the indemnification of officers and directors in terms sufficiently broad to indemnify our officers and directors under certain circumstances from liabilities (including reimbursement for expenses incurred) arising under the Securities Act of 1933. Our amended and restated certificate of incorporation will provide, in effect, that, to the fullest extent and under the circumstances permitted by Section 145 of the DGCL, we will indemnify any and all of our officers and directors. Our amended and restated certificate of incorporation also will relieve our directors from monetary damages to us or our stockholders for breach of such director’s fiduciary duty as a director to the fullest extent permitted by the DGCL. Under Section 102(b)(7) of the DGCL, a corporation may relieve its directors from personal liability to such corporation or its stockholders for monetary damages for any breach of their fiduciary duty as directors except (i) for a breach of the duty of loyalty, (ii) for failure to act in good faith, (iii) for intentional misconduct or knowing violation of law, (iv) for willful or negligent violations of certain provisions in the DGCL imposing certain requirements with respect to stock repurchases, redemptions and dividends, or (v) for any transactions from which the director derived an improper personal benefit.
We have purchased insurance policies which, within the limits and subject to the terms and conditions thereof, cover certain expenses and liabilities that may be incurred by directors and officers in connection with proceedings that may be brought against them as a result of an act or omission committed or suffered while acting as our director or officer.
The form of Underwriting Agreement, to be entered into in connection with this offering and to be attached as Exhibit 1.1 hereto, provides for the indemnification by the Underwriters of us and our officers and directors for certain liabilities, including liabilities arising under the Securities Act, and affords certain rights of contribution with respect thereto.
| Item 15. Recent | Sales of Unregistered Securities. |
We have not issued any securities that were not registered under the Securities Act in the last three years.
II-2
Table of Contents
| Item 16. Exhibits | and Financial Statement Schedules. |
(a) Exhibits
The exhibit index attached hereto is incorporated herein by reference.
(b) Financial Statement Schedules
No financial statement schedules are provided because the information called for is not required or is shown in the financial statements or the notes thereto.
| Item 17. Undertakings |
| (a) | The undersigned registrant hereby undertakes to provide to the underwriters at the closing specified in the underwriting agreements certificates in such denominations and registered in such names as required by the underwriters to permit prompt delivery to each purchaser. |
| (b) | Insofar as indemnification for liabilities arising under the Securities Act of 1933 may be permitted to directors, officers and controlling persons of the registrant pursuant to the foregoing provisions, or otherwise, the registrant has been advised that in the opinion of the Securities and Exchange Commission such indemnification is against public policy as expressed in the Securities Act of 1933 and is, therefore, unenforceable. In the event that a claim for indemnification against such liabilities (other than the payment by the registrant of expenses incurred or paid by a director, officer or controlling person of the registrant in the successful defense of any action, suit or proceeding) is asserted by such director, officer or controlling person in connection with the securities being registered, the registrant will, unless in the opinion of counsel the matter has been settled by controlling precedent, submit to a court of appropriate jurisdiction the question of whether such indemnification by it or them is against public policy as expressed in the Securities Act of 1933 and will be governed by the final adjudication of such issue. |
| (c) | The undersigned registrant hereby undertakes that: |
| (1) | For purposes of determining any liability under the Securities Act, the information omitted for the form of prospectus filed as part of this registration statement in reliance upon Rule 430A and contained in a form of prospectus filed by the registrant pursuant to Rule 424(b)(1) or (4) or 497(h) under the Securities Act shall be deemed to be a part of this registration statement as of the time it was declared effective. |
| (2) | For purposes of determining any liability under Securities Act, each post-effective amendment that contains a form of prospectus shall be deemed to be a new registration statement relating to the securities offered therein, and the offering of such securities at that time shall be deemed to be the initial bona fide offering thereof. |
II-3
Table of Contents
SIGNATURES
Pursuant to the requirements of the Securities Act of 1933, as amended, the registrant has duly caused this Registration Statement to be signed on its behalf by the undersigned, thereunto duly authorized, in the City of Boulder, State of Colorado, on August 12, 2014.
| ZAYO GROUP HOLDINGS, INC. | ||
| By: | /s/ Ken desGarennes | |
| Ken desGarennes | ||
| Chief Financial Officer | ||
Pursuant to the requirements of the Securities Act of 1933, this registration statement has been signed by the following persons in the capacities and on the dates indicated.
| Signature | Title | Date | ||
| /s/ Dan Caruso* Dan Caruso |
Chief Executive Officer and Director (principal executive officer) |
August 12, 2014 | ||
| /s/ Ken desGarennes Ken desGarennes |
Chief Financial Officer (principal financial and accounting officer) |
August 12, 2014 | ||
| /s/ Michael Choe* Michael Choe |
Director | August 12, 2014 | ||
| /s/ Rick Connor* Rick Connor |
Director | August 12, 2014 | ||
| /s/ Phil Canfield* Phil Canfield |
Director | August 12, 2014 | ||
| /s/ Don Gips* Don Gips |
Director | August 12, 2014 | ||
| /s/ Linda Rottenberg* Linda Rottenberg |
Director | August 12, 2014 | ||
| /s/ Stephanie Comfort* Stephanie Comfort |
Director | August 12, 2014 | ||
| /s/ Gillis Cashman* Gillis Cashman |
Director | August 12, 2014 | ||
| * | As Attorney-in-fact |
| By: | /s/ Ken desGarennes | |
| Ken desGarennes |
II-4
Table of Contents
EXHIBIT INDEX
| Exhibit No. |
Description of Exhibit | |
| 1.1* | Form of Underwriting Agreement. | |
| 3.1* | Form of Amended and Restated Certificate of Incorporation of Zayo Group Holdings, Inc. (to be effective upon completion of this offering) | |
| 3.2* | Form of Amended and Restated Bylaws of Zayo Group Holdings, Inc. (to be effective upon completion of this offering) | |
| 4.1* | Specimen Stock Certificate | |
| 4.2 | Secured Notes Indenture, dated as of June 28, 2012 between Zayo Escrow Corporation and The Bank of New York Mellon Trust Company N.A., as trustee (incorporated by reference to Exhibit 4.1 of Zayo Group, LLC’s Current Report on Form 8-K filed with the SEC on July 2, 2012, File No. 333-169979). | |
| 4.3 | Unsecured Notes Indenture, dated as of June 28, 2012 between Zayo Escrow Corporation and The Bank of New York Mellon Trust Company N.A., as trustee (incorporated by reference to Exhibit 4.2 of Zayo Group, LLC’s Current Report on Form 8-K filed with the SEC on July 2, 2012, File No. 333-169979). | |
| 4.4 | Secured Notes First Supplemental Indenture, dated as of July 2, 2012, between Zayo Group, LLC, Zayo Capital, Inc., Zayo Escrow Corporation, the guarantors party thereto, and The Bank of New York Mellon Trust Company N.A., as trustee (incorporated by reference to Exhibit 4.3 of Zayo Group, LLC’s Current Report on Form 8-K filed with the SEC on July 2, 2012, File No. 333-169979). | |
| 4.5 | Unsecured Notes First Supplemental Indenture, dated as of July 2, 2012, among Zayo Group, LLC, Zayo Capital, Inc., Zayo Escrow Corp, the guarantors party thereto, and The Bank of New York Mellon Trust Company N.A., as trustee (incorporated by reference to Exhibit 4.4 of Zayo Group, LLC’s Current Report on Form 8-K filed with the SEC on July 2, 2012, File No. 333-169979). | |
| 4.6 | Registration Rights Agreement, dated as of July 2, 2012, among Zayo Group, LLC, Zayo Capital, Inc., the guarantors party thereto, and Morgan Stanley & Co. LLC and Barclays Capital Inc., as representatives of the several initial purchasers listed therein (incorporated by reference to Exhibit 10.1 of Zayo Group, LLC’s Current Report on Form 8-K filed with the SEC on July 2, 2012, File No. 333-169979). | |
| 4.7* | Registration Rights Agreement | |
| 5.1* | Opinion of Gibson, Dunn & Crutcher, LLP | |
| 10.1 | Credit Agreement by and among Zayo Group, LLC, a Delaware limited liability company, Zayo Capital, Inc., a Delaware corporation, the guarantors party thereto, the lenders party thereto, Morgan Stanley Senior Funding, Inc., as Administrative Agent for the term loan facility under the Credit Agreement, SunTrust Bank, as the Administrative Agent for the revolving loan facility under the Credit Agreement, SunTrust Bank, as the Issuing Bank, SunTrust Bank, as the Collateral Agent, and the other persons party thereto, dated as of July 2, 2012 (incorporated by reference to Exhibit 10.2 of Zayo Group, LLC’s Current Report on Form 8-K filed with the SEC on July 2, 2012, File No. 333-169979). | |
II-5
Table of Contents
| Exhibit No. |
Description of Exhibit | |
| 10.2 | Collateral Agency and Intercreditor Agreement, dated as of July 2, 2012, among Zayo Group, LLC, Zayo Capital, Inc., the other grantors party thereto, Morgan Stanley Senior Funding, Inc., as administrative agent for the New Term Loan Facility under the Credit Agreement, SunTrust Bank, as administrative agent for the New Revolving Loan Facility under the Credit Agreement, SunTrust Bank, as joint collateral agent (the “Collateral Agent”), and The Bank of New York Mellon Trust Company, N.A., as initial notes authorized representative (incorporated by reference to Exhibit 10.3 of Zayo Group, LLC’s Current Report on Form 8-K filed with the SEC on July 2, 2012, File No. 333-169979). | |
| 10.3 | Security Agreement, dated as of July 2, 2012, Zayo Group, LLC, Zayo Capital, Inc., the other grantors party thereto, and SunTrust Bank, as the collateral agent for the secured parties (incorporated by reference to Exhibit 10.4 of Zayo Group, LLC’s Current Report on Form 8-K filed with the SEC on July 2, 2012, File No. 333-169979). | |
| 10.4 | Amendment No. 1 to the Credit Agreement, dated as of July 17, 2012 entered into by and among Zayo Group, LLC, a Delaware limited liability company, Zayo Capital, Inc., a Delaware corporation, Morgan Stanley Senior Funding, Inc., as term facility administrative agent, SunTrust Bank, as revolving facility administrative agent (incorporated by reference to Exhibit 10.2 of Zayo Group, LLC’s Annual Report on Form 10-K filed with the SEC on September 14, 2012, File No. 333-169979). | |
| 10.5 | Amendment No. 2 to Credit Agreement, dated as of October 5, 2012, between Zayo Group, LLC, Zayo Capital, Inc., Morgan Stanley Senior Funding, Inc., as term facility administrative agent, SunTrust Bank, as revolving facility administrative agent, Morgan Stanley Senior Funding, Inc., as a joint lead arranger and joint bookrunner for the Amendment, Barclays Bank PLC, as a joint lead arranger, joint bookrunner and syndication agent for the Amendment and the undersigned lender (incorporated by reference to Exhibit 10.1 of Zayo Group, LLC’s Current Report on Form 8-K filed with the SEC on October 5, 2012, File No. 333-169979). | |
| 10.6 | Amendment No. 3 to Credit Agreement, dated as of February 1, 2013, between Zayo Group, LLC, Zayo Capital, Inc., SunTrust Bank, as revolving facility administrative agent for the Amendment, Morgan Stanley Senior Funding, Inc., as term facility administrative agent for the Amendment and revolving facility lender, Barclays Bank PLC, as a revolving facility lender, Goldman Sachs Bank USA, as a revolving facility lender, Royal Bank of Canada, as a revolving facility lender, and UBS Loan Finance LLC, as a revolving facility lender (incorporated by reference to Exhibit 10.42 of Zayo Group, LLC’s Annual Report on Form 10-K filed with the SEC on September 23, 2013, File No. 333-169979). | |
| 10.7 | Amendment No. 4 to Credit Agreement, dated as of February 27, 2013, between Zayo Group, LLC, Zayo Capital, Inc., Morgan Stanley Senior Funding, Inc., as term facility administrative agent, SunTrust Bank, as revolving facility administrative agent, Citibank, N.A., as additional revolving loan lender and the lenders party thereto. (incorporated by reference to Exhibit 10.1 of Zayo Group, LLC’s Current Report on Form 8-K filed with the SEC on February 28, 2013, File No. 333-169979). | |
| 10.8 | Amendment No. 5 to Credit Agreement, dated as of November 26, 2013, between Zayo Group, LLC, Zayo Capital, Inc., Morgan Stanley Senior Funding, Inc., as term facility administrative agent, SunTrust Bank, as revolving facility administrative agent, and the lenders party thereto (incorporated by reference to Exhibit 10.1 of Zayo Group, LLC’s Current Report on Form 8-K filed with the SEC on December 2, 2013, File No. 333-169979). | |
II-6
Table of Contents
| Exhibit No. |
Description of Exhibit | |
| 10.9 | Amendment No. 6 to Credit Agreement, dated as of May 16, 2014, between Zayo Group, LLC, Zayo Capital, Inc., Morgan Stanley Senior Funding, Inc., as term facility administrative agent, and SunTrust Bank, as revolving facility administrative agent, together the administrative agents, and the lenders party thereto (incorporated by reference to Exhibit 10.1 of Zayo Group, LLC’s Current Report on Form 8-K filed with the SEC on May 21, 2014, File No. 333-169979). | |
| 10.10 | Agreement of Lease, dated as of February 17, 1998, by and between 60 Hudson Owner LLC (successor to Westport Communications LLC and Hudson Telegraph Associates L.P., formerly known as Hudson Telegraph Associates), a Delaware limited liability company, Zayo Colocation, Inc. (successor by name change of FiberNet Telecom Group, Inc.), FiberNet Telecom, Inc. (successor by merger to FiberNet Equal Access, L.L.C.), and Zayo Group, LLC (as guarantor), as assigned on January 1, 2001, as amended on January 1, 2001, December 4, 2003, October 29, 2004, March 1, 2007, April 4, 2007, May 26, 2009 and March 12, 2010 (incorporated by reference to Exhibit 10.36 of Zayo Group, LLC’s Registration Statement on Form S-4 filed with the SEC on October 18, 2010, File No. 333-169979). | |
| 10.11 | Agreement of Lease, dated as of April 1, 2001, between 60 Hudson Owner LLC (successor to Westport Communications LLC and Hudson Telegraph Associates, L.P., formerly known as Hudson Telegraph Associates), a Delaware limited liability company, FiberNet Telecom, Inc. (successor by merger to FiberNet Equal Access L.L.C.), Zayo Colocation, Inc. (successor by change of name to FiberNet Telecom Group, Inc.), and Zayo Group, LLC (as guarantor), as assigned on April 1, 2001, as amended on January 30, 2002, November 7, 2002, April 1, 2003, October 31, 2003, October 29, 2004, January 31, 2005, January 11, 2007, March 2, 2007, April 4, 2007, May 26, 2009 and March 12, 2010 (incorporated by reference to Exhibit 10.37 of Zayo Group, LLC’s Registration Statement on Form S-4 filed with the SEC on October 18, 2010, File No. 333-169979). | |
| 10.12+ | Employment Agreement, dated as of February 15, 2014, between Communications Infrastructure Investments, LLC, Zayo Group, LLC, and Daniel P. Caruso (incorporated by reference to Exhibit 10.1 of Zayo Group, LLC’s Current Report on Form 8-K filed with the SEC on February 21, 2014, File No. 333-169979). | |
| 10.13+ | Advance Distribution Letter Agreement, dated as of February 15, 2014, between Communications Infrastructure Investments, LLC, Zayo Group, LLC, and Daniel P. Caruso (incorporated by reference to Exhibit 10.2 of Zayo Group, LLC’s Current Report on Form 8-K filed with the SEC on February 21, 2014, File No. 333-169979). | |
| 21.1* | List of Subsidiaries of Zayo Group Holdings, Inc. | |
| 23.1** | Consent of KPMG LLP | |
| 23.2** | Consent of Grant Thornton LLP | |
| 23.3** | Consent of BDO USA, LLP | |
| 23.4** | Consent of Moss Adams LLP | |
| 23.5* | Consent of Gibson Dunn & Crutcher LLP (included in the opinion filed as Exhibit 5.1) | |
| 24.1 | Powers of Attorney (included in the signature pages of the initial filing this Registration Statement) | |
| * | To be filed by amendment |
| ** | Filed or furnished herewith |
| + | Management contract and/or compensatory plan or arrangement |
II-7