Attached files
| file | filename |
|---|---|
| 8-K - 8-K - TALMER BANCORP, INC. | a14-18746_18k.htm |
Exhibit 99.1
|
|
August 2014 Gary Torgow Chairman David Provost President & Chief Executive Officer Dennis Klaeser Chief Financial Officer Brad Adams Corporate Development |
|
|
Franchise Overview Note: Assets and loans shown in billions. (1) NPLs to loans, excluding covered loans. 2 Talmer is Building a High-Performing Midwest Franchise through Organic Lending & Successful Acquisitions $5.6bn Midwestern bank holding company headquartered in Michigan Grew from $70mm in 2009 as a result of private placements with sophisticated investors and a stream of disciplined acquisitions 4 FDIC, 1 strategic, and 2 bankruptcy transactions Experienced executive management team with over 280 years of combined industry experience and well-aligned interests stemming from large ownership share Instituted common dividend in 2Q 2014 Cultivated a core franchise through organic growth and successful integrations 16.9% CAGR on TBV per share from 4/30/2010 through 2Q 2014 Executing on organic growth strategy and continued expansion of production efficiency Flexible balance sheet with 12.8% TCE / TA and 0.79% NPL(1) Majority of acquired loans were recently marked to fair value 12% of loans covered by FDIC loss sharing agreements Tangible Results Asset Growth Organic and Acquired Loans In-market Loan Portfolio ROAA $1.6bn $2.2bn MI 50% OH 25% WI 6% IL 7% IN 5% NV 3% Other 4% |
|
|
3 Experienced & Accomplished Executive Management Team Over 280 years of combined industry experience Experience overseeing commercial and consumer banking, mergers and acquisitions, systems integrations, technology, operations, credit and regulatory compliance matters for private and public banks The management team has successfully managed numerous merger & acquisition and capital transactions Officer Title Age Years Exp. Talmer Tenure Prior Experience Includes David Provost President, Chief Executive Officer & Director 60 37 7 Chairman & CEO of The PrivateBank - Michigan Gary Torgow Chairman of the Company & Board of Directors 57 34 5 Founder and Chairman of Sterling Group Dennis Klaeser Chief Financial Officer 56 32 4 CFO of PrivateBancorp, Inc. Gary Collins Vice Chairman (Retail & Mortgage Banking) & Director 56 31 3 Founding MD and Vice Chairman of The PrivateBank – Chicago Thomas Shafer Vice Chairman (Commercial Banking) 55 31 4 Executive VP of Specialty Banking at Citizens Republic Bancorp Bradley Adams Executive MD - Corporate Development 40 17 4 Director of Investor Relations for Fifth Third Bancorp Gregory Bixby Executive MD & Chief Information Officer 48 25 3 CIO for Capitol Bancorp Ltd. James Dunn Executive MD & Chief Legal Officer 54 32 4 Managing Director for The PrivateBank - Michigan Kathleen Wendt Executive MD & Chief Accounting Officer 41 19 3 Senior VP for Comerica, Inc. |

|
|
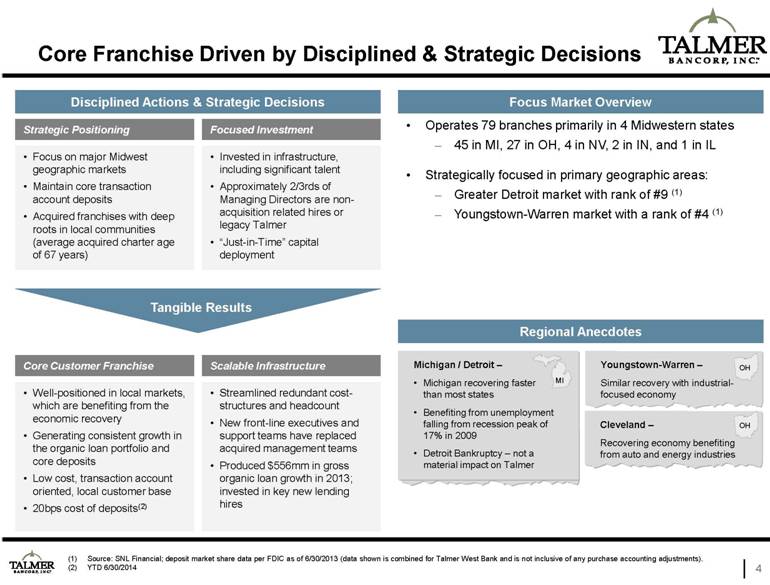
Source: SNL Financial; deposit market share data per FDIC as of 6/30/2013 (data shown is combined for Talmer West Bank and is not inclusive of any purchase accounting adjustments). YTD 6/30/2014 4 Core Franchise Driven by Disciplined & Strategic Decisions Strategic Positioning Focused Investment Scalable Infrastructure Core Customer Franchise Invested in infrastructure, including significant talent Approximately 2/3rds of Managing Directors are non-acquisition related hires or legacy Talmer “Just-in-Time” capital deployment Focus on major Midwest geographic markets Maintain core transaction account deposits Acquired franchises with deep roots in local communities (average acquired charter age of 67 years) Streamlined redundant cost-structures and headcount New front-line executives and support teams have replaced acquired management teams Produced $556mm in gross organic loan growth in 2013; invested in key new lending hires Well-positioned in local markets, which are benefiting from the economic recovery Generating consistent growth in the organic loan portfolio and core deposits Low cost, transaction account oriented, local customer base 20bps cost of deposits(2) Disciplined Actions & Strategic Decisions Tangible Results Regional Anecdotes Michigan / Detroit – Michigan recovering faster than most states Benefiting from unemployment falling from recession peak of 17% in 2009 Detroit Bankruptcy – not a material impact on Talmer Cleveland – Recovering economy benefiting from auto and energy industries OH Youngstown-Warren – Similar recovery with industrial-focused economy OH Operates 79 branches primarily in 4 Midwestern states 45 in MI, 27 in OH, 4 in NV, 2 in IN, and 1 in IL Strategically focused in primary geographic areas: Greater Detroit market with rank of #9 (1) Youngstown-Warren market with a rank of #4 (1) Focus Market Overview MI |
|
|
65 80 96 75 79 Michigan Commerce consolidated had approximately(1)(2): Assets = $947mm Loans = $683mm Deposits = $887mm Transaction closed on January 1, 2014 and renamed Talmer West Bank Paid $4.0 million in cash and $2.5 million into escrow to fund fees and expenses Operates as separate subsidiary bank Contributed $99.5 million to recapitalize bank Q1-2014 Bargain Purchase Gain of $40.2 million Talmer West Bank is profitable and operating in excess of plan Q2-2014 re-estimation of cash flows resulted in a net 2% increase in total expected cash from credit impaired loans Sale of Albuquerque branch and a substantial portion of New Mexico loans completed July 18th with a modest gain on sale Rationalization of Las Vegas presence has begun including headcount and facilities reductions Systems conversion on track and scheduled for February 2015 Source: SNL Financial; financial data as of 9/30/2013. Assets, gross loans, and deposit amounts equal to the sum of the four remaining consolidated entities. 5 Talmer West Update (363 Asset Purchase of Michigan Commerce ) Overview Branch Map (1) Talmer Bancorp Branches Talmer West Bank Branches |

|
|
Target total assets of $228 million as of June 30, 2014, including $172 million of net total loans 8 branch locations and $198 million in deposits The cash consideration of $13.4 million represents approximately 117% of First of Huron’s tangible book value as of June 30, 2014 Assuming 30% cost saves, Talmer expects the purchase price to reflect a multiple of approximately 4.5x annual run-rate earnings Estimated 5.6% net fair value mark on acquired loans ($5 million more than existing LLR) Talmer will acquire and simultaneously retire $3.5 million of outstanding subordinated debentures of First of Huron Corporation and assume its $5.2 million of trust preferred securities Talmer expects the acquisition to be immediately accretive to earnings per share exclusive of transaction and integration related expenses, and to yield a tangible book value earn back of less than 2.5 years Announced Acquisition of First of Huron Corp. 6 |
|
|
(1) Loan mark is inclusive of the credit and interest rate mark. (2) $5.27 TBV per share at 4/30/2010 is after the first P/E investment and before the CF Bancorp BPG. The calculation of tangible book value per share includes pre-tax bargain purchase gains of $53.8 million for the year ended December 31, 2010, $39.4 million for the year ended December 31, 2011, $71.7 million for the year ended December 31, 2013 and $40.2 million for Q1-2014. 7 Consistent Tangible Book Value per Share Growth Demonstrable Tangible Book Value per Share Growth Over Time with a 16.9% CAGR CAGR = +16.9% (Total) CAGR = +7.8% (Excl. BPGs) 2010 2011 2013 2014 10.7%(1) $40.2mm (2) $10.09 $858mm $908mm $9.79 $5.27 $5.39 $5.70 $6.86 $7.12 $7.19 $7.49 $0.90 $1.36 $0.91 $2.00 $2.60 $2.60 $5.27 $6.29 $7.06 $7.77 $9.12 $- $2.00 $4.00 $6.00 $8.00 $10.00 $12.00 4/30/2010 2010Y 2011Y 2012Y 2013Y Q1-14 Q2-14 TBV per Share ($) TBV per Share (Excluding BPG) Adjustment for BPGs CF Bancorp First Banking Center Peoples State Bank Community Central Bank Lake Shore Wisconsin Corp. First Place Bank Michigan Commerce Total Date of Acquisition 4/30/2010 11/19/2010 2/11/2011 4/29/2011 12/15/2011 1/1/2013 1/1/2014 4 years Type of Acquisition FDIC-Assisted FDIC-Assisted FDIC-Assisted FDIC-Assisted Strategic 363-Acquisition 363-Acquisition 7 Acquisitions Deposits Acquired $1.2bn $475mm $386mm $302mm – $2.2bn $887mm $5.3bn Assets Acquired $941mm $684mm $390mm $402mm $26mm $2.6bn $947mm $6.0bn Branches Acquired 22 17 10 4 – 43 17 113 Bargain Purchase Gain $52.7mm $2.9mm $12.7mm $24.9mm – $71.7mm [] $164.9mm Gross Loan Mark 41.2% (1) 22.9% (1) 35.2% (1) 40.4% (1) – 7.5% (1) [] 22.7% (1)(2) Age of Charter 1937 1920 1909 1996 – 1922 1990 Avg. Age 67 Yrs |
|
|
(1) Source: SNL Financial; Regulatory data used for Acquisition Targets. Demonstrated Ability to Reduce Cost of Deposits by Growing Core Funding Base 8 Deposit Costs(1) – Streamlining of Deposit Costs is Evident Over Time Deposit Mix Transformation Clear trend of decreased costs of deposits CF Bancorp First Banking Center Peoples State Bank Community Central Bank First Place Bank Cost of Deposits = 0.82% Total Deposits = $1.0bn 54% Non-Time Cost of Deposits = 0.20% Total Deposits = $4.3bn 69% Non-Time 2Q 2010 2Q 2014 Non int-bear. DDA 7% Int-bear. DDA 3% Non int-bear. DDA 22% Int-bear. DDA 16% Michigan Commerce Bank 2.36 1.87 0.94 1.52 0.45 0.61 0.82 0.55 0.67 0.39 0.39 0.34 0.33 0.31 0.29 0.27 0.25 0.25 0.24 0.22 0.21 0.20 0.20 $- $0.5 $1.0 $1.5 $2.0 $2.5 $3.0 $3.5 $4.0 $4.5 $5.0 0.00 0.50 1.00 1.50 2.00 2.50 '10Q2 '10Q3 '10Q4 '11Q1 '11Q2 '11Q3 '11Q4 '12Q1 '12Q2 '12Q3 '12Q4 '13Q1 '13Q2 '13Q3 '13Q4 '14Q1 '14Q2 Total Deposits ($bn) Cost of Deposits (%) Acquisition Targets Talmer Bancorp (Consolidated) Total Deposits ($bn) |

|
|
(1) Data as of June 30, 2014. Tripled Organic Loans Since 2011, with Focus on Mid-Market Commercial and Industrial Clients 9 Organic Loans – 90% CAGR Since 4Q 2011 Organic Loan Composition (1) Organic Loans Off-Setting Runoff in Acquired Portfolio - Inflection point reached in 2Q 2012 at which organic loans were growing faster than the acquired loans were running off Loan Composition by State (1) $313 $346 $383 $448 $563 $657 $824 $993 $1,118 $1,309 $1,553 $942 $884 $838 $789 $759 $702 $649 $594 530 498 459 $0 $200 $400 $600 $800 $1,000 $1,200 $1,400 $1,600 $1,800 4Q '11 1Q '12 2Q '12 3Q '12 4Q '12 1Q '13 2Q '13 3Q '13 4Q '13 1Q '14 2Q '14 Loans ($mm) Organic Loans Acquired Portfolio from FDIC Transactions (covered) |
|
|
Accretable yield(1) results from the purchase accounting applied to acquired loans Accretable yield includes both the expected coupon rate of the loan and the discount accretion The chart below provides a comparison of the actual NIM earned compared to the NIM that would have been earned if it reflected just the expected coupon rate and removes the negative accretion on the FDIC indemnification asset, the “Adjusted NIM” This difference is the excess accretable yield (“EAY”) EAY is earned over the life of the loan For example, in 2Q 2014 Talmer’s NIM would have decreased by 0.63% from 4.35% to 3.72% if the EAY was not included Strong NIM Even When Excluding Excess Accretable Yield 10 Excess Accretable Yield –5 bps for 1Q 2014 and 63 bps for 2Q 2014 The accretable yield represents the excess of the net present value of expected future cash flows over the acquisition date fair value and includes both the expected coupon of the loan and the discount accretion. The difference between the actual yield earned on total loans and the yield generated based on the expected coupon represents excess accretable yield. In addition, our net interest margin is adversely impacted by the negative yield on the FDIC indemnification asset. This negative yield on the FDIC indemnification asset partially offsets the benefits provided by the excess accretable yield discussed previously. Adjusted NIM is equal to the sum of the excess accretable yield and the negative yield on the FDIC indemnification asset. 4.89 4.40 4.74 4.73 3.74 4.03 4.11 3.72 3.95 4.35 4.22 3.95 4.09 4.01 3.36 3.68 3.59 3.36 3.90 3.72 2.00 2.50 3.00 3.50 4.00 4.50 5.00 5.50 6.00 1Q '12 2Q '12 3Q '12 4Q '12 1Q '13 2Q '13 3Q '13 4Q '13 1Q '14 2Q '14 NIM (%) Reported NIM Adjusted NIM |
|
|
11 Effectiveness in Building Recurring Earnings Streams During periods without bargain purchase gains, Talmer experienced an average ROA of 1.09% Earnings performance has been driven by: Maintaining and developing the core customer base Investing in infrastructure, creating efficiencies Building organic loan growth capacity to pace acquired loan run-off Importantly, the Company has maintained a low cost of deposits Decreased total deposits costs to 0.20% for 2Q 2014 Profitability Over Time for Talmer (ROAA) 13.88 Average ROA of 1.09% in periods of non-acquisitions without BPGs (denoted by blue bars) CF Bancorp First Banking Center Peoples State Bank Community Central Bank First Place Bank 5.06 Michigan Commerce Bank Denotes period with an acquisition 1.70 1.42 2.76 2.25 1.10 0.54 0.72 0.78 1.06 1.33 1.26 0.89 1.08 2.90 1.51 0.00 0.50 1.00 1.50 2.00 2.50 3.00 '10Q2 '10Q3 '10Q4 '11Q1 '11Q2 '11Q3 '11Q4 '12Q1 '12Q2 '12Q3 '12Q4 '13Q1 '13Q2 '13Q3 '13Q4 '14Q1 '14Q2 ROAA (%) |

|
|
Talmer’s goal is to improve its core efficiency ratio to approximately 70% by the end of 2014 and to the mid- 60’s range by latter part of 2015 Quality organic loan growth from existing under capacity lending staff Continuing to realize synergies from recent acquisitions Integration and charter consolidation of Talmer West Bank Headcount reductions Company wide focus on operating leverage The efficiency ratio is a measure of a financial institutions total non-interest expense as a percentage of the sum of net interest income (pre-provision for credit losses) and noninterest income Adjusted efficiency excludes changes in valuation of MSR’s, FDIC loss sharing income, bargain purchase gains and transaction and integration related costs Focus on Efficiency 12 (2) 1,585 1,623 1,485 1,434 1,397 1,289 750 850 950 1,050 1,150 1,250 1,350 1,450 1,550 1,650 1,750 Mar 13 Jun 13 Sep 13 Dec 13 Mar 14 Jun 14 Talmer Bank and Trust Full Time Equivalent Employees |
|
|
Our uncovered allowance for loan losses was $24.4 million, or 0.74% of uncovered loans, at 6/30/2014, compared to $10.9 million, or 1.81%, of uncovered loans at 12/31/2012. The decline in the ALLL / Uncovered Loans at 6/30/2014, compared to 12/31/2012, was due to the addition of loans we acquired in our acquisitions of First Place Bank and Talmer West Bank which were recorded at their estimated fair value, including a credit mark of the acquired loans at the acquisition date, and which did not include a separate allowance for loan losses. The credit marks at acquisition were 6.4% for First Place Bank and 9.1% for Talmer West Bank. 13 Asset Quality Loss share agreements with the FDIC cover approximately 80% of potential losses on covered loans Approx. 12% of portfolio is covered by FDIC loss share at 2Q 2014 All acquired loans were marked to fair market value at the date of acquisition At 4Q 2013, NPLs (excl. covered loans) is 0.98%, ALLL to total loans is 1.93%, and ALLL to uncovered loans is 0.72% At 2Q 2014, NPLs (excl. covered loans) is 0.79%, ALLL to total loans is 1.52%, and ALLL to uncovered loans is 0.74% Commentary & Perspectives Nonperforming Asset Trends Reserve Levels (1) 1.93 5.04 4.72 1.93 1.52 3.16 2.43 1.81 0.72 0.74 1.71 5.95 7.17 7.62 7.13 - 1.00 2.00 3.00 4.00 5.00 6.00 7.00 8.00 9.00 2010Y 2011Y 2012Y 2013Y 2Q 2014 Reserves (%) ALLL / Loans ALLL on Uncov. / Uncov. Loans ALLL on Cov. / Cov. Loans 1.18 1.20 1.75 1.58 1.60 0.14 0.41 1.30 1.40 1.04 0.63 0.65 0.12 0.98 0.79 - 0.50 1.00 1.50 2.00 2010Y 2011Y 2012Y 2013Y 2Q 2014 NPAs & NPLs (%) NPAs / Assets NPLs / Total Loans NPLs / Loans (Excl. Covered) |
|
|
Strong Capital Ratios 14 Capital Levels & Targets (1) Non GAAP financial measure; see Appendix; (2) Notwithstanding its capital levels, Talmer West Bank will not be categorized as well capitalized while it is subject to the Consent Order. As prescribed in the Order from the FDIC, the Tier 1 leverage ratio should be at least 9.5%. Actual Target Leverage Ratio as of June 30, 2014 & Excess Capital As-Adjusted (Dollars in Thousands) Amount Ratio Ratio Amount Avg. Tangible Common Equity / Avg. Tangible Assets Talmer Bancorp, Inc. (Consolidated) (1) 692,426 $ 12.8% Tier 1 Leverage Ratio Talmer Bancorp, Inc. (Consolidated) 624,432 11.7% 8.5% 171,007 $ Talmer Bank and Trust 535,815 12.1% Talmer West Bank (2) 88,067 9.9% Tier 1 Capital to Risk-Weighted Assets Talmer Bancorp, Inc. (Consolidated) 624,432 16.2% Talmer Bank and Trust 535,815 16.2% Talmer West Bank (2) 88,067 15.8% Total Capital to Risk-Weighted Assets Talmer Bancorp, Inc. (Consolidated) 668,547 17.3% Talmer Bank and Trust 577,506 17.4% Talmer West Bank (2) 90,579 16.3% (3 months) |
|
|
Source: SNL Financial, data as of 3/31/2014. * Includes banks with assets between $100mm and $1.5bn not included in the distressed or stressed lists (Texas Ratio < 50%). 15 Potential Midwest Opportunities Open Bank acquisition opportunities exist in current and focus Midwest markets Currently targeting markets primarily in Michigan and Ohio Focused on strong core deposit bases Nationwide, there are 499 banks on the nationwide FDIC Problem Bank List as of the first quarter of 2014 Other opportunities for distressed banks, troubled holding companies and traditional M&A in focus markets exist Distressed & Stressed Banks Future Acquisition Focus Overview of Opportunities Open Bank Opportunities Distressed Banks Stressed Banks 70 126 0 25 50 75 100 125 150 Michigan Ohio Number of Open - Bank Opportunities Type Michigan Ohio Talmer Totals Distressed (Texas Ratio > 100% or < 0%) 3 2 5 Stressed (Texas Ratio 50-100%) 15 7 22 Open Bank (Assets $100mm to $1.5bn*) 70 126 196 Total 88 135 223 |
|
|
Earnings Focus 16 Talmer’s focus is on realizing significant operating synergies associated with the acquisitions of First Place Bank and Talmer West Bank Consolidation of back office processes and personnel Wind-down of third-party expenses associated with regulatory compliance and systems enhancements Elimination of “troubled bank” expenses, including excess FDIC insurance expense Continuing footprint rationalization including branch consolidations and evaluation of potential divestitures Improved efficiency ratio run rate Goal of building a sustainable 1%+ core ROA by growing upon our foundation and infrastructure With interest rates potentially at an inflection point, Talmer currently maintains excess liquidity (funded by an attractive core deposit base) to leverage into a rising rate environment Core, non-time deposits represent approx. 69% of deposits Deployment of excess cash liquidity into assets that yield at least a level of the current securities portfolio Organic loan growth trends remain strong FDIC-assisted acquisition loan portfolio attrition has slowed considerably in recent periods First Place Bank loan portfolio is comprised of more core relationships and is characterized by longer maturities with less prepayment risk than previous acquisitions Continuing to build upon our demonstrated organic commercial loan growth capabilities and recent levels of loan growth achieved Balance sheet, operating focus and income statement diversity provides flexibility to respond to an uncertain / changing interest rate environment Stable rate environment: organic earning asset growth. Minimum 10% leverage capital requirements expired on April 29, 2014 providing capacity for greater common equity leverage through organic growth and acquisitions Rising rate environment: organic earning asset growth, servicing exposure and increasing value of core deposit funding Near term Focus Excess Liquidity to Leverage Organic Loan Growth Balance Sheet Flexibility |

|
|
Cautionary Note Regarding Forward-Looking Statements Certain statements contained in this presentation are “forward-looking statements” within the meaning of the federal securities laws. The words “may,” “will,” “anticipate,” “should,” “would,” “believe,” "expect,” “estimate,” “continue,” "goal," and “intend,” as well as other similar words and expressions of the future, are intended to identify forward-looking statements. Examples of forward-looking statements, include, among others, statements related to our future expectations, including statements about our goal of building a sustainable 1%+core ROA, improvements in our core efficiency ratios and our plans to achieve these ratios, statements regarding acquisition opportunities (including failed bank, conventional and branch acquisitions), statements regarding our proposed acquisition of First of Huron Corp., including our expectation that the acquisition will be immediately accretive to earnings, its anticipated yield on tangible book value, our assumed cost savings and fair value marks in the transaction, statements regarding the timing of our system conversion of Talmer West Bank, statements regarding financial projections, the assumptions related to such projections, and statements regarding our asset growth and our strategic plan. Forward-looking statements are neither historical facts nor assurances of future performance. Instead, they are based only on our current beliefs, expectations and assumptions regarding the future of our business, future plans and strategies, projections, anticipated events and trends, the economy and other future conditions. Because forward-looking statements relate to the future, they are subject to risks, uncertainties and other factors, such as a downturn in the economy, unanticipated losses related to the integration of, and accounting for, our acquisition transactions, access to funding sources, greater than expected noninterest expenses, volatile credit and financial markets both domestic and foreign, potential deterioration in real estate values, regulatory changes, excessive loan losses, and, with respect to the proposed acquisition of First of Huron Corp., the inability to obtain the requisite regulatory and shareholder approvals and meet other closing terms and conditions, the reaction to the acquisition of each bank's customers, employees and counterparties or difficulties related to the transition of services, as well as additional risks and uncertainties contained in the “Risk Factors” and the forward-looking statement disclosure contained in our Annual Report on Form 10-K for the most recently ended fiscal year, any of which could cause actual results to differ materially from future results expressed or implied by those forward-looking statements. All forward-looking statements speak only as of the date on which such statement is made. We undertake no obligation to update or revise any forward-looking statements, whether written or oral, that may be made from time to time, whether as a result of new information, future events or otherwise. |

|
|
18 Appendix: Non-GAAP Reconciliation For the years ended December 31, (Dollars in thousands, except per shara data) 2010 2011 2012 2013 June 30, 2014 Total Shareholders' Equity 250,935 $ 321,326 $ 520,743 $ 617,015 $ 726,125 $ Less: Core Deposit Intangibles 5,827 7,309 6,071 13,205 15,378 Tangible Shareholders' Equity 245,108 $ 314,017 $ 514,672 $ 603,810 $ 710,747 $ Shares Outstanding (000) 38,956 44,469 66,229 66,234 70,451 Tangible Book Value per Share 6.29 $ 7.06 $ 7.77 $ 9.12 $ 10.09 $ Average Assets 982,233 $ 2,093,989 $ 2,216,371 $ 4,725,767 $ 5,444,065 $ Average Equity 173,916 279,817 352,779 603,657 708,166 Average Core Deposit Intangibles 3,075 7,488 6,672 14,524 15,740 Tangible Average Equity to Tangible Average Assets 17.45% 13.05% 15.66% 12.50% 12.76% For the three months ended |