Attached files
| file | filename |
|---|---|
| 8-K - 8-K - NAUTILUS, INC. | d774080d8k.htm |
| Exhibit 99.1
|
Exhibit 99.1
Marketing Meetings
with Sidoti & Co
AUGUST 13-14, 2014
|
|
Safe Harbor Statement
This presentation includes forward-looking statements (statements which are not historical facts) within the meaning of the Private Securities Litigation Reform Act of 1995, including statements concerning the Company’s prospects, resources, capabilities, current or future financial trends or operating results, demand for the Company’s products, future plans for introduction of new products and the anticipated outcome of new business initiatives, estimates of market size and growth, planned capital expenditures and statements concerning our ability to finance growth plans with cash generated from our operations. Factors that could cause Nautilus, Inc.‘s actual results to differ materially from these forward-looking statements include our ability to acquire inventory from sole source foreign manufacturers at acceptable costs, within timely delivery schedules asnd that meet our quality control standards, availability and price of media time consistent with our cost and audience profile parameters, a decline in consumer spending due to unfavorable economic conditions in one or more of our current or target markets, an adverse change in the availability of credit for our customers who finance their purchases, our ability to pass along vendor raw material price increases and increased shipping costs, our ability to effectively develop, market and sell future products, our ability to protect our intellectual property, and the introduction of competing products. Additional assumptions, risks and uncertainties are described in detail in our registration statements, reports and other filings with the Securities and Exchange Commission, including the “Risk Factors” set forth in our Annual Report on Form 10-K, as supplemented by our quarterly reports on Form 10-Q. Such filings are available on our website or at www.sec.gov. You are cautioned that such statements are not guarantees of future performance and that actual results or developments may differ materially from those set forth in the forward-looking statements. We undertake no obligation to publicly update or revise forward-looking statements to reflect subsequent events or circumstances.
Unless otherwise indicated, all information regarding our operating results pertain to continuing operations.
© Nautilus, Inc. 2014
| 2 |
|
|
|
Presentation Overview
Who We Are: A team focused on providing innovative fitness solutions and superior results
Our Strategies: Strategic Innovation, Operational Excellence, Footprint Expansion
Our Results: Robust top and bottom line growth; Strong Balance Sheet
| 3 |
|
|
|
Who We Are Today
A leading provider of fitness equipment and related products for use in, and around, the home
Growing company which has dramatically improved profitability
Strong portfolio of brands, including #1 in the fitness industry (Bowflex)*
Industry leading capabilities in product quality and innovation
Revenue growth driven through expansion in three key channels: Direct to consumers, large and small Retail accounts, and Royalty revenue through licensing
An organization focused on increasing shareholder value
Our mission is to provide products which allow consumers to achieve their health and fitness goals
| * |
|
Based on 2012 National Consumer Research Study |
| 4 |
|
|
|
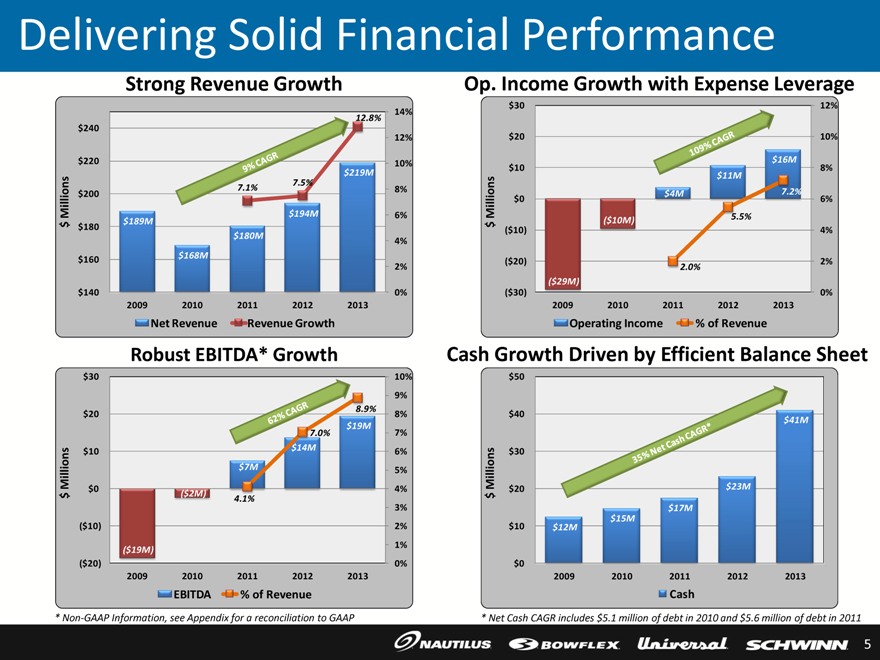
Delivering Solid Financial Performance
Strong Revenue Growth
Op. Income Growth with Expense Leverage
$240
$220
$200
$ Millions
$180
$160
$140
$189M
2009
$168M
7.1%
$180M
7.5%
$194M
12.8%
$219M
14%
12%
10%
8%
6%
4%
2%,9%, CAGR 0% 2009 2010 2011 2012 2013 Net Revenue Revenue Growth
$30 12%
$20 10%
$16M
$10 8%
$11M
$4M 7.2%
$0 6%
$ Millions ($10M) 5.5%
($10) 4%
($20) 2% 109% CAGR
2.0%
($29M)
0% ($30)
2009 2010 2011 2012 2013
operating Income % of Revenue
Robust EBITDA* Growth
Cash Growth Driven by Efficient Balance Sheet
$30
$20
$10
$7M
62% CAGR 8.9% 7.0% $19M< ($19M)
4.1%
$ Million s $0 ($2M)
($10)
($20)
2010
EBITDA % of Revenue
$50
$40
$41M
$30
$ Million $20 $23M
$12M 35% Net Cash CAGR*
$17M
$14M
$15M
$10
$5
$0 $0
2009 2009 2010 2010 2011 2011 2012 2012 2013 2013
Cash Debt
| * |
|
Net Cash CAGR includes $5.1 million of debt in 2010 and $5.6 million of debt in 2011 |
| * |
|
Non-GAAP Information, see Appendix for a reconciliation to GAAP |
| 10% |
|
9% 8% 7% 6% 5% 4% 3% 2% 1% 0% |
| 5 |
|
|
|
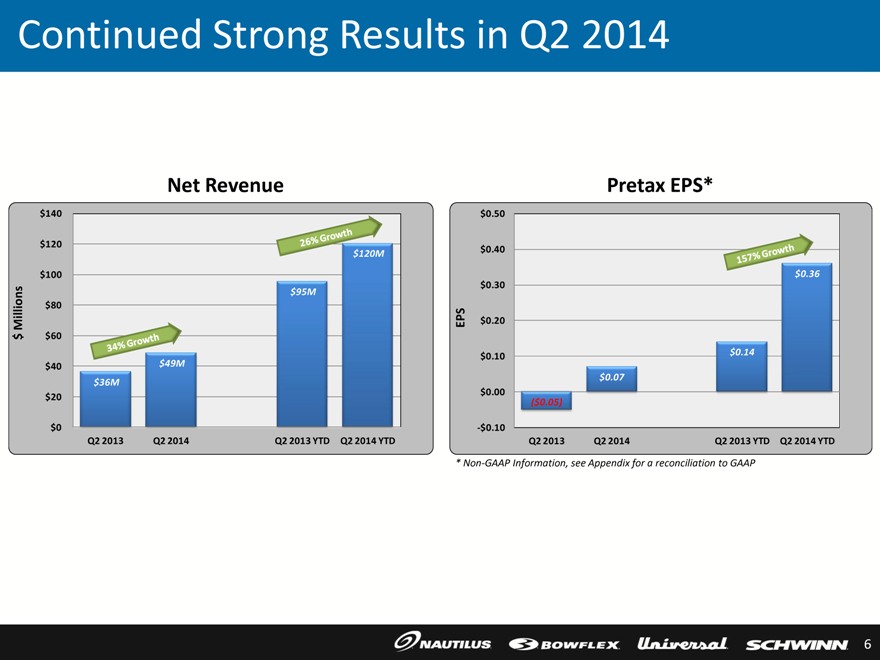
Continued Strong Results in Q2 2014
Net Revenue
$140
$120
$120M
$100
$95M
$80
$ Millions $60
$40 $49M
$36M
$20
$0
Q2 2013 Q2 2014 Q2 2013 YTD Q2 2014 YTD
Pretax EPS*
$ 0.50
$ 0.40
$ 0.36
$ 0.30
$ 0.10 $ 0.14
$ 0.07
$ 0.00
($ 0.05)
-$ 0.10
26% Growth 34% Growth 157% Growth $0.20 EPS
Q2 2013 Q2 2014 Q2 2013 YTD Q2 2014 YTD
* Non-GAAP Information, see Appendix for a reconciliation to GAAP
| 6 |
|
|
|
Strong Balance Sheet to Support Growth
$57.3M of cash and marketable securities and no debt as of June 30, 2014
$27.1M of net deferred tax assets as of June 30, 2014
Working capital utilization metrics among the best in the industry
Internal cash generation expected to finance growth plans
Modest capital expenditures of approximately $3M - $5M per year range expected
| 7 |
|
|
|
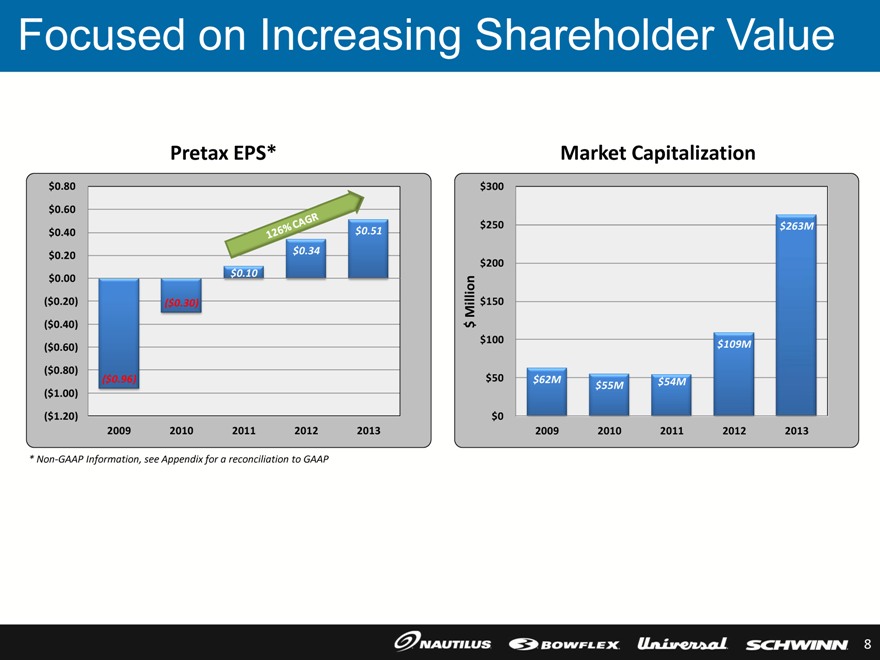
Focused on Increasing Shareholder Value
Pretax EPS*
$0.80
$0.60
$0.40 $ 0.51
$0.20 $ 0.34
$0.00 $ 0.10
($ 0.20) ($ 0.30)
($ 0.40)
($ 0.60)
($ 0.80)
($ 0.96)
($ 1.00)
($ 1.20)
2009 2010 2011 2012 2013
Market Capitalization
$300s
$250 $263M
$200
$109M
$
$55M $54M
$0
2009 2010 2011 2012 2013
126% CAGR
$ Million 150 & 50 & 62M
| * |
|
Non-GAAP Information, see Appendix for a reconciliation to GAAP |
| 8 |
|
|
|
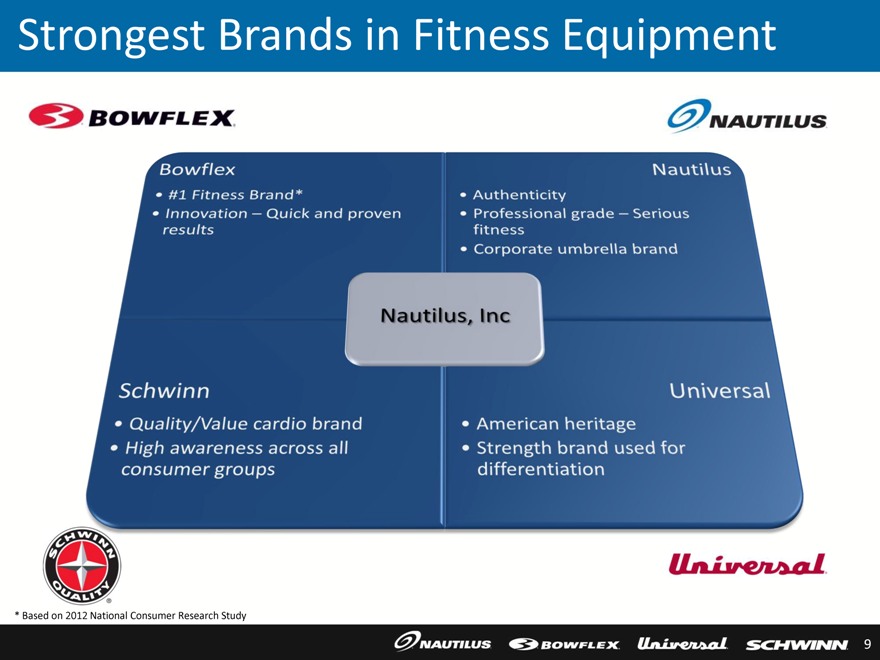
Strongest Brands in Fitness Equipment
Bowflex
#1 Fitness Brand*
Innovation – Quick and proven results
Schwinn
Quality/Value cardio brand
High awareness across all consumer groups
Nautilus, Inc
Authenticity
Professional grade – Serious fitness
Corporate umbrella brand
sAmerican heritage Universal Nautilus
Strength brand used for differentiation
9
|
|
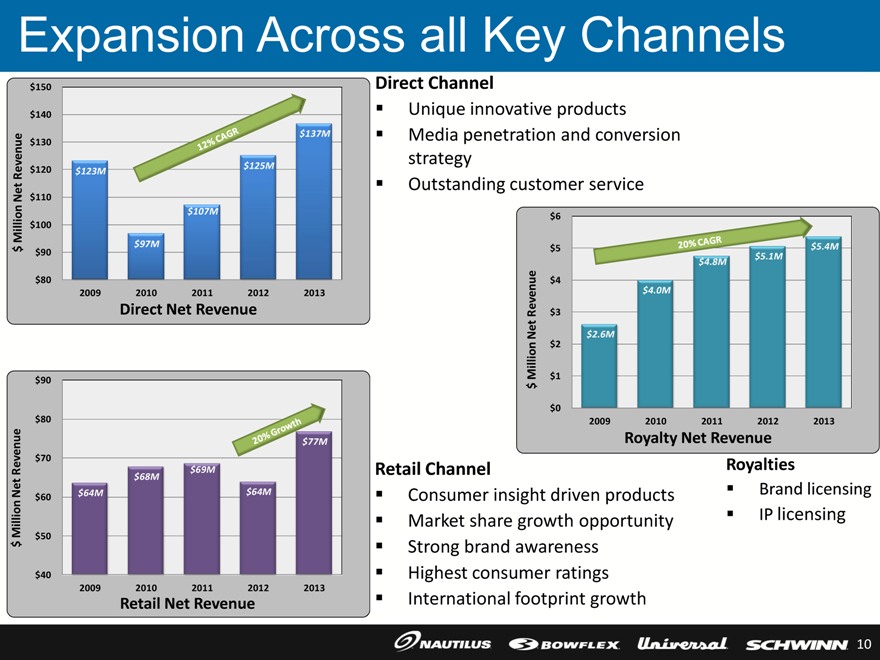
Expansion Across all Key Channels
$150
$140
$137M
$130
$120 $123M $125M
$110
$107M
$100
$ Million Net Revenue $97M
$90
$80
2009
$90
$80
$70
$60 $64M
$ Million Net Revenue $50
$40
2009 2010 2011 2012 2013
Retail Net Revenue
Direct Channel
Unique innovative products
Media penetration and conversion strategy
Outstanding customer service
$6
$5 $5.4M
$4.8M $5.1M
$4
$4.0M
$3
$2.6M
$2
$ Million Net Revenue $1
$0
2009 2010 2011 2012 2013
Royalty Net Revenue
Retail Channel
Consumer insight driven products
Royalties
Brand licensing Market share growth opportunity
IP licensing Strong brand awareness
Highest consumer ratings
International footprint growth
12% CAGR Direct Revenue 20% Growth $69M $ 64M $ 77M $68M 20% CAGR
10
|
|
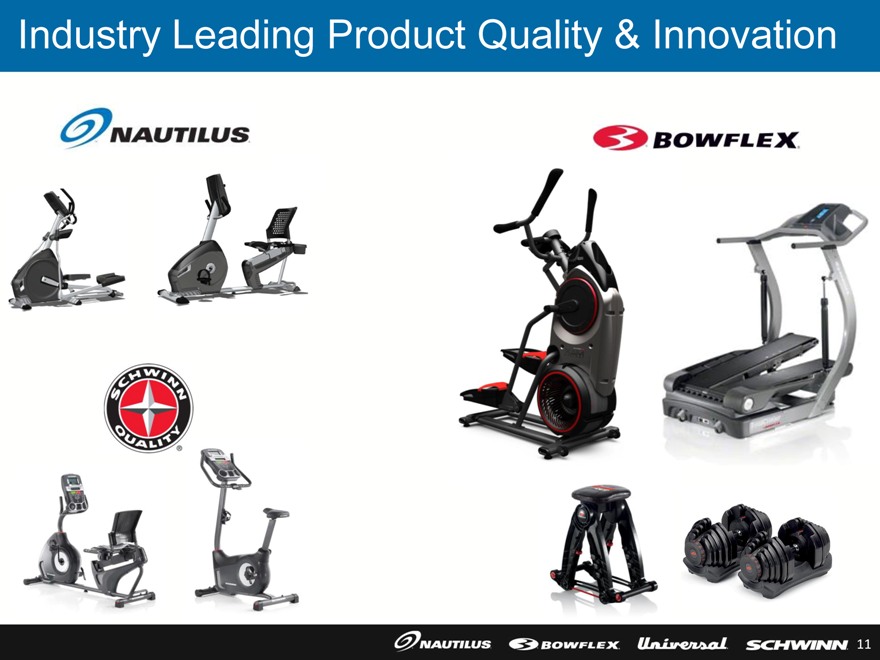
Industry Leading Product Quality & Innovation
11
|
|
Retail Channel
12
|
|
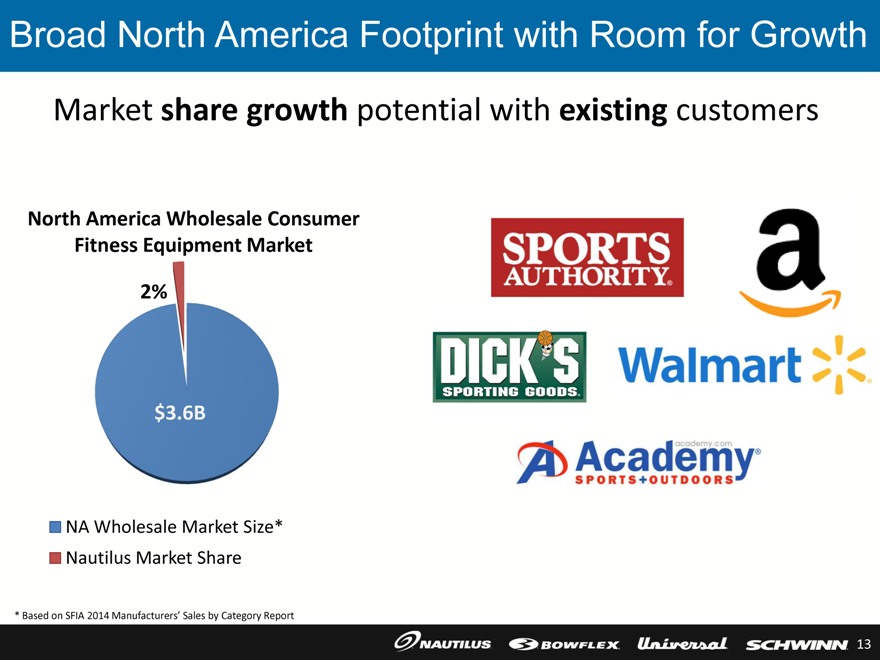
Broad North America Footprint with Room for Growth
Market share growth potential with existing customers
North America Wholesale Consumer Fitness Equipment Market
2%
$3.6B
NA Wholesale Market Size* Nautilus Market Share
| * |
|
Based on SFIA 2014 Manufacturers’ Sales by Category Report |
13
|
|
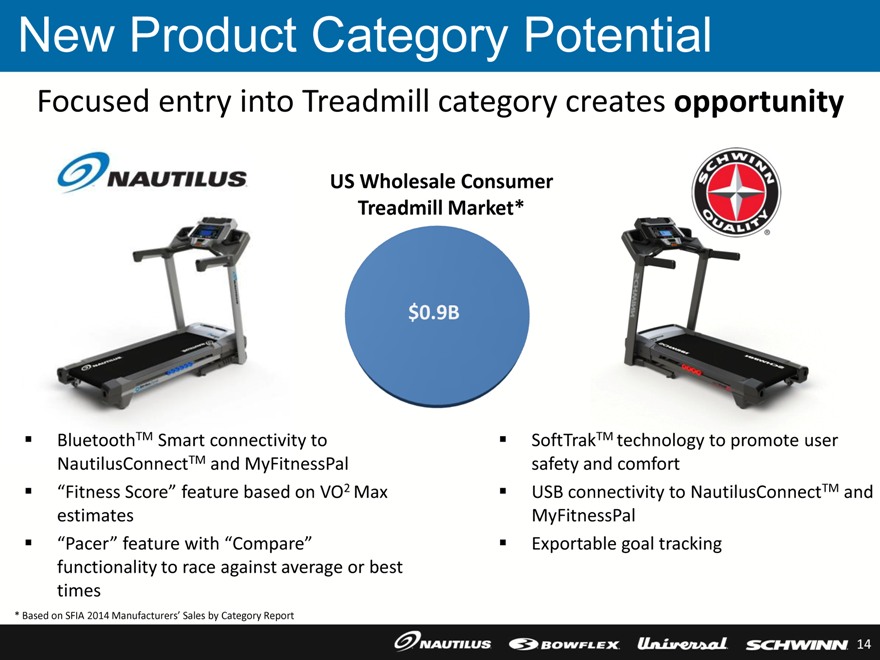
New Product Category Potential
Focused entry into Treadmill category creates opportunity
US Wholesale Consumer Treadmill Market*
$0.9B
BluetoothTM Smart connectivity to NautilusConnectTM and MyFitnessPal
“Fitness Score “ feature based on VO2 Max estimates
“Pacer “ feature with “Compare” functionality to race against average or best times
SoftTrakTM technology to promote user safety and comfort
USB connectivity to NautilusConnectTM and MyFitnessPal
Exportable goal tracking
| * |
|
Based on SFIA 2014 Manufacturers’ Sales by Category Report |
14
|
|
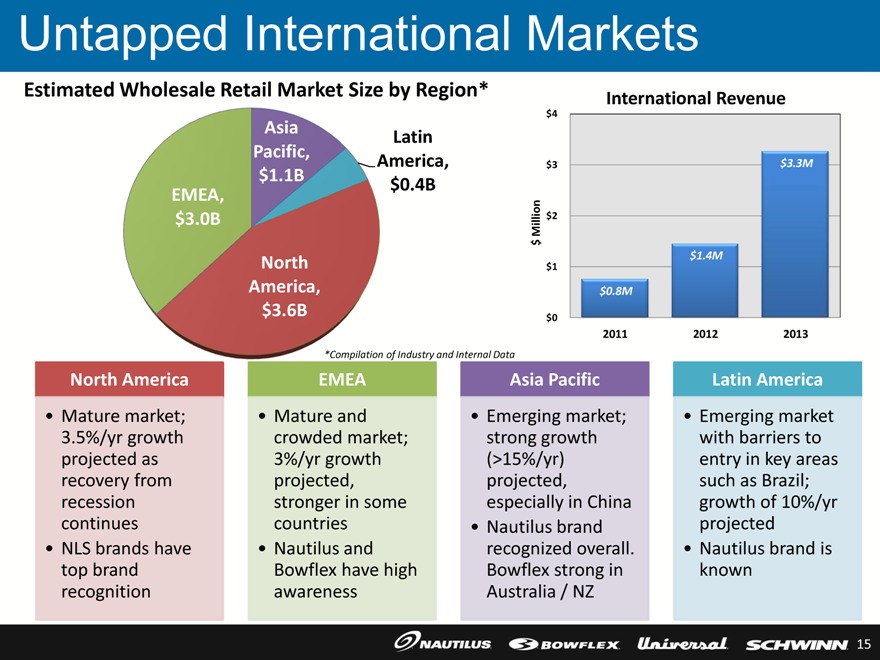
Untapped International Markets
Estimated Wholesale Retail Market Size by Region* International Revenue
$4
Asia Latin
Pacific, America, $3 $3.3M
$1.1B $0.4B
EMEA,
$3.0B $ Millions $2
North $1 $1.4M
America,s $0.8M
$3.6B $0
2011 2012 2013
*Compilation of Industry and Internal Data
North America
Mature market; 3.5%/yr growth projected as recovery from recession continues
NLS brand have top brand recognition
EMEA
Mature and crowded market; 3%/yr growth projected, stronger in some countries
Nautilus and Blowflex have high awareness
Asia pacific
Emerging market strong growth(15%/yr) projected especially in China
Nautilus brand recognized overall. Bowflex strong in Australia / NZ
Latin America
Emerging market with barriers to entry in key areas such as Brazil; growth of 10%/yr projected
Nautilus brand is known
15
|
|

Direct Channel
16
|
|
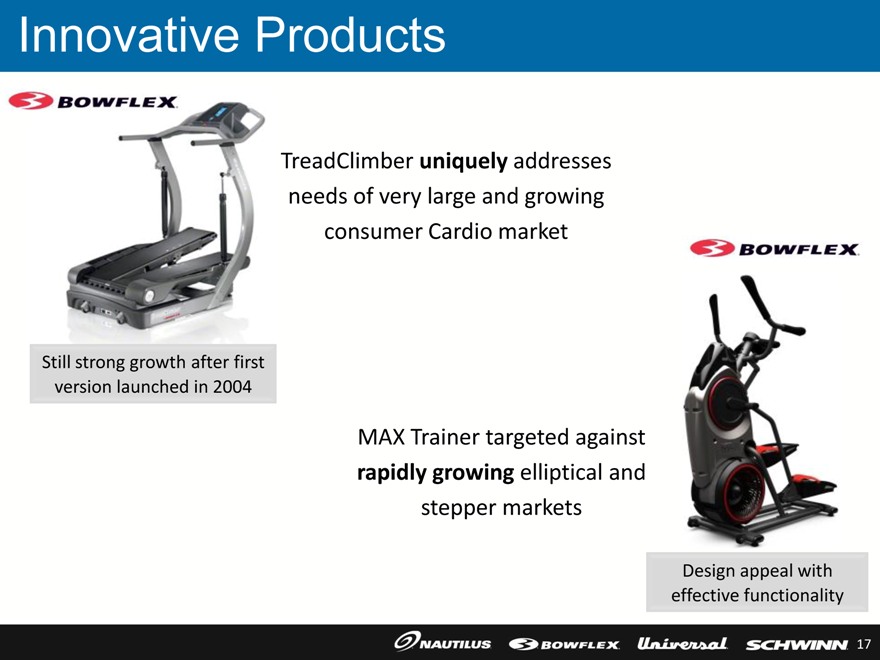
Innovative Products
TreadClimber uniquely addresses needs of very large and growing consumer Cardio market
Still strong growth after first version launched in 2004
MAX Trainer targeted against rapidly growing elliptical and stepper markets
Design appeal with effective functionality
17
|
|
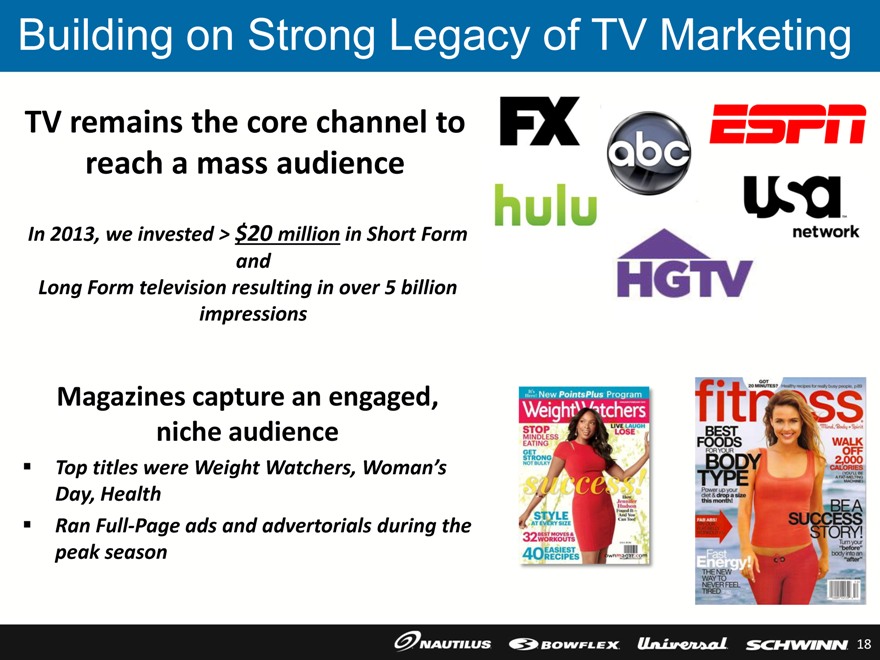
Building on Strong Legacy of TV Marketing
TV remains the core channel to reach a mass audience
In 2013, we invested > $20 million in Short Form and Long Form television resulting in over 5 billion impressions
Magazines capture an engaged, niche audience
Top titles were Weight Watchers, Woman’s Day, Health
Ran Full-Page ads and advertorials during the peak season
18
|
|
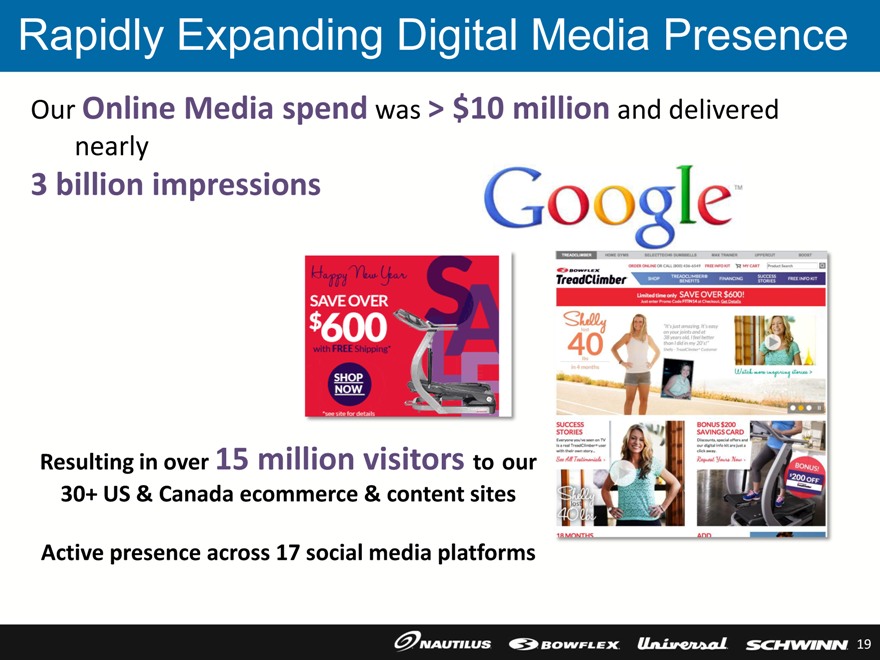
Rapidly Expanding Digital Media Presence
Our Online Media spend was > $10 million and delivered nearly
| 3 |
|
billion impressions |
Resulting in over 15 million visitors to our 30+ US & Canada ecommerce & content sites
Active presence across 17 social media platforms
19
|
|
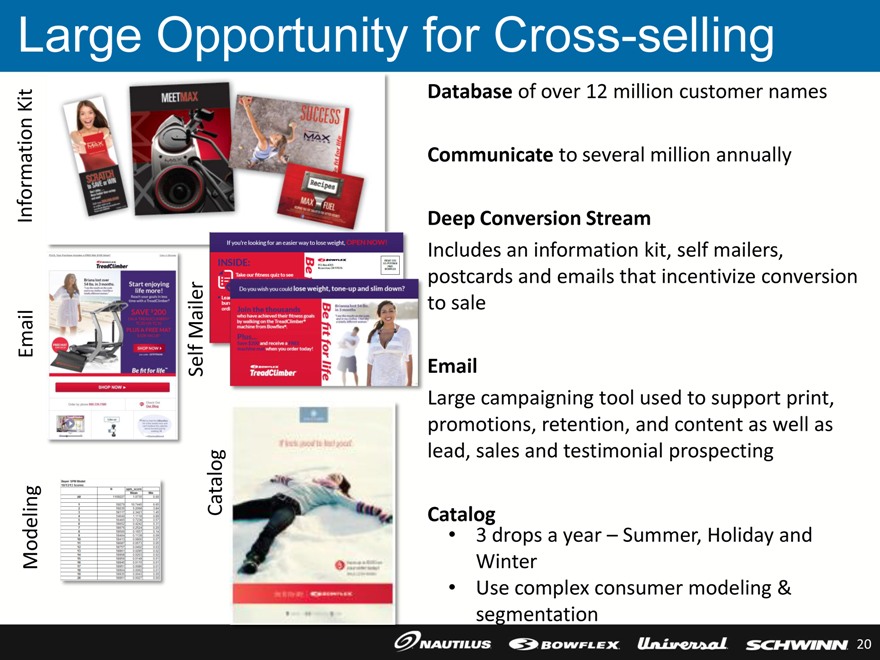
Large Opportunity for Cross-selling
Database of over 12 million customer names
Communicate to several million annually
Deep Conversion Stream
Includes an information kit, self mailers, postcards and emails that incentivize conversion to sale
Large campaigning tool used to support print, promotions, retention, and content as well as lead, sales and testimonial prospecting
Catalog
| 3 |
|
drops a year – Summer, Holiday and Winter |
Use complex consumer modeling & segmentation
Kit Information
Modeling
20
|
|

Long-term Goals
21
|
|
Our Five Management Principles
| 1. |
|
Focus on profitable growth while leveraging and tightly controlling expenses |
| 2. |
|
Deliver a steady flow of consumer-insight driven innovations |
| 3. |
|
Continue investing in our brands and new product launches |
Longer term view
| 4. |
|
Apply sense of urgency and intense focus on strategy and execution |
Achieve what we say we’re going to do
| 5. |
|
Support and nurture our vibrant culture of organizational excellence |
Continue to drive positive shareholder return!
22
|
|
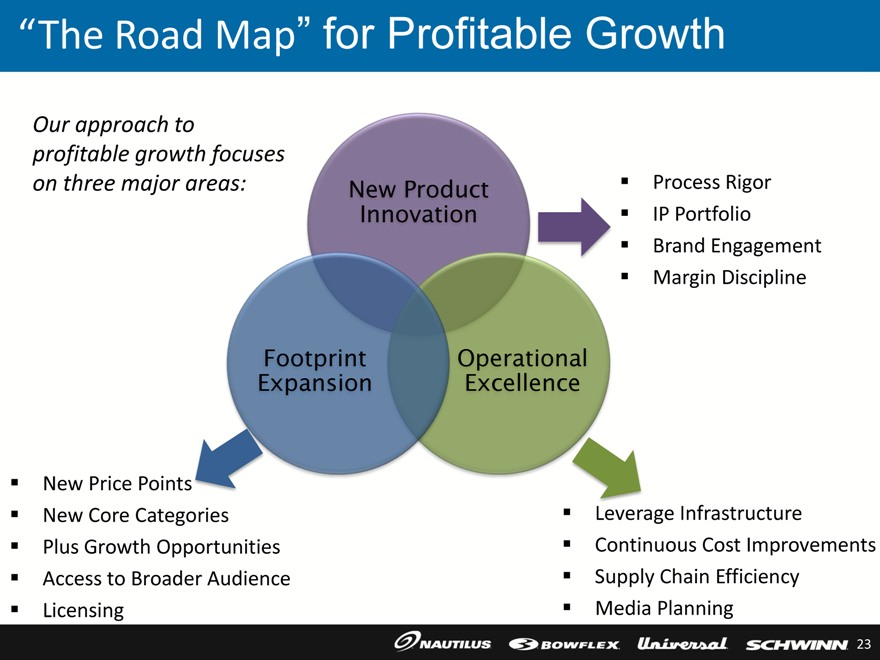
“The Road Map” for Profitable Growth
Our approach to profitable growth focuses on three major areas:
New Product Innovation
Process Rigor
IP Portfolio
Brand Engagement
Margin Discipline
Footprint Expansion
New Price Points
New Core Categories
Plus Growth Opportunities
Access to Broader Audience
Licensing
Operational Excellence
Leverage Infrastructure
Continuous Cost Improvements
Supply Chain Efficiency
Media Planning
23
|
|
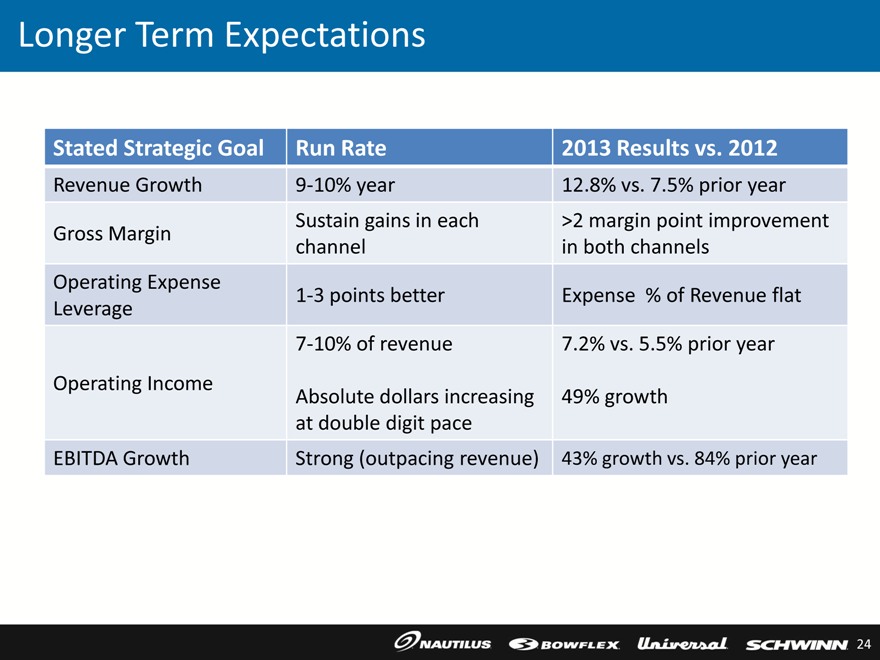
Longer Term Expectations
Stated Strategic Goal
Run Rate
2013 Results vs. 2012
Revenue Growth
Gross Margin
9-10% year
12.8% vs. 7.5% prior year
Sustain gains in each channel >2 margin point improvement in both channels
Operating Expense Leverage
1-3 points better
Expense % of Revenue flat
7-10% of revenue 7.2% vs. 5.5% prior year
Operating Income
Absolute dollars increasing 49% growth
at double digit pace
EBITDA Growth Strong (outpacing revenue) 43% growth vs. 84% prior year
24
|
|
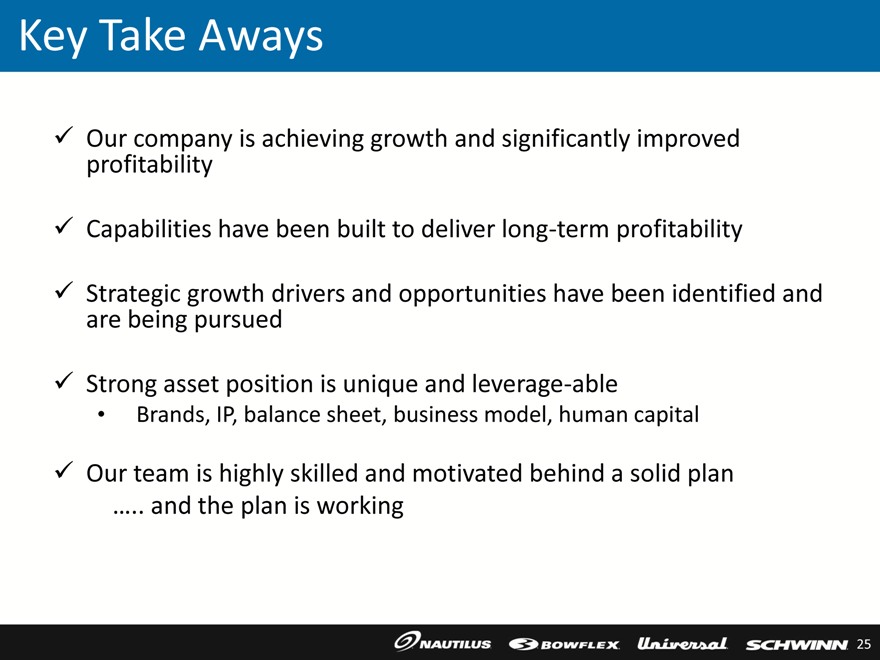
Key Take Aways
Our company is achieving growth and significantly improved profitability
Capabilities have been built to deliver long-term profitability
Strategic growth drivers and opportunities have been identified and are being pursued
Strong asset position is unique and leverage-able
“Brands, IP, balance sheet, business model, human capital
Our team is highly skilled and motivated behind a solid plan .....s and the plan is working
25
|
|

THANK YOU
26
|
|
Appendix
27
|
|
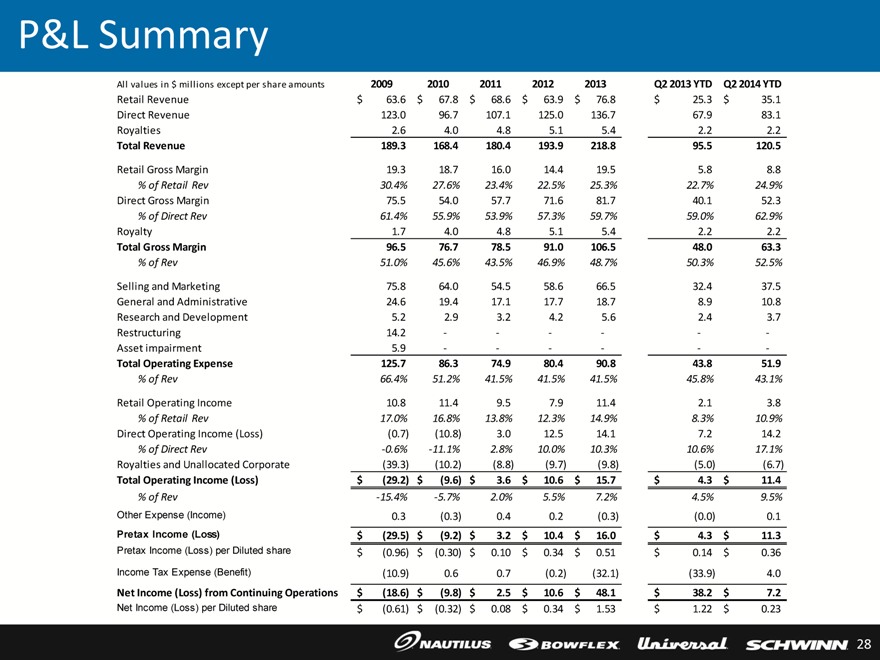
P&L Summary
All values in $ millions except per share amounts 2009 2010 2011 2012 2013 Q2 2013 YTD Q2 2014 YTD
Retail Revenue $ 63.6 $ 67.8 $ 68.6 $ 63.9 $ 76.8 $ 25.3 $ 35.1
Direct Revenue 123.0 96.7 107.1 125.0 136.7 67.9 83.1
Royalties 2.6 4.0 4.8 5.1 5.4 2.2 2.2
Total Revenue 189.3 168.4 180.4 193.9 218.8 95.5 120.5
Retail Gross Margin 19.3 18.7 16.0 14.4 19.5 5.8 8.8
% of Retail Rev 30.4% 27.6% 23.4% 22.5% 25.3% 22.7% 24.9%
Direct Gross Margin 75.5 54.0 57.7 71.6 81.7 40.1 52.3
% of Direct Rev 61.4% 55.9% 53.9% 57.3% 59.7% 59.0% 62.9%
Royalty 1.7 4.0 4.8 5.1 5.4 2.2 2.2
Total Gross Margin 96.5 76.7 78.5 91.0 106.5 48.0 63.3
% of Rev 51.0% 45.6% 43.5% 46.9% 48.7% 50.3% 52.5%
Selling and Marketing 75.8 64.0 54.5 58.6 66.5 32.4 37.5
General and Administrative 24.6 19.4 17.1 17.7 18.7 8.9 10.8
Research and Development 5.2 2.9 3.2 4.2 5.6 2.4 3.7
Restructuring 14.2 — — — — — —
Asset impairment 5.9 — — — — — —
Total Operating Expense 125.7 86.3 74.9 80.4 90.8 43.8 51.9
% of Rev 66.4% 51.2% 41.5% 41.5% 41.5% 45.8% 43.1%
Retail Operating Income 10.8 11.4 9.5 7.9 11.4 2.1 3.8
% of Retail Rev 17.0% 16.8% 13.8% 12.3% 14.9% 8.3% 10.9%
Direct Operating Income (Loss) (0.7) (10.8) 3.0 12.5 14.1 7.2 14.2
% of Direct Rev -0.6% -11.1% 2.8% 10.0% 10.3% 10.6% 17.1%
Royalties and Unallocated Corporate (39.3) (10.2) (8.8) (9.7) (9.8) (5.0) (6.7)
Total Operating Income (Loss) $ (29.2) $ (9.6) $ 3.6 $ 10.6 $ 15.7 $ 4.3 $ 11.4
% of Rev -15.4% -5.7% 2.0% 5.5% 7.2% 4.5% 9.5%
Other Expense (Income) 0.3 (0.3) 0.4 0.2 (0.3) (0.0) 0.1
Pretax Income (Loss) $ (29.5) $ (9.2) $ 3.2 $ 10.4 $ 16.0 $ 4.3 $ 11.3
Pretax Income (Loss) per Diluted share $ (0.96) $ (0.30) $ 0.10 $ 0.34 $ 0.51 $ 0.14 $ 0.36
Income Tax Expense (Benefit) (10.9) 0.6 0.7 (0.2) (32.1) (33.9) 4.0
Net Income (Loss) from Continuing Operations $ (18.6) $ (9.8) $ 2.5 $ 10.6 $ 48.1 $ 38.2 $ 7.2
Net Income (Loss) per Diluted share $ (0.61) $ (0.32) $ 0.08 $ 0.34 $ 1.53 $ 1.22 $ 0.23
28
|
|
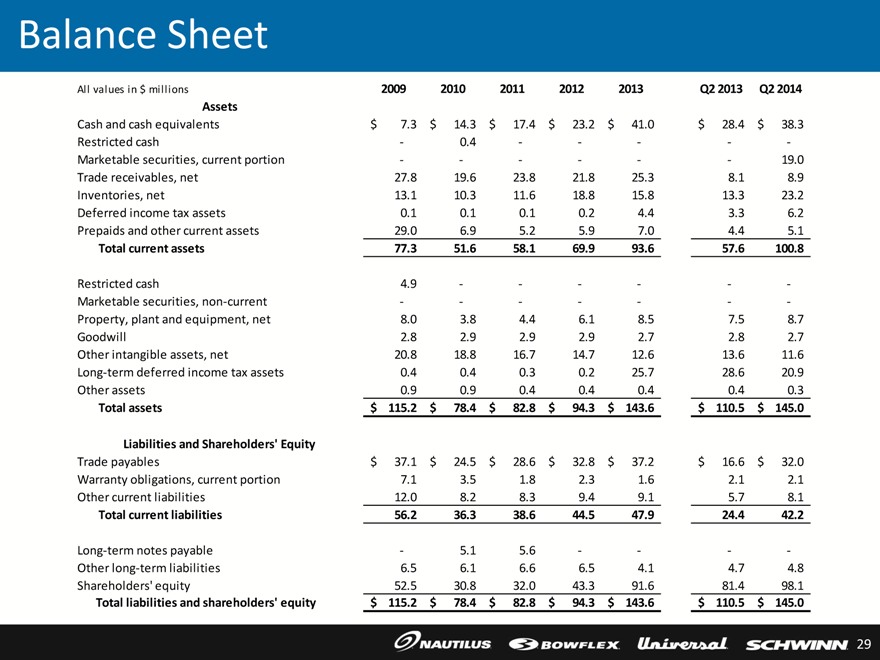
Balance Sheet
All values in $ millions 2009 2010 2011 2012 2013 Q2 2013 Q2 2014
Assets
Cash and cash equivalents $ 7.3 $ 14.3 $ 17.4 $ 23.2 $ 41.0 $ 28.4 $ 38.3
Restricted cash — 0.4 — — — — —
Marketable securities, current portion — — — — — — 19.0
Trade receivables, net 27.8 19.6 23.8 21.8 25.3 8.1 8.9
Inventories, net 13.1 10.3 11.6 18.8 15.8 s13.3 23.2
Deferred income tax assets 0.1 0.1 0.1 0.2 4.4 3.3 6.2
Prepaids and other current assets 29.0 6.9 5.2 5.9 7.0 4.4 5.1
Total current assets 77.3 51.6 58.1 69.9 93.6 57.6 100.8
Restricted cash 4.9 — — — — — —
Marketable securities, non-current — — — — — — —
Property, plant and equipment, net 8.0 3.8 4.4 6.1 8.5 7.5 8.7
Goodwill 2.8 2.9 2.9 2.9 2.7 2.8 2.7
Other intangible assets, net 20.8 18.8 16.7 14.7 12.6 13.6 11.6
Long-term deferred income tax assets 0.4 0.4 0.3 0.2 25.7 28.6 20.9
Other assets 0.9 0.9 0.4 0.4 0.4 0.4 0.3
Total assets $ 115.2 $ 78.4 $ 82.8 $ 94.3 $ 143.6 $ 110.5 $ 145.0
Liabilities and Shareholders’ Equity
Trade payables $ 37.1 $ 24.5 $ 28.6 $ 32.8 $ 37.2 $ 16.6 $ 32.0
Warranty obligations, current portion 7.1 3.5 1.8 2.3 1.6 2.1 2.1
Other current liabilities 12.0 8.2 8.3 9.4 9.1 5.7 8.1
Total current liabilities 56.2 36.3 38.6 44.5 47.9 24.4 42.2
Long-term notes payable — 5.1 5.6 — — — —s
Other long-term liabilities 6.5 6.1 6.6 6.5 4.1 4.7 4.8
Shareholders’ equity 52.5 30.8 32.0 43.3 91.6 81.4 98.1
Total liabilities and shareholders’ equity $ 115.2 $ 78.4 $ 82.8 $ 94.3 $ 143.6 $ 110.5 $ 145.0
29
|
|
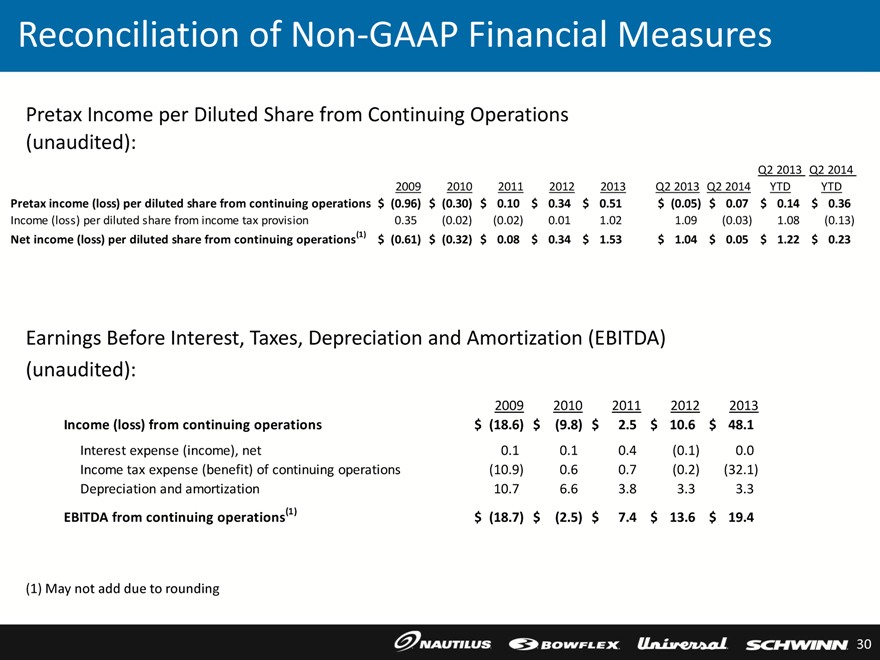
Reconciliation of Non-GAAP Financial Measures
Pretax Income per Diluted Share from Continuing Operations
(unaudited):
Q2 2013 Q2 2014
2009 2010 2011 2012 2013 Q2 2013 Q2 2014 YTD YTD
Pretax income (loss) per diluted share from continuing operations $ (0.96) $ (0.30) $ 0.10 $ 0.34 $ 0.51 $ (0.05) $ 0.07 $ 0.14 $ 0.36
Income (loss) per diluted share from income tax provision 0.35 (0.02) (0.02) 0.01 1.02 1.09 (0.03) 1.08 (0.13)
Net income (loss) per diluted share from continuing operations(1) $ (0.61) $ (0.32) $ 0.08 $ 0.34 $ 1.53 $ 1.04 $ 0.05 $ 1.22 $ 0.23
Earnings Before Interest, Taxes, Depreciation and Amortization (EBITDA)
(unaudited):
2009 2010 2011 2012 2013
Income (loss) from continuing operations $ (18.6) $ (9.8) $ 2.5 $ 10.6 $ 48.1
Interest expense (income), net 0.1 0.1 0.4 (0.1) 0.0
Income tax expense (benefit) of continuing operations (10.9) 0.6 0.7 (0.2) (32.1)
Depreciation and amortization 10.7 6.6 3.8 3.3 3.3
EBITDA from continuing operations(1) $ (18.7) $ (2.5) $ 7.4 $ 13.6 $ 19.4
| (1) |
|
May not add due to rounding |
30