Attached files
| file | filename |
|---|---|
| EX-10.1 - EX-10.1 - KINDER MORGAN MANAGEMENT LLC | a14-18783_3ex10d1.htm |
| EX-2.1 - EX-2.1 - KINDER MORGAN MANAGEMENT LLC | a14-18783_3ex2d1.htm |
| 8-K - CURRENT REPORT OF MATERIAL EVENTS OR CORPORATE CHANGES - KINDER MORGAN MANAGEMENT LLC | a14-18783_38k.htm |
Exhibit 99.1
|
|
Run By Shareholders, For Shareholders KMI to Acquire KMP, KMR, and EPB August 10, 2014 |
|
|
Forward-Looking Statements / Non-GAAP Financial Measures IMPORTANT INFORMATION AND WHERE TO FIND IT This communication may be deemed to be solicitation material in respect of the proposed acquisition by Kinder Morgan, Inc. (“KMI”) of each of Kinder Morgan Energy Partners, L.P. (“KMP”), Kinder Morgan Management, LLC (“KMR”) and El Paso Pipeline Partners, L.P. (“EPB”) (collectively, the “Proposed Transactions”). KMI plans to file with the Securities and Exchange Commission (“SEC”) a registration statement on Form S 4 in connection with the mergers. KMI will file with the SEC and mail to its security holders a proxy statement in connection with its special meeting. Each of KMP, KMR and EPB plans to file with the SEC and mail to its security holders a proxy statement/prospectus in connection with the Proposed Transactions. The registration statement, the KMI proxy statement and each proxy statement/prospectus will contain important information about KMI, KMP, KMR, EPB, the Proposed Transactions and related matters. INVESTORS AND SECURITY HOLDERS ARE URGED TO READ CAREFULLY THE REGISTRATION STATEMENT, THE APPLICABLE PROXY STATEMENT OR PROXY STATEMENT/PROSPECTUS WHEN THEY ARE AVAILABLE AND ANY OTHER DOCUMENTS TO BE FILED WITH THE SEC IN CONNECTION WITH THE PROPOSED MERGERS OR INCORPORATED BY REFERENCE IN THE PROXY STATEMENT OR THE PROXY STATEMENT/PROSPECTUS. Investors and security holders will be able to obtain copies of the KMI proxy statement and each proxy statement/prospectus as well as other filings containing information about KMI, KMP, KMR and EPB, without charge, at the SEC’s website, http://www.sec.gov. Copies of documents filed with the SEC by KMI, KMP, KMR and EPB will be made available free of charge on Kinder Morgan, Inc.’s website at http://www.kindermorgan.com/investor/ or by written request by contacting the investor relations department of KMI, KMP, KMR or EPB at the following address: 1001 Louisiana Street, Suite 1000, Houston, Texas 77002, Attention: Investor Relations or by phone at (713)-369-9490 or by email at km_ir@kindermorgan.com. NO OFFER OR SOLICITATION This communication shall not constitute an offer to sell or the solicitation of an offer to sell or the solicitation of an offer to buy any securities, nor shall there be any sale of securities in any jurisdiction in which such offer, solicitation or sale would be unlawful prior to registration or qualification under the securities laws of any such jurisdiction. No offer of securities shall be made except by means of a prospectus meeting the requirements of Section 10 of the Securities Act of 1933, as amended. PARTICIPANTS IN THE SOLICITATION KMI, KMP, KMR and EPB, and their respective directors and executive officers, may be deemed to be participants in the solicitation of proxies in respect of the Proposed Transactions. Information regarding the directors and executive officers of KMI is contained in KMI’s Form 10-K for the year ended December 31, 2013 and its proxy statement filed on April 9, 2014, each of which has been filed with the SEC. Information regarding the directors and executive officers of KMP’s general partner and KMR, the delegate of KMP’s general partner, is contained in KMP’s Form 10-K for the year ended December 31, 2013, which has been filed with the SEC. Information regarding the directors and executive officers of KMR is contained in KMR’s Form 10-K for the year ended December 31, 2013, which has been filed with the SEC. Information regarding the directors and executive officers of EPB’s general partner is contained in EPB’s Form 10-K for the year ended December 31, 2013, which has been filed with the SEC. CAUTIONARY LANGUAGE CONCERNING FORWARD-LOOKING STATEMENTS Statements in this communication regarding the Proposed Transactions involving KMI, KMP, KMR and EPB, the expected timetable for completing the Proposed Transactions, the expected benefit of the Proposed Transactions, future financial and operating results, future opportunities for the combined company and any other statements about management’s future expectations, beliefs, goals, plans or prospects constitute forward-looking statements within the meaning of the Private Securities Litigation Reform Act of 1995. Any statements that are not statements of historical fact (including statements containing the words “believes,” “plans,” “anticipates,” “expects,” “estimates” and similar expressions) should also be considered to be forward-looking statements. There are a number of important factors that could cause actual results or events to differ materially from those indicated by such forward-looking statements, including: the ability to consummate the Proposed Transactions; the ability to obtain requisite regulatory and shareholder or unitholder approval and the satisfaction of the other conditions to the consummation of the Proposed Transactions; the ability to realize anticipated synergies and cost savings; the potential impact of the announcement or consummation of the Proposed Transactions on relationships, including with employees, suppliers, customers and competitors; the ability to achieve revenue growth; the effects of environmental, legal, regulatory or other uncertainties; the effects of government regulations and policies and of the pace of deregulation of retail natural gas; national, international, regional and local economic or competitive conditions and developments; possible changes in credit ratings; capital and credit markets conditions; interest rates; the political and economic stability of oil producing nations; energy markets, including changes in the price of certain commodities; weather, alternative energy sources, conservation and technological advances that may affect price trends and demand; business and regulatory or legal decisions; the timing and success of business development efforts; acts of nature, accidents, sabotage, terrorism (including cyber attacks) or other similar acts causing damage greater than the insurance coverage limits of the combined company; and the other factors and financial, operational and legal risks or uncertainties described in KMI’s, KMP’s, KMR’s and EPB’s Annual Reports on Form 10-K for the year ended December 31, 2013 and other subsequent filings with the SEC. KMI, KMP, KMR and EPB disclaim any intention or obligation to update any forward-looking statements as a result of developments occurring after the date of this communication, other than as required by applicable law. We use non-generally accepted accounting principles (“non-GAAP”) financial measures in this presentation. Our reconciliation of non-GAAP financial measures to comparable GAAP measures can be found in the Appendix to our Analyst day presentation, dated 1/29/2014, on our website at www.kindermorgan.com. These non-GAAP measures should not be considered an alternative to GAAP financial measures. 2 |
|
|
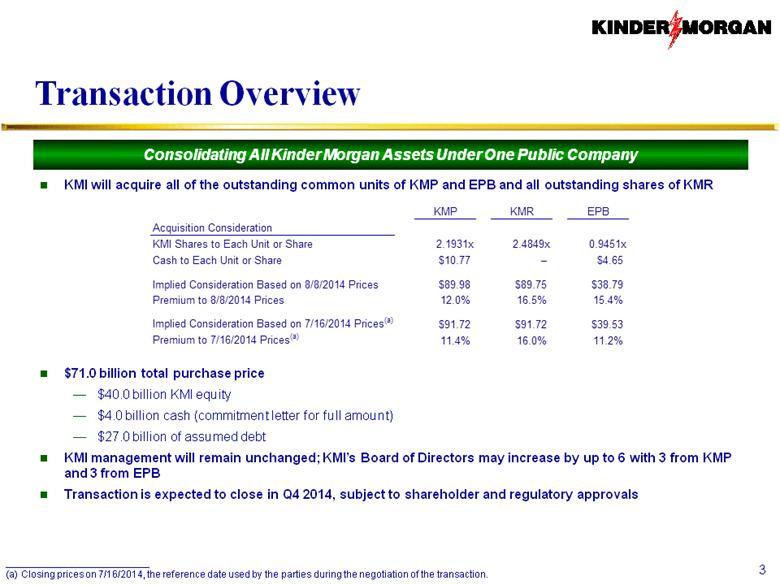
Transaction Overview KMI will acquire all of the outstanding common units of KMP and EPB and all outstanding shares of KMR $71.0 billion total purchase price $40.0 billion KMI equity $4.0 billion cash (commitment letter for full amount) $27.0 billion of assumed debt KMI management will remain unchanged; KMI’s Board of Directors may increase by up to 6 with 3 from KMP and 3 from EPB Transaction is expected to close in Q4 2014, subject to shareholder and regulatory approvals 3 Consolidating All Kinder Morgan Assets Under One Public Company __________________________ Closing prices on 7/16/2014, the reference date used by the parties during the negotiation of the transaction. KMP KMR EPB Acquisition Consideration KMI Shares to Each Unit or Share 2.1931x 2.4849x 0.9451x Cash to Each Unit or Share $10.77 – $4.65 Implied Consideration Based on 8/8/2014 Prices $89.98 $89.75 $38.79 Premium to 8/8/2014 Prices 12.0% 16.5% 15.4% Implied Consideration Based on 7/16/2014 Prices (a) $91.72 $91.72 $39.53 Premium to 7/16/2014 Prices (a) 11.4% 16.0% 11.2% |
|
|
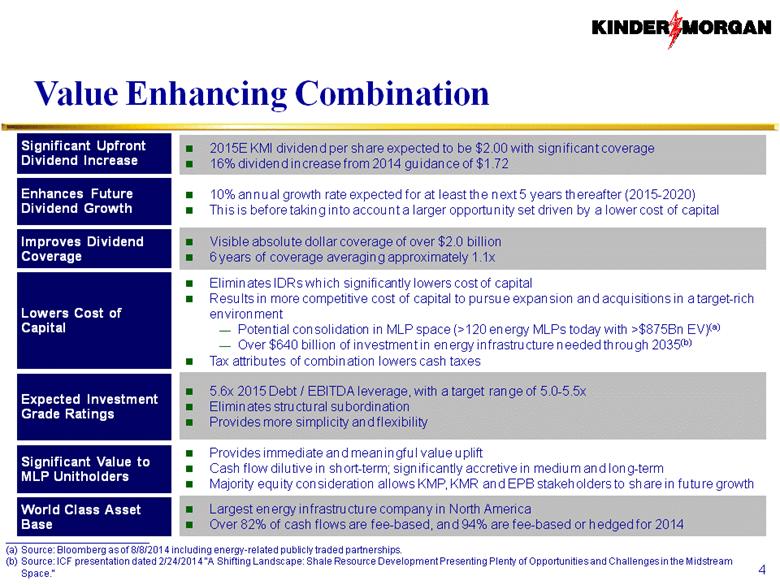
Value Enhancing Combination 4 2015E KMI dividend per share expected to be $2.00 with significant coverage 16% dividend increase from 2014 guidance of $1.72 10% annual growth rate expected for at least the next 5 years thereafter (2015-2020) This is before taking into account a larger opportunity set driven by a lower cost of capital Visible absolute dollar coverage of over $2.0 billion 6 years of coverage averaging approximately 1.1x Eliminates IDRs which significantly lowers cost of capital Results in more competitive cost of capital to pursue expansion and acquisitions in a target-rich environment Potential consolidation in MLP space (>120 energy MLPs today with >$875Bn EV)(a) Over $640 billion of investment in energy infrastructure needed through 2035(b) Tax attributes of combination lowers cash taxes 5.6x 2015 Debt / EBITDA leverage, with a target range of 5.0-5.5x Eliminates structural subordination Provides more simplicity and flexibility Provides immediate and meaningful value uplift Cash flow dilutive in short-term; significantly accretive in medium and long-term Majority equity consideration allows KMP, KMR and EPB stakeholders to share in future growth Largest energy infrastructure company in North America Over 82% of cash flows are fee-based, and 94% are fee-based or hedged for 2014 Enhances Future Dividend Growth Improves Dividend Coverage Significant Upfront Dividend Increase Lowers Cost of Capital Expected Investment Grade Ratings Significant Value to MLP Unitholders World Class Asset Base __________________________ Source: Bloomberg as of 8/8/2014 including energy-related publicly traded partnerships. Source: ICF presentation dated 2/24/2014 "A Shifting Landscape: Shale Resource Development Presenting Plenty of Opportunities and Challenges in the Midstream Space." |
|
|
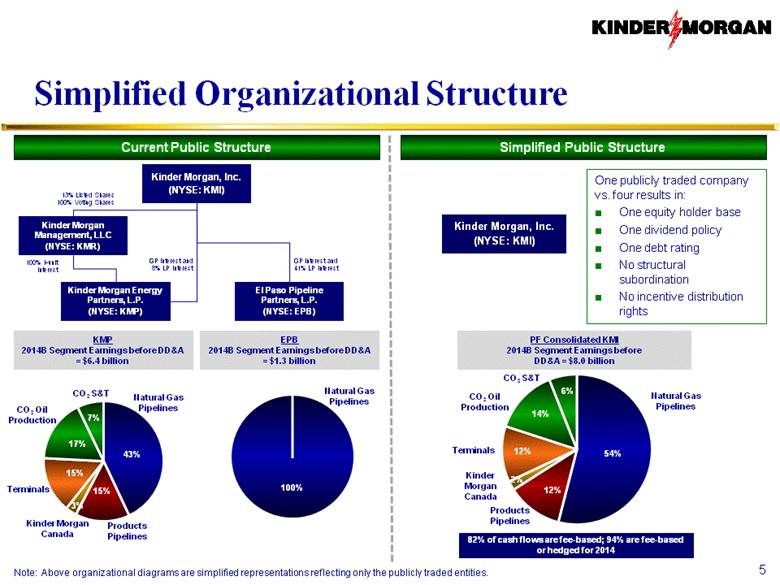
Simplified Organizational Structure 5 Note: Above organizational diagrams are simplified representations reflecting only the publicly traded entities. CO2 Oil Production CO2 S&T Natural Gas Pipelines Products Pipelines Kinder Morgan Canada Terminals KMP 2014B Segment Earnings before DD&A = $6.4 billion Natural Gas Pipelines EPB 2014B Segment Earnings before DD&A = $1.3 billion 82% of cash flows are fee-based; 94% are fee-based or hedged for 2014 CO2 Oil Production CO2 S&T Natural Gas Pipelines Products Pipelines Terminals PF Consolidated KMI 2014B Segment Earnings before DD&A = $8.0 billion Kinder Morgan Canada Current Public Structure Simplified Public Structure One publicly traded company vs. four results in: One equity holder base One dividend policy One debt rating No structural subordination No incentive distribution rights Kinder Morgan, Inc. (NYSE: KMI) Kinder Morgan Management, LLC (NYSE: KMR) Kinder Morgan Energy Partners, L.P. (NYSE: KMP) El Paso Pipeline Partners, L.P. (NYSE: EPB) 13% Listed Shares 100% Voting Shares 100% i-unit Interest GP Interest and 8% LP Interest GP Interest and 41% LP Interest Kinder Morgan, Inc. (NYSE: KMI) |
|
|
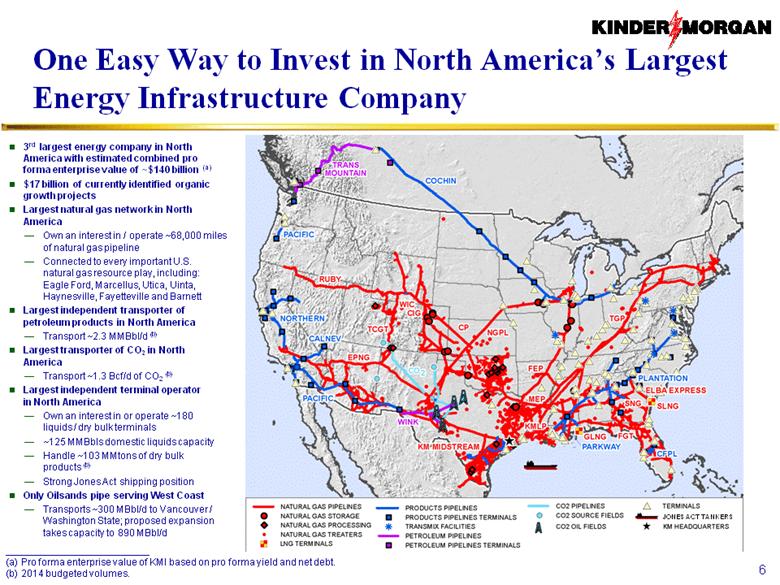
One Easy Way to Invest in North America’s Largest Energy Infrastructure Company 6 __________________________ Pro forma enterprise value of KMI based on pro forma yield and net debt. 2014 budgeted volumes. 3rd largest energy company in North America with estimated combined pro forma enterprise value of ~$140 billion (a) $17 billion of currently identified organic growth projects Largest natural gas network in North America Own an interest in / operate ~68,000 miles of natural gas pipeline Connected to every important U.S. natural gas resource play, including: Eagle Ford, Marcellus, Utica, Uinta, Haynesville, Fayetteville and Barnett Largest independent transporter of petroleum products in North America Transport ~2.3 MMBbl/d (b) Largest transporter of CO2 in North America Transport ~1.3 Bcf/d of CO2 (b) Largest independent terminal operator in North America Own an interest in or operate ~180 liquids / dry bulk terminals ~125 MMBbls domestic liquids capacity Handle ~103 MMtons of dry bulk products (b) Strong Jones Act shipping position Only Oilsands pipe serving West Coast Transports ~300 MBbl/d to Vancouver / Washington State; proposed expansion takes capacity to 890 MBbl/d JONES ACT TANKERS |
|
|
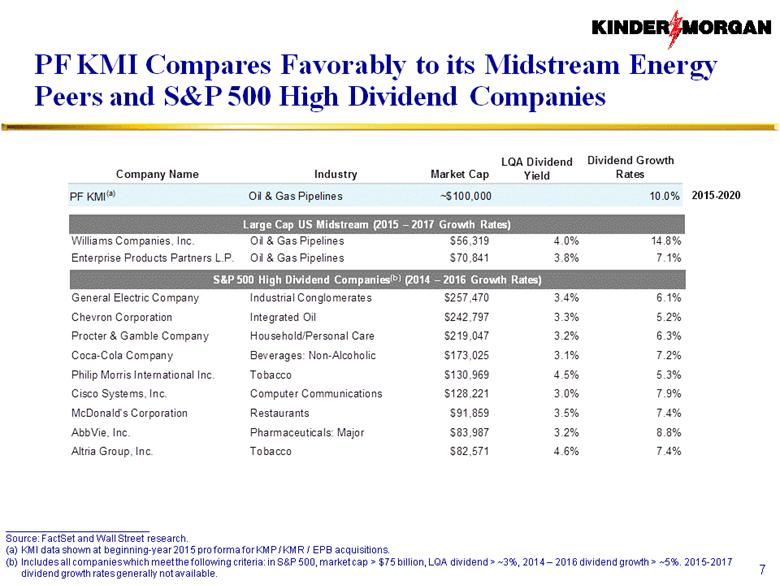
PF KMI Compares Favorably to its Midstream Energy Peers and S&P 500 High Dividend Companies 7 __________________________ Source: FactSet and Wall Street research. KMI data shown at beginning-year 2015 pro forma for KMP / KMR / EPB acquisitions. Includes all companies which meet the following criteria: in S&P 500, market cap > $75 billion, LQA dividend > ~3%, 2014 – 2016 dividend growth > ~5%. 2015-2017 dividend growth rates generally not available. Large Cap US Midstream (2015 – 2017 Growth Rates) S&P 500 High Dividend Companies(b) (2014 – 2016 Growth Rates) 2015-2020 Company Name Industry Market Cap LQA Dividend Yield Dividend Growth Rates PF KMI (a) Oil & Gas Pipelines ~$100,000 10.0% Enterprise Products Partners L.P. Oil & Gas Pipelines $70,841 3.8% 7.1% General Electric Company Industrial Conglomerates $257,470 3.4% 6.1% Chevron Corporation Integrated Oil $242,797 3.3% 5.2% Procter & Gamble Company Household/Personal Care $219,047 3.2% 6.3% Coca-Cola Company Beverages: Non-Alcoholic $173,025 3.1% 7.2% Philip Morris International Inc. Tobacco $130,969 4.5% 5.3% Cisco Systems, Inc. Computer Communications $128,221 3.0% 7.9% McDonald's Corporation Restaurants $91,859 3.5% 7.4% AbbVie, Inc. Pharmaceuticals: Major $83,987 3.2% 8.8% Altria Group, Inc. Tobacco $82,571 4.6% 7.4% |
|
|
Benefits of a C-Corp Simplifies structure; creates one public equity class Lowers cost of capital and creates a more competitive acquisition currency Significant income tax savings from the acquisition amounting to ~$20 billion over ~14 years Over half of combined KMP and EPB cash flows are already taxed at KMI under current structure Broader pool of capital available to C-Corp 8 |
|
|
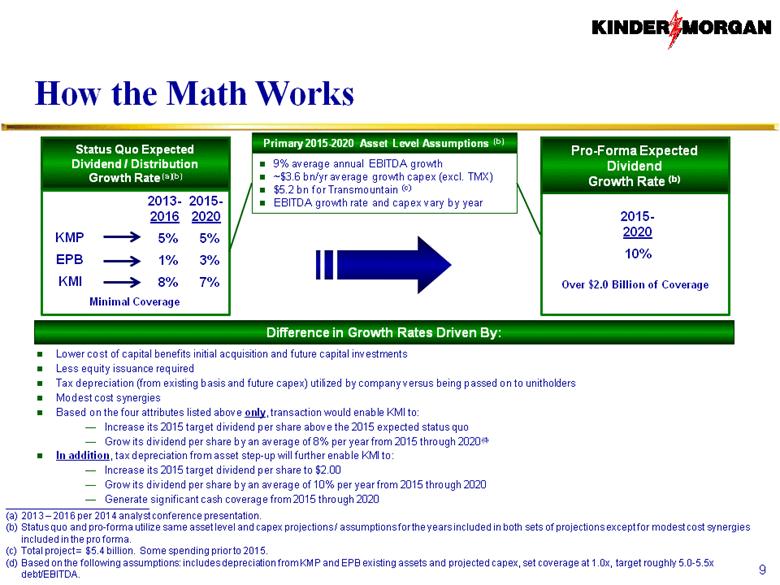
How the Math Works Lower cost of capital benefits initial acquisition and future capital investments Less equity issuance required Tax depreciation (from existing basis and future capex) utilized by company versus being passed on to unitholders Modest cost synergies Based on the four attributes listed above only, transaction would enable KMI to: Increase its 2015 target dividend per share above the 2015 expected status quo Grow its dividend per share by an average of 8% per year from 2015 through 2020(d) In addition, tax depreciation from asset step-up will further enable KMI to: Increase its 2015 target dividend per share to $2.00 Grow its dividend per share by an average of 10% per year from 2015 through 2020 Generate significant cash coverage from 2015 through 2020 9 __________________________ 2013 – 2016 per 2014 analyst conference presentation. Status quo and pro-forma utilize same asset level and capex projections / assumptions for the years included in both sets of projections except for modest cost synergies included in the pro forma. Total project = $5.4 billion. Some spending prior to 2015. Based on the following assumptions: includes depreciation from KMP and EPB existing assets and projected capex, set coverage at 1.0x, target roughly 5.0-5.5x debt/EBITDA. KMP EPB KMI 2015- 2020 10% Minimal Coverage Over $2.0 Billion of Coverage Difference in Growth Rates Driven By: Pro-Forma Expected Dividend Growth Rate (b) Status Quo Expected Dividend / Distribution Growth Rate (a)(b) 2013- 2016 5% 1% 8% Primary 2015-2020 Asset Level Assumptions (b) 9% average annual EBITDA growth ~$3.6 bn/yr average growth capex (excl. TMX) $5.2 bn for Transmountain (c) EBITDA growth rate and capex vary by year 2015- 2020 5% 3% 7% |
|
|
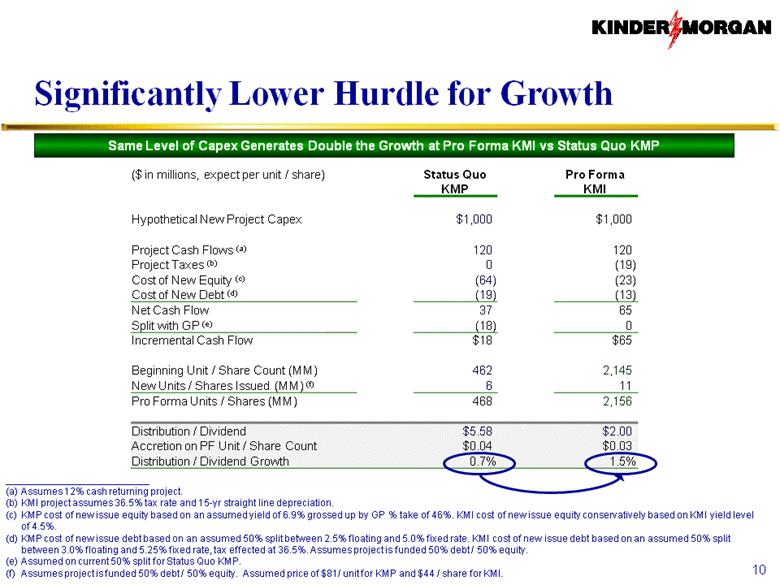
Significantly Lower Hurdle for Growth 10 ($ in millions, expect per unit / share) Status Quo Pro Forma KMP KMI Hypothetical New Project Capex $1,000) $1,000) Project Cash Flows (a) 120) 120) Project Taxes (b) 0) (19) Cost of New Equity (c) (64) (23) Cost of New Debt (d) (19) (13) Net Cash Flow 37) 65) Split with GP (e) (18) 0) Incremental Cash Flow $18) $65) Beginning Unit / Share Count (MM) 462) 2,145) New Units / Shares Issued (MM) (f) 6) 11) Pro Forma Units / Shares (MM) 468) 2,156) Distribution / Dividend $5.58) $2.00) Accretion on PF Unit / Share Count $0.04) $0.03) Distribution / Dividend Growth 0.7% 1.5% __________________________ Assumes 12% cash returning project. KMI project assumes 36.5% tax rate and 15-yr straight line depreciation. KMP cost of new issue equity based on an assumed yield of 6.9% grossed up by GP % take of 46%. KMI cost of new issue equity conservatively based on KMI yield level of 4.5%. KMP cost of new issue debt based on an assumed 50% split between 2.5% floating and 5.0% fixed rate. KMI cost of new issue debt based on an assumed 50% split between 3.0% floating and 5.25% fixed rate, tax effected at 36.5%. Assumes project is funded 50% debt / 50% equity. Assumed on current 50% split for Status Quo KMP. Assumes project is funded 50% debt / 50% equity. Assumed price of $81/ unit for KMP and $44 / share for KMI. Same Level of Capex Generates Double the Growth at Pro Forma KMI vs Status Quo KMP |
|
|
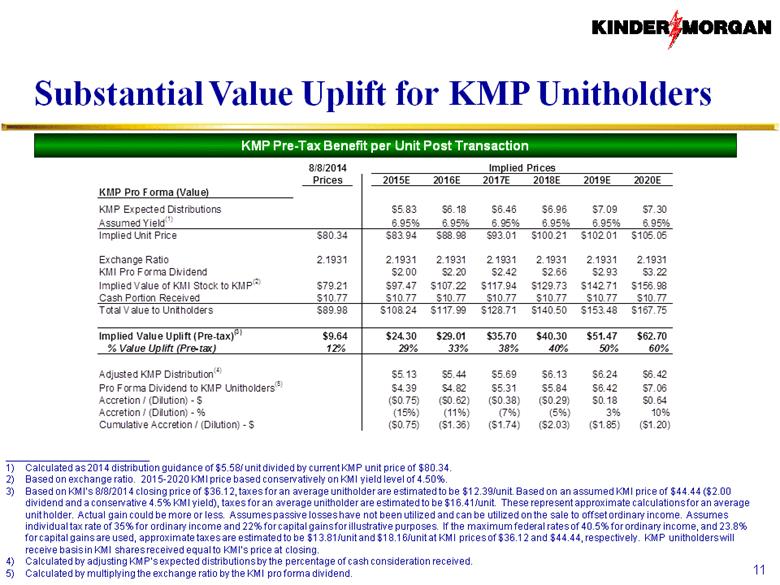
Substantial Value Uplift for KMP Unitholders 11 __________________________ Calculated as 2014 distribution guidance of $5.58/ unit divided by current KMP unit price of $80.34. Based on exchange ratio. 2015-2020 KMI price based conservatively on KMI yield level of 4.50%. Based on KMI’s 8/8/2014 closing price of $36.12, taxes for an average unitholder are estimated to be $12.39/unit. Based on an assumed KMI price of $44.44 ($2.00 dividend and a conservative 4.5% KMI yield), taxes for an average unitholder are estimated to be $16.41/unit. These represent approximate calculations for an average unit holder. Actual gain could be more or less. Assumes passive losses have not been utilized and can be utilized on the sale to offset ordinary income. Assumes individual tax rate of 35% for ordinary income and 22% for capital gains for illustrative purposes. If the maximum federal rates of 40.5% for ordinary income, and 23.8% for capital gains are used, approximate taxes are estimated to be $13.81/unit and $18.16/unit at KMI prices of $36.12 and $44.44, respectively. KMP unitholders will receive basis in KMI shares received equal to KMI’s price at closing. Calculated by adjusting KMP’s expected distributions by the percentage of cash consideration received. Calculated by multiplying the exchange ratio by the KMI pro forma dividend. KMP Pre-Tax Benefit per Unit Post Transaction 8/8/2014 Implied Prices Prices 2015E 2016E 2017E 2018E 2019E 2020E KMP Pro Forma (Value) KMP Expected Distributions $5.83 $6.18 $6.46 $6.96 $7.09 $7.30 Assumed Yield (1) 6.95% 6.95% 6.95% 6.95% 6.95% 6.95% Implied Unit Price $80.34 $83.94 $88.98 $93.01 $100.21 $102.01 $105.05 Exchange Ratio 2.1931 2.1931 2.1931 2.1931 2.1931 2.1931 2.1931 KMI Pro Forma Dividend $2.00 $2.20 $2.42 $2.66 $2.93 $3.22 Implied Value of KMI Stock to KMP (2) $79.21 $97.47 $107.22 $117.94 $129.73 $142.71 $156.98 Cash Portion Received $10.77 $10.77 $10.77 $10.77 $10.77 $10.77 $10.77 Total Value to Unitholders $89.98 $108.24 $117.99 $128.71 $140.50 $153.48 $167.75 Implied Value Uplift (Pre-tax) (3) $9.64 $24.30 $29.01 $35.70 $40.30 $51.47 $62.70 % Value Uplift (Pre-tax) 12% 29% 33% 38% 40% 50% 60% Adjusted KMP Distribution (4) $5.13 $5.44 $5.69 $6.13 $6.24 $6.42 Pro Forma Dividend to KMP Unitholders (5) $4.39 $4.82 $5.31 $5.84 $6.42 $7.06 Accretion / (Dilution) - $ ($0.75) ($0.62) ($0.38) ($0.29) $0.18 $0.64 Accretion / (Dilution) - % (15%) (11%) (7%) (5%) 3% 10% Cumulative Accretion / (Dilution) - $ ($0.75) ($1.36) ($1.74) ($2.03) ($1.85) ($1.20) |
|
|
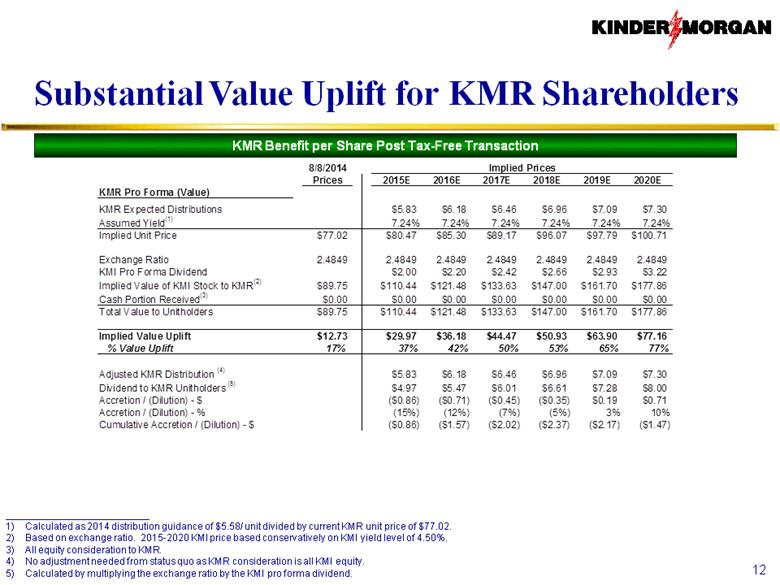
Substantial Value Uplift for KMR Shareholders 12 __________________________ Calculated as 2014 distribution guidance of $5.58/ unit divided by current KMR unit price of $77.02. Based on exchange ratio. 2015-2020 KMI price based conservatively on KMI yield level of 4.50%. All equity consideration to KMR. No adjustment needed from status quo as KMR consideration is all KMI equity. Calculated by multiplying the exchange ratio by the KMI pro forma dividend. KMR Benefit per Share Post Tax-Free Transaction 8/8/2014 Implied Prices Prices 2015E 2016E 2017E 2018E 2019E 2020E KMR Pro Forma (Value) KMR Expected Distributions $5.83 $6.18 $6.46 $6.96 $7.09 $7.30 Assumed Yield (1) 7.24% 7.24% 7.24% 7.24% 7.24% 7.24% Implied Unit Price $77.02 $80.47 $85.30 $89.17 $96.07 $97.79 $100.71 Exchange Ratio 2.4849 2.4849 2.4849 2.4849 2.4849 2.4849 2.4849 KMI Pro Forma Dividend $2.00 $2.20 $2.42 $2.66 $2.93 $3.22 Implied Value of KMI Stock to KMR (2) $89.75 $110.44 $121.48 $133.63 $147.00 $161.70 $177.86 Cash Portion Received (3) $0.00 $0.00 $0.00 $0.00 $0.00 $0.00 $0.00 Total Value to Unitholders $89.75 $110.44 $121.48 $133.63 $147.00 $161.70 $177.86 Implied Value Uplift $12.73 $29.97 $36.18 $44.47 $50.93 $63.90 $77.16 % Value Uplift 17% 37% 42% 50% 53% 65% 77% Adjusted KMR Distribution (4) $5.83 $6.18 $6.46 $6.96 $7.09 $7.30 Dividend to KMR Unitholders (5) $4.97 $5.47 $6.01 $6.61 $7.28 $8.00 Accretion / (Dilution) - $ ($0.86) ($0.71) ($0.45) ($0.35) $0.19 $0.71 Accretion / (Dilution) - % (15%) (12%) (7%) (5%) 3% 10% Cumulative Accretion / (Dilution) - $ ($0.86) ($1.57) ($2.02) ($2.37) ($2.17) ($1.47) |
|
|
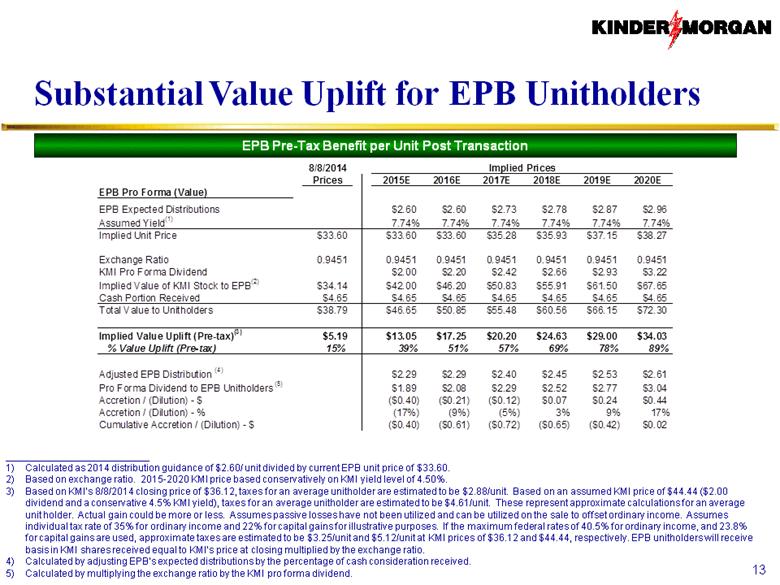
Substantial Value Uplift for EPB Unitholders 13 __________________________ Calculated as 2014 distribution guidance of $2.60/ unit divided by current EPB unit price of $33.60. Based on exchange ratio. 2015-2020 KMI price based conservatively on KMI yield level of 4.50%. Based on KMI’s 8/8/2014 closing price of $36.12, taxes for an average unitholder are estimated to be $2.88/unit. Based on an assumed KMI price of $44.44 ($2.00 dividend and a conservative 4.5% KMI yield), taxes for an average unitholder are estimated to be $4.61/unit. These represent approximate calculations for an average unit holder. Actual gain could be more or less. Assumes passive losses have not been utilized and can be utilized on the sale to offset ordinary income. Assumes individual tax rate of 35% for ordinary income and 22% for capital gains for illustrative purposes. If the maximum federal rates of 40.5% for ordinary income, and 23.8% for capital gains are used, approximate taxes are estimated to be $3.25/unit and $5.12/unit at KMI prices of $36.12 and $44.44, respectively. EPB unitholders will receive basis in KMI shares received equal to KMI’s price at closing multiplied by the exchange ratio. Calculated by adjusting EPB’s expected distributions by the percentage of cash consideration received. Calculated by multiplying the exchange ratio by the KMI pro forma dividend. EPB Pre-Tax Benefit per Unit Post Transaction 8/8/2014 Implied Prices Prices 2015E 2016E 2017E 2018E 2019E 2020E EPB Pro Forma (Value) EPB Expected Distributions $2.60 $2.60 $2.73 $2.78 $2.87 $2.96 Assumed Yield (1) 7.74% 7.74% 7.74% 7.74% 7.74% 7.74% Implied Unit Price $33.60 $33.60 $33.60 $35.28 $35.93 $37.15 $38.27 Exchange Ratio 0.9451 0.9451 0.9451 0.9451 0.9451 0.9451 0.9451 KMI Pro Forma Dividend $2.00 $2.20 $2.42 $2.66 $2.93 $3.22 Implied Value of KMI Stock to EPB (2) $34.14 $42.00 $46.20 $50.83 $55.91 $61.50 $67.65 Cash Portion Received $4.65 $4.65 $4.65 $4.65 $4.65 $4.65 $4.65 Total Value to Unitholders $38.79 $46.65 $50.85 $55.48 $60.56 $66.15 $72.30 Implied Value Uplift (Pre-tax) (3) $5.19 $13.05 $17.25 $20.20 $24.63 $29.00 $34.03 % Value Uplift (Pre-tax) 15% 39% 51% 57% 69% 78% 89% Adjusted EPB Distribution (4) $2.29 $2.29 $2.40 $2.45 $2.53 $2.61 Pro Forma Dividend to EPB Unitholders (5) $1.89 $2.08 $2.29 $2.52 $2.77 $3.04 Accretion / (Dilution) - $ ($0.40) ($0.21) ($0.12) $0.07 $0.24 $0.44 Accretion / (Dilution) - % (17%) (9%) (5%) 3% 9% 17% Cumulative Accretion / (Dilution) - $ ($0.40) ($0.61) ($0.72) ($0.65) ($0.42) $0.02 |
|
|
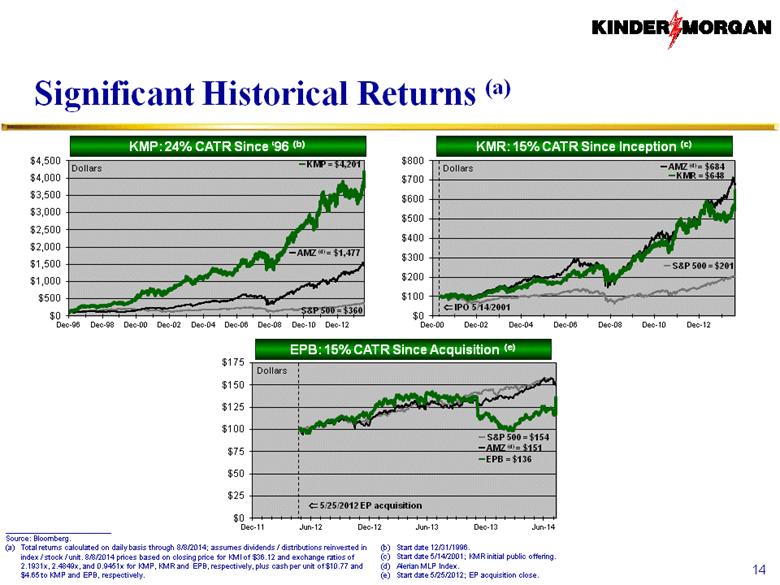
Significant Historical Returns (a) KMP: 24% CATR Since ‘96 (b) KMR: 15% CATR Since Inception (c) __________________________ Source: Bloomberg. Total returns calculated on daily basis through 8/8/2014; assumes dividends / distributions reinvested in index / stock / unit. 8/8/2014 prices based on closing price for KMI of $36.12 and exchange ratios of 2.1931x, 2.4849x, and 0.9451x for KMP, KMR and EPB, respectively, plus cash per unit of $10.77 and $4.65 to KMP and EPB, respectively. 14 EPB: 15% CATR Since Acquisition (e) Start date 12/31/1996. Start date 5/14/2001; KMR initial public offering. Alerian MLP Index. Start date 5/25/2012; EP acquisition close. |
|
|
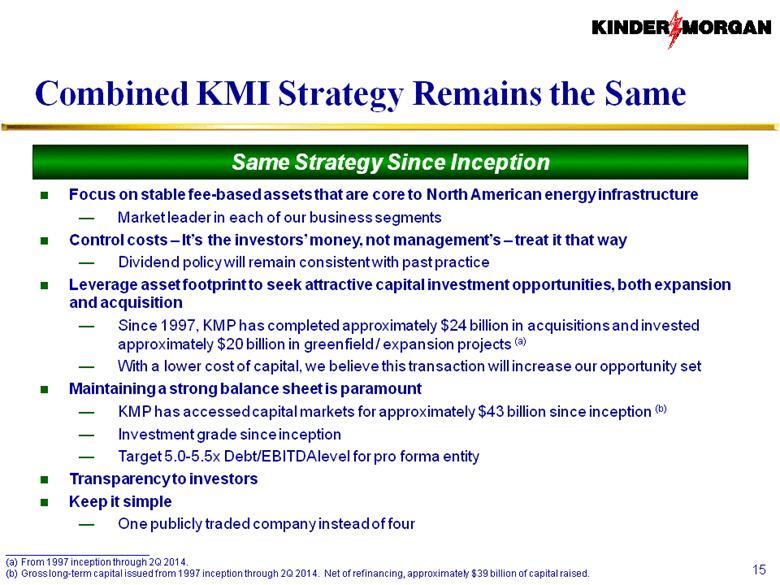
Combined KMI Strategy Remains the Same Focus on stable fee-based assets that are core to North American energy infrastructure Market leader in each of our business segments Control costs – It’s the investors’ money, not management’s – treat it that way Dividend policy will remain consistent with past practice Leverage asset footprint to seek attractive capital investment opportunities, both expansion and acquisition Since 1997, KMP has completed approximately $24 billion in acquisitions and invested approximately $20 billion in greenfield / expansion projects (a) With a lower cost of capital, we believe this transaction will increase our opportunity set Maintaining a strong balance sheet is paramount KMP has accessed capital markets for approximately $43 billion since inception (b) Investment grade since inception Target 5.0-5.5x Debt/EBITDA level for pro forma entity Transparency to investors Keep it simple One publicly traded company instead of four Same Strategy Since Inception __________________________ From 1997 inception through 2Q 2014. Gross long-term capital issued from 1997 inception through 2Q 2014. Net of refinancing, approximately $39 billion of capital raised. 15 |
|
|
Summary Transaction Timeline Expect KMI and KMR shareholder meetings and unitholder meetings for KMP and EPB in Q4 2014 Expect closing in Q4 2014 Subject to customary regulatory approvals – no regulatory delays expected 16 |
|
|
Appendix |
|
|
Cross-Guarantees Overview 18 KMI will consolidate its subsidiaries under a single C-corp as follows: Acquire public shares of KMR and public units of KMP and EPB EPB is acquired by KMP Execute cross guarantees among KMI, KMP and substantially all wholly owned operating subsidiaries and subsidiaries which hold our interest in JVs Cross-guarantees are being used instead of merging KMP or moving / refinancing existing KMP and EPB debt due to potential tax considerations, JV right of first refusals, uneconomic make-whole provisions, and rate making considerations KMI will have full control over operated assets KMP will become 100% owned with fully cross-guaranteed debt Guarantees will be among and between KMI, KMP and all significant EBITDA-generating subsidiaries Included entities represent approximately 90% of consolidated EBITDA; ~10% of consolidated EBITDA excluded primarily relates to EBITDA generated by SFPP and Calnev EPB will be acquired by KMP thereby making KMP the owner of 100% of pro forma organization cash flows Guarantees will be absolute and unconditional |
|
|
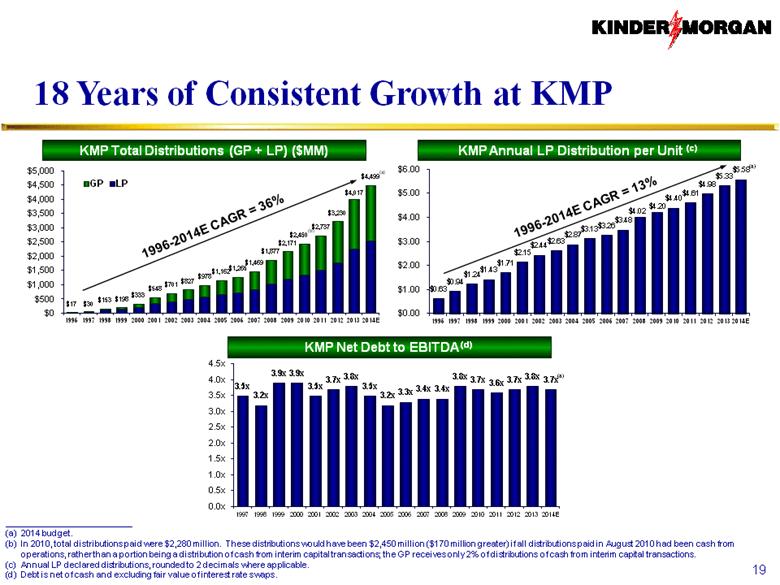
18 Years of Consistent Growth at KMP 1996-2014E CAGR = 36% KMP Total Distributions (GP + LP) ($MM) KMP Annual LP Distribution per Unit (c) KMP Net Debt to EBITDA (d) __________________________ 2014 budget. In 2010, total distributions paid were $2,280 million. These distributions would have been $2,450 million ($170 million greater) if all distributions paid in August 2010 had been cash from operations, rather than a portion being a distribution of cash from interim capital transactions; the GP receives only 2% of distributions of cash from interim capital transactions. Annual LP declared distributions, rounded to 2 decimals where applicable. Debt is net of cash and excluding fair value of interest rate swaps. 1996-2014E CAGR = 13% (b) 19 (a) (a) (a) |
|
|
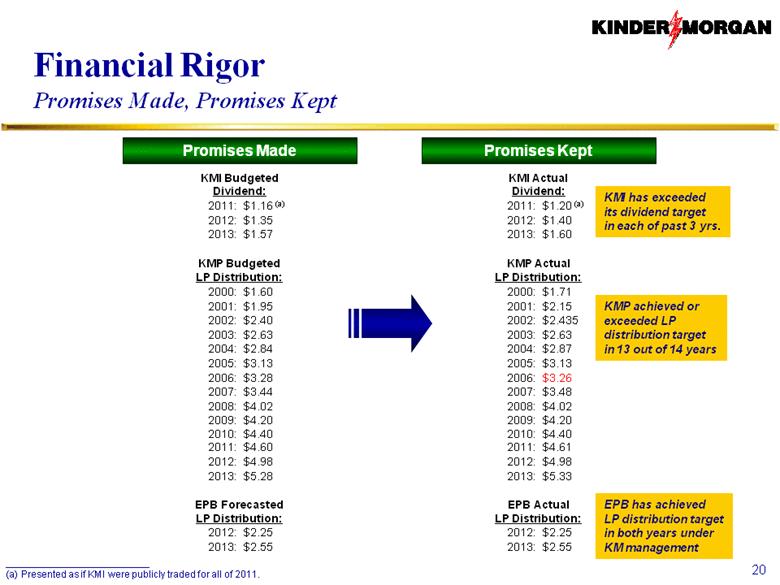
Financial Rigor Promises Made, Promises Kept KMI Budgeted Dividend: 2011: $1.16 (a) 2012: $1.35 2013: $1.57 KMP Budgeted LP Distribution: 2000: $1.60 2001: $1.95 2002: $2.40 2003: $2.63 2004: $2.84 2005: $3.13 2006: $3.28 2007: $3.44 2008: $4.02 2009: $4.20 2010: $4.40 2011: $4.60 2012: $4.98 2013: $5.28 EPB Forecasted LP Distribution: 2012: $2.25 2013: $2.55 Promises Made Promises Kept KMP achieved or exceeded LP distribution target in 13 out of 14 years __________________________ Presented as if KMI were publicly traded for all of 2011. KMI Actual Dividend: 2011: $1.20 (a) 2012: $1.40 2013: $1.60 KMP Actual LP Distribution: 2000: $1.71 2001: $2.15 2002: $2.435 2003: $2.63 2004: $2.87 2005: $3.13 2006: $3.26 2007: $3.48 2008: $4.02 2009: $4.20 2010: $4.40 2011: $4.61 2012: $4.98 2013: $5.33 EPB Actual LP Distribution: 2012: $2.25 2013: $2.55 20 KMI has exceeded its dividend target in each of past 3 yrs. EPB has achieved LP distribution target in both years under KM management |
|
|
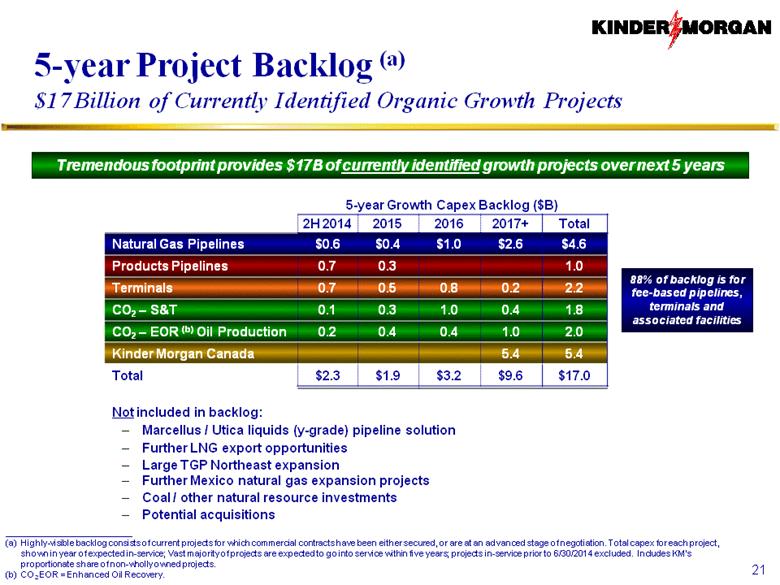
5-year Growth Capex Backlog ($B) 2H 2014 2015 2016 2017+ Total Natural Gas Pipelines $0.6 $0.4 $1.0 $2.6 $4.6 Products Pipelines 0.7 0.3 1.0 Terminals 0.7 0.5 0.8 0.2 2.2 CO2 – S&T 0.1 0.3 1.0 0.4 1.8 CO2 – EOR (b) Oil Production 0.2 0.4 0.4 1.0 2.0 Kinder Morgan Canada 5.4 5.4 Total $2.3 $1.9 $3.2 $9.6 $17.0 Not included in backlog: Marcellus / Utica liquids (y-grade) pipeline solution Further LNG export opportunities Large TGP Northeast expansion Further Mexico natural gas expansion projects Coal / other natural resource investments Potential acquisitions 5-year Project Backlog (a) $17 Billion of Currently Identified Organic Growth Projects 21 __________________________ Highly-visible backlog consists of current projects for which commercial contracts have been either secured, or are at an advanced stage of negotiation. Total capex for each project, shown in year of expected in-service; Vast majority of projects are expected to go into service within five years; projects in-service prior to 6/30/2014 excluded. Includes KM's proportionate share of non-wholly owned projects. CO2 EOR = Enhanced Oil Recovery. Tremendous footprint provides $17B of currently identified growth projects over next 5 years 88% of backlog is for fee-based pipelines, terminals and associated facilities |
|
|
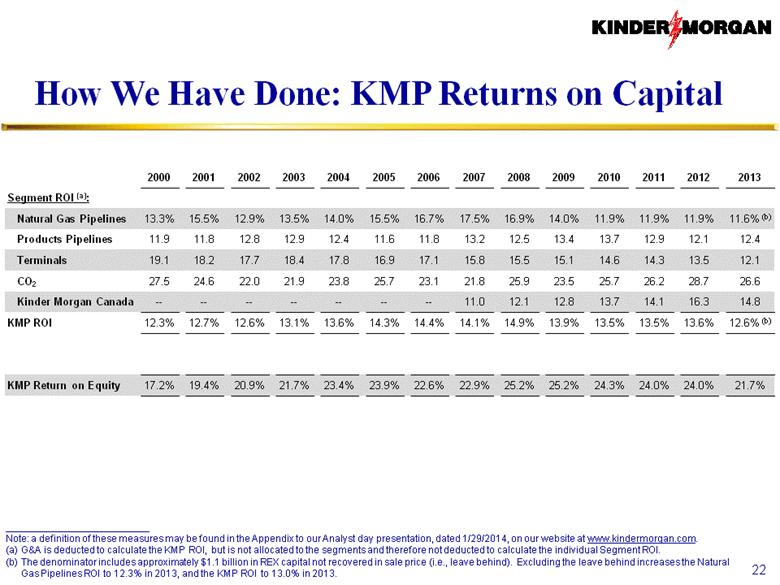
How We Have Done: KMP Returns on Capital 2000 2001 2002 2003 2004 2005 2006 2007 2008 2009 2010 2011 2012 2013 Segment ROI (a): Natural Gas Pipelines 13.3% 15.5% 12.9% 13.5% 14.0% 15.5% 16.7% 17.5% 16.9% 14.0% 11.9% 11.9% 11.9% 11.6% (b) Products Pipelines 11.9 11.8 12.8 12.9 12.4 11.6 11.8 13.2 12.5 13.4 13.7 12.9 12.1 12.4 Terminals 19.1 18.2 17.7 18.4 17.8 16.9 17.1 15.8 15.5 15.1 14.6 14.3 13.5 12.1 CO2 27.5 24.6 22.0 21.9 23.8 25.7 23.1 21.8 25.9 23.5 25.7 26.2 28.7 26.6 Kinder Morgan Canada -- -- -- -- -- -- -- 11.0 12.1 12.8 13.7 14.1 16.3 14.8 KMP ROI 12.3% 12.7% 12.6% 13.1% 13.6% 14.3% 14.4% 14.1% 14.9% 13.9% 13.5% 13.5% 13.6% 12.6% (b) KMP Return on Equity 17.2% 19.4% 20.9% 21.7% 23.4% 23.9% 22.6% 22.9% 25.2% 25.2% 24.3% 24.0% 24.0% 21.7% __________________________ Note: a definition of these measures may be found in the Appendix to our Analyst day presentation, dated 1/29/2014, on our website at www.kindermorgan.com. G&A is deducted to calculate the KMP ROI, but is not allocated to the segments and therefore not deducted to calculate the individual Segment ROI. The denominator includes approximately $1.1 billion in REX capital not recovered in sale price (i.e., leave behind). Excluding the leave behind increases the Natural Gas Pipelines ROI to 12.3% in 2013, and the KMP ROI to 13.0% in 2013. 22 |
|
|
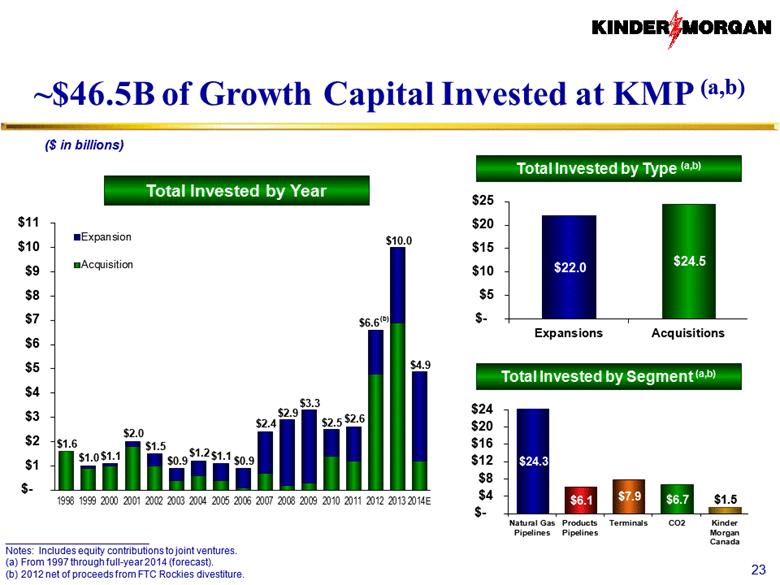
($ in billions) __________________________ Notes: Includes equity contributions to joint ventures. From 1997 through full-year 2014 (forecast). 2012 net of proceeds from FTC Rockies divestiture. Total Invested by Type (a,b) Total Invested by Segment (a,b) Total Invested by Year ~$46.5B of Growth Capital Invested at KMP (a,b) (b) 23 |
|
|
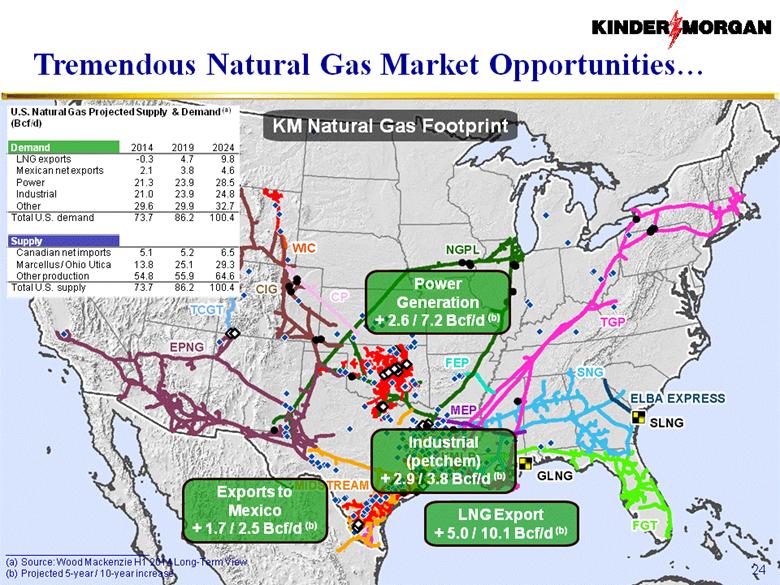
Tremendous Natural Gas Market Opportunities 24 Power Generation + 2.6 / 7.2 Bcf/d (b) Industrial (petchem) + 2.9 / 3.8 Bcf/d (b) LNG Export + 5.0 / 10.1 Bcf/d (b) Exports to Mexico + 1.7 / 2.5 Bcf/d (b) KM Natural Gas Footprint __________________________ Source: Wood Mackenzie H1 2014 Long-Term View. Projected 5-year / 10-year increase. |
|
|
Generating Real-time, Long-term Benefits Kinder Morgan’s unparalleled natural gas footprint is well-positioned to address North America’s need for more infrastructure Natural gas comprises significant percentage of our cash flow: KMP ~43%, EPB 100%, KMI ~54% (c) Own or operate ~68,000 miles of natural gas pipeline, and moved ~33 Bcf/d out of a total U.S. market of ~100 in January 2014 Well-positioned relative to major trends (Marcellus / Utica, exports to Mexico, LNG export, power generation, petchem, etc.) Natural gas a significant, growing component of backlog $4.6 billion of natural gas projects in backlog, $1.9 billion net increase from $2.7 billion at year-end 2013 Natural gas backlog substantially backed by long-term, take-or-pay contracts Attractive returns secured for natural gas backlog; average EBITDA multiple approximately 5x $18 billion of additional identified projects in development Significant recent demand for long-term natural gas capacity across all KM entities Since December 2013, 3.7 Bcf/d of new take-or-pay contracts secured at attractive rates Represents 11% of the total existing design capacity of the underlying pipelines Very long-term commitments with an average contract tenor of 16 years New capacity demand represents $1.8 billion of growth capital investment 1.1 Bcf/d in-service in 2014, 1.0 Bcf/d in 2015 and 1.6 Bcf/d thereafter When pending contracts are included, the total since December 2013 increases to 5.3 Bcf/d 25 $641B of investment in midstream energy infrastructure needed through 2035, implying $29B per year annual spend (a) compared to $18B annual spend by MLPs (b) over past five years __________________________ Source: ICF presentation dated 2/24/2014 “A Shifting Landscape: Shale Resource Development Presenting Plenty of Opportunities and Challenges in the Midstream Space.” 2009-2013E capital spend on investment projects by MLPs. Source: Wells Fargo as of 12/31/2013. Natural Gas Segment percentage of 2014 budgeted segment earnings before DD&A including proportionate share of JV DD&A and excluding certain items for KMP, EPB and KMI, respectively. |
|
|
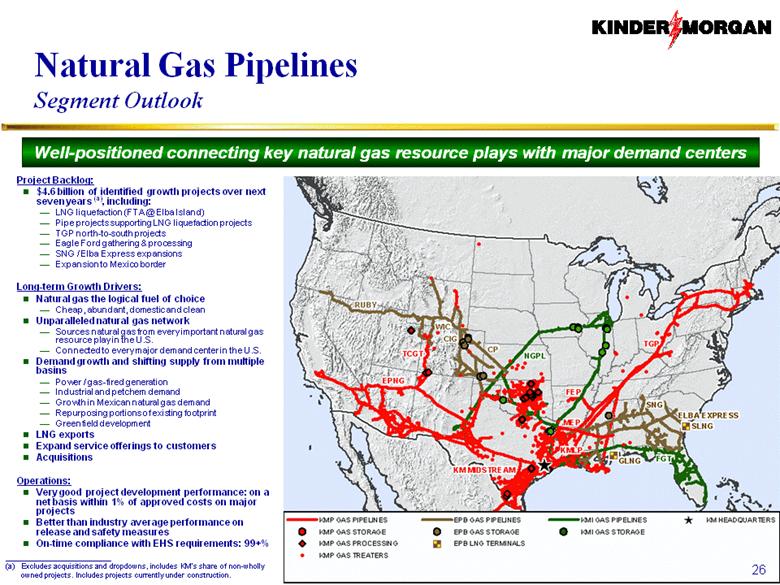
Natural Gas Pipelines Segment Outlook 26 Well-positioned connecting key natural gas resource plays with major demand centers __________________________ Excludes acquisitions and dropdowns, includes KM's share of non-wholly owned projects. Includes projects currently under construction. Project Backlog: $4.6 billion of identified growth projects over next seven years (a), including: LNG liquefaction (FTA @ Elba Island) Pipe projects supporting LNG liquefaction projects TGP north-to-south projects Eagle Ford gathering & processing SNG / Elba Express expansions Expansion to Mexico border Long-term Growth Drivers: Natural gas the logical fuel of choice Cheap, abundant, domestic and clean Unparalleled natural gas network Sources natural gas from every important natural gas resource play in the U.S. Connected to every major demand center in the U.S. Demand growth and shifting supply from multiple basins Power / gas-fired generation Industrial and petchem demand Growth in Mexican natural gas demand Repurposing portions of existing footprint Greenfield development LNG exports Expand service offerings to customers Acquisitions Operations: Very good project development performance: on a net basis within 1% of approved costs on major projects Better than industry average performance on release and safety measures On-time compliance with EHS requirements: 99+% |
|
|
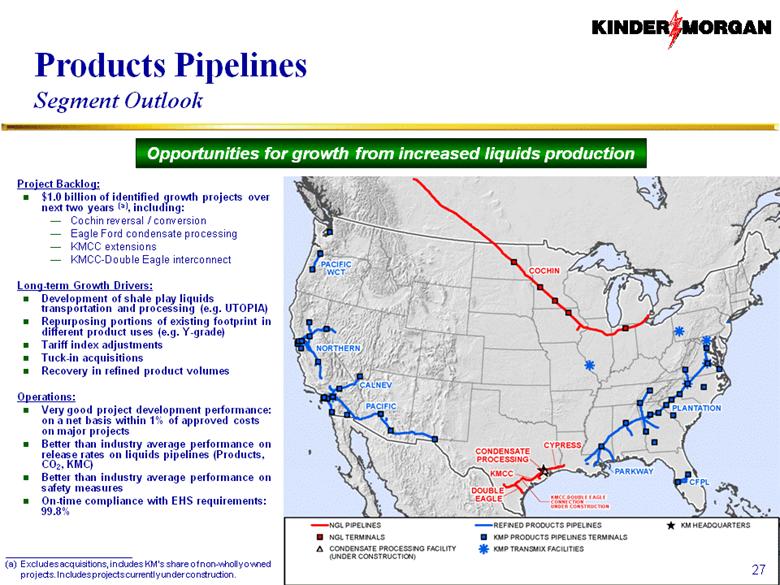
Products Pipelines Segment Outlook Project Backlog: $1.0 billion of identified growth projects over next two years (a), including: Cochin reversal / conversion Eagle Ford condensate processing KMCC extensions KMCC-Double Eagle interconnect Long-term Growth Drivers: Development of shale play liquids transportation and processing (e.g. UTOPIA) Repurposing portions of existing footprint in different product uses (e.g. Y-grade) Tariff index adjustments Tuck-in acquisitions Recovery in refined product volumes Operations: Very good project development performance: on a net basis within 1% of approved costs on major projects Better than industry average performance on release rates on liquids pipelines (Products, CO2, KMC) Better than industry average performance on safety measures On-time compliance with EHS requirements: 99.8% 27 __________________________ Excludes acquisitions, includes KM's share of non-wholly owned projects. Includes projects currently under construction. Opportunities for growth from increased liquids production |
|
|
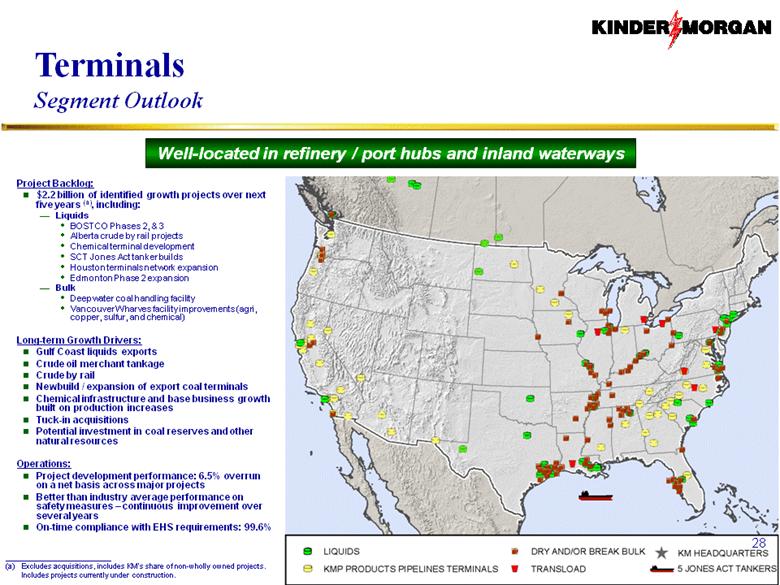
Terminals Segment Outlook Well-located in refinery / port hubs and inland waterways 28 __________________________ Excludes acquisitions, includes KM's share of non-wholly owned projects. Includes projects currently under construction. Project Backlog: $2.2 billion of identified growth projects over next five years (a), including: Liquids BOSTCO Phases 2, & 3 Alberta crude by rail projects Chemical terminal development SCT Jones Act tanker builds Houston terminals network expansion Edmonton Phase 2 expansion Bulk Deepwater coal handling facility Vancouver Wharves facility improvements (agri, copper, sulfur, and chemical) Long-term Growth Drivers: Gulf Coast liquids exports Crude oil merchant tankage Crude by rail Newbuild / expansion of export coal terminals Chemical infrastructure and base business growth built on production increases Tuck-in acquisitions Potential investment in coal reserves and other natural resources Operations: Project development performance: 6.5% overrun on a net basis across major projects Better than industry average performance on safety measures – continuous improvement over several years On-time compliance with EHS requirements: 99.6% |
|
|
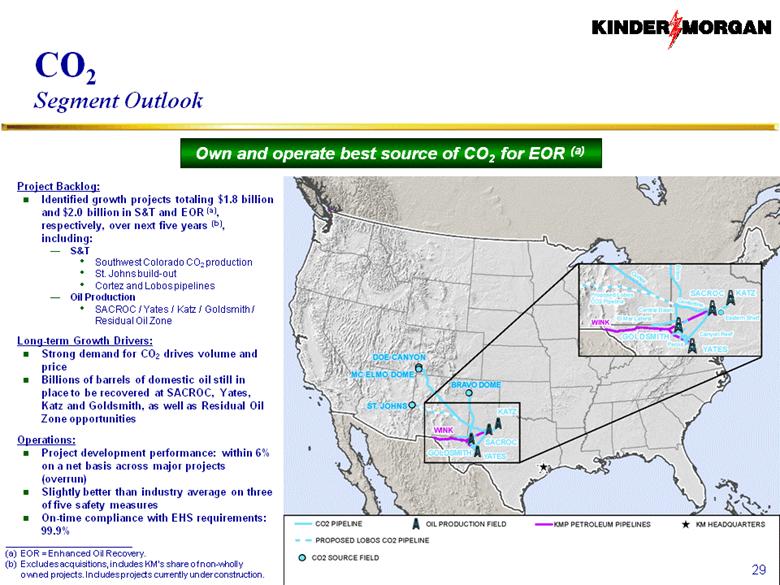
CO2 Segment Outlook Own and operate best source of CO2 for EOR (a) 29 __________________________ EOR = Enhanced Oil Recovery. Excludes acquisitions, includes KM's share of non-wholly owned projects. Includes projects currently under construction. Project Backlog: Identified growth projects totaling $1.8 billion and $2.0 billion in S&T and EOR (a), respectively, over next five years (b), including: S&T Southwest Colorado CO2 production St. Johns build-out Cortez and Lobos pipelines Oil Production SACROC / Yates / Katz / Goldsmith / Residual Oil Zone Long-term Growth Drivers: Strong demand for CO2 drives volume and price Billions of barrels of domestic oil still in place to be recovered at SACROC, Yates, Katz and Goldsmith, as well as Residual Oil Zone opportunities Operations: Project development performance: within 6% on a net basis across major projects (overrun) Slightly better than industry average on three of five safety measures On-time compliance with EHS requirements: 99.9% |
|
|
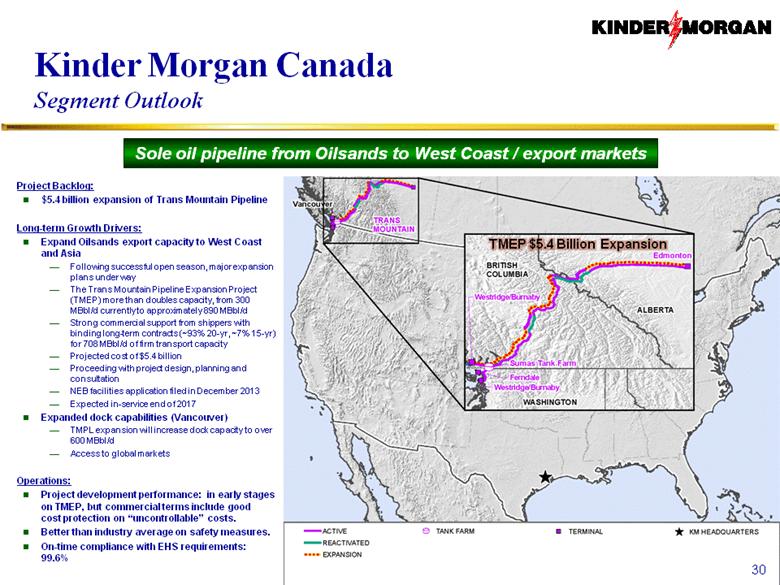
Kinder Morgan Canada Segment Outlook Sole oil pipeline from Oilsands to West Coast / export markets 30 Project Backlog: $5.4 billion expansion of Trans Mountain Pipeline Long-term Growth Drivers: Expand Oilsands export capacity to West Coast and Asia Following successful open season, major expansion plans under way The Trans Mountain Pipeline Expansion Project (TMEP) more than doubles capacity, from 300 MBbl/d currently to approximately 890 MBbl/d Strong commercial support from shippers with binding long-term contracts (~93% 20-yr, ~7% 15-yr) for 708 MBbl/d of firm transport capacity Projected cost of $5.4 billion Proceeding with project design, planning and consultation NEB facilities application filed in December 2013 Expected in-service end of 2017 Expanded dock capabilities (Vancouver) TMPL expansion will increase dock capacity to over 600 MBbl/d Access to global markets Operations: Project development performance: in early stages on TMEP, but commercial terms include good cost protection on “uncontrollable” costs. Better than industry average on safety measures. On-time compliance with EHS requirements: 99.6% |
|
|
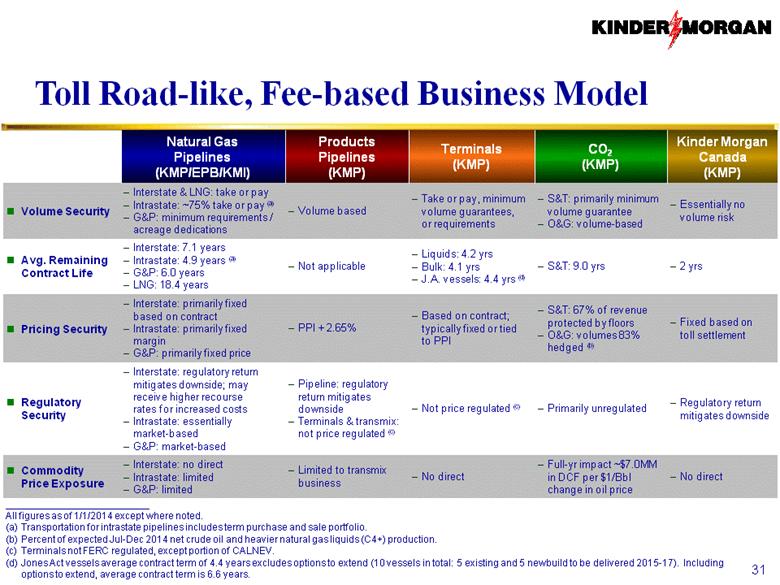
Toll Road-like, Fee-based Business Model Natural Gas Pipelines (KMP/EPB/KMI) Products Pipelines (KMP) Terminals (KMP) CO2 (KMP) Kinder Morgan Canada (KMP) Volume Security Interstate & LNG: take or pay Intrastate: ~75% take or pay (a) G&P: minimum requirements / acreage dedications Volume based Take or pay, minimum volume guarantees, or requirements S&T: primarily minimum volume guarantee O&G: volume-based Essentially no volume risk Avg. Remaining Contract Life Interstate: 7.1 years Intrastate: 4.9 years (a) G&P: 6.0 years LNG: 18.4 years Not applicable Liquids: 4.2 yrs Bulk: 4.1 yrs J.A. vessels: 4.4 yrs (d) S&T: 9.0 yrs 2 yrs Pricing Security Interstate: primarily fixed based on contract Intrastate: primarily fixed margin G&P: primarily fixed price PPI + 2.65% Based on contract; typically fixed or tied to PPI S&T: 67% of revenue protected by floors O&G: volumes 83% hedged (b) Fixed based on toll settlement Regulatory Security Interstate: regulatory return mitigates downside; may receive higher recourse rates for increased costs Intrastate: essentially market-based G&P: market-based Pipeline: regulatory return mitigates downside Terminals & transmix: not price regulated (c) Not price regulated (c) Primarily unregulated Regulatory return mitigates downside Commodity Price Exposure Interstate: no direct Intrastate: limited G&P: limited Limited to transmix business No direct Full-yr impact ~$7.0MM in DCF per $1/Bbl change in oil price No direct __________________________ All figures as of 1/1/2014 except where noted. Transportation for intrastate pipelines includes term purchase and sale portfolio. Percent of expected Jul-Dec 2014 net crude oil and heavier natural gas liquids (C4+) production. Terminals not FERC regulated, except portion of CALNEV. Jones Act vessels average contract term of 4.4 years excludes options to extend (10 vessels in total: 5 existing and 5 newbuild to be delivered 2015-17). Including options to extend, average contract term is 6.6 years. 31 |
|
|
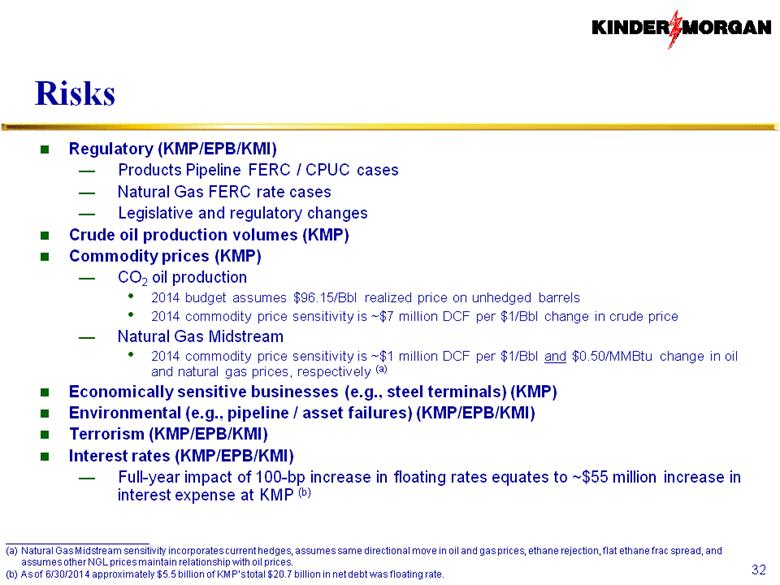
Risks 32 __________________________ Natural Gas Midstream sensitivity incorporates current hedges, assumes same directional move in oil and gas prices, ethane rejection, flat ethane frac spread, and assumes other NGL prices maintain relationship with oil prices. As of 6/30/2014 approximately $5.5 billion of KMP’s total $20.7 billion in net debt was floating rate. |
|
|
KINDER MORGAN |