Attached files
| file | filename |
|---|---|
| 8-K - HOOPER HOLMES, INC. 8-K - HOOPER HOLMES INC | a50923018.htm |
| EX-99.1 - EXHIBIT 99.1 - HOOPER HOLMES INC | a50923018ex99_1.htm |
Exhibit 99.2
Hooper Holmes, Inc. August 12, 2014 Earnings Presentation Speakers: Henry Dubois, Chief Executive Officer Tom Collins, Chief Financial Officer
2 Safe Harbor Statement The presentation contains forward-looking statements concerning plans, objectives, goals, strategies, future events or performances, which are not statements of historical fact. The forward-looking statements contained in this release reflect our current beliefs and expectations. Actual results or performance may differ materially from what is expressed in the forward-looking statements. You are referred to the documents filed by us with the SEC, specifically reports on Form 10-K and Form 10- Q including risk factors that could cause actual results to differ from forward-looking statements. These reports are available at www.sec.gov. This presentation should be used in conjunction with the earnings call dated August 12, 2014. This presentation contains information from third-party sources, including data from studies conducted by others and market data and industry forecasts obtained from industry publication. Although Hooper Holmes, Inc. believes that such information is reliable, Hooper Holmes, Inc. has not independently verified any of this information and Hooper Holmes, Inc. does not guarantee the accuracy or completeness of this information.
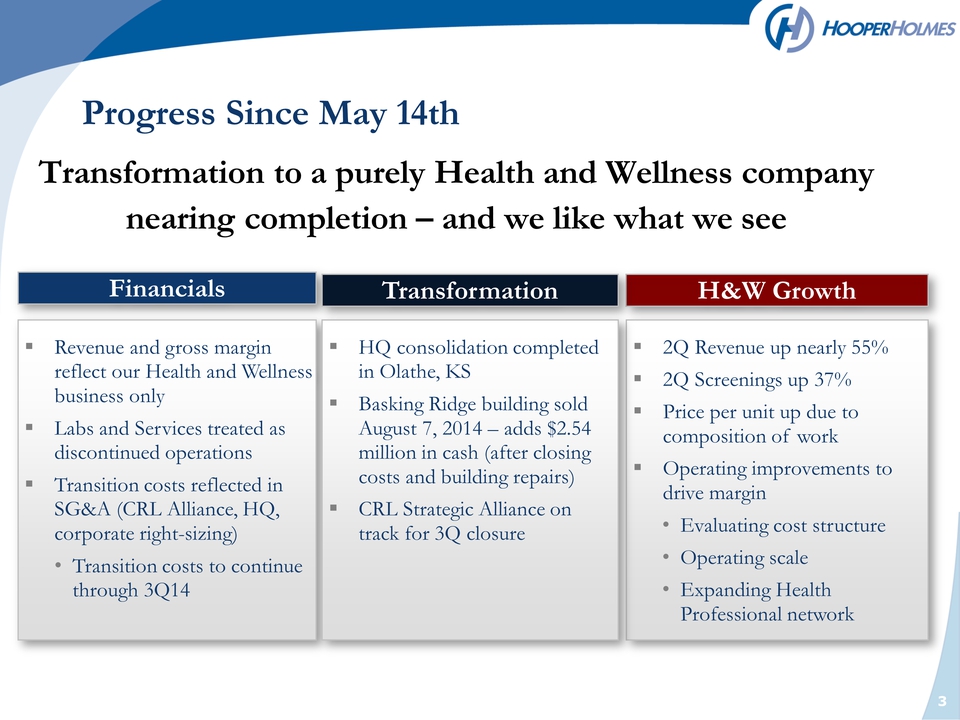
Progress Since May 14th Financials Revenue and gross margin reflect our Health and Wellness business only Labs and Services treated as discontinued operations Transition costs reflected in SG&A (CRL Alliance, HQ, corporate right-sizing) • Transition costs to continue through 3Q14 H&W Growth 2Q Revenue up nearly 55% 2Q Screenings up 37% Price per unit up due to composition of work Operating improvements to drive margin• Evaluating cost structure• Operating scale• Expanding HealthProfessional network HQ consolidation completed in Olathe, KS Basking Ridge building sold August 7, 2014 – adds $2.54 million in cash (after closing costs and building repairs) CRL Strategic Alliance on track for 3Q closure Transformation Transformation to a purely Health and Wellness company nearing completion – and we like what we see 3
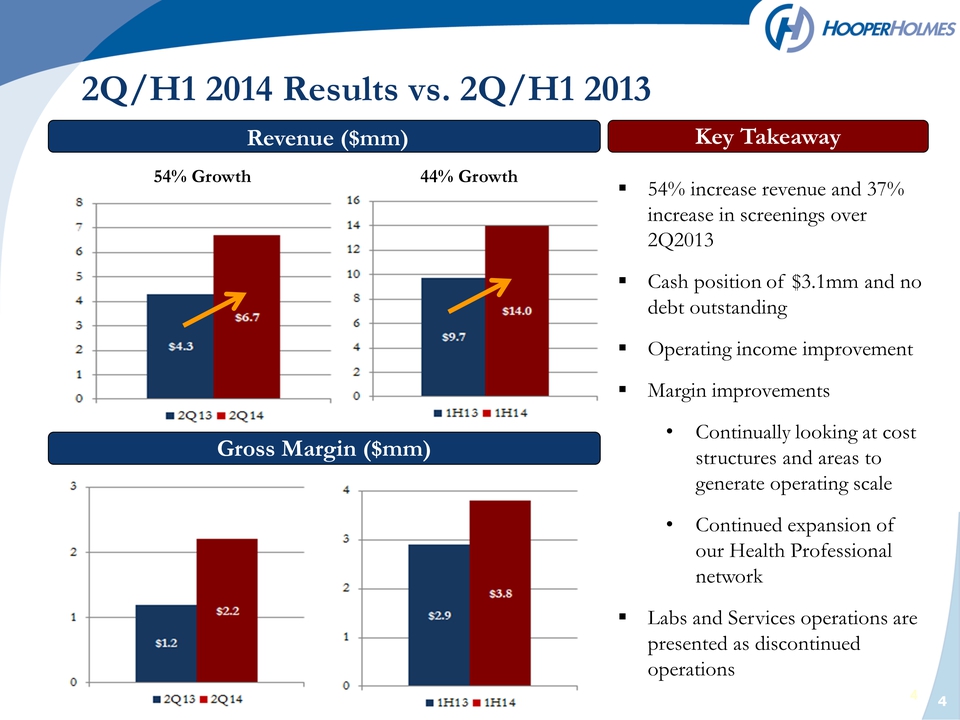
4 Revenue ($mm) Gross Margin ($mm) Key Takeaway 54% increase revenue and 37% increase in screenings over 2Q2013 Cash position of $3.1mm and no debt outstanding Operating income improvement Margin improvements• Continually looking at cost structures and areas to generate operating scale• Continued expansion of our Health Professional network Labs and Services operations are presented as discontinued operations 2Q/H1 2014 Results vs. 2Q/H1 2013 54% Growth 44% Growth
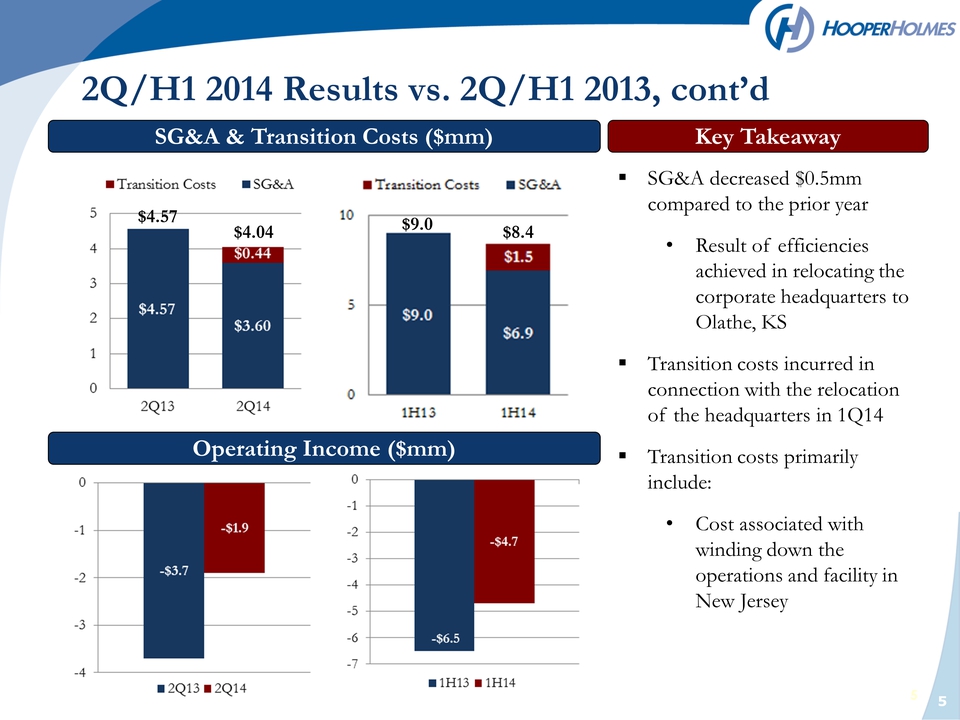
5 5 SG&A & Transition Costs ($mm) Operating Income ($mm) Key Takeaway 2Q/H1 2014 Results vs. 2Q/H1 2013, cont’d SG&A decreased $0.5mm compared to the prior year• Result of efficiencies achieved in relocating the corporate headquarters to Olathe, KS Transition costs incurred in connection with the relocation of the headquarters in 1Q14 Transition costs primarily include:• Cost associated with winding down the operations and facility in New Jersey $4.57 $4.04 $8.4 $9.0
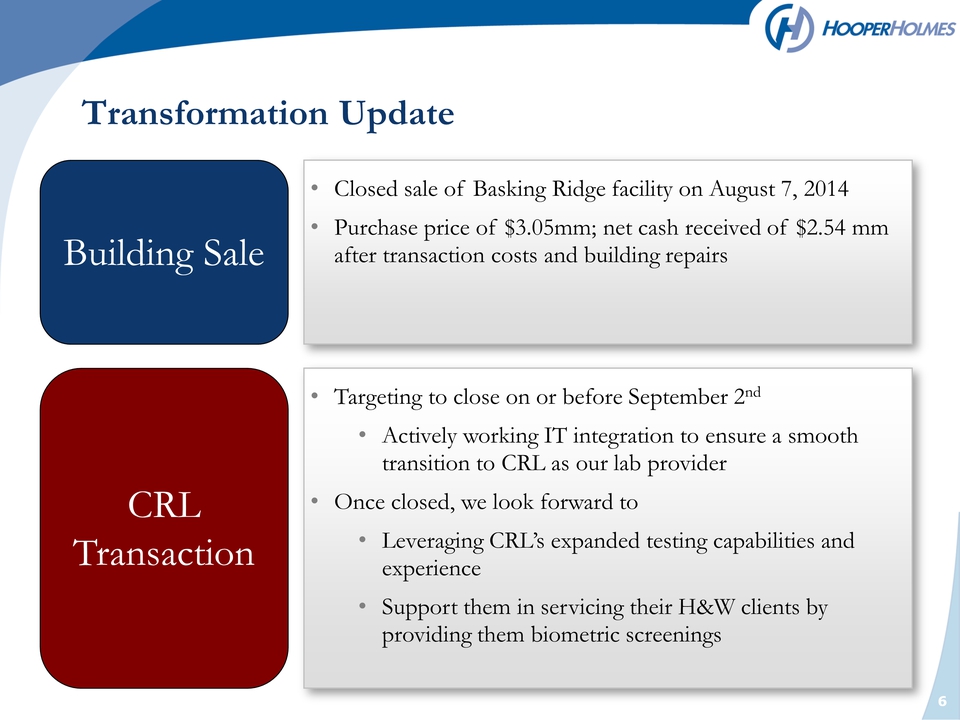
6 Transformation Update• Closed sale of Basking Ridge facility on August 7, 2014• Purchase price of $3.05mm; net cash received of $2.54 mm after transaction costs and building repairs Building Sale• Targeting to close on or before September 2nd• Actively working IT integration to ensure a smooth transition to CRL as our lab provider• Once closed, we look forward to• Leveraging CRL’s expanded testing capabilities and experience• Support them in servicing their H&W clients by providing them biometric screenings CRL Transaction
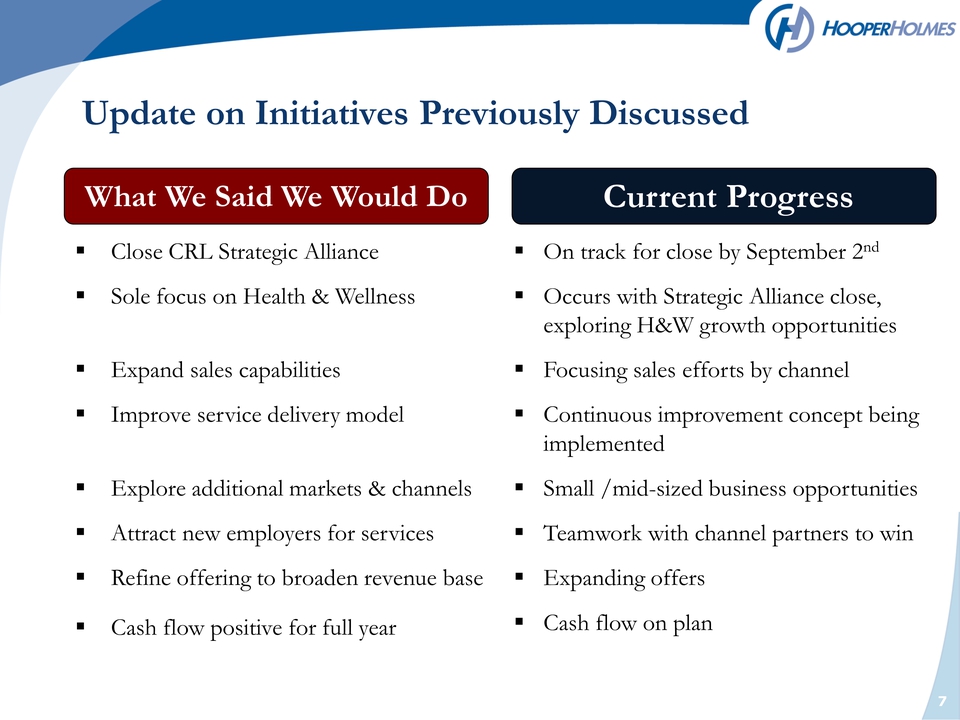
7 Update on Initiatives Previously Discussed On track for close by September 2nd Occurs with Strategic Alliance close, exploring H&W growth opportunities Focusing sales efforts by channel Continuous improvement concept being implemented Small /mid-sized business opportunities Teamwork with channel partners to win Expanding offers Cash flow on planCurrent Progress What We Said We Would Do Close CRL Strategic Alliance Sole focus on Health & Wellness Expand sales capabilities Improve service delivery model Explore additional markets & channels Attract new employers for services Refine offering to broaden revenue base Cash flow positive for full year
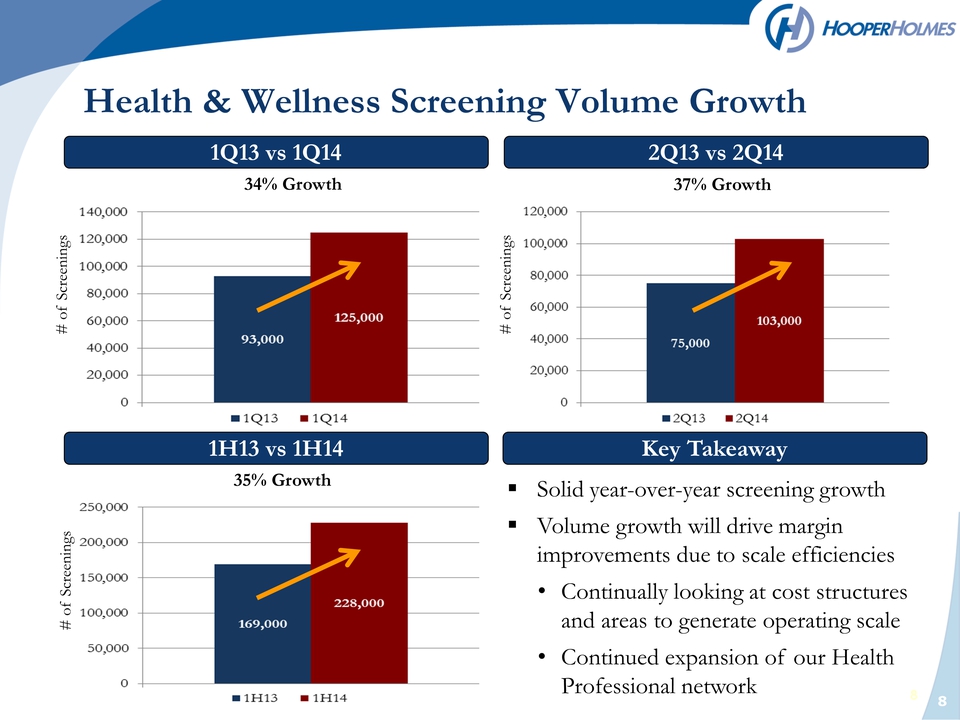
8 8 1Q13 vs 1Q14 1H13 vs 1H14 2Q13 vs 2Q14 Solid year-over-year screening growth Volume growth will drive margin improvements due to scale efficiencies• Continually looking at cost structures and areas to generate operating scale• Continued expansion of our Health Professional network Key Takeaway Health & Wellness Screening Volume Growth 37% Growth 34% Growth 35% Growth # of Screenings # of Screenings # of Screenings
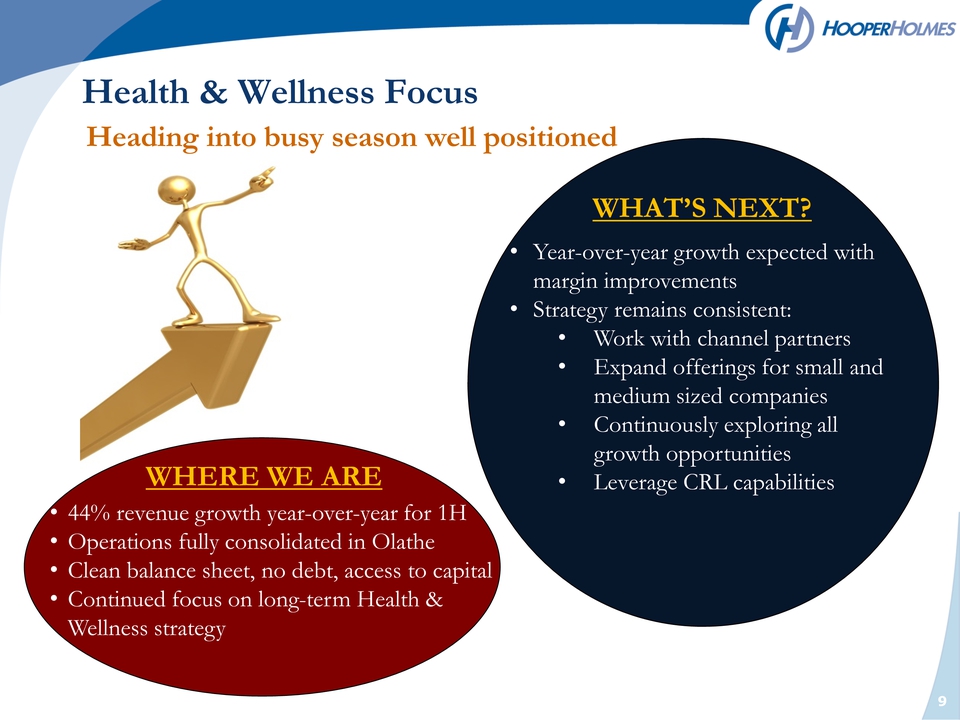
9 Health & Wellness Focus WHERE WE ARE• 44% revenue growth year-over-year for 1H• Operations fully consolidated in Olathe• Clean balance sheet, no debt, access to capital• Continued focus on long-term Health & Wellness strategy • Year-over-year growth expected with margin improvements• Strategy remains consistent:• Work with channel partners• Expand offerings for small and medium sized companies• Continuously exploring all growth opportunities• Leverage CRL capabilitiesWHAT’S NEXT?Heading into busy season well positioned
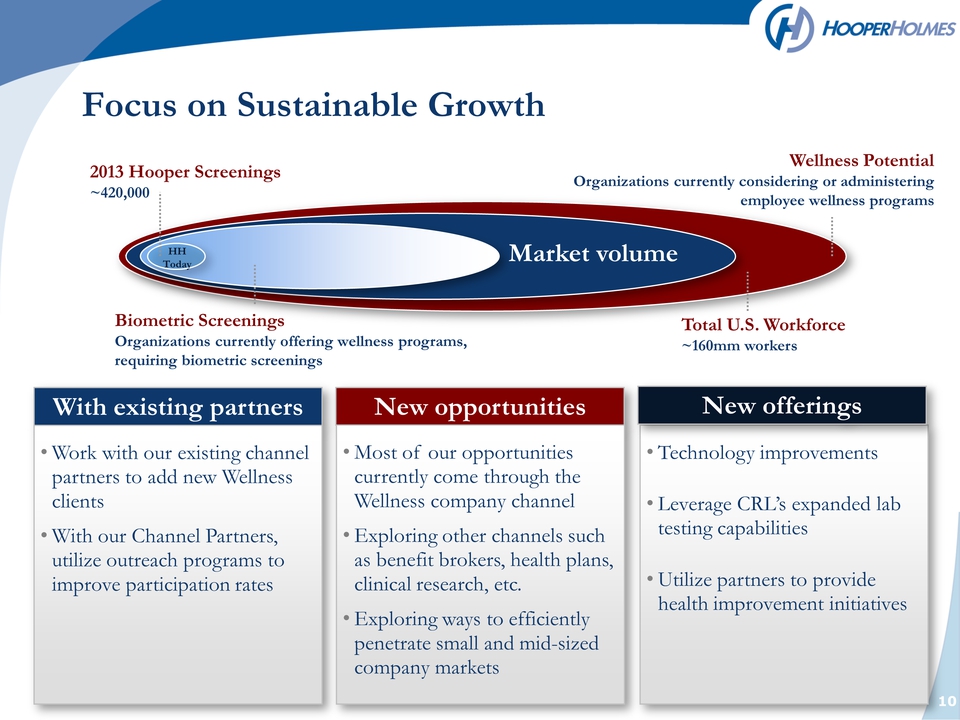
10 Focus on Sustainable Growth With existing partners New opportunities•Work with our existing channel partners to add new Wellness clients • With our Channel Partners, utilize outreach programs to improve participation rates • Most of our opportunities currently come through the Wellness company channel • Exploring other channels such as benefit brokers, health plans, clinical research, etc. • Exploring ways to efficiently penetrate small and mid-sized company markets • Technology improvements • Leverage CRL’s expanded lab testing capabilities • Utilize partners to provide health improvement initiatives New offerings HH Today Market volume Biometric Screenings Organizations currently offering wellness programs, requiring biometric screenings 2013 Hooper Screenings 420,000 Wellness Potential Organizations currently considering or administering employee wellness programs Total U.S. Workforce 160mm workers