Attached files
UNITED STATES
SECURITIES AND EXCHANGE COMMISSION
Washington, D.C. 20549
FORM 10-Q
x QUARTERLY REPORT UNDER SECTION 13 OR 15(d) OF THE SECURITIES EXCHANGE ACT OF 1934
For the quarterly period ended June 30, 2014
o TRANSITION REPORT UNDER SECTION 13 OR 15 (d) OF THE EXCHANGE ACT
For the transition period from _________ to _________
000-54416
(Commission File Number)
EMC METALS CORP.
(Exact name of registrant as specified in its charter)
| British Columbia, Canada | 98-1009717 | |
|
(State or other jurisdiction
of incorporation or organization)
|
(IRS Employer
Identification No.)
|
1430 Greg Street, Suite 501, Sparks, Nevada 89431
(Address of principal executive offices) (Zip Code)
(775) 355-9500
(Registrant’s telephone number, including area code)
N/A
(Former name, former address and former fiscal year, if changed since last report)
Indicate by check mark whether the registrant (1) filed all reports required to be filed by sections 13 or 15(d) of the Securities and Exchange Act of 1934 during the preceding 12 months (or for such shorter period that the registrant was required to file such reports), and (2) has been subject to such filing requirements for the past 90 days. Yes x No o
Indicate by check mark whether the registrant has submitted electronically and posted on its corporate Web site, if any, every Interactive Data File required to be submitted and posted pursuant to Rule 405 of Regulation S-T (§232.405 of this chapter) during the preceding 12 months (or for such shorter period that the registrant was required to submit and post such files). Yes x No o
Indicate by check mark whether the registrant is a large accelerated filer, an accelerated filer, a non-accelerated filer, or a smaller reporting company.
| Large accelerated filer | o | Accelerated filer | o |
| Non-accelerated filed | o | Smaller reporting company | x |
Indicate by check mark whether the registrant is a shell company, as defined in Rule 12b-2 of the Exchange Act. Yes o No x
Indicate the number of shares outstanding of each of the registrant’s classes of common stock, as of the latest practicable date: As of August 6, 2014, the registrant’s outstanding common stock consisted of 193,070,379 shares.
PART I. FINANCIAL INFORMATION
Item 1. Financial Statements
(An Exploration Stage Company)
UNAUDITED CONDENSED CONSOLIDATED FINANCIAL STATEMENTS
SIX MONTHS AND QUARTER ENDED JUNE 30, 2014
2
|
EMC Metals Corp.
|
||||
|
(An Exploration Stage Company)
|
||||
|
CONDENSED CONSOLIDATED BALANCE SHEETS
|
||||
|
(Expressed in US Dollars) (Unaudited)
|
||||
|
As at:
|
June 30, 2014
|
December 31, 2013
|
||||||
|
ASSETS
|
||||||||
|
Current
|
||||||||
|
Cash
|
$ | 780,711 | $ | 785,075 | ||||
|
Prepaid expenses and receivables
|
23,460 | 127,410 | ||||||
|
Subscription receivable (Note 10)
|
234,175 | - | ||||||
|
Total Current Assets
|
1,038,346 | 912,485 | ||||||
|
Restricted cash (Note 3)
|
- | 149,868 | ||||||
|
Property, plant and equipment (Note 5)
|
8,361 | 10,278 | ||||||
|
Mineral interests (Note 6)
|
2,977,234 | 1,613,203 | ||||||
|
Total Assets
|
$ | 4,023,941 | $ | 2,685,834 | ||||
|
LIABILITIES AND STOCKHOLDERS’ EQUITY
|
||||||||
|
Current
|
||||||||
|
Accounts payable and accrued liabilities
|
$ | 348,937 | $ | 247,613 | ||||
|
Convertible debentures (Note 7)
|
- | 650,000 | ||||||
|
Promissory notes payable (Note 8)
|
2,500,000 | 1,204,875 | ||||||
|
Total Liabilities
|
2,848,937 | 2,102,488 | ||||||
|
Stockholders’ Equity
|
||||||||
|
Capital stock (Note 10) (Authorized: Unlimited number of shares; Issued and outstanding: 188,429,143 (2013 – 165,358,337))
|
88,394,298 | 87,310,708 | ||||||
|
Treasury stock (Note 11)
|
(1,264,194 | ) | (1,264,194 | ) | ||||
|
Additional paid in capital (Note 10)
|
2,109,493 | 2,108,327 | ||||||
|
Accumulated other comprehensive loss
|
(853,400 | ) | (853,400 | ) | ||||
|
Deficit accumulated during the exploration stage
|
(87,211,193 | ) | (86,718,095 | ) | ||||
|
Total Stockholders’ Equity
|
1,175,004 | 583,346 | ||||||
|
Total Liabilities and Stockholders’ Equity
|
$ | 4,023,941 | $ | 2,685,834 | ||||
Nature and continuance of operations (Note 1)
Subsequent events (Note 14)
The accompanying notes are an integral part of these condensed consolidated financial statements.
3
|
EMC Metals Corp.
|
|
(An Exploration Stage Company)
|
|
CONDENSED CONSOLIDATED STATEMENTS OF OPERATIONS AND COMPREHENSIVE LOSS
|
|
(Expressed in US Dollars) (Unaudited)
|
|
Cumulative amounts from incorporation on July 17, 2006 to June 30, 2014
|
Quarter ended June 30, 2014
|
Quarter ended June 30, 2013
|
Six Months ended June 30, 2014
|
Six Months ended June 30, 2013
|
||||||||||||||||
|
EXPENSES
|
||||||||||||||||||||
|
Amortization (Note 5)
|
$ | 2,150,714 | $ | 959 | $ | 1,074 | $ | 1,917 | $ | 2,149 | ||||||||||
|
Consulting
|
2,269,734 | 8,500 | 41,865 | 8,500 | 77,153 | |||||||||||||||
|
Exploration
|
15,127,312 | 635 | 2,044 | 53,391 | 309,115 | |||||||||||||||
|
General and administrative
|
7,344,025 | 39,788 | 44,978 | 87,110 | 120,225 | |||||||||||||||
|
Insurance
|
950,824 | (241 | ) | 7,593 | 6,448 | 15,015 | ||||||||||||||
|
Professional fees
|
3,278,246 | 62,691 | 32,020 | 83,813 | 78,942 | |||||||||||||||
|
Research and development
|
3,042,091 | - | - | - | - | |||||||||||||||
|
Salaries and benefits
|
7,567,767 | 89,475 | 137,347 | 186,769 | 280,349 | |||||||||||||||
|
Stock-based compensation (Note 10)
|
5,416,151 | - | 43,165 | 1,166 | 64,197 | |||||||||||||||
|
Travel and entertainment
|
1,631,765 | 5,176 | 4,872 | 12,442 | 13,718 | |||||||||||||||
|
Loss from continuing operations before other items
|
(48,778,629 | ) | (206,983 | ) | (314,958 | ) | (441,556 | ) | (960,863 | ) | ||||||||||
|
OTHER ITEMS
|
||||||||||||||||||||
|
Foreign exchange gain
|
363,136 | 11,355 | 38,099 | 4,124 | 27,783 | |||||||||||||||
|
Gain on transfer of marketable securities
|
181,238 | - | - | - | - | |||||||||||||||
|
Gain on settlement of convertible debentures
|
1,268,246 | - | - | - | - | |||||||||||||||
|
Gain on sale of marketable securities
|
1,720,016 | - | - | - | - | |||||||||||||||
|
Write-off of mineral interests and property, plant and equipment
|
(16,015,169 | ) | - | - | - | - | ||||||||||||||
|
Write-off of land and water rights
|
(2,800,000 | ) | - | - | - | - | ||||||||||||||
|
Gain on insurance proceeds
|
912,534 | - | - | - | - | |||||||||||||||
|
Interest expense
|
(873,640 | ) | (25,666 | ) | (156,427 | ) | (55,666 | ) | (302,706 | ) | ||||||||||
|
Other income
|
466,463 | - | - | - | - | |||||||||||||||
|
Gain on disposition of assets
|
933,075 | - | - | - | - | |||||||||||||||
|
Change in fair value of derivative liability
|
453,790 | - | - | - | - | |||||||||||||||
|
Unrealized loss on marketable securities
|
(3,070,425 | ) | - | - | - | - | ||||||||||||||
| (16,460,736 | ) | (14,311 | ) | (118,328 | ) | (51,542 | ) | (274,923 | ) | |||||||||||
|
Loss from continuing operations before income taxes
|
(65,239,365 | ) | (221,294 | ) | (433,286 | ) | (493,098 | ) | (1,235,786 | ) | ||||||||||
|
Deferred income tax recovery
|
6,020,527 | - | - | - | - | |||||||||||||||
|
Loss from continuing operations for the period
|
(59,218,838 | ) | (221,294 | ) | (433,286 | ) | (493,098 | ) | (1,235,786 | ) | ||||||||||
| Loss from discontinued operations (Note 4) | (25,501,664 | ) | - | (88,609 | ) | - | (196,397 | ) | ||||||||||||
| Loss for the period | (84,720,502 | ) | (221,294 | ) | (521,895 | ) | (493,098 | ) | (1,432,183 | ) | ||||||||||
|
Foreign currency translation adjustment
|
(2,844,668 | ) | - | - | - | - | ||||||||||||||
|
Comprehensive loss for the period
|
$ | (87,565,170 | ) | $ | (221,294 | ) | $ | (521,895 | ) | $ | (493,098 | ) | $ | (1,432,183 | ) | |||||
|
Basic and diluted loss per common share
|
||||||||||||||||||||
| Loss from continuing operations | $ | (0.00 | ) | $ | (0.00 | ) | $ | (0.00 | ) | $ | (0.01 | ) | ||||||||
| Loss from discontinued operations | $ | (0.00 | ) | $ | (0.00 | ) | $ | (0.00 | ) | $ | (0.00 | ) | ||||||||
|
Weighted average number of common shares outstanding
|
177,640,929 | 165,358,337 | 171,690,544 | 165,358,337 | ||||||||||||||||
The accompanying notes are an integral part of these condensed consolidated financial statements.
4
|
EMC Metals Corp.
|
||||
|
(An Exploration Stage Company)
|
||||
|
CONDENSED CONSOLIDATED STATEMENTS OF CASH FLOWS
|
||||
|
(Expressed in US Dollars) (Unaudited)
|
||||
|
Cumulative amounts from incorporation on July 17, 2006 to June 30, 2014
|
Six month period ended June 30, 2014
|
Six month period ended June 30, 2013
|
||||||||||
|
CASH FLOWS FROM OPERATING ACTIVITIES
|
||||||||||||
|
Loss for the period
|
$ | (84,720,502 | ) | $ | (493,098 | ) | $ | (1,432,183 | ) | |||
|
Items not affecting cash:
|
||||||||||||
|
Amortization
|
2,361,260 | 1,917 | 11,854 | |||||||||
|
Research and development
|
3,042,091 | - | - | |||||||||
|
Consulting paid with common shares
|
9,379 | - | - | |||||||||
|
Gain on disposal of assets
|
(933,075 | ) | - | - | ||||||||
|
Convertible debenture costs
|
(1,149,630 | ) | - | - | ||||||||
|
Unrealized foreign exchange
|
794,240 | - | 8,660 | |||||||||
|
Stock-based compensation
|
5,416,151 | 1,166 | 64,197 | |||||||||
|
Unrealized gain on marketable securities
|
(46,707 | ) | - | - | ||||||||
|
Realized gain on marketable securities
|
(1,720,016 | ) | - | - | ||||||||
|
Write-off of mineral properties and property, plant & equipment
|
39,442,452 | - | - | |||||||||
|
Write-off of land and water rights
|
3,243,685 | - | - | |||||||||
|
Realized loss on transfer of marketable securities
|
2,935,895 | - | - | |||||||||
|
Change in fair value of derivative liability
|
(453,790 | ) | - | - | ||||||||
|
Deferred income tax recovery
|
(6,020,527 | ) | - | - | ||||||||
|
Finance charge
|
504,479 | - | 177,260 | |||||||||
| (37,294,615 | ) | (490,015 | ) | (1.170,212 | ) | |||||||
|
Changes in non-cash working capital items:
|
||||||||||||
|
Decrease (increase) in prepaids and receivables
|
(243,256 | ) | 103,950 | 51,042 | ||||||||
|
Increase (decrease) in accounts payable and accrued liabilities
|
(355,309 | ) | 101,324 | 279,556 | ||||||||
|
Increase in due to related parties
|
1,091,043 | - | - | |||||||||
|
Asset retirement obligations
|
(999,176 | ) | - | - | ||||||||
| (37,801,313 | ) | (284,741 | ) | (839,614 | ) | |||||||
|
CASH FLOWS FROM INVESTING ACTIVITIES
|
||||||||||||
|
Cash acquired from subsidiary
|
4,543,435 | - | - | |||||||||
|
Cash paid for Subsidiary
|
(10,602,498 | ) | - | - | ||||||||
|
Spin-out of Golden Predator Corp.
|
(66,890 | ) | - | - | ||||||||
|
Restricted cash
|
(11,293 | ) | 149,868 | - | ||||||||
|
Reclamation bonds
|
747,862 | - | - | |||||||||
|
Proceeds from sale of marketable securities, net
|
(3,881,287 | ) | - | - | ||||||||
|
Proceeds from sale of property, plant and equipment
|
5,633,294 | - | - | |||||||||
|
Purchase of property, plant and equipment
|
(19,920,751 | ) | - | - | ||||||||
|
Proceeds from sale of mineral interests
|
517,550 | - | - | |||||||||
|
Additions to unproven mineral interests
|
(5,588,419 | ) | (1,364,031 | ) | (1,108,484 | ) | ||||||
| (28,628,997 | ) | (1,214,163 | ) | (1,108,484 | ) | |||||||
|
CASH FLOWS FROM FINANCING ACTIVITIES
|
||||||||||||
|
Common shares issued
|
53,595,724 | 876,946 | - | |||||||||
|
Share issuance costs
|
(1,218,332 | ) | (27,531 | ) | - | |||||||
|
Special warrants
|
12,095,274 | - | - | |||||||||
|
Options exercised
|
370,812 | - | - | |||||||||
|
Warrants exercised
|
10,534,109 | - | - | |||||||||
|
Notes payable
|
(11,412,423 | ) | - | - | ||||||||
|
Receipt of promissory note
|
4,844,874 | 2,500,000 | 1,200,000 | |||||||||
|
Convertible debenture
|
2,650,000 | - | 649,175 | |||||||||
|
Debt issuance costs
|
(249,827 | ) | - | - | ||||||||
|
Payment of promissory note and convertible debenture
|
(4,540,103 | ) | (1,854,875 | ) | - | |||||||
|
Advances from related party
|
191,508 | - | - | |||||||||
|
Loans advanced to Midway
|
(1,822,651 | ) | - | - | ||||||||
|
Loan repayment from Midway
|
1,760,221 | - | - | |||||||||
| 66,799,186 | 1,494,540 | 1,849,175 | ||||||||||
|
Effect of foreign exchange on cash flows
|
411,835 | - | - | |||||||||
|
Change in cash during the period
|
780,711 | (4,364 | ) | (98,923 | ) | |||||||
|
Cash, beginning of period
|
- | 785,075 | 190,215 | |||||||||
|
Cash, end of period
|
$ | 780,711 | $ | 780,711 | $ | 91,292 | ||||||
Supplemental disclosure with respect to cash flows (Note 13)
The accompanying notes are an integral part of these condensed consolidated financial statements.
5
|
EMC Metals Corp.
|
||||||||
|
(An Exploration Stage Company)
|
||||||||
|
CONDENSED CONSOLIDATED STATEMENTS OF CHANGES IN STOCKHOLDERS’ EQUITY
|
||||||||
|
(Expressed in US Dollars) (Unaudited) Page 1 of 2
|
||||||||
| Capital Stock |
Additional
|
Accumulated Other
|
Deficit Accumulated During the
|
|||||||||||||||||||||||||
|
Number of Shares
|
Amount
|
Paid in
Capital |
Treasury
Stock |
Comprehensive
Loss
|
Exploration
Stage
|
Total
|
||||||||||||||||||||||
| $ | $ | $ | $ | $ | $ | |||||||||||||||||||||||
|
Balance, July 17, 2006
|
- | - | - | - | - | - | - | |||||||||||||||||||||
|
Private placements
|
5,000,000 | 3,017,350 | - | - | - | - | 3,017,350 | |||||||||||||||||||||
|
Excess of exchange amount over carrying
|
- | - | - | - | - | - | ||||||||||||||||||||||
|
Excess of exchange amount over carrying
amount of Springer Mining Company
|
- | - | - | - | - | (2,490,691 | ) | (2,490,691 | ) | |||||||||||||||||||
|
Loss for the period
|
- | - | - | - | - | (316,382 | ) | (316,382 | ) | |||||||||||||||||||
|
Balance, December 31, 2006
|
5,000,000 | 3,017,350 | - | - | - | (2,807,073 | ) | 210,277 | ||||||||||||||||||||
|
Private placements
|
17,577,500 | 35,598,475 | - | - | - | - | 35,598,475 | |||||||||||||||||||||
|
Conversion of special warrants
|
5,390,000 | 5,590,529 | - | - | - | - | 5,590,529 | |||||||||||||||||||||
|
Exercise of warrants
|
50,000 | 74,235 | - | - | - | - | 74,235 | |||||||||||||||||||||
|
Share issuance costs – broker’s fees
|
- | (1,202,721 | ) | 97,56500 | - | - | - | (1,105,156 | ) | |||||||||||||||||||
|
Share issuance costs – shares issued
|
100,000 | 99,910 | - | - | - | - | 99,910 | |||||||||||||||||||||
|
Shares issued for mineral properties
|
100,000 | 95,822 | - | - | - | - | 95,822 | |||||||||||||||||||||
|
Stock-based compensation
|
40,000 | 38,314 | 472,489 | - | - | - | 510,803 | |||||||||||||||||||||
|
Loss for the year
|
- | - | - | - | - | (5,579,477 | ) | (5,579,477 | ) | |||||||||||||||||||
|
Balance, December 31, 2007
|
28,257,500 | 43,311,914 | 570,054 | - | - | (8,386,550 | ) | 35,495,418 | ||||||||||||||||||||
|
Private placements
|
5,322,500 | 10,543,444 | - | - | - | - | 10,543,444 | |||||||||||||||||||||
|
Conversion of special warrants
|
7,610,000 | 7,484,629 | - | - | - | - | 7,484,629 | |||||||||||||||||||||
|
Share issuance costs – broker’s fees
|
- | (263,169 | ) | - | - | - | - | (263,169 | ) | |||||||||||||||||||
|
Shares issued for mineral properties
|
110,000 | 206,229 | - | - | - | - | 206,229 | |||||||||||||||||||||
|
Acquisition of Gold Standard Royalty Corp.
|
2,050,000 | 4,088,552 | 138,529 | - | - | - | 4,227,081 | |||||||||||||||||||||
|
Acquisition of Great American Minerals Inc.
|
1,045,775 | 2,065,059 | 419,891 | - | - | - | 2,484,950 | |||||||||||||||||||||
|
Acquisition of Fury Explorations Ltd.
|
10,595,814 | 12,963,070 | 7,343,879 | (1,964,364 | ) | - | - | 18,342,585 | ||||||||||||||||||||
|
Exercise of stock options
|
6,637,224 | 9,690,543 | (178,482 | ) | - | - | - | 9,512,061 | ||||||||||||||||||||
|
Shares issued for repayment of promissory note
|
4,728,000 | 2,017,257 | - | - | - | - | 2,017,257 | |||||||||||||||||||||
|
Stock-based compensation
|
- | - | 2,251,500 | - | - | - | 2,251,500 | |||||||||||||||||||||
|
Loss for the year
|
- | - | - | - | - | (16,979,873 | ) | (16,979,873 | ) | |||||||||||||||||||
|
Balance, December 31, 2008
|
66,356,813 | 92,107,528 | 10,545,371 | (1,964,364 | ) | - | (25,366,423 | ) | 75,322,112 | |||||||||||||||||||
|
Private placements
|
14,500,000 | 1,123,489 | - | - | - | - | 1,123,489 | |||||||||||||||||||||
|
Exercise of stock options
|
101,000 | 110,689 | (92,970 | ) | - | - | - | 17,719 | ||||||||||||||||||||
|
Shares issued for mineral properties
|
2,765,643 | 311,606 | - | - | - | - | 311,606 | |||||||||||||||||||||
|
Settlement of convertible debentures
|
7,336,874 | 2,299,061 | 49,278 | - | - | - | 2,348,339 | |||||||||||||||||||||
|
Shares issued for consulting
|
89,254 | 9,168 | - | - | - | - | 9,168 | |||||||||||||||||||||
|
Shares issued for acquisition of TTS
|
19,037,386 | 1,976,697 | - | - | - | - | 1,976,697 | |||||||||||||||||||||
|
Stock-based compensation before spin-out
|
- | - | 799,008 | - | - | - | 799,008 | |||||||||||||||||||||
|
Spin-out of GPD
|
- | (18,044,538 | ) | (11,300,687 | ) | - | - | - | (29,345,225 | ) | ||||||||||||||||||
|
Stock-based compensation after spin-out
|
- | - | 935,995 | - | - | - | 935,995 | |||||||||||||||||||||
|
Foreign currency translation adjustment
|
- | - | - | - | (2,536,527 | ) | - | (2,536,527 | ) | |||||||||||||||||||
6
|
EMC Metals Corp.
|
|
(An Exploration Stage Company)
|
|
CONDENSED CONSOLIDATED STATEMENTS OF CHANGES IN STOCKHOLDERS’ EQUITY
|
|
(Expressed in US Dollars) (Unaudited) Page 2 of 2
|
|
Capital Stock
|
Additional
|
Accumulated Other
|
Deficit Accumulated During the
|
|||||||||||||||||||||||||
|
Number of Shares
|
Amount
|
Paid in
Capital
|
Treasury
Stock |
Comprehensive Loss | Exploration Stage |
Total
|
||||||||||||||||||||||
| $ | $ | $ | $ | $ | $ | |||||||||||||||||||||||
|
Loss for the year
|
- | - | - | - | - | (18,954,099 | ) | (18,954,099 | ) | |||||||||||||||||||
|
Balance, December 31, 2009
|
110,186,970 | 79,893,700 | 935,995 | (1,964,364 | ) | (2,536,527 | ) | (44,320,522 | ) | 32,008,282 | ||||||||||||||||||
|
Private placements
|
30,252,442 | 4,563,680 | 441,565 | - | - | - | 5,005,245 | |||||||||||||||||||||
|
Exercise of stock options
|
1,320,000 | 443,329 | (219,732 | ) | - | - | - | 223,597 | ||||||||||||||||||||
|
Exercise of warrants
|
7,300,000 | 1,060,257 | - | - | - | - | 1,060,257 | |||||||||||||||||||||
|
Stock-based compensation
|
- | - | 772,179 | - | - | - | 772,179 | |||||||||||||||||||||
|
Foreign currency translation adjustment
|
- | - | - | - | 99,091 | - | 99,091 | |||||||||||||||||||||
|
Loss for the year
|
- | - | - | - | - | (4,585,644 | ) | (4,585,644 | ) | |||||||||||||||||||
|
Balance, December 31, 2010
|
149,059,412 | 85,960,966 | 1,930,007 | (1,964,364 | ) | (2,437,436 | ) | (48,906,166 | ) | 34,583,007 | ||||||||||||||||||
|
Exercise of stock options
|
250,000 | 140,466 | (76,796 | ) | - | - | - | 63,670 | ||||||||||||||||||||
|
Exercise/expiry of warrants
|
1,369,301 | 378,563 | (700,170 | ) | 700,170 | - | - | 378,563 | ||||||||||||||||||||
|
Stock-based compensation
|
- | - | 296,127 | - | - | - | 296,127 | |||||||||||||||||||||
|
Foreign currency translation adjustment
|
- | - | - | - | (984,896 | ) | - | (984,896 | ) | |||||||||||||||||||
|
Loss for the year
|
- | - | - | - | - | (7,156,033 | ) | (7,156,033 | ) | |||||||||||||||||||
|
Balance, December 31, 2011
|
150,678,713 | 86,479,995 | 1,449,168 | (1,264,194 | ) | (3,422,332 | ) | (56,062,199 | ) | 27,180,438 | ||||||||||||||||||
|
Private placements
|
13,679,624 | 790,508 | - | - | - | - | 790,508 | |||||||||||||||||||||
|
Stock-based compensation
|
- | - | 331,794 | - | - | - | 331,794 | |||||||||||||||||||||
|
Shares issued for mineral properties
|
1,000,000 | 40,205 | - | - | - | - | 40,205 | |||||||||||||||||||||
|
Issue of convertible debenture warrants
|
- | - | 252,756 | - | - | - | 252,756 | |||||||||||||||||||||
|
Foreign currency translation adjustment
|
- | - | - | - | 577,664 | - | 577,664 | |||||||||||||||||||||
|
Loss for the year
|
- | - | - | - | - | (4,965,297 | ) | (4,965,297 | ) | |||||||||||||||||||
|
Balance, December 31, 2012
|
165,358,337 | 87,310,708 | 2,033,718 | (1,264,194 | ) | (2,844,668 | ) | (61,027,496 | ) | 24,208,068 | ||||||||||||||||||
|
Stock-based compensation
|
- | - | 74,609 | - | - | - | 74,609 | |||||||||||||||||||||
|
Foreign currency translation adjustment on disposal of Springer Mining Company
|
- | - | 1,991,268 | - | 1,991,268 | |||||||||||||||||||||||
|
Loss for the year
|
- | - | - | - | - | (25,690,599 | ) | (25,690,599 | ) | |||||||||||||||||||
|
Balance, December 31, 2013
|
165,358,337 | 87,310,708 | 2,108,327 | (1,264,194 | ) | (853,400 | ) | (86,718,095 | ) | 583,346 | ||||||||||||||||||
|
Private placements
|
23,070,806 | 1,083,590 | - | - | - | - | 1,083,590 | |||||||||||||||||||||
|
Stock-based compensation
|
- | - | 1,166 | - | - | - | 1,166 | |||||||||||||||||||||
|
Loss for the period
|
- | - | - | - | - | (493,098 | ) | (493,098 | ) | |||||||||||||||||||
|
Balance, June 30, 2014
|
188,429,143 | 88,394,298 | 2,109,493 | (1,264,194 | ) | (853,400 | ) | (87,211,193 | ) | 1,175,004 | ||||||||||||||||||
The accompanying notes are an integral part of these condensed consolidated financial statement.
7
|
EMC Metals Corp.
|
|
(An Exploration Stage Company)
|
|
NOTES TO THE CONDENSED CONSOLIDATED FINANCIAL STATEMENTS
|
|
June 30, 2014
|
|
(Expressed in US Dollars) (Unaudited)
|
|
1.
|
NATURE AND CONTINUANCE OF OPERATIONS
|
EMC Metals Corp. (the “Company”) is a specialty metals and alloys company focusing on scandium and other specialty metals. The Company intends to utilize its knowhow and, in certain instances, patented technologies to maximize opportunities in scandium and other specialty metals.
The Company was incorporated under the laws of the Province of British Columbia, Canada in 2006. The Company currently trades on the Toronto Stock Exchange under the symbol “EMC”.
Our focus of operations is the exploration and development of our specialty metals assets, including the Nyngan scandium deposit located in New South Wales, Australia and the Tørdal scandium/rare earth minerals deposit in Norway. Prior to January 1, 2014, the Company’s principal asset was the Springer Tungsten mine and mill, held by the Springer Mining Company. On September 13, 2013, the Company signed a binding Letter of Intent to sell 100% of the Springer Mining Company entity, its assets and mineral and water rights to America Bullion Royalty Corp., for $5 million cash. The transaction was closed on December 31, 2013.
The sale also included the transfer of interests in the Company’s Carlin Vanadium property mineral assets and the Copper King property tungsten assets in Nevada to AMB, along with Springer Tungsten.
One of EMC’s directors is also a director of the company that purchased Springer. The common director recused himself from director level voting on all board level decisions related to the sale.
With the completion of the sale of the Tungsten asset, the Company’s focus is on the exploration and evaluation of its specialty metals assets, specifically the Nyngan scandium deposit located in New South Wales, Australia and the Tørdal scandium/rare earth minerals deposit in Norway. In June 2014, the Company made the final installment payment to acquire the Nyngan property. The Company is an exploration stage company and anticipates incurring significant additional expenditures prior to production at any and all of its properties.
These consolidated financial statements have been prepared on a going concern basis that contemplates the realization of assets and discharge of liabilities at their carrying values in the normal course of business for the foreseeable future. These financial statements do not reflect any adjustments that may be necessary if the Company is unable to continue as a going concern.
The Company currently earns no operating revenues and will require additional capital in order to advance both the Nyngan and Tørdal properties. The Company’s ability to continue as a going concern is uncertain and is dependent upon the generation of profits from mineral properties, obtaining additional financing and maintaining continued support from its shareholders and creditors. These are material uncertainties that raise substantial doubt about the Company’s ability to continue as a going concern. In the event that additional financial support is not received or operating profits are not generated, the carrying values of the Company’s assets may be adversely affected.
|
2.
|
BASIS OF PRESENTATION
|
Basis of presentation
The accompanying unaudited interim condensed consolidated financial statements have been prepared in accordance with the rules and regulations of the Securities and Exchange Commission (“SEC”). The interim condensed consolidated financial statements include the consolidated accounts of EMC Metals Corp. (the “Company”) and its wholly-owned subsidiaries with all significant intercompany transactions eliminated. In the opinion of management, all adjustments necessary for a fair statement of the consolidated financial position, results of operations and cash flows for the interim periods have been made. Certain information and footnote disclosures normally included in the consolidated financial statements prepared in accordance with generally accepted accounting principles have been condensed or omitted pursuant to such SEC rules and regulations. These interim condensed consolidated financial statements should be read in conjunction with the audited consolidated financial statements for the year ended December 31, 2013 and with our Annual Report on Form 10-K filed with the SEC on March 25, 2014. Operating results for the three-month period ended March 31, 2014 may not necessarily be indicative of the results for the year ending December 31, 2014.
Change in functional and presentation currency
The Company’s expenses and overheads are now primarily being incurred in United States Dollars (“USD”) and it is anticipated that cash flows will continue to be primarily in USD. Accordingly the Company determined that effective January 1, 2013, the functional currency of the Company would change from the Canadian Dollar to the USD for the parent company and its wholly owned subsidiaries.
Use of estimates
The preparation of interim condensed consolidated financial statements in conformity with US GAAP requires management to make estimates and assumptions that affect the reported amounts of assets and liabilities and the disclosure of contingent assets and liabilities at the date of the financial statements and the reported amounts of expenses during the reporting period. The Company regularly evaluates estimates and assumptions related to the deferred income tax asset valuations, asset impairment, stock-based compensation and loss contingencies. The Company bases its estimates and assumptions on current facts, historical experience and various other factors that it believes to be reasonable under the circumstances, the results of which form the basis for making judgments about the other sources. The actual results experienced by the Company may differ materially and adversely from the Company’s estimates. To the extent there are material differences between estimates and the actual results, future results of operations will be affected.
8
|
EMC Metals Corp.
|
|
(An Exploration Stage Company)
|
|
NOTES TO THE CONDENSED CONSOLIDATED FINANCIAL STATEMENTS
|
|
June 30, 2014
|
|
(Expressed in US Dollars) (Unaudited)
|
|
2.
|
BASIS OF PRESENTATION (cont’d…)
|
Fair value of financial assets and liabilities
The Company measures the fair value of financial assets and liabilities based on US GAAP guidance which defines fair value, establishes a framework for measuring fair value, and expands disclosures about fair value measurements.
The Company classifies financial assets and liabilities as held-for-trading, available-for-sale, held-to-maturity, loans and receivables or other financial liabilities depending on their nature. Financial assets and financial liabilities are recognized at fair value on their initial recognition, except for those arising from certain related party transactions which are accounted for at the transferor’s carrying amount or exchange amount.
Financial assets and liabilities classified as held-for-trading are measured at fair value, with gains and losses recognized in net income. Financial assets classified as held-to-maturity, loans and receivables, and financial liabilities other than those classified as held-for-trading are measured at amortized cost, using the effective interest method of amortization. Financial assets classified as available-for-sale are measured at fair value, with unrealized gains and losses being recognized as other comprehensive income until realized, or if an unrealized loss is considered other than temporary, the unrealized loss is recorded in income.
Financial instruments, including receivables, accounts payable and accrued liabilities, convertible debentures and promissory notes payable are carried at amortized cost, which management believes approximates fair value due to the short term nature of these instruments.
The following table presents information about the assets that are measured at fair value on a recurring basis as at June 30, 2014, and indicates the fair value hierarchy of the valuation techniques the Company utilized to determine such fair value. In general, fair values determined by Level 1 inputs utilize quoted prices (unadjusted) in active markets for identical assets. Fair values determined by Level 2 inputs utilize data points that are observable such as quoted prices, interest rates and yield curves. Fair values determined by Level 3 inputs are unobservable data points for the asset or liability, and included situations where there is little, if any, market activity for the asset:
|
June 30,
2014
|
Quoted Prices
in Active Markets
(Level 1)
|
Significant Other
Observable Inputs
(Level 2)
|
Significant
Unobservable Inputs
(Level 3)
|
|||||||||||||
|
Assets:
|
||||||||||||||||
|
Cash
|
$ | 780,711 | $ | 780,711 | $ | — | $ | — | ||||||||
|
Total
|
$ | 780,711 | $ | 780,711 | $ | — | $ | — | ||||||||
The fair value of cash is determined through market, observable and corroborated sources.
Recently Adopted Accounting Policies
Accounting Standards Update 2013-05 - Foreign Currency Matters (Topic 830) - Parent’s Accounting for the Cumulative Translation Adjustment upon Derecognition of Certain Subsidiaries or Groups of Assets within a Foreign Entity or of an Investment in a Foreign Entity. This standard provides guidance with respect to the treatment of the cumulative translation adjustment upon the sale of a foreign subsidiary whereby the cumulative translation adjustment associated with that subsidiary are taken into net income of the parent company.
Accounting Standards Update 2013-11 - Income Taxes (Topic 740) - Presentation of an Unrecognized Tax Benefit When a Net Operating Loss Carry forward, a Similar Tax Loss, or a Tax Credit Carry forward Exists. This accounting standard deals with the treatment of tax loss carry forwards. The Company has reviewed this standard and has determined that it has little impact on the presentation of its financial statements.
Recent Accounting Pronouncements
Accounting Standards Update 2014-08 - Presentation of Financial Statements (Topic 205) and Property, Plant, and Equipment (Topic 360) Reporting Discontinued Operations and Disclosures of Disposals of Components of an Entity. This accounting pronouncement provides guidance on the treatment of Property, Plant and Equipment plus the reporting of discontinued operations and disclosure of disposals of components of an entity. The policy is effective December 15, 2014. The Company is evaluating this guidance and believes it will have little impact on the presentation of its financial statements.
9
|
EMC Metals Corp.
|
|
(An Exploration Stage Company)
|
|
NOTES TO THE CONDENSED CONSOLIDATED FINANCIAL STATEMENTS
|
|
June 30, 2014
|
|
(Expressed in US Dollars) (Unaudited)
|
|
3.
|
RESTRICTED CASH
|
The Company had a Bank of Montreal letter of credit of up to C$159,400 as a security deposit related to a Vancouver office lease obligation. The letter of credit was returned to the Bank of Montreal in July 2014 and funds were released for use by the Company.
|
4.
|
DISCONTINUED OPERATIONS
|
During fiscal 2013, the Company identified a buyer for its tungsten properties and related plant and mill held by its subsidiary, Springer Mining Company (“Springer”). On September 13, 2013, the Company signed a binding Letter Of Intent (“LOI”) to sell 100% of the Springer Mining Company entity, its assets and mineral and water rights to Americas Bullion Royalty Corp. (“AMB”), for $5 million cash. The transaction was finalized on December 31, 2013.
At the signing of the LOI, AMB paid $3.1 million directly to the existing convertible debt holder to retire a maturing debt plus accumulated interest.
|
·
|
Cash paid by AMB to the convertible debt holder paid the debt in full and released the security interest in the Springer property and assets,
|
|
·
|
The cash advanced by AMB formed a new loan, with AMB as lender, as at September 13, 2013,
|
|
·
|
The new loan carries a zero interest rate, and
|
|
·
|
AMB agreed to additionally fund all Springer property carrying costs until the final payment and closing date.
|
The sale also included the transfer of interests in the Company’s Carlin Vanadium property mineral assets and the Copper King property tungsten assets in Nevada to AMB, along with Springer Tungsten.
Springer was actively involved in the evaluation and re-start of the Company’s tungsten property, located in Pershing County, Nevada. Going forward, the Company has no further assets located in the US or continuing involvement with Springer.
A comparison of the Net Loss results from discontinued operations for the six month period ended June 30, 2014 and 2013 as well as Q2 of 2013 and 2014 is as follows:
|
Quarter ended June 30, 2014
|
Quarter ended June 30, 2013
|
Six month period ended June 30, 2014
|
Six month period ended June 30,2013
|
|||||||||||||
|
EXPENSES
|
||||||||||||||||
|
Amortization
|
- | 4,853 | - | 9,705 | ||||||||||||
|
Consulting
|
- | 438 | - | 10,053 | ||||||||||||
|
General and administrative
|
- | 21,767 | - | 57,779 | ||||||||||||
|
Insurance
|
- | 20,202 | - | 32,176 | ||||||||||||
|
Professional fees
|
- | 263 | - | 500 | ||||||||||||
|
Salaries and benefits
|
- | 128,469 | - | 232,646 | ||||||||||||
|
Travel and entertainment
|
- | - | - | 1,853 | ||||||||||||
|
OTHER ITEMS
|
||||||||||||||||
|
Interest expense
|
- | - | - | 56,250 | ||||||||||||
|
Other income
|
- | (87,383 | ) | - | (204,565 | ) | ||||||||||
|
Net loss from discontinued operations
|
- | (88,609 | ) | - | (196,397 | ) | ||||||||||
|
Six month period ended June 30,2014
|
Six month period ended June 30,2013
|
|||||||
|
Cash flows from discontinued operations
|
||||||||
|
Net cash used in (from) operating activities
|
- | (154,597 | ) | |||||
|
Net cash used in (from) investing activities
|
- | - | ||||||
|
Net cash used in (from) financing activities
|
- | - | ||||||
|
Net cash used in (from) discontinued operations
|
- | (154,597 | ) | |||||
|
Non-cash transactions from discontinued operations
|
- | - | ||||||
10
|
EMC Metals Corp.
|
|
(An Exploration Stage Company)
|
|
NOTES TO THE CONDENSED CONSOLIDATED FINANCIAL STATEMENTS
|
|
June 30, 2014
|
|
(Expressed in US Dollars) (Unaudited)
|
|
5.
|
PROPERTY, PLANT and EQUIPMENT
|
2014 Continuing Operations
|
December 31, 2013 Net Book Value
|
Additions (disposals) (write-offs)
|
Amortization
|
June 30, 2014 Net Book Value
|
|||||||||||||
|
Computer equipment
|
$ | 2,375 | $ | - | $ | (339 | ) | $ | 2,036 | |||||||
|
Office equipment
|
7,903 | - | (1,578 | ) | 6,325 | |||||||||||
|
Property, plant and equipment
|
$ | 10,278 | $ | - | $ | (1,917 | ) | $ | 8,361 | |||||||
2013 Continuing Operations
|
December 31, 2012 Net Book Value
|
Additions (disposals) (write-offs)
|
Amortization
|
December 31, 2013 Net Book Value
|
|||||||||||||
|
Computer equipment
|
$ | 3,402 | $ | - | $ | (1,027 | ) | $ | 2,375 | |||||||
|
Office equipment
|
11,058 | - | (3,155 | ) | 7,903 | |||||||||||
|
Property, plant and equipment
|
$ | 14,460 | $ | - | $ | (4,182 | ) | $ | 10,278 | |||||||
2013 Discontinued Operations
|
December 31, 2012 Net Book Value
|
Additions (disposals) (write-offs)
|
Amortization
|
December 31, 2013 Net Book Value
|
|||||||||||||
|
Land and water rights
|
$ | 4,252,146 | $ | (4,252,146 | ) | $ | - | $ | - | |||||||
|
Plant and equipment
|
25,749,852 | (25,749,852 | ) | - | - | |||||||||||
|
Buildings
|
165,959 | (163,235 | ) | (2,724 | ) | - | ||||||||||
|
Automobiles
|
11,262 | (9,134 | ) | (2,128 | ) | - | ||||||||||
|
Property, plant and equipment
|
$ | 30,179,219 | $ | (30,174,367 | ) | $ | (4,852 | ) | $ | - | ||||||
Land and water rights are in respect of properties in Nevada. The plant and equipment is comprised of the Springer Plant and Mill in Nevada which was sold to AMB as part of the binding LOI signed September 13, 2013.
|
6.
|
MINERAL INTERESTS
|
|
June 30, 2014
|
Scandium and other
|
Tungsten
|
Total
|
|||||||||
|
Acquisition costs, continuing operations
|
||||||||||||
|
Balance, December 31, 2013
|
$ | 1,613,203 | $ | - | $ | 1,613,203 | ||||||
| Additions | 1,364,031 | - | 1,364,031 | |||||||||
| Balance June 30, 2014 | $ | 2,977,234 | $ | - | $ | 2,977,234 | ||||||
|
December 31, 2013
|
Scandium and other
|
Tungsten
|
Total
|
|||||||||
|
Acquisition costs, continuing operations
|
||||||||||||
|
Balance, December 31, 2012
|
$ | 554,719 | $ | - | $ | 554,719 | ||||||
|
Additions
|
1,108,484 | - | 1,108,484 | |||||||||
|
Write-off
|
(50,000 | ) | - | (50,000 | ) | |||||||
|
Balance, December 31, 2013
|
$ | 1,613,203 | $ | - | $ | 1,613,203 | ||||||
| Acquisition costs, discontinued operations | ||||||||||||
|
Balance, December 31, 2012
|
$ | - | $ | 198,463 | $ | 198,463 | ||||||
|
Disposal
|
- | (198,463 | ) | (198,463 | ) | |||||||
|
Balance, December 31, 2013
|
$ | - | $ | - | $ | - | ||||||
11
|
EMC Metals Corp.
|
|
(An Exploration Stage Company)
|
|
NOTES TO THE CONDENSED CONSOLIDATED FINANCIAL STATEMENTS
|
|
June 30, 2014
|
|
(Expressed in US Dollars) (Unaudited)
|
|
6.
|
MINERAL INTERESTS (cont’d…)
|
Title to mineral property interests involves certain inherent risks due to the difficulties of determining the validity of certain claims as well as the potential for problems arising from the frequently ambiguous conveyancing history characteristic of many mineral property interests. The Company has investigated title to all of its mineral property interests and, to the best of its knowledge, title to all of its properties is in good standing.
SCANDIUM PROPERTIES
Nyngan, New South Wales Property
On February 5, 2010, the Company entered in to an earn-in agreement with Jervois Mining Limited (“Jervois”), whereby it would acquire a 50% interest in the Nyngan Scandium property (the “Nyngan Project”) located in New South Wales, Australia. The JV Agreement, as amended, gave the Company the right to earn a 50% interest in a joint venture with Jervois, for the purpose of holding and developing the Nyngan Project. On June 22, 2012, the Company received notice of a lawsuit filed against the Company with regard to the achievement of certain milestones required under the JV Agreement. On February 6, 2013, the Company announced agreement of an out of court settlement to the dispute with Jervois. The terms of the settlement transferred 100% ownership and control of the Nyngan Project to the Company, in return for AUD$2.6 million cash payments and a percentage royalty payable to Jervois on sales of product from the project. A total of $1,108,484 (AUD$1.2 million) was paid in June 2013 as part of the settlement. A total of $1,364,031 (AUD$1.4 million) was paid in June 2014 to fulfill the obligations under the settlement agreement which gives 100% of the property to the Company.
Tørdal and Evje-Iveland properties, Norway
During fiscal 2012 the Company entered into an option agreement with REE Mining AS (“REE”) to earn up to a 100% interest in the Tørdal and Evje-Iveland properties pursuant to which the Company paid $130,000 and issued 1,000,000 common shares valued at $40,000. To earn its interest, the original agreement required the Company to pay REE an additional $500,000, incur $250,000 of exploration work and issue 250,000 common shares upon releasing the second of two full feasibility studies on the two properties. The Company subsequently renegotiated the payments required to earn the interest and the Evje-Iveland property was removed from the option agreement. Pursuant to the amendment, the Company earned a 100% interest in the Tørdal property by paying an additional $35,000 and granting a 1% Net Smelter Return (“NSR”) payable to REE.
Hogtuva property, Norway
During fiscal 2011 the Company entered into an option agreement with REE to earn a 100% interest in three scandium and beryllium exploration sites in Norway pursuant to which the Company paid $50,000. To earn its interest, the original agreement required the Company to pay REE an additional $100,000 and issue up to 200,000 common shares. During fiscal 2013, the Company renegotiated the payments required to earn the interest and removed two of the exploration sites from the agreement.
Pursuant to the amendment, the Company earned a 100% interest in the Hogtuva property in consideration for the $50,000 original payment and the grant of a 1% NSR payable to REE. In early fiscal 2014 a decision was made by the Company not to renew its interest in the Hogtuva property and $50,000 in acquisition costs were written off during the year ended December 31, 2013.
TUNGSTEN PROPERTY
Springer Property
On November 21, 2006, the Company acquired all outstanding and issued shares of Springer Mining Company (“Springer”). Included in the assets of Springer and allocated to property, plant and equipment (Note 5) are the Springer Mine and Mill located in Pershing County, Nevada. The Company agreed to sell Springer Mining Company on September 13, 2013 (see Note 1), for $5 million, along with the Copper King Tungsten property and the Carlin Vanadium property. The transaction was completed and fully funded on December 31, 2013.
|
7.
|
CONVERTIBLE DEBENTURES
|
On February 22, 2013, the Company completed a $650,000 loan financing consisting of convertible debentures. The convertible debenture had a maturity date of February 22, 2014 and bore interest at 10% per annum. The lenders had the option to convert the loan into 13,000,000 common shares of the Company. There was no beneficial conversion feature associated with the conversion option. The loan was secured by an interest in the assets of the Company’s wholly owned subsidiary, Wolfram Jack Mining Corp. and the Company’s interest in the Hogtuva and Tørdal properties in Norway. This financing was repaid in full in February 2014.
On February 17, 2012, the Company completed a $3,000,000 loan financing consisting of a term loan of $1,000,000 (Note 9), a convertible debenture of $2,000,000 and warrants to acquire 3,000,000 common shares. The convertible debenture had a maturity date of August 15, 2013 and bore interest at 7% per annum. The lender had the option to convert a maximum of $2,000,000 of the principal amount of the loan into 10,000,000 common shares of the Company. The loan was secured by an interest in the assets of the Company’s subsidiary, Springer Mining Company. There was no beneficial conversion feature associated with the conversion option. The warrants were exercisable at C$0.20 per share expiring February 15, 2014. A relative fair value of $217,267 was assigned to the warrants and recorded in additional paid in capital. The Company paid financing costs of $249,827 and also issued 750,000 purchase warrants exercisable at C$0.20 per share expiring February 15, 2014. These warrants were valued at $58,716 with a volatility of 120%, expected life of 2 years, risk free rate of 1.0% and expected dividend yield of 0.0% and recorded in additional paid in capital. The financing costs were allocated between debt and the equity components. This resulted in a convertible debenture carrying amount of $1,663,681 upon deducting a debt discount of $336,319 from the principal balance of $2,000,000. During fiscal 2013, the Company recognized $138,627 in accretion through interest expense. During fiscal 2012, the Company recognized $197,692 in accretion through interest expense. This financing was repaid in full on September 13, 2013.
12
|
EMC Metals Corp.
|
|
(An Exploration Stage Company)
|
|
NOTES TO THE CONDENSED CONSOLIDATED FINANCIAL STATEMENTS
|
|
June 30, 2014
|
|
(Expressed in US Dollars) (Unaudited)
|
|
8.
|
PROMISSORY NOTES PAYABLE
|
|
June 30, 2014
|
December 31, 2013
|
|||||||
|
Promissory Note related to discontinued operations
Promissory note with a principal balance of $3,750,000, bearing interest at 6% per annum, maturing July 3, 2013 and secured by land and water rights.
During fiscal 2008 the Company entered into a promissory note for $6,750,000 as consideration for the acquisition of land and water rights. The Company subsequently made principal payments of $3,000,000 consisting of a cash payment of $1,000,000 and 4,728,000 units of the Company equity valued at $2,000,000. Each unit consisted of one common share and one-half share purchase warrant exercisable at C$0.75 each and exercisable for a period of two years. The note was secured by a First Deed of Trust on the Cosgrave property land and water rights.
In June 2013 the Company returned, to the note holder, the Cosgrave Ranch for the value of the promissory note thereby extinguishing this debt. (Note 5)
|
$ | Nil | $ | Nil | ||||
|
Promissory Notes related to continuing operations
On June 24, 2014, the Company completed a $2,500,000 loan financing which includes a convertible feature. The loan has a maturity date of December 24, 2015 and bears loan interest that increases in quarterly increments from 4% to a maximum of 12%. The full loan can be converted into an effective 20% JV interest in Nyngan and Honeybugle. This conversion features can convert at the lender’s option or once EMC raises $3,000,000 million in equity. The 20% JV partner has a carried interest until EMC meets two milestones: (1) filing a feasibility study on SEDAR, and (2) receiving a mining license on either JV property. The JV partner becomes fully participating on development and build costs thereafter. The JV partner holds an option to convert their 20% JV interest into equivalent value of EMC shares, at market prices, rather than participate in construction. The JV partner’s option to convert its project interest to EMC shares is a one-time option, at such time the partner becomes fully participating on project costs. If the Company is unable to raise $3,000,000 and repay the loan, the lender may exercise a purchase option wherein the debt will be settled in exchange for 100% interest in the Nyngan mineral rights.
|
$ | 2,500,000 | $ | Nil | ||||
|
On June 24, 2013 the Company completed a $1,204,875 financing consisting of a series of insider and non-insider loans. The loans had a maturity date in June 2014 and bore interest at 10% per annum. The loans were secured by the ownership interest the Company has or earns in the Nyngan Scandium Project. As an inducement to enter into this loan, the lenders received a royalty of 0.2% of average scandium sales value, produced from the Nyngan property, on the first 100 tonnes of scandium oxide product produced and sold. The royalty was capped at $370,000 and EMC retained a right to buy back the royalty from the lenders or their assigns for $325,000 at any time up to the commencement of first production, or three years from loan date, whichever occurs first. This financing was paid in full of June 2014.
|
Nil | $ | 1,204,875 | |||||
| During the year ended December 31, 2012, the Company completed a $3,000,000 loan financing which included a $1,000,000 note payable bearing interest of 7% per annum maturing August 15, 2013. Presented is this principle balance, less financing and costs, which are amortized over the term of the debt using the effective interest method. This resulted in a carrying costs of $831,841 upon deducting a debt discount of $168,159 from the principal balance of $1,000,000. During fiscal 2013, the Company recognized $69,313 in accretion through interest expense. During fiscal 2012, the Company recognized $98,847 in accretion through interest expense. The note payable was secured by an interest in the Company’s subsidiary, Springer Mining Company. The financing was repaid in full on September 13, 2013. | Nil | Nil | ||||||
| Less current portion | (2,500,000 | ) | (1,204,875 | ) | ||||
| $ | Nil | $ | Nil | |||||
13
|
EMC Metals Corp.
|
|
(An Exploration Stage Company)
|
|
NOTES TO THE CONDENSED CONSOLIDATED FINANCIAL STATEMENTS
|
|
June 30, 2014
|
|
(Expressed in US Dollars) (Unaudited)
|
|
9.
|
RELATED PARTY TRANSACTIONS
|
Accounts payable on June 30, 2014 included $91,835 owed to related parties. Accounts payable on December 31, 2013 included $170,000 owed to related parties.
A total of $350,000 from the loan financing completed on February 22, 2013, $579,875 from the loan financing completed on June 24, 2013 and all of the $100,000 financing completed on August 27, 2013, were funded from a combination of Directors, insiders, and independent shareholders. The Company has paid $78,500 in interest to related parties relating to these loans.
The $100,000 loan financing completed in 2013 was from directors and officers. The loan was repaid in full in 2013.
The loan financing completed on February 22, 2013, of which $350,000 was contributed from directors and officers was repaid in the three months ending March 31, 2014.
Of the $57,407 interest expensed in the six months, $14,375 was payable to a director of the Company.
During the six months ended June 30, 2013, the Company accrued a consulting fee of $51,000 for one of its directors. There is $8,500 for consulting fees incurred during the six month period ended June 30, 2014.
|
10.
|
CAPITAL STOCK AND ADDITIONAL PAID IN CAPITAL
|
On June 26, 2014, the Company issued 10,415,396 common shares at a value of C$0.085 per common share for total proceeds of C$885,309, of which C$250,000 was received subsequent to June 30, 2014.
On April 24, 2014, the Company issued 4,122,150 common shares at a value of C$0.025 per common share for total proceeds of C$103,053.
On March 25, 2014, the Company issued 8,533,260 common shares at a value of C$0.025 per common share for total proceeds of $192,000.
On December 20, 2012, the Company issued 1,000,000 common shares at a value of $40,205 for the Tørdal and Hogtuva projects in Norway.
On December 16, 2012, the Company issued 2,000,000 common shares at a value of C$0.05 per common share for total proceeds of C$100,000.
On July 24, 2012, the Company issued 11,679,624 common shares at a value of C$0.06 per common share for total proceeds of C$700,777.
On December 3, 2010, the Company issued 18,929,740 common shares at a value of C$0.19 per common share for total proceeds of C$3,596,651. A total of C$210,249 was received during fiscal 2011.
On November 25, 2010, the Company issued 6,100,000 units at a value of C$0.10 per unit for total proceeds of C$610,000. Each unit consisted of one common share and one-half of one share purchase warrant exercisable at C$0.18 expiring on November 25, 2011. The warrants have a calculated total fair value of C$142,358 using the Black-Scholes pricing model with a volatility of 142.52%, risk-free rate of 1.73%, expected life of 1 year, and a dividend rate of 0%.
On June 30, 2010, the Company issued 2,947,702 units at a value of C$0.10 per unit for total proceeds of C$294,770. Each unit consisted of one common share and one-half of one share purchase warrant exercisable at C$0.18 until June 30, 2011. The warrants have a calculated total fair value of C$35,638 using the Black-Scholes pricing model with a volatility of 123.84%, risk-free rate of 1.39%, expected life of 1 year, and a dividend rate of 0%.
On February 17, 2010, the Company issued 2,275,000 units at a value of C$0.20 per unit for total proceeds of C$455,000. Each unit consisted of one common share and one-half of one share purchase warrant exercisable at C$0.25 until February 17, 2011. The warrants have a calculated total fair value of C$78,113 using the Black-Scholes pricing model with a volatility of 131.19%, risk-free rate of 1.34%, expected life of 1 year, and a dividend rate of 0%. All of the warrants were exercised during fiscal 2011.
On November 17, 2009, the Company issued 13,000,000 units at a value of C$0.08 per unit for total proceeds of C$1,040,000. Each unit consisted of one common share and one-half of one share purchase warrant. Each full warrant entitled the holder to purchase an additional share at C$0.15 per share until November 17, 2010.
On October 13, 2009, the Company issued 500,000 common shares at a value of C$45,000 for the Fostung Tungsten project.
On August 27, 2009, the Company issued 1,500,000 units at a value of C$0.10 per unit, pursuant to a non-brokered private placement for proceeds of C$150,000. Each unit consisted of one common share and one-half of one share purchase warrant. Each full warrant entitled the holder to purchase an additional share at C$0.15 per share until August 27, 2010.
14
|
EMC Metals Corp.
|
|
(An Exploration Stage Company)
|
|
NOTES TO THE CONDENSED CONSOLIDATED FINANCIAL STATEMENTS
|
|
June 30, 2014
|
|
(Expressed in US Dollars) (Unaudited)
|
|
10.
|
CAPITAL STOCK AND ADDITIONAL PAID IN CAPITAL (cont’d…)
|
On May 13, 2009, the Company issued 89,254 common shares at a value of C$0.12 per share to a consultant for settlement of consulting fees for Fury Explorations Ltd. (“Fury”), a subsidiary of GPD, under the plan of Arrangement of spin-out. On April 21, 2009, the Company issued 51,859 common shares at a value of C$0.10 per share for the Platte River property.
On January 21, 2009, the Company issued 66,784 common shares at a value of C$0.20 per share for the Guijoso property for Fury.
On January 6, 2009, the Company issued 2,147,000 common shares at a value of $250,000 for the Adelaide and Tuscarora projects for Golden Predator Mines US Inc., a wholly owned subsidiary of the Company prior to the spin out.
On November 17, 2008, the Company issued 76,274 common shares in connection with the acquisition of the subsidiary, Great American Minerals Inc.
On October 18, 2008, the Company issued 4,728,000 units to Cosgrave for repayment of a promissory note at a value of $2,000,000. Each unit consisted of one common share of the Company and one-half of one common share purchase warrant with a two year life and exercisable at C$0.75.
In July 2008, the Company completed a private placement consisting of 2,500,000 common shares at C$2.00 per share for proceeds of C$5,000,000. In connection with this private placement the Company paid a finder’s fee of $250,000.
In January 2008, the Company completed a private placement consisting of 2,822,500 units at C$2.00 per unit for gross proceeds of C$5,645,000. Included in the proceeds was C$3,620,000 received in advance as of December 31, 2007. Each unit consisted of one common share and one half of one share purchase warrant. Each whole warrant entitled the holder to acquire one additional common share at C$3.00 for a period of 12 months.
In November 2007, the Company completed private placements consisting of 17,577,500 units at C$2.00 per unit for proceeds of C$35,155,000. Each unit consisted of one common share and one half of one common share purchase warrant. Each whole warrant entitled the holder to acquire one additional common share at C$3.00 for a period of 12 months following the closing of the placement.
In December 2007, the Company issued 5,390,000 common shares pursuant to the conversion of special warrants. The Company paid C$1,016,074 and issued 100,000 common shares valued at C$100,000 as issuance costs and finder’s fees. The Company also granted warrants to acquire 300,000 common shares exercisable at C$1.50 expiring September 22, 2008. The warrants were valued at C$99,000 with the Black-Scholes option pricing model using an expected volatility of 115%, life of one year, a risk free interest rate of 4% and a dividend yield of 0%.
In December 2006, the Company issued 5,000,000 common shares at C$0.70 per common share for gross proceeds of C$3,500,000.
Stock Options and Warrants
The Company established a stock option plan (the “Plan”) under which it is authorized to grant options to executive officers and directors, employees and consultants and the number of options granted under the Plan shall not exceed 15% of the shares outstanding. Under the Plan, the exercise period of the options may not exceed five years from the date of grant and vesting is determined by the Board of Directors.
Stock option and share purchase warrant transactions are summarized as follows:
|
Warrants
|
Stock Options
|
|||||||||||||||
|
Number
|
Weighted average exercise price in Canadian $
|
Number
|
Weighted average
exercise price in Canadian $
|
|||||||||||||
|
Outstanding, December 31, 2012
|
3,750,000 | $ | 0.20 | 13,546,250 | $ | 0.14 | ||||||||||
|
Granted
|
- | - | 2,100,000 | 0.07 | ||||||||||||
|
Cancelled
|
- | - | (1,477,500 | ) | 0.34 | |||||||||||
|
Exercised
|
- | - | - | - | ||||||||||||
|
Outstanding, December 31, 2013
|
3,750,000 | 0.20 | 14,168,750 | 0.12 | ||||||||||||
|
Granted
|
- | - | - | - | ||||||||||||
|
Cancelled
|
(3,750,000 | ) | 0.20 | (2,090,000 | ) | 0.18 | ||||||||||
|
Exercised
|
- | - | - | - | ||||||||||||
|
Outstanding, June 30, 2014
|
- | $ | - | 12,078,750 | $ | 0.11 | ||||||||||
|
Number currently exercisable
|
- | $ | - | 12,078,750 | $ | 0.11 | ||||||||||
15
|
EMC Metals Corp.
|
|
(An Exploration Stage Company)
|
|
NOTES TO THE CONDENSED CONSOLIDATED FINANCIAL STATEMENTS
|
|
June 30, 2014
|
|
(Expressed in US Dollars) (Unaudited)
|
|
10.
|
CAPITAL STOCK AND ADDITIONAL PAID IN CAPITAL (cont’d…)
|
As at June 30, 2014, incentive stock options were outstanding as follows:
|
Number of
options
|
Exercise
Price in Canadian $
|
Expiry Date
|
|||||||
|
Options
|
|||||||||
| 225,000 | 0.120 |
August 27, 2014
|
|||||||
| 200,000 | 0.105 |
December 16, 2014
|
|||||||
| 568,750 | 0.250 |
January 4, 2015
|
|||||||
| 500,000 | 0.050 |
May 9, 2015
|
|||||||
| 4,800,000 | 0.100 |
November 5, 2015
|
|||||||
| 250,000 | 0.315 |
May 4, 2016
|
|||||||
| 500,000 | 0.250 |
May 16, 2016
|
|||||||
| 300,000 | 0.155 |
September 15, 2016
|
|||||||
| 2,335,000 | 0.080 |
April 24, 2017
|
|||||||
| 1,400,000 | 0.070 |
August 8, 2017
|
|||||||
| 1,000,000 | 0.100 |
May 9, 2018
|
|||||||
| 12,078,750 | |||||||||
As at June 30, 2014, there were no warrants outstanding.
Stock-based compensation
During the six months ended June 30, 2014, the Company recognized stock-based compensation of $1,166 (June 30, 2013 - $64,197) in the statement of operations as a result of incentive stock options granted and vested in the current period. There were no stock options issued during the six months ended June 30, 2014 (June 30, 2013 – 2,100,000).
The weighted average fair value of the options granted in the period was C$Nil (2013 - C$0.07).
The fair value of all compensatory options and warrants granted is estimated on grant date using the Black-Scholes option pricing model. The weighted average assumptions used in calculating the fair values are as follows:
|
2014
|
2013
|
|||||||
|
Risk-free interest rate
|
N/A | 0.62 | % | |||||
|
Expected life
|
N/A |
5 years
|
||||||
|
Volatility
|
N/A | 144.60 | % | |||||
|
Forfeiture rate
|
N/A | 0.00 | % | |||||
|
Dividend rate
|
N/A | 0.00 | % | |||||
|
11.
|
TREASURY STOCK
|
|
Number
|
Amount
|
|||||||
|
Treasury shares, June 30, 2014 and December 31 2013
|
1,033,333 | $ | 1,264,194 | |||||
| 1,033,333 | $ | 1,264,194 | ||||||
Treasury shares comprise shares of the Company which cannot be sold without the prior approval of the TSX.
16
|
EMC Metals Corp.
|
|
(An Exploration Stage Company)
|
|
NOTES TO THE CONDENSED CONSOLIDATED FINANCIAL STATEMENTS
|
|
June 30, 2014
|
|
(Expressed in US Dollars) (Unaudited)
|
|
12.
|
SEGMENTED INFORMATION
|
The Company’s mineral properties are located in Norway and Australia. The Company’s capital assets’ geographic information is as follows:
|
June 30, 2014
|
Norway
|
Australia
|
United States
|
Total
|
||||||||||||
|
Property, plant and equipment
|
$ | - | $ | - | $ | 8,361 | $ | 8,361 | ||||||||
|
Mineral interests
|
203,181 | 2,774,053 | - | 2,977,234 | ||||||||||||
| $ | 203,181 | $ | 2,774,053 | $ | 8,361 | $ | 2,985,595 | |||||||||
|
December 31, 2013
|
Norway
|
Australia
|
United States
|
Total
|
||||||||||||
|
Property, plant and equipment
|
$ | - | $ | - | $ | 10,278 | $ | 10,278 | ||||||||
|
Mineral interests
|
203,181 | 1,410,022 | - | 1,613,203 | ||||||||||||
| $ | 203,181 | $ | 1,410,022 | $ | 10,278 | $ | 1,623,481 | |||||||||
|
13.
|
SUPPLEMENTAL DISCLOSURE WITH RESPECT TO CASH FLOWS
|
|
2014
|
2013
|
|||||||
|
Cash paid during the six months for interest
|
$ | 57,407 | $ | 56,250 | ||||
|
Cash paid during the six months for income taxes
|
$ | - | $ | - | ||||
There were no significant non-cash transactions in either of the six month periods ending June 30, 2014 and June 30, 2013.
|
14.
|
SUBSEQUENT EVENTS
|
Subsequent to June 30, 2014, the Company issued a second tranche of financing of 4,641,236 shares at C$0.085.
On July 25, 2014, the Company granted 3,525,000 stock options to various board members, employees and consultants entitling them to purchase shares at C$0.12. These options had vesting periods ranging from immediate to two years. The life of the granted options ranged from three to five years.
17
Item 2. Management’s Discussion and Analysis of Financial Condition and Results of Operations
The following discussion of the operating results, corporate activities and financial condition of EMC Metals Corp. (hereinafter referred to as “we”, “us”, “EMC”, or the “Company”) and its subsidiaries provides an analysis of the operating and financial results for the three and six months ended June 30, 2014 and and should be read in conjunction with our unaudited interim consolidated financial statements for the six month period ended June 30, 2014, and with the Company’s audited consolidated financial statements and the notes thereto for the year ended December 31, 2013 (the “Annual Statements”).
The interim statements have been prepared in accordance with US Generally Accepted Accounting Principles (“US GAAP”) in accordance with the requirements of U.S. federal securities laws as applicable to the Company, and as permitted under applicable Canadian securities laws. The Company is a reporting company under applicable securities laws in Canada, and in July of 2011 also became a reporting issuer under U.S. federal laws. The reporting currency used in our financial statements is the United States Dollar.
The information contained within this report is current as of August 6, 2014 unless otherwise noted. Additional information relevant to the Company’s activities can be found on SEDAR at www.sedar.com.
Technical information in this MD&A has been reviewed and approved by Willem Duyvesteyn, a Qualified Person as defined by Canadian National Instrument 43-101 (“NI 43-101”). Mr. Duyvesteyn is a director and consultant of EMC Metals.
EMC Corporate Overview
EMC is a specialty metals and alloys company focusing on scandium and other specialty metals. The Company intends to utilize its knowhow and, in certain instances, patented technologies to maximize opportunities in scandium and other specialty metals.
The Company was formed in 2006, under the name Golden Predator Mines Inc. As part of a reorganization and spin-out of the Company’s precious metals portfolio in March 2009, the Company changed its name to EMC Metals Corp. The Company currently trades on the Toronto Stock Exchange under the symbol “EMC”.
In 2013, the Company sold the Springer Mining Company, a tungsten mine and mill in Imlay, Nevada. The sale of this asset allowed the Company to direct its efforts towards the development of its scandium properties.
Our focus of operations is the exploration and development of our specialty metals assets, including the Nyngan scandium deposit located in New South Wales, Australia and the Tørdal scandium/rare earth minerals deposit in Norway. Prior to January 1, 2014, the Company’s principal asset was the Springer Tungsten mine and mill, held by the Springer Mining Company. On September 13, 2013, the Company signed a binding Letter of Intent to sell 100% of the Springer Mining Company entity, its assets and mineral and water rights to America Bullion Royalty Corp., for $5 million cash. The transaction was closed on December 31, 2013.
On February 5, 2010, the Company entered into a Joint Venture Agreement (“JV Agreement”) with Jervois Mining Limited (“Jervois”) to develop the Nyngan scandium property in New South Wales, Australia. The JV Agreement, came into dispute in February 2012, and was settled by the parties in February 2013. That settlement provided for EMC to acquire 100% of the project for A$2.6 million cash, in two installments. EMC has met the total payment obligation and now owns 100% of the project.
During the first half of 2014 EMC focused on financing the final required payments to secure the Nyngan project rights. Those required payments were successfully financed in June, along with additional working capital financings during June and July.
18
Principal Properties Review
Nyngan Scandium Project (NSW, Australia)
On February 5, 2010, EMC entered into an Exploration Joint Venture Agreement (“JV Agreement”) with Jervois Mining Limited (“Jervois”) of Melbourne, Australia (ASX: JRV) to co-develop the Nyngan scandium property in New South Wales, Australia which is commonly referred to as the Nyngan Scandium Project (“Nyngan”). The JV Agreement, gave EMC the right to earn a 50% interest in a joint venture with Jervois, for the purpose of holding and developing Nyngan, provided EMC met certain technical and financial milestones. EMC met all financial requirements and delivered proof of technical milestone achievement to Jervois on February 24, 2012.
On February 27, 2012, Jervois formally rejected EMC’s claim to have met the earn-in conditions specified in the JV. The parties discussed and successfully reached an agreed settlement in February 2013 that resolved all issues in dispute. The terms of the binding settlement provided for the transfer of 100% ownership and control of the Nyngan Project, including the relevant exploration tenements and surface (freehold) land holdings, to the Company, in return for AUD$2.6 million in future cash payments.. The settlement agreement also applied a production royalty on the Nyngan project of 1.7% of sales for products produced from the site, payable to Jervois. The royalty has a 12 year term from first production date, and a 10 tpa scandium oxide production minimum.
EMC has now completed all settlement payments required under its agreement with Jervois, and formal transfer of the Nyngan Project Exploration Tenements is currently underway, with completion of the transfers anticipated later in 2014. The details of the financing associated with the successful payment of these settlement amounts is further described in the quarterly news developments section of this MD&A.
Substantial Nyngan Project metallurgical test work has been completed, and additional work in this area is planned for 2014. EMC intends to produce a Feasibility Study demonstrating project economics and development viability on the project, expected to be completed in the second half of 2015.
Nyngan Property Description and Location
The Nyngan scandium resource is located approximately 500 kilometers northwest of Sydney, Australia. The property consists of two exploration licenses, EL 6009 and EL 6096, which encompass over 9,000 hectares (29.6 sq km). Nyngan is classified as an Australia Property for purposes of financial statement segment information.
The scandium resource is hosted within the lateritic zone of a geologic structure known as the Gilgai Intrusion, one of several Alaskan-type mafic and ultramafic bodies which intrude on the Cambrian-Ordovician metasediments, collectively called the Girilambone Group. This laterite zone, locally up to 60 meters thick, is layered from surface with hematitic clay, followed by limonitic clay, saprolitic clay, weathered bedrock and finally fresh bedrock. The scandium mineralization is concentrated within the hematitic, limonitic, and saprolitic zones with values in excess of 350 ppm scandium.
19
The location of the property is provided in Figure 2 below. The location of the exploration licenses are provided in Figure 3 below.
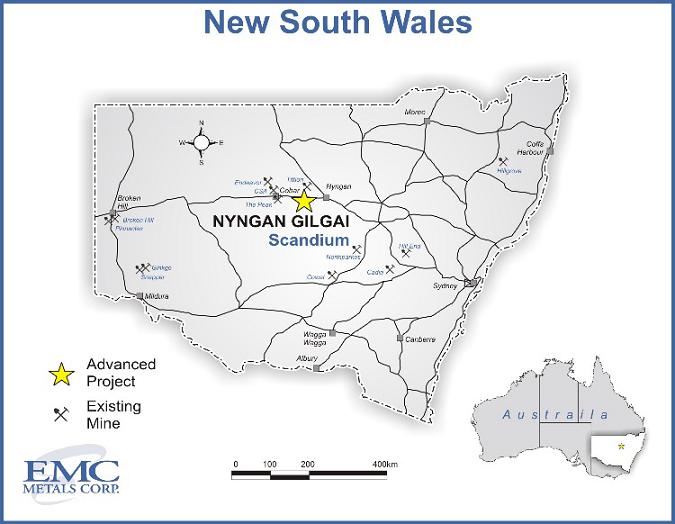
Figure 2: Location of Nyngan Project
20

Figure 3: Location of the Exploration Licenses
21
Nyngan Scandium Project – Development Overview
EMC established rights to the Nyngan Scandium Project in February 2010, and began advancing the project understanding immediately. The first step taken was to establish a NI 43-101 Resource Report on the property for scandium, which was completed and filed on SEDAR in May 2010.
In the two years prior to EMC involvement, EMC’s (former) partner, Jervois Mining Limited (“Jervois”) of Melbourne, had commissioned several metallurgical studies on potential recovery systems for separating scandium from the lateritic clays which contained the resource. EMC adopted and pursued this flow sheet process architecture, in four key work programs:
|
1.
|
Roberts & Schaefer (Utah, USA) was commissioned in 2010 to develop a preliminary, conceptual engineering and economic report for the processing elements of the project. The work was based entirely on prior Jervois-commissioned test work research. No mining or commercial elements of the project were considered, and the accuracy level was +/-50%, done for management only.
|
|
2.
|
Hazen Research (Colorado, USA) was commissioned in 2010 to do bench scale test work to confirm the earlier property test work results provided by Jervois, which it did,
|
|
3.
|
Hazen Research was subsequently commissioned in 2011 to do pilot scale test work to further confirm and optimize the process plant flow sheet, consistent with the acid bake systems, as initially defined, and
|
|
4.
|
SNC-Lavalin (Brisbane, Australia) was commissioned in 2011 to do a feasibility study on the economics and process viability of the Nyngan Scandium Project, to absorb the Hazen test work results, to confirm the project was economic, and to satisfy the primary condition of the JV with Jervois. The SNC Report was done to inform management and the JV partners, and is not public information.
|
The Hazen test work and SNC Report were completed in early 2012. EMC had also commissioned some different test work programs with SGS-Lakefield (Toronto, Canada), using Nyngan resource material, beginning in late 2011 and continuing through 2013. This work focused on high pressure acid leach (HPAL) rather than acid baking with concentrated sulfuric acid, and the results showed more promise for Nyngan resource recoveries and suggested better suitability in the Nyngan locale.
Now that EMC is in full (100%) control of the Nyngan Scandium Project, the Company intends to commission more process test work in 2014, to support a refined and optimized process flow sheet for scandium recovery from the resource. The results of this work will be incorporated into a NI 43-101 Technical Report (feasibility study) for completion in Q3 2015.
Nyngan Property – NI 43-101 Mineral Resource
In March of 2010 a NI 43-101 technical report which outlined a resources estimate on the Nyngan Scandium Project was completed and filed on SEDAR. The resource report, titled, “NI 43-101 Technical Report on the Nyngan Gilgai Scandium Project, Jervois Mining Limited, Nyngan, New South Wales, Australia”, was prepared by or under the supervision of Max Rangott (BSc). The resource estimate is summarized in Table 2 below.
Table 2
|
Nyngan Gilgai Scandium Project Resource Estimation
|
||||
|
Resource
Category
|
Cut off Sc
(ppm)
|
Total Tonnes
(kt)
|
Grade Sc
(ppm)
|
Overburden
Ratio
|
|
Measured
|
100
|
2,718
|
274
|
0.81:1
|
|
Indicated
|
100
|
9,294
|
258
|
1.40:1
|
|
Total
|
100
|
12,012
|
261
|
1.10:1
|
Nyngan Project - Flow Sheet Development Detail
Jervois commissioned various technical reports and studies on the Nyngan property resource in 2008-09. These early technical/process reports were done by METCON Laboratories of Sydney, Australia, the Commonwealth Scientific and Industrial Organization (CSIRO), Australia’s national science agency, and by other research work groups, proprietary to or sourced by Jervois. The CSIRO designed a preliminary processing plant flow sheet, that formed much of the early thinking around processing options at Nyngan.
22
EMC began efforts to duplicate this early work in late 2010, when the Company commissioned Hazen Research, Inc. of Golden, Colorado to review and verify historical work from the Australian groups. In January 2011, EMC announced results of phase I bench scale test work from Hazen that generally confirmed historical findings on conventional acid leach systems, suggesting resource recoveries of up to 75%. No secondary recoveries were considered in these tests.
The second phase of the Hazen test work program, done to pilot plant scale, ran through all of 2011, and involved larger scale testing of the high temperature acid bake water leach systems, solvent extraction systems and product finish systems, as outlined and established by earlier CSIRO work. The overall objectives of this expanded test work program were to define and optimize a process or series of processes that achieved an 80% overall scandium recovery, with lowest possible capital and operating costs, and the most benign environmental impact, using standard and accepted processes.
On January 19, 2012 EMC announced the results of the phase II Hazen test work program. EMC received an independent metallurgical test-work report, titled "Purification of Scandium Extracted from Laterite Ore", outlining the results of a number of pilot-scale tests on Nyngan resource material, and estimated recoveries and grades of scandium oxide product. The report was independently prepared by Hazen and covered the full results of the phase II pilot scale test work programs, completed in late November 2011.
Highlights of the 2011 Hazen phase II pilot scale test work were as follows:
|
·
|
Results of conventional sulfuric acid bake and water leach systems, at atmospheric pressure, demonstrated scandium recoveries averaging 75%,
|
|
·
|
Results of conventional solvent extraction ("SX") on the pregnant leach solution, demonstrated scandium recoveries exceeding 99%,
|
|
·
|
Results on final stage precipitation of scandium oxide, focused on highest combined purity and recovery, demonstrated scandium recoveries of 97.5%, at purity levels of 97.5% Sc2O3,
|
|
·
|
Overall recovery results ranged from 70% to 80%, based on Nyngan ore type (limonite or saprolite), and
|
|
·
|
All process assumptions were based on standard and accepted techniques for ore preparation, leaching, solvent extraction and final product preparation.
|
In late 2011, EMC also commissioned some test work on high pressure acid leach (HPAL) processes, with both Hazen and with SGS-Lakefield (Ontario, Canada). The initial HPAL work was applied to residue from the acid bake process sourced from the earlier Hazen test work, specifically to determine if additional scandium could be effectively recovered in a second pass with a pressure system. Those results were encouraging, and led to later test work in 2012-13 which applied HPAL techniques directly on the laterite resource material. No HPAL research results were included in the report and findings compiled for management by SNC-Lavalin in early 2012. However, the work that subsequently continued on HPAL, after that SNC Report was completed, is expected to be incorporated into future engineering studies and flow sheet strategies for the Nyngan project. Existing HPAL work results were done to bench scale, and not to pilot scale, and will be followed up with further test work in 2014 to confirm suitability as an alternative to acid bake techniques.
Nyngan Project Environmental Permitting
In April, 2011 EMC announced a general progress report on the project which outlined a series of environmental work steps designed to advance the Environmental Impact Study (“EIS”). Work steps included both ground and surface water assessments, along with other assessments of Aboriginal, ecology, traffic, noise and air quality matters.
All of this work has subsequently been completed, including 8 water bores with ongoing test monitoring equipment, and reports on the various other targeted assessments, without material issues in any area. An aerial photography and contour mapping program was also completed, to support the feasibility study work regarding location of site facilities.
On January 18, 2012 EMC announced that that key elements of environmental site work on the Nyngan Scandium Project were completed and a Conceptual Project Development Plan (CPDP) submitted to the NSW, Australia state regulators. The CPDP submission forms the basis for an Environmental Impact Study ("EIS"), the foundation environmental document required for a mining permit in the state.
23
Specific EIS and property work, contained in the CPDP, completed by year end 2011:
|
·
|
Draft ground water assessment study finalized and submitted to regulators,
|
|
·
|
Surface water assessment results favorable, State review ongoing,
|
|
·
|
Aboriginal heritage study finalized, no areas of significance,
|
|
·
|
Soils study finalized, no issues, and
|
|
·
|
Property aerial photography and contour mapping completed, location of site facilities defined.
|
Continuing EIS work underway:
|
·
|
License applications (6), for access to groundwater as generated from property water bores have been submitted,
|
|
·
|
Flora and fauna studies are ongoing; to-date no significant issues have arisen, and
|
|
·
|
Traffic, noise and air quality baseline monitoring are ongoing.
|
The environmental work was performed under direction from R. W. Corkery & Co., (Orange, NSW, Australia), and formed part of the SNC-Lavalin Nyngan feasibility study.
Tørdal Scandium/REE Property (Norway)
During 2011 we entered into two option agreements with REE Mining AS of Norway, to obtain exploration rights to several properties in central and southern Norway. The Tørdal, Evje-Iveland and Hogtuva properties are classified as Norway Property for purposes of financial statement segment information.
Option agreements to acquire the Tørdal and Evje-Iveland exploration properties were entered into in April 2011, followed by an option agreement on the Hogtuva property in September 2011. Both of these agreements were subsequently renegotiated to secure 100% ownership positions for EMC. Based on exploration results and holding costs, the Evje-Iveland and Hogtuva properties were subsequently dropped and the Tørdal property holdings have been reduced from 140 sq km to 90 sq km.
Tørdal Property Location
The location of the Tørdal exploration property is provided in Figure 4 below.

2012 Tørdal Field Exploration
On February 14, 2013 we announced promising results from field exploration work on the Tørdal property during the summer and fall months of 2012, focused on scandium-bearing pegmatites. The 2012 work included independent assay results of pegmatite rock samples taken from one specific property area, and also includes an extensive pegmatite mapping program covering approximately 30 sq km. The assay results indicated the presence of high levels of scandium and various rare earth elements (REE’s), including heavy rare earth elements (HREE’s) in particular. Field XRF readings indicated elevated scandium content in hundreds of large and small pegmatite bodies found and mapped in the reconnaissance area.
24
Highlights of the results of the 2012 field exploration are as follows:
|
·
|
Tørdal 2012 assays of pegmatite rocks show presence of both scandium and REE’s,
|
|
·
|
Best scandium assays exceed 1,600 ppm,
|
|
·
|
Promising HREE assay results from pegmatites with gadolinite mineralization,
|
|
·
|
Host rock mineralization points to higher grade scandium or HREE contents,
|
|
·
|
2012 summer exploration program mapped and sampled over 300 pegmatites,
|
|
·
|
A total of 1,940 Niton XRF scandium readings were taken on whole rock samples, and
|
|
·
|
Overall program results at Tørdal are very encouraging and warrant expanded exploration.
|
Tørdal Assay Results (Grab Samples)
Work originally began on the property in 2011, with a summer exploration program that consisted of reconnaissance, surface soil sampling, and limited pegmatite mapping work in a relatively small area north of the village of Kleppe, in Southern Norway.
As a follow-on from that 2011 program, the company then returned to the same area and conducted a series of ‘blasts’, using small explosive charges to generate whole rock samples on select exposed pegmatites, at the locations of the best soil sample results. The exploration team planned 9 blasts and conducted 8, on 5 different pegmatite bodies, from which they assembled 23 grab samples for analysis and assay by OMAC Laboratories in Ireland. Assay results on these samples were received in Q1 2012—in time to help formulate the 2012 summer/autumn season pegmatite mapping program, conducted on a much wider area.
Independent assay results on 20 of the 23 samples, covering all 5 targeted pegmatites, are shown below.
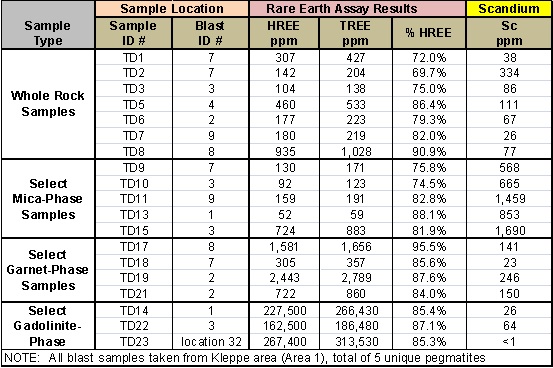
Assay results are as-reported elemental assay results from OMAC Laboratories, and are not converted to oxide equivalent (REO & Sc2O3). Heavy rare earth elements abbreviated “HREE”; and include Yttrium;Total rare earth elements abbreviated “TREE”.
25
The numbered assay samples were formed either by random selection of fresh (un-weathered) whole rock material broken loose from individual pegmatite bodies, or alternatively, based on selectively collecting fresh rock material that was clearly (1) garnet-laden, (2) mica-laden, or showed clear visible (3) gadolinite mineralization. Gadolinite is a beryllium and rare earth-bearing mineral with the chemical formula [(Ce,La,Nd,Y)2FeBe2Si2O10]. The intent was to determine from assay results if certain visible mineralization correlated to the presence and concentrations of target elements; specifically scandium, rare earth elements (REE’s), or other metals of interest and value.
The results in the assay table indicate that all of the selected pegmatites contain interesting levels of both REE’s and scandium. In general, all of the pegmatites contained both target elements, while the mica phase appears to hold the higher scandium concentrations with small REE additions, and the gadolinite phase holds the highest REE concentrations and small scandium additions. The presence of garnet material in samples tended to generate interesting but moderate values for both REE’s and scandium. Assay work was designed to identify 30 specific elements, including all 16 REE elements plus scandium, and the relative concentration of heavy REE’s was of particular interest. The mica and garnet grab sample materials had generally only trace levels of thorium and uranium (average <15 ppm), while the gadolinite grab sample materials had thorium levels between 2,500-5,000 ppm, and uranium levels between 500-1,300 ppm. A full table of OMAC assay results related to these 23 sample analyses is available on EMC’s website at www.emcmetals.com.
Tørdal Pegmatite Mapping Program
Following on from the 2011 work and the 2012 assay results, EMC conducted an expanded 2012 summer work reconnaissance program at both Tørdal and Evje-Iveland, from July through October. The goals of the 2012 program were to develop detailed mapping of outcropping pegmatite fields over a much broader area than the 2011 program, while also conducting field sampling of scandium mineralization on those pegmatites using a hand-held Niton XRF Analyzer.
The 2012 program concentrated on five separate areas (approximately 30 sq km) as can be seen in the map below:

A total of 1,940 Niton XRF readings were logged on whole rock and pegmatite mineral separates, logged against individually mapped and numbered pegmatite bodies. The XRF readings ranged up to +6,000 ppm scandium (on a mineral separate), and averaged 661 ppm on 1,504 total logged readings above the instrument’s 20 ppm detection limit. XRF readings focussed on scandium data collection only, although the team diligently noted the visible presence of gadolinite and amazonite mineralization.
26
The reader is cautioned that hand-held Niton XRF readings are not the same as laboratory assays, and are not NI 43-101 compliant with regard to estimating resource grades. However, the Company is confident that these data readings are highly useful in confirming and shaping the next stage of the exploration program on this property.
A summary of results by area is as follows:
|
·
|
Area 1 (Kleppe); Mapped more than 50 pegmatite bodies. Best average XRF Sc readings from 1,000-1,500 ppm, some very large surface expressions. Gadolinite present.
|
|
·
|
Area 2 (Heftetjern); Partially mapped more than 40 pegmatite bodies, many large surface expressions, green amazonite mineralization. Better XRF Sc readings from 500-1,500 ppm.
|
|
·
|
Area 3 (Solli); Mapped numerous large and small pegmatites. Generally lower XRF Sc readings, ranging 300-700 ppm. Red feldspars, quartz and gadolinite mineralization present.
|
|
·
|
Area 4 (South Kleppsvatn); Partially mapped large area containing more than 80 pegmatites, generally mica-based. Typical XRF Sc readings in the 300-900 ppm range, with some reaching 1,500 ppm Sc.
|
|
·
|
Area 5 (Buvatn); Partially mapped, numerous pegmatite bodies, some very large. Typical XRF Sc readings in the 300-1,000 ppm range. Old feldspar quarries, amonizite mineralization present.
|
Similar work done at Evje-Iveland (total 180 sq km) identified several interesting target areas, but scandium readings were not sufficiently attractive when compared to results at Tørdal, and led to the decision to drop the Evje-Iveland property. The exploration results of the 2012 work program also allowed EMC to selectively reduce property holdings at Tørdal .
Tørdal Exploration – Next Steps
EMC’s mapping and sampling work has confirmed that much of the Tørdal property is heavily populated with complex, near-surface pegmatite bodies. Based on hand-held XRF readings and mineralogy, these pegmatites show excellent promise for significant scandium enrichment, particularly within bodies containing micas, and for REE mineralization where the rare earth silicate gadolinite is present. Based on the results of 2012 exploration work, planning for future exploration work is warranted, subject to funding constraints.
Qualified Person and Quality Assurance/Quality Control
Sampling methods followed industry quality control standards. Mr. Kjell Nilsen, an independent geologist consultant currently employed by EMC, conducted the reconnaissance and sampling on the property. Individual whole rock grab samples were collected by hand shovel, from areas where blasted material could be seen to have come from blast points on pegmatite bodies. The assayed samples were individually bagged, sealed, logged on the grid map as to location, boxed in a container suitable for mailing, and sent by express mail to OMAC Laboratories Limited in Galway, Ireland for testing. Assay testing on the samples utilized an ICP-MS spectrometer (Inductively Coupled Plasma-Mass Spectrometry) to test for numerous elements, specifically scandium. The numerous Niton XRF (X-ray Fluorescence) readings were taken at field locations, logged and identified with individual numbered pegmatites, located on grid maps, by the field geology team. Mr. Willem Duyvesteyn, Chief Technology Officer of EMC, is the Qualified Person who is responsible for the design and conduct of the exploration program, and reviewed the program results.
Honeybugle Scandium Property (NSW, Australia)
On April 2, 2014 the Company announced that it had secured a 100% interest in an exploration license (EL 7977) covering 34.7 square kilometers in New South Wales (NSW), Australia. The license area is located approximately 24 kilometers west-southwest from EMC’s Nyngan Scandium Project and approximately 36 kilometers southwest from the town of Nyngan, NSW. The license held by EMC covers only a part of the Honeybugle geologic complex.
The Honeybugle tenement contains lateritic material common to the region. The property itself is located in semi-arid broad-acre wheat farming country and is routinely planted. Farming is the largest industry in the area, although mining activity is evident, past and present.
The tenement includes four (4) distinct magnetic anomalies; Seaford, Woodlong, Yarran Park and Mallee Valley, which reflect underlying mafic to ultramafic bedrock. These areas were previously identified by groups exploring principally for platinum, nickel and cobalt in the 1980’s, but scandium was of little interest. Surface soil and rock chip sampling conducted by previous license holders and EMC, on each of the four areas, did detect anomalous scandium values that are well above background levels (20-30 ppm). The results of this previous soil sampling work is what led to EMC’s interest in acquiring the Honeybugle exploration tenements.
27
Honeybugle Drill Results
On May 7, 2014 the company announced completion of an initial program of 30 air core (AC) drill holes on the property, specifically at the Seaford anomoly, targeting scandium (Sc). Results on 13 of these holes are shown in detail, in the table below. These holes suggest the potential for scandium mineralization on the property similar to EMC’s Nyngan Scandium property.
Highlights of initial drilling program results:
|
·
|
The highest 3-meter intercept graded 572 ppm scandium (hole EHAC 11)
|
|
·
|
EHAC 11 also generated two additional high grade scandium intercepts, grading 510 ppm and 415 ppm, each over 3 meters,
|
|
·
|
The program identified a 13-hole cluster which was of particular interest;
|
|
·
|
intercepts on these 13 holes averaged 270 ppm scandium over a total 273 meters,
|
|
·
|
at an average continuous thickness of 21 meters per hole,
|
|
·
|
representing a total of 57% (354 meters) of total initial program drilling.
|
|
·
|
The 13 holes produced 29 individual (3-meter) intercepts over 300 ppm, representing 31% of the mineralized intercepts in the 273 meters of interest, and
|
|
·
|
This initial 30-hole AC exploratory drill program generated a total of 620 meters of scandium drill/assay results, over approximately 1 square kilometer on the property.
|
The detail results of 13 holes in the initial drill program are as follows:
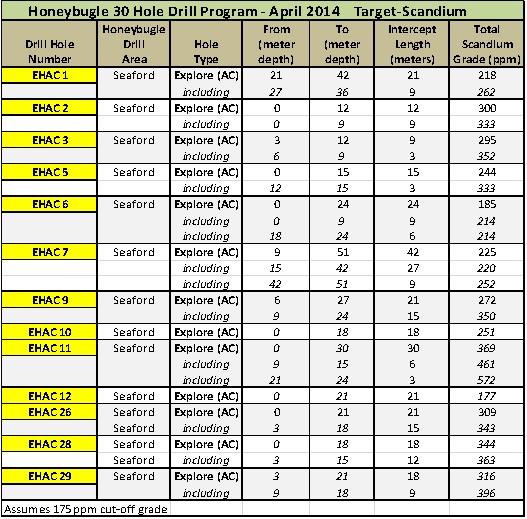
28
Seaford is characterized by extensive outcrops of dry, iron-rich laterites, allowing for a particularly shallow drill program. Thirty (30) air core (AC) holes on nominal 100-meter spacing were planned, over an area of approximately 1 square kilometer. Four holes were halted in under 10 meters depth, based on thin laterite beds, low scandium grades, and shallow bedrock.
The 13 holes highlighted in the table are grouped together on either side of Coffills Lane, and represent all of the drill locations where meaningful intercept thickness generated scandium grades exceeding 175 ppm. Some of these 13 holes showed significant scandium values on the immediate surface, and alternately, other holes exhibited favorable scandium grades that began at shallow depth. The highest grade Sc sample was found in a 21-24 meter interval (572 ppm), although several holes produced better than 350 ppm Sc intercepts at depths of under 9 meters. The deepest hole (EHAC 7) was drilled to 57 meters, showing good scandium grades over a 12-meter horizon (245 ppm) near the bottom of the hole, from 39 to 51 meters depth. Higher scandium grades were associated with higher iron levels. Holes were drilled to a depth where they contacted the fresh ultramafic bedrock, which generally signalled the end of any scandium enrichment zones.
The drill plan divided Seaford into four sub-areas, 1-4, as highlighted on the map below. Area 1 was relatively higher ground and therefore the least impacted by ground moisture. Consequently this dryer area received the greatest attention, although that had been the general intention in the plan. Area 1 received 17 holes, with 13 presented in detail in the table above. Areas 2-4 were each intended as step-out areas that need to be further examined in the next program. The three step-out areas did not generate results of particular note, although hole locations were not optimal due to ground conditions and access.
|
·
|
Area 2 received 3 holes, 60 meters total, and generated Sc grades from 45-75 ppm,
|
|
·
|
Area 3 received 4 holes, 87 meters total, and generated Sc grades from 47-122 ppm,
|
|
·
|
Area 4 received 5 holes, 72 meters total, and generated Sc grades from 60-101 ppm, and
|
|
·
|
The average depth of all of these holes was 18 meters, with the deepest 30 meters.
|
29
Figure 1: Initial Drill Program Map
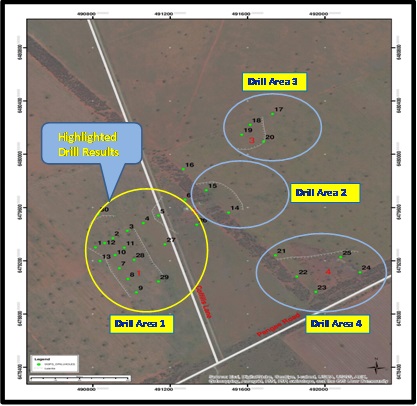
This 13-hole cluster (Area 1) was noted to be in a relatively thick laterite zone which was constrained to the west by contact with metasediments, to the east by fresh ultramafic bedrock, and to some extent in the north by a poor intersection result in hole 30. Area 1 remains somewhat open to the south, with the two southern-most holes (EHAC 9 and EHAC 29) generating some of the best scandium grade intercepts in the area.
The surface and near surface mineralization at this property is an advantage, both in locating areas of interest for future exploration work, and also because of extremely low overburden ratios. This particular characteristic for the Honeybugle property is different to EMC’s Nyngan property, where mineralization is typically covered by 10-20 meters of barren alluvium.
Further drilling at Seaford is warranted, based on the results of this introductory and modest program, specifically to the north and south of the existing area 1 drill pattern, along with investigation and select drilling at the other three remaining anomalies on the property.
Other Developments – Second Quarter 2014
Nyngan Financing: On June 24, 2014 the Company secured a $2,500,000 loan facility with Scandium Investments LLC, a company owned by a U.S. private investor group. The proceeds of the loan were used to extinguish all outstanding financial obligations related to a February 2013 negotiated settlement arrangement securing rights to the Nyngan Scandium Project. In this regard, the Company repaid $1,200,000 in maturing indebtedness on existing debt, and used the remaining loan proceeds to pay the final AUS$1,400,000 installment of the Nyngan settlement payment due June 30, 2014.
30
The loan has a maturity date of December 24, 2015 and bears loan interest that increases in quarterly increments from 4% to a maximum of 12%, and is secured with both the Nyngan and Honeybugle assets. The full loan can be converted into an effective 20% JV project interest in Nyngan and Honeybugle, and automatically converts at such time as EMC raises $3 million in equity for investment in the projects.
The 20% JV partner has a carried interest in project development until EMC meets two milestones: (1) filing a feasibility study on SEDAR, and (2) receiving a mining license on either JV property. At milestone completion, the JV partner either 1) becomes fully participating on development and build costs, or 2) exercises a one-time option to convert their project interest into an equivalent value of EMC shares, at market prices.
Private Placement: On July 11, 2014 the Company announced completion of a two tranche private placement for a total of C$1,279,814 in gross proceeds, at a price of C$0.085 per share. A total of 15,056,632 shares were issued. The Company paid finders' fees of approximately C$32,600 on the transaction.
New EMC Board Director: On July 17, 2014 the Company announced that Mr. James R. Rothwell had been appointed to the EMC Board as an independent Director. Mr. Rothwell has held numerous senior management roles and board positions in Canadian public mining companies, including Chairman of Shore Gold Inc. and Kensington Resources Ltd., Board Director for Motapa Diamonds Inc. and President, CEO and Director of Inca Pacific Resources and Dia Met Minerals Ltd. Prior to these Canadian company positions, he served for 27 years with Utah International and BHP in a number of business roles in the US, Canada, Brazil and Australia. He has served on minerals industry associations in Australia, the USA and Canada. Mr. Rothwell has a BA (Economics) and an MBA (Finance/Accounting) from Stanford University.
Stock Option Grants: On July 25, 2014 the Company granted 3,375,000 stock options at an exercise price of C$0.12 per share, exercisable until July 25, 2019, to directors, officers, and employees of the Company and 150,000 stock options at an exercise price of C$0.12 per share, exercisable until July 25, 2017, to consultants of the Company.
Preliminary Economic Assessment On Nyngan Scandium Project: On August 7, 2014 the Company announced that it selected the engineering firm Larpro Pty Ltd, of Brisbane, Australia, to prepare a preliminary economic assessment (PEA) on the Nyngan Scandium Project, expected to be completed in Q4, 2014.
Operating results-Revenues and Expenses
The Company’s results reflect lower operating costs as the focus of business has turned to its scandium projects.
Summary of quarterly results
|
2014
|
2013 |
2012
|
||||||
|
Q2
|
Q1
|
Q4
|
Q3
|
Q2
|
Q1
|
Q4
|
Q3
|
|
| Net Sales |
-
|
-
|
-
|
-
|
-
|
-
|
-
|
-
|
|
Net Income
(loss)
|
(221,294)
|
(271,804)
|
(2,197,558)
|
(22,060,858)
|
(521,895)
|
(910,288)
|
(1,623,015)
|
(1,148,216)
|
|
Basic and diluted
Net Income
(Loss) per share
|
(0.00)
|
(0.00)
|
(0.02)
|
(0.13)
|
(0.00)
|
(0.01)
|
(0.01)
|
(0.01)
|
31
Results of Operations for the three months ended June 30, 2014
The net loss for the quarter was $221,294, a decrease of $300,601 from $521,895 in the same quarter of the prior year. Details of the individual items contributing to the decreased net loss are as follows:
|
Q2 2014 vs. Q2 2013 - Variance Analysis
|
||
|
Item
|
Variance Favourable /
(Unfavourable)
|
Explanation
|
|
Interest expense
|
$130,761
|
The Company reduced its debt load from one year ago with the sale of the Springer operations in the second half of 2013. The lower debt resulted in lower interest costs in the current quarter.
|
|
Loss from discontinued operations
|
$88,609
|
The Company’s results from one year ago included the costs of the Springer mine which was sold in the second half of 2013.
|
|
Stock-based compensation
|
$43,165
|
The Company has not issued any stock options since Q2 of 2013. All expensing of issued options was completed in Q1 of 2014. In the corresponding quarter of 2013 options were issued that were expensed immediately resulting the higher costs one year ago.
|
|
Consulting
|
$33,365
|
Consulting in the pursuit of the Springer mine and mill sale in Q2 2013 resulted in the higher consulting costs when compared to Q2 2014. No such costs were incurred in 2014.
|
|
Salaries and benefits
|
$47,872
|
Decreased salary expenses in Q2 2014 relate to the Company’s decision to forgo salaries for key executives to reduce costs in efforts to conserve capital.
|
|
Insurance
|
$7,834
|
In Q2 2014 the Company received a refund on workers compensation premiums charged in the prior year. This adjustment resulted in current charges being lower than in the Q2 2013.
|
|
General and administrative
|
$5,190
|
Lower overall activity in Q2 2014 resulted in this favorable variance.
|
|
Exploration
|
$1,409
|
In both comparative quarters very little activity took place. Spending in Q2 2014 was only $635 as compared to $2,044 in Q2 of 2013.
|
|
Amortization
|
$115
|
Lower amortization is reflective of the fact that the assets held in our Sparks office are declining in value.
|
|
Travel and entertainment
|
$(304)
|
The cost differential between comparative quarters is minimal where spending in the current quarter was $5,176 compared to $4,872 one year ago.
|
|
Foreign exchange gain
|
$(26,744)
|
In Q2 of 2013 the Canadian dollar strengthened against the US dollar making those assets held in Canadian dollars worth more when converted to US$. In Q2 2014 there was still some strengthening against the US dollar but not to the same level as one year ago.
|
|
Professional fees
|
$(30,671)
|
Unfavorable variance is due to legal fees incurred in association with June 2014 loan financing transaction. No such costs were incurred in Q2 2013.
|
32
Results of Operations for the six months ended June 30, 2014
The net loss for the six month period was $493,098, a decrease of $939,085 from $1,432,183 in the same six month period of the prior year. Details of the individual items contributing to the decreased net loss are as follows:
|
Six months ending June 30, 2014 vs. six months ending June 30, 2013 - Variance Analysis
|
||
|
Item
|
Variance Favourable /
(Unfavourable)
|
Explanation
|
|
Exploration
|
$255,724
|
In 2014 the Company carried out a small exploration program at its Honeybugle operation resulting in costs of $53,391. In the prior year funds were expended to secure the Nyngan project in Australia resulting in the cost differential between the two comparative periods.
|
|
Interest expense
|
$247,040
|
In 2013 the Company was making interest payments on the loan taken out in February of 2012. The loan matured in August 2013 and the sale of the Springer operation was used to extinguish that debt. Smaller financings were taken subsequent which has resulted in lower financing costs.
|
|
Loss from discontinued operations
|
$196,397
|
The Company’s results from one year ago included the costs of the Springer mine which was sold in the second half of 2013.
|
|
Salaries and benefits
|
$93,580
|
Decreased salary expenses in 2014 are as a result of the Company’s decision to forgo salaries for key executives in efforts to conserve capital.
|
|
Consulting
|
$68,653
|
Consulting in the pursuit of the Springer mine and mill sale in 2013 resulted in the higher consulting costs when compared to 2014. No such costs were incurred in 2014.
|
|
Stock-based compensation
|
$63,031
|
The Company has not issued any stock options since Q2 of 2013. All expensing of issued options was completed in Q1 of 2014.
|
|
General and administrative
|
$33,115
|
Lower overall activity in 2014 has resulted in this favorable variance.
|
|
Insurance
|
$8,567
|
In 2014 the Company received a refund on workers compensation premiums charged in the prior year. This adjustment resulted in current charges being lower than in 2013.
|
|
Travel and entertainment
|
$1,276
|
Lower operational activity in 2014 when compared with 2013 resulted in this favorable variance.
|
|
Amortization
|
$232
|
Lower amortization is reflective of the fact that the assets held in our Sparks office are declining in value.
|
|
Professional fees
|
$(4,871)
|
Unfavorable variance is due to legal fees incurred in association with June 2014 loan financing transaction. No such costs were incurred in Q2 2013.
|
|
Foreign exchange gain
|
$(23,659)
|
In of 2013 the Canadian dollar strengthened against the US dollar making those assets held in Canadian dollars worth more when converted to US$. In 2014 there was still some strengthening against the US dollar but not to the same level as one year ago.
|
33
Cash flow discussion for the six month period ended June 30, 2014 compared to June 30, 2013
The cash outflow for operating activities was $284,741, a decrease of $554,873 (June 30, 2013 – $839,614), due to decreased activity levels as described in the variance analysis in addition to an increase in accounts payable and the collection of accounts receivable during the period.
Cash outflows for investing activities were $1,214,163, an increase of $105,679 (June 30, 2013 – $1,108,484), principally due to the final payment made to secure the Nyngan project which was larger than the Nyngan payment made in 2013.
Cash inflows from financing activities decreased by $354,635 to $1,494,540 (June 30, 2013 - $1,849,175), reflecting the repayment of a convertible debenture of $650,000 and a promissory note of $1,204,875 which was partially offset by the issuance of share capital bringing in $849,415. In Q1 2013, the Company took out the $650,000 convertible loan and the promissory note of $1,204,875.
Financial Position
Cash and restricted cash
The Company’s cash position decreased during the six month period by $4,364 to $780,711 (December 31, 2013 - $785,075) primarily due to the repayment of a convertible debenture in the amount of $650,000 and a promissory note of $1,204,874. This was partially offset by the issuance of share capital netting the Company $849,415.
Prepaid expenses and receivables
Accounts receivable decreased by $103,950 to $23,460 due primarily to the receipt of cash early in January on the finalization of the Springer sale (December 31, 2013 - $127,410).
Subscription receivable
The increase in subscription receivable relates to the fact that C$250,000 of the private placement issued in June 2014 was not received until July 2014.
Property, plant and equipment
Property, plant and equipment consists of office furniture and computer equipment at the Sparks, Nevada office. The decrease of $1,917 to $8,361 (December 2013 - $10,278) is due to amortization of net fixed assets.
34
Mineral interests
Mineral interests increased by $1,364,031 to $2,977,234 due to the final payment to acquire the Nyngan property in Australia of A$1,400,000 (December 31, 2013 - $1,613,203).
Accounts Payable
Accounts Payable has increased by $101,324 to $348,937 (December 2013 – $247,613) due to a deferral of salary payments for key staff members.
Convertible Debenture
Convertible debentures decreased by $650,000 to $Nil (December 31, 2013 - $650,000) due to the repayment of a convertible debenture taken out in Q1 of 2013.
Promissory notes payable
The promissory notes payable increased by $1,295,125 due to the negotiation of a new loan of $2,500,000 which was partially offset by the repayment of the prior promissory note of $1,204,875 (December 31, 201 - $1,204,875).
Capital Stock
Capital stock increased by $1,083,590 to $88,394,298 (December 31, 2013 - $87,310,708) as a result of a stock issuance in the period.
Additional paid-in capital increased by $1,166, to $2,109,493 (December 31, 2013 - $2,108,327) as a result of expensing of stock options.
Liquidity and Capital Resources
At June 30, 2014, the Company had a working capital deficit of $1,810,591 including cash of $780,711 as compared to a working capital deficit of $1,190,003 including cash of $785,075 at December 31, 2013.
At June 30, 2014, the Company had a total of 12,078,750 stock options exercisable between CAD$0.05 and CAD$0.315 that have the potential upon exercise to generate a total of C$1,330,238 in cash over the next four years. There is no assurance that these securities will be exercised.
The Company’s continued development is contingent upon its ability to raise sufficient financing both in the short and long term. There are no guarantees that additional sources of funding will be available to the Company; however, management is committed to pursuing all possible sources of financing in order to execute its business plan. The Company continues its cost cutting measures to conserve cash to meet its operational obligations.
Outstanding share data
At the date of this report, the Company has 193,070,379 issued and outstanding common shares and 15,603,750 stock options currently outstanding at a weighted average exercise price of CAD$0.11.
Off-balance sheet arrangements
At June 30, 2014, the Company had no material off-balance sheet arrangements such as guarantee contracts, contingent interest in assets transferred to an entity, derivative instruments obligations or any obligations that trigger financing, liquidity, market or credit risk to the Company.
Transactions with related parties
Accounts payable on June 30, 2014 included $91,835 owed to related parties. Accounts payable on December 31, 2013 included $170,000 owed to related parties.
A total of $350,000 from the loan financing completed on February 22, 2013, $579,875 from the loan financing completed on June 24, 2013 and all of the $100,000 financing completed on August 27, 2013, were funded from a combination of Directors, insiders, and independent shareholders. The Company has paid $78,500 in interest to related parties relating to these loans.
35
A $100,000 loan financing completed in 2013 was from directors and officers. The loan was repaid in full in 2013.
The loan financing completed on February 22, 2013, of which $350,000 was contributed from directors and officers, was repaid in the six months ending June 30, 2014.
Of the $57,407 interest expensed in the three months, $14,375 related to a director of the Company.
During the six months ended June 30, 2013, the Company accrued expenses for consulting fees of $51,000 payable to one of its directors. There were $8,500 in consulting fees incurred during the six month period ended June 30, 2014.
Proposed Transactions
There are no proposed transactions outstanding other than as disclosed.
Critical Accounting Estimates
The preparation of financial statements in conformity with generally accepted accounting policies requires management of the Company to make estimates and assumptions that affect the reported amounts of assets and liabilities at the date of the financial statements and the reported amounts of revenues and expenses during the reporting period. These estimates are based on past experience, industry trends and known commitments and events. By their nature, these estimates are subject to measurement uncertainty and the effects on the financial statements of changes in such estimates in future periods could be significant. Actual results will likely differ from those estimates.
Stock-based compensation
The Company uses the Black-Scholes option pricing model to calculate the fair value of stock options and compensatory warrants granted. This model is subject to various assumptions. The assumptions the Company makes will likely change from time to time. At the time the fair value is determined; the methodology the Company uses is based on historical information, as well as anticipated future events. The assumptions with the greatest impact on fair value are those for estimated stock volatility and for the expected life of the instrument.
Future income taxes
The Company accounts for tax consequences of the differences in the carrying amounts of assets and liabilities and their tax bases using tax rates expected to apply when these temporary differences are expected to be settled. When the future realization of income tax assets does not meet the test of being more likely than not to occur, a valuation allowance in the amount of the potential future benefit is taken and no future income tax asset is recognized. The Company has taken a valuation allowance against all such potential tax assets.
Mineral properties and exploration and development costs
The Company capitalize the costs of acquiring mineral rights at the date of acquisition. After acquisition, various factors can affect the recoverability of the capitalized costs. The Company’s recoverability evaluation of our mineral properties and equipment is based on market conditions for minerals, underlying mineral resources associated with the assets and future costs that may be required for ultimate realization through mining operations or by sale. The Company is in an industry that is exposed to a number of risks and uncertainties, including exploration risk, development risk, commodity price risk, operating risk, ownership and political risk, funding and currency risk, as well as environmental risk. Bearing these risks in mind, the Company has assumed recent world commodity prices will be achievable. The Company has considered the mineral resource reports by independent engineers on the Nyngan project in considering the recoverability of the carrying costs of the mineral properties. All of these assumptions are potentially subject to change, out of our control, however such changes are not determinable. Accordingly, there is always the potential for a material adjustment to the value assigned to mineral properties and equipment.
36
Recently Adopted Accounting Policies
Accounting Standards Update 2013-05 - Foreign Currency Matters (Topic 830) - Parent’s Accounting for the Cumulative Translation Adjustment upon Derecognition of Certain Subsidiaries or Groups of Assets within a Foreign Entity or of an Investment in a Foreign Entity. This standard provides guidance with respect to the treatment of the cumulative translation adjustment upon the sale of a foreign subsidiary whereby the cumulative translation adjustment associated with that subsidiary are taken into net income of the parent company.
Accounting Standards Update 2013-11 - Income Taxes (Topic 740) - Presentation of an Unrecognized Tax Benefit When a Net Operating Loss Carry forward, a Similar Tax Loss, or a Tax Credit Carry forward Exists. This accounting standard deals with the treatment of tax loss carry forwards. The Company has reviewed this standard and has determined that it has little impact on the presentation of its financial statements.
Recent Accounting Pronouncements
Accounting Standards Update 2014-08 - Presentation of Financial Statements (Topic 205) and Property, Plant, and Equipment (Topic 360) Reporting Discontinued Operations and Disclosures of Disposals of Components of an Entity. This accounting pronouncement provides guidance on the treatment of Property, Plant and Equipment plus the reporting of discontinued operations and disclosure of disposals of components of an entity. The policy is effective December 15, 2014. The Company is evaluating this guidance and believes it will have little impact on the presentation of its financial statements.
Financial instruments and other risks
The Company’s financial instruments consist of cash, receivables, accounts payable and accrued liabilities, convertible debentures and promissory notes payable. It is management's opinion that the Company is not exposed to significant interest, currency or credit risks arising from its financial instruments. The fair values of these financial instruments approximate their carrying values unless otherwise noted. The Company has its cash primarily in one commercial bank in Vancouver, British Columbia, Canada.
Risk Factors
Prior to making an investment decision investors should consider the investment risks set out below and those described elsewhere in this document, which are in addition to the usual risks associated with an investment in a business at an early stage of development. The directors of the Company consider the risks set out below to be the most significant to potential investors in the Company, but are not all of the risks associated with an investment in securities of the Company. If any of these risks materialize into actual events or circumstances or other possible additional risks and uncertainties of which the Directors are currently unaware, or which they consider not to be material in relation to the Group's business, actually occur, the Group's assets, liabilities, financial condition, results of operations (including future results of operations), business and business prospects, are likely to be materially and adversely affected. In such circumstances, the price of the Company’s securities could decline and investors may lose all or part of their investment.
EMC Will Require Significant Amounts of Additional Capital in the Future
The Company has limited financial resources. The Company will continue to make substantial capital expenditures related to exploration, development and production. In particular the Company may be obligated to pay a Promissory note, maturing in December 2015, in the amount of $2,500,000. The Company will have further capital requirements as it proceeds to expand its present exploration activities at its mineral projects, or to take advantage of opportunities for acquisitions, joint ventures or other business opportunities that may be presented to it.
In addition, the Company may incur major unanticipated liabilities or expenses. There can be no assurance that the Company will be able to obtain necessary financing in a timely manner on commercially acceptable terms, if at all.
Volatile demand for metals and the volatile prices for metals may make it difficult or impossible for the Company to obtain debt financing or equity financing on commercially acceptable terms or at all. Failure to obtain such additional financing could result in delay or indefinite postponement of further exploration and development of its tungsten and other mineral projects with the possible loss of the rights to such properties. If exploration or the development of any mine is delayed, such delay would have a material and adverse effect on the Company’s business, financial condition and results of operation.
37
Stage of Development
The Company’s properties are in the exploration stage and the Company does not have an operating history. Exploration and development of mineral resources involves a high degree of risk and few properties which are explored are ultimately developed into producing properties. The amounts attributed to the Company’s interest in its properties as reflected in its financial statements represent acquisition and exploration expenses and should not be taken to represent realizable value. There is no assurance that the Company’s exploration and development activities will result in any discoveries of commercial bodies of ore. The long-term profitability of the Company’s operations will be in part directly related to the cost and success of its exploration programs, which may be affected by a number of factors such as unusual or unexpected geological formations, and other conditions. As a result of the Company’s lack of operating history, it also faces many of the risks inherent in starting a new business.
Profitability of Operations
The Company is not currently operating profitably and it should be anticipated that it will operate at a loss at least until such time as production is achieved from one of the Company’s properties, if production is, in fact, ever achieved. The Company has never earned a profit. Investors also cannot expect to receive any dividends on their investment in the foreseeable future.
Mineral Industries Competition is Significant
The international mineral industries are highly competitive. The Company will be competing against competitors that may be larger and better capitalized, have state support, have access to more efficient technology, and have access to reserves of mineral that are cheaper to extract and process. As such, no assurance can be given that the Company will be able to compete successfully with its industry competitors.
Fluctuations in Metal Prices
Although the Company does not hold any known mineral reserves of any kind, its future revenues, if any, are expected to be in large part derived from the future mining and sale of metals or interests related thereto. The prices of these commodities have fluctuated widely, particularly in recent years, and are affected by numerous factors beyond the Company’s control including international economic and political conditions, expectations of inflation, international currency exchange rates, interest rates, global or regional consumption patterns, speculative activities, levels of supply and demand, increased production due to new mine developments and improved mining and production methods, availability and costs of metal substitutes, metal stock levels maintained by producers and others and inventory carrying costs. The effect of these factors on the prices of metals, and therefore the economic viability of the Company’s operations, cannot be accurately predicted.
Depending on the price obtained for any minerals produced, the Company may determine that it is impractical to commence or continue commercial production.
EMC Metals Corp.’s Operations are Subject to Operational Risks and Hazards Inherent in the Mining Industry
The Company’s business is subject to a number of inherent risks and hazards, including environmental pollution; accidents; industrial and transportation accidents, which may involve hazardous materials; labor disputes; power disruptions; catastrophic accidents; failure of plant and equipment to function correctly; the inability to obtain suitable or adequate equipment; fires; blockades or other acts of social activism; changes in the regulatory environment; impact of non-compliance with laws and regulations; natural phenomena, such as inclement weather conditions, underground floods, earthquakes, pit wall failures, ground movements, tailings, pipeline and dam failures and cave-ins; and encountering unusual or unexpected geological conditions and technical failure of mining methods.
There is no assurance that the foregoing risks and hazards will not result in damage to, or destruction of, the Company’s mineral properties, personal injury or death, environmental damage, delays in the Company’s exploration or development activities, costs, monetary losses and potential legal liability and adverse governmental action, all of which could have a material and adverse effect on the Company’s future cash flows, earnings, results of operations and financial condition.
38
Mineral Reserve and Resource Estimates are Only Estimates and May Not Reflect the Actual Deposits or the Economic Viability of Tungsten, Scandium and/or Gold Extraction
Reserve and resource figures included for minerals are estimates only and no assurances can be given that the estimated levels of minerals will actually be produced or that the Company will receive the metal prices assumed in determining its reserves. Such estimates are expressions of judgment based on knowledge, mining experience, analysis of drilling and exploration results and industry practices. Estimates made at any given time may significantly change when new information becomes available or when parameters that were used for such estimates change. While the Company believes that the resource estimates included are well established and reflect management's best estimates, by their nature resource estimates are imprecise and depend, to a certain extent, upon statistical inferences which may ultimately prove unreliable. Furthermore, market price fluctuations in metals, as well as increased capital or production costs or reduced recovery rates, may render ore reserves containing lower grades of mineralization uneconomic and may ultimately result in a restatement of reserves. The extent to which resources may ultimately be reclassified as proven or probable reserves is dependent upon the demonstration of their profitable recovery. The evaluation of reserves or resources is always influenced by economic and technological factors, which may change over time.
Exploration, Development and Operating Risk
The exploration for and development of mineral properties involves significant risks which even a combination of careful evaluation, experience and knowledge may not eliminate. While the discovery of an ore body may result in substantial rewards, few properties which are explored are ultimately developed into producing mines. Major expenses may be required to locate and establish mineral reserves, to develop metallurgical processes and to construct mining and processing facilities at a particular site. Whether a mineral deposit will be commercially viable depends on a number of factors, some of which are: the particular attributes of the deposit, such as size, grade and proximity to infrastructure; metal prices, which are highly cyclical, drilling and other related costs which appear to be rising; and government regulations, including regulations relating to prices, taxes, royalties, land tenure, land use, importing and exporting of minerals and environmental protection. The exact effect of these factors cannot be accurately predicted, but the combination of these factors may result in the Company not receiving an adequate return on invested capital.
Currency Risk
The Company maintains accounts in Canadian and American currency. The Company’s equity financings are sourced in Canadian dollars but for the most part it incurs its expenditures in local currencies or in US dollars. The Company’s operations are subject to foreign currency fluctuations and such fluctuations may materially affect the Company’s financial position and results. The Company does not engage in currency hedging activities.
Environmental Risks and Hazards
All phases of the Company’s operations are subject to environmental regulation in the jurisdictions in which it operates. These regulations mandate, among other things, the maintenance of air and water quality standards and land reclamation. They also set forth limitations on the general, transportation, storage and disposal of solid and hazardous waste. Environmental legislation is evolving in a manner which will require stricter standards and enforcement, increased fines and penalties for non-compliance, more stringent environmental assessments of proposed projects and a heightened degree of responsibility for companies and their officers, directors and employees. There is no assurance that future changes in environmental regulation, if any, will not adversely affect the Company’s operations. Environmental hazards may exist on the properties which are unknown to the Company at present and which have been caused by previous or existing owners or operators of the properties. Reclamation costs are uncertain and planned expenditures estimated by management may differ from the actual expenditures required.
Government Regulation
The Company’s mineral exploration and planned development activities are subject to various laws governing prospecting, mining, development, production, taxes, labor standards and occupational health, mine safety, toxic substances, land use, water use, land claims of local people and other matters. Although the Company believes its exploration and development activities are currently carried out in accordance with all applicable rules and regulations, no assurance can be given that new rules and regulations will not be enacted or that existing rules and regulations will not be applied in a manner which could limit or curtail production or development.
39
Many of the mineral rights and interests of the Company are subject to government approvals, licenses and permits. Such approvals, licenses and permits are, as a practical matter, subject to the discretion of applicable governments or governmental officials. No assurance can be given that the Company will be successful in maintaining any or all of the various approvals, licenses and permits in full force and effect without modification or revocation. To the extent such approvals are required and not obtained, the Company may be curtailed or prohibited from continuing or proceeding with planned exploration or development of mineral properties. Failure to comply with applicable laws, regulations and permitting requirements may result in enforcement actions thereunder, including orders issued by regulatory or judicial authorities causing operations to cease or be curtailed, and may include corrective measures requiring capital expenditures, installation of additional equipment or remedial actions. Parties engaged in mining operations or in the exploration or development of mineral properties may be required to compensate those suffering loss or damage by reason of the mining activities and may have civil or criminal fines or penalties imposed for violations or applicable laws or regulations.
Amendments to current laws and regulation governing operations or more stringent implementation thereof could have a substantial impact on the Company and cause increases in exploration expenses, capital expenditures or production costs or reduction in levels of production at producing properties or require abandonment or delays in development of new mining properties.
EMC has no History of Mineral Production or Mining Operations
The Company has never had mineral producing properties. There is no assurance that commercial quantities of minerals will be discovered at the Properties or other future properties nor is there any assurance that the Company’s exploration program thereon will yield positive results. Even if commercial quantities of minerals are discovered, there can be no assurance that any property of the Company will ever be brought to a stage where mineral resources can profitably be produced therefrom. Factors which may limit the ability of the Company to produce mineral resources from its properties include, but are not limited to, the spot prices of metals, availability of additional capital and financing and the nature of any mineral deposits.
The Company does not have a history of mining operations and there is no assurance that it will produce revenue, operate profitably or provide a return on investment in the future.
Future Sales of Common Shares by Existing Shareholders
Sales of a large number of Common Shares in the public markets, or the potential for such sales, could decrease the trading price of the Common Shares and could impair the Company’s ability to raise capital through future sales of Common Shares. Substantially all of the Common Shares can be resold without material restriction in Canada.
No Assurance of Titles or Borders
The acquisition of the right to exploit mineral properties is a very detailed and time consuming process. There can be no guarantee that the Company has acquired title to any such surface or mineral rights or that such rights will be obtained in the future. To the extent they are obtained, titles to the Company’s surface or mineral properties may be challenged or impugned and title insurance is generally not available. The Company’s surface or mineral properties may be subject to prior unregistered agreements, transfers or claims and title may be affected by, among other things, undetected defects. Such third party claims could have a material adverse impact on the Company’s operations.
Information Regarding Forward-Looking Statements
This Management’s Discussion and Analysis of Financial Condition and Results of Operations contain certain forward-looking statements. Forward-looking statements include but are not limited to those with respect to the prices of metals, the estimation of mineral resources and reserves, the realization of mineral reserve estimates, the timing and amount of estimated future production, costs of production, capital expenditures, costs and timing of the development of new deposits, success of exploration activities, permitting time lines, currency fluctuations, requirements for additional capital, Government regulation of mining operations, environmental risks, unanticipated reclamation expenses, title disputes or claims and limitations on insurance coverage and the timing and possible outcome of pending litigation. In certain cases, forward-looking statements can be identified by the use of words such as “plans”, “expects” or “does not expect”, “is expected”, “estimates”, “intends”, “anticipates” or “does not anticipate”, or “believes” or variations of such words and phrases, or statements that certain actions, events or results “may”, “could”, “would”, or “will” be taken, occur or be achieved. Forward-looking statements involve known and unknown risks, uncertainties and other factors which may cause the actual results, performance or achievements of EMC to be materially different from any future results, performance or achievements expressed or implied by the forward-looking statements. Such risks and uncertainties include, among others, the actual results of current exploration activities, conclusions or economic evaluations, changes in project parameters as plans continue to be refined, possible variations in grade and or recovery rates, failure of plant, equipment or processes to operate as anticipated, accidents, labor disputes or other risks of the mining industry, delays in obtaining government approvals or financing or incompletion of development or construction activities, risks relating to the integration of acquisitions, to international operations, and to the prices of metals. While EMC has attempted to identify important factors that could cause actual actions, events or results to differ materially from those described in forward-looking statements, there may be other factors that cause actions, events or results not to be as anticipated, estimated or intended. There can be no assurance that forward-looking statements will prove to be accurate, as actual results and future events could differ materially from those anticipated in such statements. Accordingly, readers should not place undue reliance on forward-looking statements. EMC expressly disclaims any intention or obligation to update or revise any forward-looking statements, whether as a result of new information, future events or otherwise.
40
Item 3. Quantitative and Qualitative Disclosures About Market Risk
Not applicable.
Item 4. Controls and Procedures
Disclosure Controls and Procedures
At the end of the period covered by this Quarterly Report on Form 10-Q for the six months ended June 30, 2014, an evaluation was carried out under the supervision of and with the participation of the Company's management, including the Chief Executive Officer ("CEO") and Chief Financial Officer ("CFO"), of the effectiveness of the design and operation of the Company's disclosure controls and procedures (as defined in Rule 13a-15(e) and Rule 15d-15(e) under the Exchange Act). It is the responsibility of the Company’s management for establishing and maintaining adequate internal control over financial reporting for the Company.
The Company took into consideration the following three characteristics common to companies of a similar size:
|
·
|
The limited number of personnel in smaller companies, which constrains the Company’s ability to fully segregate conflicting duties;
|
|
·
|
The Company relies on an active Board and management with open lines of communication to maintain the effectiveness of the Company’s disclosure controls and procedures; and
|
|
·
|
The dynamic and evolving nature of smaller companies, which limits their ability to have static processes that are well-documented.
|
In addition, management has relied upon certain informal procedures and communication, and upon “hands-on” knowledge of senior management to maintain the effectiveness of disclosure controls and procedures.
Based on that evaluation, the CEO and the CFO have concluded that as of the end of the period covered by this report, the Company's disclosure controls and procedures and internal control over financial reporting are effective in ensuring that: (i) information required to be disclosed by the Company in reports that it files or submits to the SEC under the Securities Exchange Act of 1934 is recorded, processed, summarized and reported within the time periods specified in applicable rules and forms and (ii) material information required to be disclosed in our reports filed under the Securities Exchange Act of 1934 is accumulated and communicated to our management, including our CEO and CFO, as appropriate, to allow for accurate and timely decisions regarding required disclosure.
Changes in Internal Control over Financial Reporting
During the period covered by this report, there were no changes to internal control over financial reporting that materially affected or are reasonably likely to materially affect our internal control over financial reporting.
41
PART II – OTHER INFORMATION
Item 1. Legal Proceedings
Not applicable.
Item 6. Exhibits
42
SIGNATURES
Pursuant to the requirements of the Securities Exchange Act of 1934, the registrant has duly caused this report to be signed on its behalf by the undersigned thereunto duly authorized.
|
EMC METALS CORP.
(Registrant)
|
|||
|
Date: August 8, 2014
|
By:
|
/s/ George Putnam | |
| George Putnam | |||
|
Principal Executive Officer
|
|||
| By: | /s/ Edward Dickinson | ||
| Edward Dickinson | |||
| Principal Financial Officer | |||
43