Attached files
| file | filename |
|---|---|
| EXCEL - IDEA: XBRL DOCUMENT - CST BRANDS, INC. | Financial_Report.xls |
| EX-32.01 - EXHIBIT 32.1 - CST BRANDS, INC. | exhibit321.htm |
| EX-31.02 - EXHIBIT 31.2 - CST BRANDS, INC. | exhibit312.htm |
| EX-32.02 - EXHIBIT 32.2 - CST BRANDS, INC. | exhibit322.htm |
| EX-10.01 - EXHIBIT 10.1 - CST BRANDS, INC. | exhibit101.htm |
| EX-31.01 - EXHIBIT 31.1 - CST BRANDS, INC. | exhibit311.htm |
UNITED STATES
SECURITIES AND EXCHANGE COMMISSION
WASHINGTON, D.C. 20549
FORM 10–Q
(Mark One) | |
þ | QUARTERLY REPORT PURSUANT TO SECTION 13 OR 15(d) OF THE SECURITIES EXCHANGE ACT OF 1934 |
For the quarterly period ended June 30, 2014
OR
o | TRANSITION REPORT PURSUANT TO SECTION 13 OR 15(d) OF THE SECURITIES EXCHANGE ACT OF 1934 |
For the transition period from _______________ to _______________ | |
Commission File No. 001-35743

CST BRANDS, INC.
(Exact name of registrant as specified in its charter)
Delaware (State or Other Jurisdiction of Incorporation or Organization) | 46-1365950 (I.R.S. Employer Identification No.) | |
One Valero Way
Building D, Suite 200
San Antonio, Texas
(Address of Principal Executive Offices)
78249
(Zip Code)
(210) 692-5000
(Registrant’s telephone number, including area code)
Indicate by check mark whether the registrant (1) has filed all reports required to be filed by Section 13 or 15(d) of the Securities Exchange Act of 1934 during the preceding 12 months (or for such shorter period that the registrant was required to file such reports), and (2) has been subject to such filing requirements for the past 90 days. Yes þ No ¨
Indicate by check mark whether the registrant has submitted electronically and posted on its corporate Web site, if any, every Interactive Data File required to be submitted and posted pursuant to Rule 405 of Regulation S-T (§232.405 of this chapter) during the preceding 12 months (or for such shorter period that the registrant was required to submit and post such files). Yes þ No ¨
Indicate by check mark whether the Registrant is a large accelerated filer, an accelerated filer, a non-accelerated filer, or a smaller reporting company. See the definitions of “large accelerated filer,” “accelerated filer” and “small reporting company” in Rule 12b-2 of the Exchange Act. (Check one):
Large accelerated filer o | Accelerated filer o | Non-accelerated filer þ (do not check if a smaller reporting company) | Smaller reporting company o |
Indicate by check mark whether the registrant is a shell company (as defined in Rule 12b-2 of the Exchange Act). Yes ¨ No þ
The number of shares of the registrant’s only class of common stock, $0.01 par value, outstanding as of August 7, 2014 was 75,618,067.
TABLE OF CONTENTS
PAGE | |
Item 2. Management’s Discussion and Analysis of Financial Condition and Results of Operations | |
PART I - FINANCIAL INFORMATION
ITEM 1. FINANCIAL STATEMENTS
CST BRANDS, INC.
CONSOLIDATED BALANCE SHEETS
(Millions of Dollars)
June 30, 2014 | December 31, 2013 | |||||||
ASSETS | (Unaudited) | |||||||
Current assets: | ||||||||
Cash | $ | 428 | $ | 378 | ||||
Receivables, net of allowances of $1 and $1, respectively | 194 | 153 | ||||||
Inventories | 204 | 217 | ||||||
Deferred income taxes | 9 | 7 | ||||||
Prepaid expenses and other | 14 | 11 | ||||||
Total current assets | 849 | 766 | ||||||
Property and equipment, at cost | 2,066 | 1,981 | ||||||
Accumulated depreciation | (697 | ) | (655 | ) | ||||
Property and equipment, net | 1,369 | 1,326 | ||||||
Goodwill and intangible assets, net | 45 | 49 | ||||||
Deferred income taxes | 88 | 93 | ||||||
Other assets, net | 67 | 69 | ||||||
Total assets | $ | 2,418 | $ | 2,303 | ||||
LIABILITIES AND STOCKHOLDERS’ EQUITY | ||||||||
Current liabilities: | ||||||||
Current portion of debt and capital lease obligations | $ | 42 | $ | 36 | ||||
Accounts payable | 106 | 99 | ||||||
Accounts payable to Valero | 320 | 253 | ||||||
Accrued expenses | 54 | 43 | ||||||
Taxes other than income taxes | 22 | 17 | ||||||
Income taxes payable | 12 | 10 | ||||||
Dividends payable | 5 | 5 | ||||||
Total current liabilities | 561 | 463 | ||||||
Debt and capital lease obligations, less current portion | 987 | 1,006 | ||||||
Deferred income taxes | 87 | 94 | ||||||
Asset retirement obligations | 81 | 79 | ||||||
Other long-term liabilities | 37 | 34 | ||||||
Total liabilities | 1,753 | 1,676 | ||||||
Commitments and contingencies | ||||||||
Stockholders’ equity: | ||||||||
Common stock (250,000,000 shares authorized at $0.01 par value; 75,452,708 and 75,397,241 shares issued, respectively) | 1 | 1 | ||||||
Additional paid-in capital (APIC) | 412 | 406 | ||||||
Retained earnings | 121 | 87 | ||||||
Accumulated other comprehensive income (AOCI) | 131 | 133 | ||||||
Total stockholders’ equity | 665 | 627 | ||||||
Total liabilities and stockholders’ equity | $ | 2,418 | $ | 2,303 | ||||
See Condensed Notes to Consolidated and Combined Financial Statements.
1
CST BRANDS, INC.
CONSOLIDATED AND COMBINED STATEMENTS OF INCOME
(Millions of Dollars, Except per Share Amounts)
(Unaudited)
Three Months Ended | Six Months Ended | |||||||||||||||
June 30, | June 30, | |||||||||||||||
2014 | 2013 | 2014 | 2013 | |||||||||||||
Operating revenues(a) | $ | 3,261 | $ | 3,211 | $ | 6,262 | $ | 6,399 | ||||||||
Cost of sales | 2,981 | 2,922 | 5,737 | 5,874 | ||||||||||||
Gross profit | 280 | 289 | 525 | 525 | ||||||||||||
Operating expenses: | ||||||||||||||||
Operating expenses | 168 | 161 | 332 | 320 | ||||||||||||
General and administrative expenses | 25 | 20 | 50 | 35 | ||||||||||||
Depreciation, amortization and accretion expense | 30 | 30 | 61 | 60 | ||||||||||||
Total operating expenses | 223 | 211 | 443 | 415 | ||||||||||||
Operating income | 57 | 78 | 82 | 110 | ||||||||||||
Other income, net | 1 | 1 | 2 | 2 | ||||||||||||
Interest expense | (10 | ) | (7 | ) | (20 | ) | (7 | ) | ||||||||
Income before income tax expense | 48 | 72 | 64 | 105 | ||||||||||||
Income tax expense | 16 | 31 | 21 | 41 | ||||||||||||
Net income | $ | 32 | $ | 41 | $ | 43 | $ | 64 | ||||||||
Earnings per common share | ||||||||||||||||
Basic earnings per common share | $ | 0.43 | $ | 0.54 | $ | 0.57 | $ | 0.84 | ||||||||
Weighted-average common shares outstanding (in thousands) | 75,423 | 75,397 | 75,410 | 75,397 | ||||||||||||
Earnings per common share - assuming dilution | ||||||||||||||||
Diluted earnings per common share | $ | 0.43 | $ | 0.54 | $ | 0.57 | $ | 0.84 | ||||||||
Weighted-average common shares outstanding - assuming dilution (in thousands) | 75,580 | 75,407 | 75,540 | 75,402 | ||||||||||||
Dividends declared per common share | $ | 0.0625 | $ | — | $ | 0.1250 | $ | — | ||||||||
Supplemental information: | ||||||||||||||||
(a) Includes excise taxes | $ | 505 | $ | 511 | $ | 975 | $ | 1,010 | ||||||||
See Condensed Notes to Consolidated and Combined Financial Statements.
2
CST BRANDS, INC.
CONSOLIDATED AND COMBINED STATEMENTS OF COMPREHENSIVE INCOME
(Millions of Dollars)
(Unaudited)
Three Months Ended | Six Months Ended | |||||||||||||||
June 30, | June 30, | |||||||||||||||
2014 | 2013 | 2014 | 2013 | |||||||||||||
Net income | $ | 32 | $ | 41 | $ | 43 | $ | 64 | ||||||||
Other comprehensive income (loss): | ||||||||||||||||
Foreign currency translation adjustment | 22 | (18 | ) | (2 | ) | (32 | ) | |||||||||
Other comprehensive income (loss) before income taxes | 22 | (18 | ) | (2 | ) | (32 | ) | |||||||||
Income taxes related to items of other comprehensive income | — | — | — | — | ||||||||||||
Other comprehensive income (loss) | 22 | (18 | ) | (2 | ) | (32 | ) | |||||||||
Comprehensive income | $ | 54 | $ | 23 | $ | 41 | $ | 32 | ||||||||
See Condensed Notes to Consolidated and Combined Financial Statements.
3
CST BRANDS, INC.
CONSOLIDATED AND COMBINED STATEMENTS OF CASH FLOWS
(Millions of Dollars)
(Unaudited)
Six Months Ended June 30, | ||||||||
2014 | 2013 | |||||||
Cash flows from operating activities: | ||||||||
Net income | $ | 43 | $ | 64 | ||||
Adjustments to reconcile net income to net cash provided by operating activities: | ||||||||
Stock-based compensation expense | 6 | 2 | ||||||
Depreciation, amortization and accretion expense | 61 | 60 | ||||||
Deferred income tax (benefit) expense | (4 | ) | 7 | |||||
Change in working capital | 61 | 219 | ||||||
Other operating activities, net | 1 | (1 | ) | |||||
Net cash provided by operating activities | 168 | 351 | ||||||
Cash flows from investing activities: | ||||||||
Capital expenditures | (88 | ) | (90 | ) | ||||
Acquisitions | (4 | ) | (4 | ) | ||||
Other investing activities, net | — | (2 | ) | |||||
Net cash used in investing activities | (92 | ) | (96 | ) | ||||
Cash flows from financing activities: | ||||||||
Proceeds from issuance of long-term debt | — | 500 | ||||||
Payments of long-term debt | (16 | ) | — | |||||
Debt issuance and credit facility origination costs | — | (18 | ) | |||||
Payments of capital lease obligations | (1 | ) | (1 | ) | ||||
Dividends paid | (9 | ) | — | |||||
Net transfers to Valero | — | (378 | ) | |||||
Net cash (used in) provided by financing activities | (26 | ) | 103 | |||||
Effect of foreign exchange rate changes on cash | — | (5 | ) | |||||
Net increase in cash | 50 | 353 | ||||||
Cash at beginning of period | 378 | 61 | ||||||
Cash at end of period | $ | 428 | $ | 414 | ||||
See Condensed Notes to Consolidated and Combined Financial Statements.
4
CST BRANDS, INC.
CONDENSED NOTES TO CONSOLIDATED AND COMBINED FINANCIAL STATEMENTS
Note 1. | DESCRIPTION OF BUSINESS, BASIS OF PRESENTATION, CONCENTRATION RISK, INTERIM FINANCIAL INFORMATION, USE OF ESTIMATES, SIGNIFICANT ACCOUNTING POLICIES, NEW ACCOUNTING PRONOUNCEMENTS AND NETWORK OPTIMIZATION |
Description of Business
CST Brands, Inc. (“CST,” “we,” “us,” “our,” or “Company”) was incorporated in November 2012 solely in contemplation of the separation and distribution (“spin-off”) of the retail business of Valero Energy Corporation (“Valero”).
We operate in two segments, U.S. and Canada, and are one of the largest independent retailers of motor fuel and convenience merchandise items in North America. Our operations include (i) the sale of motor fuel at convenience stores, dealer/agent sites and cardlocks (which are unattended self-service fueling stations that provide motor fuel to fleet customers, such as trucking and other commercial customers), (ii) the sale of convenience merchandise items and other services (such as car wash operations, and commissions from lottery, money orders, air/water/vacuum services, video and game rentals and access to automated teller machines), and (iii) the sale of heating oil to residential customers and the sale of heating oil and motor fuel to small commercial customers. We use the term “retail site” as a general term to refer to convenience stores, dealer/agent sites or cardlocks.
Basis of Presentation
The consolidated financial statements reflect our financial results for all periods subsequent to the spin-off. The combined financial statements reflect the combined historical results of operations and cash flows of Valero’s retail businesses in the U.S. and Canada prior to the spin-off, including an allocable portion of Valero’s corporate costs. The combined financial statements are presented as if Valero’s retail businesses in the U.S. and Canada were combined for all periods prior to the spin-off. The combined statements of income prior to the spin-off also include approximately $26 million of expense allocations for certain corporate functions historically performed by Valero and not allocated to its operating segments, including allocations of general corporate expenses related to executive oversight, accounting, treasury, tax, legal, procurement, human resources and information technology (“IT”). These allocations were based primarily on specific identification of time and/or activities associated with CST’s operations, employee headcount or capital expenditures. For ease of reference, these consolidated and combined financial statements are referred to as those of CST Brands, Inc.
We believe the assumptions underlying the combined financial statements, including the assumptions regarding allocating general corporate expenses from Valero, are reasonable. Nevertheless, the combined financial statements may not include all of the actual expenses that would have been incurred had we operated as a stand-alone, publicly-traded company during the combined periods presented and may not reflect our combined results of operations and cash flows had we operated as a stand-alone, publicly-traded company during the combined periods presented. Actual costs that would have been incurred if we had operated as a stand-alone, publicly-traded company during the combined periods presented would depend on multiple factors, including organizational structure and strategic decisions made in various areas, including IT and related infrastructure.
Prior to the spin-off, we transferred cash to Valero daily and Valero funded our operating and investing activities as needed through a centralized cash management process. We have reflected net transfers of cash to Valero as a financing activity in our combined statement of cash flows. We did not include any interest income on the net cash transfers to Valero.
Concentration Risk
Valero supplied substantially all of the motor fuel purchased by us for resale during all periods presented. Motor fuel purchased by us from Valero is recorded as a component of cost of sales based on price formulas that vary from terminal to terminal. The actual prices we pay typically change daily, based on market fluctuations of wholesale motor fuel prices in the geographic locations where we purchase our motor fuel for resale. During the three months ended June 30, 2014 and 2013, we purchased $2.6 billion and $2.6 billion, respectively, of motor fuel from Valero. During the six
5
CST BRANDS, INC.
CONDENSED NOTES TO CONSOLIDATED AND COMBINED FINANCIAL STATEMENTS (Continued)
months ended June 30, 2014 and 2013, we purchased $5.0 billion and $5.3 billion, respectively, of motor fuel from Valero.
No customers are individually material to our operations.
Interim Financial Information
These unaudited financial statements have been prepared in accordance with U.S. generally accepted accounting principles (“U.S. GAAP”) for interim financial information and with the instructions to Form 10-Q and Article 10 of Regulation S-X of the Securities Exchange Act of 1934, as amended. Accordingly, they do not include all of the information and notes required by U.S. GAAP for complete financial statements. In the opinion of management, all adjustments considered necessary for a fair presentation have been included. All such adjustments are of a normal recurring nature unless disclosed otherwise. Management believes that the disclosures made are adequate to keep the information presented from being misleading. The financial statements contained herein should be read in conjunction with the consolidated and combined financial statements and notes thereto included in our Form 10-K for the year ended December 31, 2013. Financial information as of June 30, 2014 and for the three and six months ended June 30, 2014 and 2013 included in these condensed notes to consolidated and combined financial statements has been derived from our unaudited financial statements. Financial information as of December 31, 2013, has been derived from our audited financial statements and notes thereto as of that date. For further information, refer to our consolidated and combined financial statements and notes thereto included in our Annual Report on Form 10-K for the year ended December 31, 2013 (“Form 10-K”).
Operating results for the three and six months ended June 30, 2014 are not necessarily indicative of the results that may be expected for the year ending December 31, 2014. Our effective income tax rates for the three and six months ended June 30, 2014 were 33% and 33%, respectively, compared with 43% and 39% for the corresponding periods of 2013. The effective tax rates differ from the federal statutory rate of 35% primarily due to state income taxes and the impact of foreign operations. Our effective tax rate for 2013 was negatively impacted by $7 million in deferred tax expense resulting from the loss of certain state tax credits that were no longer eligible for use in our consolidated tax return after the spin-off.
Use of Estimates
The preparation of financial statements in conformity with U.S. GAAP requires management to make estimates and assumptions that affect the reported amounts of assets and liabilities at the date of the financial statements and the reported amounts of revenues and expenses during the reporting periods. Actual results and outcomes could differ from those estimates and assumptions. On an ongoing basis, management reviews its estimates based on currently available information. Changes in facts and circumstances could result in revised estimates and assumptions.
Significant Accounting Policies
As disclosed in our Form 10-K, during the fourth quarter of 2013, we elected to change our method of valuing our Canada motor fuel inventory to the weighted-average cost method, whereas in all previous periods motor fuel inventory was valued using the last-in, first-out method (“LIFO”). Comparative financial statements of prior periods have been adjusted to apply the weighted-average cost method retrospectively.
There have been no material changes to the significant accounting policies described in our Form 10-K.
New Accounting Pronouncements
In April 2014, the Financial Accounting Standards Board issued Accounting Standards Update 2014-08 (“ASU 2014-08”), Presentation of Financial Statements (Topic 205) and Property, Plant and Equipment (Topic 360): Reporting Discontinued Operations and Disclosures of Disposals of Components of an Entity. ASU 2014-08, required to be applied prospectively for reporting periods beginning after December 15, 2014, limits discontinued operations reporting to disposals of components of an entity that represent strategic shifts that have, or will have, a major effect on operations and financial results. The amendment requires expanded disclosures for discontinued operations and also requires additional disclosures regarding disposals of individually significant components that do not qualify as discontinued operations. Early adoption is permitted, but only for disposals (or classifications as held for sale) that have not been
6
CST BRANDS, INC.
CONDENSED NOTES TO CONSOLIDATED AND COMBINED FINANCIAL STATEMENTS (Continued)
reported in financial statements previously issued or available for issuance. This amendment has no impact on our current disclosures, but will in the future if we dispose of any individually significant components.
In May 2014, the Financial Accounting Standards Board issued Accounting Standards Update 2014-09 (“ASU 2014-09”), Revenue from Contracts with Customers. ASU 2014-09 requires an entity to recognize the amount of revenue to which it expects to be entitled for the transfer of promised goods or services to customers. The ASU will replace most existing revenue recognition guidance in U.S. GAAP when it becomes effective. ASU 2014-09 will become effective for us in the first quarter of 2017 and early adoption is not permitted. The standard permits the use of either the retrospective or cumulative effect transition method. We are evaluating the effect that ASU 2014-09 will have on our consolidated financial statements and related disclosures. We have not yet selected a transition method nor have we determined the effect of the standard on our ongoing financial reporting.
Certain new financial accounting pronouncements have become effective for our financial statements. The adoption of these pronouncements will not affect our financial position or results of operations, nor will they require any additional disclosures.
Network Optimization
We have conducted market reviews across our entire U.S. system and, as a result, have identified approximately 100 company operated sites that are candidates for sale. We have engaged an outside consultant, NRC Realty & Capital Advisors, LLC, to market these properties. Stores were identified based on several criteria, and, while many of them are smaller in square footage and below our store average from an inside sales and operating cash flow perspective, these locations average over 3,000 gallons of motor fuel sold per store per day.
The determination to classify an asset as “held for sale” requires significant judgments about the site and the expected market for the site, which are based on factors including recent sales of comparable sites, recent expressions of interest in the site and the condition of the site. Management must also determine the probability under those market conditions that it will sell the site for an acceptable price within one year. Management considers sites to be “held for sale” when they meet criteria such as whether the sale transaction has been approved by the appropriate level of management and there are no known material contingencies relating to the sale such that the sale is probable and is expected to qualify for recognition as a completed sale within one year. We determined that the stores mentioned above did not meet the “held for sale” criteria as of June 30, 2014, or prior to the date of this filing.
Note 2. | ASSET IMPAIRMENTS |
Our retail sites are the lowest level for which identifiable cash flows are largely independent of the cash flows of other groups of long-lived assets. Cash flows from each retail site vary from year to year and, as a result, we have identified and recorded asset impairments in the past as changes in market demographics, traffic patterns, competition and other factors impacted the overall operations of certain of our individual retail sites.
We have not recorded any material asset impairments during the first six months of 2014. However, we have identified certain retail sites that have experienced lower than expected operating results during the first half of 2014. Our retail operations are seasonal and we generally experience our highest sales volumes and operating income during the second and third quarters during the summer activity months. We will continue to monitor these retail sites during the third quarter of 2014, considering both motor fuel gallons sold and motor fuel gross profit, among other factors. Following our evaluation of the performance of these sites subsequent to the 2014 driving season, we may record impairment charges of up to $25 million if the financial performance of these retail sites does not improve. Our results of operations and financial position could be materially and adversely affected.
7
CST BRANDS, INC.
CONDENSED NOTES TO CONSOLIDATED AND COMBINED FINANCIAL STATEMENTS (Continued)
Note 3. | INVENTORIES |
Inventories consisted of the following (in millions):
June 30, | December 31, | |||||||
2014 | 2013 | |||||||
Convenience store merchandise and supplies | $ | 117 | $ | 116 | ||||
Motor fuel | 87 | 101 | ||||||
Inventories | $ | 204 | $ | 217 | ||||
The cost of convenience store merchandise and supplies is determined principally under the weighted-average cost method. We account for motor fuel inventory in our U.S. segment on the LIFO basis. As of June 30, 2014, and December 31, 2013, the replacement cost (market value) of our U.S. motor fuel inventories exceeded their LIFO carrying amounts by approximately $29 million and $24 million, respectively. We account for motor fuel inventory in our Canada segment under the weighted-average cost method.
Note 4. | GOODWILL AND INTANGIBLE ASSETS |
Goodwill and intangible assets consisted of the following (in millions):
Gross Carrying Amount | Accumulated Amortization | ||||||||||||||
June 30, | December 31, | June 30, | December 31, | ||||||||||||
2014 | 2013 | 2014 | 2013 | ||||||||||||
Goodwill | $ | 18 | $ | 18 | |||||||||||
Intangible assets | 119 | 119 | $ | (92 | ) | $ | (88 | ) | |||||||
Total | $ | 137 | $ | 137 | $ | (92 | ) | $ | (88 | ) | |||||
Intangible assets primarily relate to customer lists in our Canada segment, which are being amortized on a straight-line basis over 15 years. As these assets are recorded in the local currency, Canadian dollars, gross carrying amounts are translated at each balance sheet date, resulting in changes from the U.S. dollar amounts presented previously.
8
CST BRANDS, INC.
CONDENSED NOTES TO CONSOLIDATED AND COMBINED FINANCIAL STATEMENTS (Continued)
Note 5. | DEBT |
Our balances for long-term debt and capital leases are as follows (in millions):
June 30, | December 31, | |||||||
2014 | 2013 | |||||||
5.00% senior notes due 2023 | $ | 550 | $ | 550 | ||||
Term loan due 2018 | 472 | 488 | ||||||
Capital leases | 7 | 4 | ||||||
Total debt and capital lease obligations outstanding | 1,029 | 1,042 | ||||||
Less current portion | 42 | 36 | ||||||
Debt and capital lease obligations, less current portion | $ | 987 | $ | 1,006 | ||||
Availability under revolving credit facility (expires 2018): | ||||||||
Total available credit facility limit | $ | 300 | $ | 300 | ||||
Letters of credit outstanding | (3 | ) | (3 | ) | ||||
Maximum leverage ratio constraint(a) | (176 | ) | (84 | ) | ||||
Total available and undrawn | $ | 121 | $ | 213 | ||||
(a) | Our revolving credit facility contains a maximum lease adjusted leverage ratio of 3.75 to 1.00. As a result, we were limited to the amount we could borrow under our revolving credit facility at June 30, 2014 and December 31, 2013. |
Our credit facilities contain financial covenants (as defined in the credit agreement) consisting of (a) a maximum total lease adjusted leverage ratio set at not greater than 3.75 to 1.00, (b) a minimum fixed charge coverage ratio set at not less than 1.30 to 1.00, and (c) limitations on expansion capital expenditures. As of June 30, 2014, our lease adjusted leverage ratio and fixed charge coverage ratio were 3.42 to 1.00 and 2.17 to 1.00, respectively.
Outstanding borrowings under our term loan facility are London Interbank Offered Rate (“LIBOR”) loans bearing interest at 1.90% (effective 30 day LIBOR rate plus a spread of 1.75%) as of June 30, 2014.
The carrying values and estimated fair values of our outstanding debt were as follows (in millions):
June 30, 2014 | December 31, 2013 | |||||||||||||||
Carrying Value | Fair Value | Carrying Value | Fair Value | |||||||||||||
Total debt | $ | 1,022 | $ | 1,025 | $ | 1,038 | $ | 1,018 | ||||||||
The fair value of the term loan approximates its carrying value due to the frequency with which interest rates are reset based on changes in prevailing interest rates. The fair value of the senior notes is determined primarily using quoted prices of over the counter traded securities. These quoted prices are considered Level 1 inputs under the fair value hierarchy established by ASC 820, Fair Value Measurements and Disclosures.
9
CST BRANDS, INC.
CONDENSED NOTES TO CONSOLIDATED AND COMBINED FINANCIAL STATEMENTS (Continued)
Note 6. | RELATED-PARTY TRANSACTIONS AND TRANSITION SERVICES AGREEMENTS WITH VALERO |
Related-Party Transactions
Valero retained an ownership interest in us through November 14, 2013. We considered transactions with Valero to be with a related-party through this date. Valero supplied substantially all of the motor fuel purchased by us for resale during all periods presented as disclosed in Note 1.
Transition Services Agreements
Subsequent to the spin-off, Valero has charged us a transition services fee primarily related to IT systems that we record as a component of general and administrative expenses. During the three and six months ended June 30, 2014, we paid Valero less than $1 million and $1 million, respectively, for these services. We transitioned to our own enterprise reporting system during the second quarter of 2014 and we expect to be substantially complete in transitioning to our independent IT infrastructure before the end of 2014.
Note 7. | COMMITMENTS AND CONTINGENCIES |
On October 30, 2013, the State of Colorado filed a lawsuit against Valero and CST and several of their subsidiaries and affiliates claiming that, prior to the spin-off, Valero and its former retail subsidiaries filed claims with and recovered funds from Colorado’s Underground Storage Tank (“UST”) Fund and failed to disclose the existence of and/or recoveries from insurance policies, which are alleged to provide coverage for the same remediation activities. The case is subject to the accelerated “CAPP” rules of procedure in Colorado and a trial date is set for March 30, 2015. During the first quarter of 2014, the plaintiffs filed an amended complaint seeking forfeiture of amounts paid by the UST Fund or payment of amounts recovered from insurers for these sites, which they alleged to be in excess of $15 million. While Valero has and continues to maintain control over the historical insurance policies at issue, we are unaware of any insurance claims that were made, or proceeds received, for costs associated with UST remediation at sites in Colorado, other than a settlement in 2002, which was reported to the State. The State agreed to accept a portion of the proceeds from that settlement apportioned to retail sites in Colorado and to release all claims for the sites potentially involved in those insurance recovery actions. We believe that there is no factual basis for the State’s claims and that there are numerous legal defenses to these claims. Both Valero and CST have made demands on the other under the terms of the Separation and Distribution Agreement, which CST and Valero have agreed to resolve after the underlying matters is resolved if necessary. We are working jointly and intend to vigorously defend this litigation.
A lawsuit was filed on behalf of the State of Louisiana in the first quarter of 2014 in Louisiana state court against Valero and CST and several of their subsidiaries and affiliates making claims for pre-spin-off claims and recoveries by Valero and its former retail subsidiaries from Louisiana’s UST Fund. This case is in the very initial stages of litigation. Although the claims are similar to those alleged in the Colorado case previously discussed, this litigation involves only sites in Louisiana. We do not believe that these claims have any factual basis, and that we have numerous legal defenses to these claims. Valero and CST are working jointly and we intend to vigorously defend this litigation.
A lawsuit was filed on behalf of the State of Pennsylvania in Pennsylvania state court against numerous fuel retailers, including Valero and CST and several of their subsidiaries and affiliates for pre-spin-off claims and recoveries by Valero and its former retail subsidiaries against the Pennsylvania UST Fund. CST’s business never operated sites in Pennsylvania and we do not believe that we are a proper party to this litigation. We will be seeking a dismissal from this litigation.
We have not recorded a loss contingency liability with respect to these matters as we are unable to estimate the possible loss or range of loss for any of these lawsuits at this stage of the litigation.
10
CST BRANDS, INC.
CONDENSED NOTES TO CONSOLIDATED AND COMBINED FINANCIAL STATEMENTS (Continued)
Note 8. | EQUITY |
Common Shares
As of June 30, 2014, a total of 250 million shares of our common stock, $0.01 par value, were authorized. As of June 30, 2014 and December 31, 2013, 75,452,708 basic common shares and 75,397,241 basic common shares were issued, respectively.
Dividends
Quarterly dividend activity was as follows:
Quarter Ended | Record Date | Payment Date | Cash Distribution (per share) | Cash Distribution (in millions) | ||||||||
December 31, 2013 | December 31, 2013 | January 15, 2014 | $ | 0.0625 | $ | 4.7 | ||||||
March 31, 2014 | March 31, 2014 | April 15, 2014 | $ | 0.0625 | $ | 4.7 | ||||||
June 30, 2014 | June 30, 2014 | July 15, 2014 | $ | 0.0625 | $ | 4.7 | ||||||
We expect to continue the practice of paying quarterly cash dividends, though the timing, declaration, amount and payment of future dividends to stockholders will fall within the discretion of our Board of Directors. Our indebtedness also restricts our ability to pay dividends. As such, there can be no assurance we will continue to pay dividends in the future.
Comprehensive Income
Comprehensive income for a period encompasses net income and all other changes in equity other than from transactions with our stockholders. Foreign currency translation adjustments of the Canadian dollar into the U.S. dollar are the only component of our accumulated other comprehensive income. We intend to reinvest earnings indefinitely in our Canadian operations even though we are not restricted from repatriating such earnings to the U.S. in the form of cash dividends. Should we decide to repatriate such earnings, we would incur and pay taxes on the amounts repatriated.
Changes in foreign currency translation adjustments were as follows for the three months and six months ended June 30, 2014 and 2013 (in millions):
Three Months Ended | Six Months Ended | |||||||||||||||
June 30, | June 30, | |||||||||||||||
2014 | 2013 | 2014 | 2013 | |||||||||||||
Balance at the beginning of the period | $ | 109 | $ | 156 | $ | 133 | $ | 170 | ||||||||
Other comprehensive income (loss) before reclassifications | 22 | (18 | ) | (2 | ) | (32 | ) | |||||||||
Amounts reclassified from other comprehensive income | — | — | — | — | ||||||||||||
Net other comprehensive income (loss) | 22 | (18 | ) | (2 | ) | (32 | ) | |||||||||
Balance at the end of the period | $ | 131 | $ | 138 | $ | 131 | $ | 138 | ||||||||
Note 9. | STOCK-BASED COMPENSATION |
Compensation expense for our stock-based compensation plans is based on the fair value of the awards granted and is recognized in income on a straight-line basis over the requisite service period of each vesting tranche. For new grants that have retirement-eligibility provisions, we use the non-substantive vesting period approach, under which compensation cost is recognized immediately for awards granted to retirement-eligible employees or over the period from the grant date to the date retirement eligibility is achieved if that date is expected to occur during the nominal vesting period. We record stock-based compensation as components of operating expenses and general and administrative expenses in the consolidated and combined statements of income.
11
CST BRANDS, INC.
CONDENSED NOTES TO CONSOLIDATED AND COMBINED FINANCIAL STATEMENTS (Continued)
We recognized stock-based compensation expense as follows (in millions):
Three Months Ended | Six Months Ended | |||||||||||||||
June 30, | June 30, | |||||||||||||||
2014 | 2013 | 2014 | 2013 | |||||||||||||
Stock-based compensation expense | $ | 2 | $ | 1 | $ | 6 | $ | 2 | ||||||||
Prior to the spin-off, our employees participated in Valero’s stock-based compensation plans, and Valero allocated stock-based compensation costs to us based on Valero’s determination of actual costs attributable to our employees. Our first grant of stock-based awards under the 2013 CST Brands, Inc. Omnibus Stock Incentive Plan (the “Plan”) occurred in the second quarter of 2013. The Plan was amended in November 2013 and amended again in June 2014.
Our annual grant of stock-based awards to directors and officers occurred in the first quarter of 2014. During the second quarter of 2014, we granted 28,164 stock options with a weighted-average grant date fair value of $11.65 and 10,611 restricted stock units with a weighted-average grant date fair value of $31.12 to certain non-officer employees. We did not have any additional significant stock-based compensation activity in the first half of 2014.
12
CST BRANDS, INC.
CONDENSED NOTES TO CONSOLIDATED AND COMBINED FINANCIAL STATEMENTS (Continued)
Note 10. | EARNINGS PER COMMON SHARE |
On May 1, 2013, 75,397,241 shares of our common stock were distributed to Valero’s stockholders and Valero in conjunction with the spin-off. For comparative purposes and to provide a more meaningful calculation of earnings per share, we have assumed this amount to be outstanding as of the beginning of the three and six months ended June 30, 2013 in the calculation of weighted-average shares outstanding.
Earnings per common share were computed as follows (in millions, except shares outstanding, common equivalent shares and per share amounts):
Three Months Ended June 30, | ||||||||||||||||
2014 | 2013 | |||||||||||||||
Restricted Shares and Units | Common Stock | Restricted Shares and Units | Common Stock | |||||||||||||
Earnings per common share: | ||||||||||||||||
Net income attributable to stockholders | $ | 32 | $ | 41 | ||||||||||||
Less dividends declared: | ||||||||||||||||
Common stock | 5 | — | ||||||||||||||
Undistributed earnings | $ | 27 | $ | 41 | ||||||||||||
Weighted-average common shares outstanding (in thousands) | 334 | 75,423 | 117 | 75,397 | ||||||||||||
Earnings per common share | ||||||||||||||||
Distributed earnings | $ | 0.06 | $ | 0.06 | $ | 0.54 | $ | 0.54 | ||||||||
Undistributed earnings | 0.37 | 0.37 | — | — | ||||||||||||
Total earnings per common share | $ | 0.43 | $ | 0.43 | $ | 0.54 | $ | 0.54 | ||||||||
Earnings per common share - assuming dilution: | ||||||||||||||||
Net income attributable to stockholders | $ | 32 | $ | 41 | ||||||||||||
Weighted-average common shares outstanding (in thousands) | 75,423 | 75,397 | ||||||||||||||
Common equivalent shares: | ||||||||||||||||
Stock options (in thousands) | 27 | — | ||||||||||||||
Restricted stock (in thousands) | 84 | 10 | ||||||||||||||
Restricted stock units (in thousands) | 46 | — | ||||||||||||||
Weighted-average common shares outstanding - assuming dilution (in thousands) | 75,580 | 75,407 | ||||||||||||||
Earnings per common share - assuming dilution | $ | 0.43 | $ | 0.54 | ||||||||||||
13
CST BRANDS, INC.
CONDENSED NOTES TO CONSOLIDATED AND COMBINED FINANCIAL STATEMENTS (Continued)
Six Months Ended June 30, | ||||||||||||||||
2014 | 2013 | |||||||||||||||
Restricted Shares and Units | Common Stock | Restricted Shares and Units | Common Stock | |||||||||||||
Earnings per common share: | ||||||||||||||||
Net income attributable to stockholders | $ | 43 | $ | 64 | ||||||||||||
Less dividends declared: | ||||||||||||||||
Common stock | 9 | — | ||||||||||||||
Undistributed earnings | $ | 34 | $ | 64 | ||||||||||||
Weighted-average common shares outstanding (in thousands) | 288 | 75,410 | 59 | 75,397 | ||||||||||||
Earnings per common share | ||||||||||||||||
Distributed earnings | $ | 0.13 | $ | 0.13 | $ | 0.84 | $ | 0.84 | ||||||||
Undistributed earnings | 0.44 | 0.44 | — | — | ||||||||||||
Total earnings per common share | $ | 0.57 | $ | 0.57 | $ | 0.84 | $ | 0.84 | ||||||||
Earnings per common share - assuming dilution: | ||||||||||||||||
Net income attributable to stockholders | $ | 43 | $ | 64 | ||||||||||||
Weighted-average common shares outstanding (in thousands) | 75,410 | 75,397 | ||||||||||||||
Common equivalent shares: | ||||||||||||||||
Stock options (in thousands) | 18 | — | ||||||||||||||
Restricted stock (in thousands) | 85 | 5 | ||||||||||||||
Restricted stock units (in thousands) | 27 | — | ||||||||||||||
Weighted-average common shares outstanding - assuming dilution (in thousands) | 75,540 | 75,402 | ||||||||||||||
Earnings per common share - assuming dilution | $ | 0.57 | $ | 0.84 | ||||||||||||
The table below presents securities that have been excluded from the computation of diluted earnings per share because they would have been anti-dilutive for the periods presented:
Three Months Ended | Six Months Ended | |||||||||||
June 30, | June 30, | |||||||||||
2014 | 2013 | 2014 | 2013 | |||||||||
Weighted-average anti-dilutive options (in thousands) | 364 | 132 | 327 | 66 | ||||||||
Weighted-average anti-dilutive restricted shares (in thousands) | — | 107 | — | 54 | ||||||||
No stock-based awards of CST were issued in exchange for either vested or non-vested Valero stock-based awards held by our employees prior to the spin-off. Therefore, there are no stock-based awards included in the calculation of shares used in the diluted earnings per share prior to the spin-off.
14
CST BRANDS, INC.
CONDENSED NOTES TO CONSOLIDATED AND COMBINED FINANCIAL STATEMENTS (Continued)
Note 11. SEGMENT INFORMATION
We have two reportable segments: U.S. and Canada. The U.S. segment consists of convenience stores located in the United States. The Canada segment consists of convenience stores, dealers/agents, cardlocks and heating oil operations located in Canada. Operating revenues from our heating oil business were approximately 5% of our consolidated operating revenues for each period presented and have been included within the Canada segment information. Operations that are not included in either of our reportable segments are included in the corporate category, which consists primarily of general and administrative costs.
The reportable segments are strategic business units that experience different operating income margins due to geographic supply and demand attributes and specific country and local regulatory environments. There are no intersegment revenues.
The following table reflects activity related to our reportable segments (in millions):
U.S. | Canada | Corporate | Total | |||||||||||||
Three months ended June 30, 2014: | ||||||||||||||||
Operating revenues from external customers | $ | 2,029 | $ | 1,232 | $ | — | $ | 3,261 | ||||||||
Gross profit | 182 | 98 | — | 280 | ||||||||||||
Depreciation, amortization and accretion expense | 21 | 9 | — | 30 | ||||||||||||
Operating income (loss) | 53 | 29 | (25 | ) | 57 | |||||||||||
Total expenditures for long-lived assets | 40 | 5 | — | 45 | ||||||||||||
Three months ended June 30, 2013: | ||||||||||||||||
Operating revenues from external customers | $ | 2,007 | $ | 1,204 | $ | — | $ | 3,211 | ||||||||
Gross profit | 189 | 100 | — | 289 | ||||||||||||
Depreciation, amortization and accretion expense | 21 | 9 | — | 30 | ||||||||||||
Operating income (loss) | 68 | 30 | (20 | ) | 78 | |||||||||||
Total expenditures for long-lived assets | 40 | 10 | — | 50 | ||||||||||||
Six months ended June 30, 2014: | ||||||||||||||||
Operating revenues from external customers | $ | 3,828 | $ | 2,434 | $ | — | $ | 6,262 | ||||||||
Gross profit | 333 | 192 | — | 525 | ||||||||||||
Depreciation, amortization and accretion expense | 43 | 18 | — | 61 | ||||||||||||
Operating income (loss) | 77 | 55 | (50 | ) | 82 | |||||||||||
Total expenditures for long-lived assets | 76 | 12 | — | 88 | ||||||||||||
Six months ended June 30, 2013: | ||||||||||||||||
Operating revenues from external customers | $ | 3,935 | $ | 2,464 | $ | — | $ | 6,399 | ||||||||
Gross profit | 327 | 198 | — | 525 | ||||||||||||
Depreciation, amortization and accretion expense | 42 | 18 | — | 60 | ||||||||||||
Operating income (loss) | 86 | 59 | (35 | ) | 110 | |||||||||||
Total expenditures for long-lived assets | 78 | 12 | — | 90 | ||||||||||||
15
CST BRANDS, INC.
CONDENSED NOTES TO CONSOLIDATED AND COMBINED FINANCIAL STATEMENTS (Continued)
Note 12. SUPPLEMENTAL CASH FLOW INFORMATION
In order to determine net cash provided by operating activities, net income is adjusted by, among other things, changes in working capital as follows (in millions):
Six Months Ended June 30, | ||||||||
2014 | 2013 | |||||||
Decrease (increase): | ||||||||
Receivables, net | $ | (42 | ) | $ | (69 | ) | ||
Inventories | 13 | 5 | ||||||
Prepaid expenses and other | (3 | ) | (6 | ) | ||||
Increase (decrease): | ||||||||
Accounts payable | 8 | 1 | ||||||
Accounts payable to Valero | 68 | 342 | ||||||
Accrued expenses | 10 | 4 | ||||||
Taxes other than income taxes | 5 | (67 | ) | |||||
Income taxes payable | 2 | 9 | ||||||
Change in working capital | $ | 61 | $ | 219 | ||||
The above changes may differ from changes between amounts reflected in the applicable balance sheets for the respective periods for the following reasons:
• | amounts accrued for capital expenditures are reflected in investing activities when such amounts are paid; and |
• | certain differences between balance sheet changes and the changes reflected above result from translating foreign currency denominated amounts at the applicable exchange rates as of each balance sheet date. |
Interest payments were as follows (in millions):
Six Months Ended June 30, | ||||||||
2014 | 2013 | |||||||
Interest paid in excess of amount capitalized | $ | 19 | $ | 1 | ||||
Direct cash payments for income taxes were $22 million and less than $1 million during the six months ended June 30, 2014 and 2013, respectively.
Note 13. SUBSEQUENT EVENTS
Purchase of the General Partner and Incentive Distribution Rights (“IDRs”) in Lehigh Gas Partners LP (“LGP”)
On August 6, 2014, we entered into definitive agreements to purchase from Lehigh Gas Corporation 100% of the membership interests in Lehigh Gas GP LLC, the general partner of LGP, a publicly traded limited partnership traded on the New York Stock Exchange, and all of the outstanding IDRs in LGP. As part of these transactions, we will pay $17 million in cash and approximately 2.04 million shares of CST common stock.
The transaction overall does not involve the sale or purchase of any of the common or subordinated units of LGP. The closing of the transactions are subject to customary conditions, including consent of the lenders and modification of CST’s and LGP’s credit facilities. The transactions are expected to close early in the fourth quarter of 2014.
16
CST BRANDS, INC.
CONDENSED NOTES TO CONSOLIDATED AND COMBINED FINANCIAL STATEMENTS (Continued)
Stock Repurchase Plan
On August 5, 2014, our Board of Directors approved a stock repurchase plan under which we are authorized to purchase shares of our common stock up to a maximum dollar amount of $200 million, until such authorization is exhausted or withdrawn by our Board of Directors. Under the stock repurchase program, we are authorized to repurchase, from time-to-time, shares of our outstanding common stock in the open market, at management’s discretion, based on market and business conditions, applicable legal requirements and other factors, or pursuant to an issuer repurchase plan or agreement that may be in effect. The repurchase program does not obligate us to acquire any specific amount of common stock and will continue until otherwise modified or terminated by our Board of Directors at any time at its sole discretion and without notice. We have not purchased any shares under this plan as of the date of this filing.
Purchase of Distribution Warehouse and Adjoining Office Facilities
On July 31, 2014, we closed on the purchase of an existing distribution warehouse with adjoining office facilities located in San Antonio, Texas for $43 million. The purchase was funded by available cash on hand. These facilities will allow us to consolidate our current San Antonio regional distribution center (“RDC”) with future corporate service center office space. We will begin to transition our RDC operations from our current warehouse in Schertz, Texas to these facilities beginning in the third quarter and expect to complete the RDC move in the first quarter of 2015.
Note 14. GUARANTOR SUBSIDIARIES
CST’s 100% owned, domestic subsidiaries (the “Guarantor Subsidiaries”) fully and unconditionally guarantee, on a joint and several basis, certain of the outstanding indebtedness of CST. The following consolidating and combining schedules present financial information on a consolidated and combined basis in conformity with the SEC’s Regulation S-X Rule 3-10(f):
17
CST BRANDS, INC.
CONDENSED NOTES TO CONSOLIDATED AND COMBINED FINANCIAL STATEMENTS (Continued)
CONSOLIDATING BALANCE SHEETS
(Millions of Dollars)
(Unaudited)
June 30, 2014 | |||||||||||||||||||
Parent Company | Guarantor Subsidiaries | Non-Guarantor Subsidiaries | Eliminations | Consolidated | |||||||||||||||
ASSETS | |||||||||||||||||||
Current assets: | |||||||||||||||||||
Cash | $ | — | $ | 220 | $ | 208 | $ | — | $ | 428 | |||||||||
Receivables, net | — | 97 | 97 | — | 194 | ||||||||||||||
Inventories | — | 124 | 80 | — | 204 | ||||||||||||||
Deferred income taxes | — | 8 | 1 | — | 9 | ||||||||||||||
Prepaid expenses and other | — | 6 | 8 | — | 14 | ||||||||||||||
Total current assets | — | 455 | 394 | — | 849 | ||||||||||||||
Property and equipment, at cost | — | 1,546 | 520 | — | 2,066 | ||||||||||||||
Accumulated depreciation | — | (524 | ) | (173 | ) | — | (697 | ) | |||||||||||
Property and equipment, net | — | 1,022 | 347 | — | 1,369 | ||||||||||||||
Goodwill and intangible assets, net | — | 20 | 25 | — | 45 | ||||||||||||||
Investment in subsidiaries | 1,779 | — | — | (1,779 | ) | — | |||||||||||||
Deferred income taxes | — | — | 88 | — | 88 | ||||||||||||||
Other assets, net | 31 | 31 | 5 | — | 67 | ||||||||||||||
Total assets | $ | 1,810 | $ | 1,528 | $ | 859 | $ | (1,779 | ) | $ | 2,418 | ||||||||
LIABILITIES AND STOCKHOLDERS’ EQUITY | |||||||||||||||||||
Current liabilities: | |||||||||||||||||||
Current portion of debt and capital lease obligations | $ | 41 | $ | 1 | $ | — | $ | — | $ | 42 | |||||||||
Accounts payable | — | 65 | 41 | — | 106 | ||||||||||||||
Accounts (receivable) payable to Valero | (1 | ) | 194 | 127 | — | 320 | |||||||||||||
Accrued expenses | 5 | 31 | 18 | — | 54 | ||||||||||||||
Taxes other than income taxes | — | 21 | 1 | — | 22 | ||||||||||||||
Income taxes payable | — | 7 | 5 | — | 12 | ||||||||||||||
Dividends payable | 5 | — | — | — | 5 | ||||||||||||||
Total current liabilities | 50 | 319 | 192 | — | 561 | ||||||||||||||
Debt and capital lease obligations, less current portion | 981 | 6 | — | — | 987 | ||||||||||||||
Deferred income taxes | — | 87 | — | — | 87 | ||||||||||||||
Intercompany payables (receivables) | 99 | (100 | ) | 1 | — | — | |||||||||||||
Asset retirement obligations | — | 63 | 18 | — | 81 | ||||||||||||||
Other long-term liabilities | 15 | 7 | 15 | — | 37 | ||||||||||||||
Total liabilities | 1,145 | 382 | 226 | — | 1,753 | ||||||||||||||
Commitments and contingencies | |||||||||||||||||||
Stockholders’ equity: | |||||||||||||||||||
Common stock | 1 | — | — | — | 1 | ||||||||||||||
APIC | 412 | 1,037 | 549 | (1,586 | ) | 412 | |||||||||||||
Retained earnings | 121 | 109 | 84 | (193 | ) | 121 | |||||||||||||
AOCI | 131 | — | — | — | 131 | ||||||||||||||
Total stockholders’ equity | 665 | 1,146 | 633 | (1,779 | ) | 665 | |||||||||||||
Total liabilities and stockholders’ equity | $ | 1,810 | $ | 1,528 | $ | 859 | $ | (1,779 | ) | $ | 2,418 | ||||||||
18
CST BRANDS, INC.
CONDENSED NOTES TO CONSOLIDATED AND COMBINED FINANCIAL STATEMENTS (Continued)
CONSOLIDATING BALANCE SHEETS
(Millions of Dollars)
December 31, 2013 | |||||||||||||||||||
Parent Company | Guarantor Subsidiaries | Non-Guarantor Subsidiaries | Eliminations | Consolidated | |||||||||||||||
ASSETS | |||||||||||||||||||
Current assets: | |||||||||||||||||||
Cash | $ | — | $ | 231 | $ | 147 | $ | — | $ | 378 | |||||||||
Receivables, net | — | 56 | 97 | — | 153 | ||||||||||||||
Inventories | — | 139 | 78 | — | 217 | ||||||||||||||
Deferred income taxes | — | 6 | 1 | — | 7 | ||||||||||||||
Prepaid expenses and other | — | 5 | 6 | — | 11 | ||||||||||||||
Total current assets | — | 437 | 329 | — | 766 | ||||||||||||||
Property and equipment, at cost | — | 1,477 | 504 | — | 1,981 | ||||||||||||||
Accumulated depreciation | — | (494 | ) | (161 | ) | — | (655 | ) | |||||||||||
Property and equipment, net | — | 983 | 343 | — | 1,326 | ||||||||||||||
Goodwill and intangible assets, net | — | 20 | 29 | — | 49 | ||||||||||||||
Investments in subsidiaries | 1,714 | — | — | (1,714 | ) | — | |||||||||||||
Deferred income taxes | — | — | 93 | — | 93 | ||||||||||||||
Other assets, net | 32 | 32 | 5 | — | 69 | ||||||||||||||
Total assets | $ | 1,746 | $ | 1,472 | $ | 799 | $ | (1,714 | ) | $ | 2,303 | ||||||||
LIABILITIES AND STOCKHOLDERS’ EQUITY | |||||||||||||||||||
Current liabilities: | |||||||||||||||||||
Current portion of debt and capital lease obligations | $ | 35 | $ | 1 | $ | — | $ | — | $ | 36 | |||||||||
Accounts payable | — | 52 | 47 | — | 99 | ||||||||||||||
Accounts (receivable) payable to Valero | (1 | ) | 158 | 96 | — | 253 | |||||||||||||
Accrued expenses | 4 | 23 | 16 | — | 43 | ||||||||||||||
Taxes other than income taxes | — | 16 | 1 | — | 17 | ||||||||||||||
Income taxes payable | — | 1 | 9 | — | 10 | ||||||||||||||
Dividends payable | 5 | — | — | — | 5 | ||||||||||||||
Total current liabilities | 43 | 251 | 169 | — | 463 | ||||||||||||||
Debt and capital lease obligations, less current portion | 1,003 | 3 | — | — | 1,006 | ||||||||||||||
Deferred income taxes | — | 94 | — | — | 94 | ||||||||||||||
Intercompany payables (receivables) | 58 | (58 | ) | — | — | — | |||||||||||||
Asset retirement obligations | — | 61 | 18 | — | 79 | ||||||||||||||
Other long-term liabilities | 15 | 7 | 12 | — | 34 | ||||||||||||||
Total liabilities | 1,119 | 358 | 199 | — | 1,676 | ||||||||||||||
Commitments and contingencies | |||||||||||||||||||
Stockholders’ equity: | |||||||||||||||||||
Common stock | 1 | — | — | — | 1 | ||||||||||||||
APIC | 406 | 1,037 | 551 | (1,588 | ) | 406 | |||||||||||||
Retained Earnings | 87 | 77 | 49 | (126 | ) | 87 | |||||||||||||
AOCI | 133 | — | — | — | 133 | ||||||||||||||
Total stockholders’ equity | 627 | 1,114 | 600 | (1,714 | ) | 627 | |||||||||||||
Total liabilities and stockholders’ equity | $ | 1,746 | $ | 1,472 | $ | 799 | $ | (1,714 | ) | $ | 2,303 | ||||||||
19
CST BRANDS, INC.
CONDENSED NOTES TO CONSOLIDATED AND COMBINED FINANCIAL STATEMENTS (Continued)
CONSOLIDATING STATEMENTS OF INCOME AND COMPREHENSIVE INCOME
(Millions of Dollars)
(Unaudited)
Three Months Ended June 30, 2014 | |||||||||||||||||||
Parent Company | Guarantor Subsidiaries | Non-Guarantor Subsidiaries | Eliminations | Consolidated | |||||||||||||||
Operating revenues | $ | — | $ | 2,029 | $ | 1,232 | $ | — | $ | 3,261 | |||||||||
Cost of sales | — | 1,847 | 1,134 | — | 2,981 | ||||||||||||||
Gross profit | — | 182 | 98 | — | 280 | ||||||||||||||
Operating expenses: | |||||||||||||||||||
Operating expenses | — | 108 | 60 | — | 168 | ||||||||||||||
General and administrative expenses | 2 | 18 | 5 | — | 25 | ||||||||||||||
Depreciation, amortization and accretion expense | — | 21 | 9 | — | 30 | ||||||||||||||
Total operating expenses | 2 | 147 | 74 | — | 223 | ||||||||||||||
Operating (loss) income | (2 | ) | 35 | 24 | — | 57 | |||||||||||||
Other income, net | — | — | 1 | — | 1 | ||||||||||||||
Interest expense | (10 | ) | — | — | — | (10 | ) | ||||||||||||
Equity in earnings of subsidiaries | 44 | — | — | (44 | ) | — | |||||||||||||
Income (loss) before income tax expense | 32 | 35 | 25 | (44 | ) | 48 | |||||||||||||
Income tax expense | — | 9 | 7 | — | 16 | ||||||||||||||
Net income (loss) | 32 | 26 | 18 | (44 | ) | 32 | |||||||||||||
Other comprehensive income, net of tax: | |||||||||||||||||||
Foreign currency translation adjustment | 22 | — | — | — | 22 | ||||||||||||||
Comprehensive income (loss) | $ | 54 | $ | 26 | $ | 18 | $ | (44 | ) | $ | 54 | ||||||||
20
CST BRANDS, INC.
CONDENSED NOTES TO CONSOLIDATED AND COMBINED FINANCIAL STATEMENTS (Continued)
CONSOLIDATING AND COMBINING STATEMENTS OF INCOME AND COMPREHENSIVE INCOME
(Millions of Dollars)
(Unaudited)
Three Months Ended June 30, 2013 | |||||||||||||||||||
Parent Company | Guarantor Subsidiaries | Non-Guarantor Subsidiaries | Eliminations | Consolidated and Combined | |||||||||||||||
Operating revenues | $ | — | $ | 2,007 | $ | 1,204 | $ | — | $ | 3,211 | |||||||||
Cost of sales | — | 1,818 | 1,104 | — | 2,922 | ||||||||||||||
Gross profit | — | 189 | 100 | — | 289 | ||||||||||||||
Operating expenses: | |||||||||||||||||||
Operating expenses | — | 100 | 61 | — | 161 | ||||||||||||||
General and administrative expenses | 1 | 15 | 4 | — | 20 | ||||||||||||||
Depreciation, amortization and accretion expense | — | 21 | 9 | — | 30 | ||||||||||||||
Total operating expenses | 1 | 136 | 74 | — | 211 | ||||||||||||||
Operating (loss) income | (1 | ) | 53 | 26 | — | 78 | |||||||||||||
Other income, net | — | — | 1 | — | 1 | ||||||||||||||
Interest expense | (7 | ) | — | — | — | (7 | ) | ||||||||||||
Equity in earnings of subsidiaries | 28 | — | — | (28 | ) | — | |||||||||||||
Income (loss) before income tax expense | 20 | 53 | 27 | (28 | ) | 72 | |||||||||||||
Income tax expense | — | 23 | 8 | — | 31 | ||||||||||||||
Net income (loss) | 20 | 30 | 19 | (28 | ) | 41 | |||||||||||||
Other comprehensive loss, net of tax: | |||||||||||||||||||
Foreign currency translation adjustment | (18 | ) | — | — | — | (18 | ) | ||||||||||||
Comprehensive income (loss) | $ | 2 | $ | 30 | $ | 19 | $ | (28 | ) | $ | 23 | ||||||||
21
CST BRANDS, INC.
CONDENSED NOTES TO CONSOLIDATED AND COMBINED FINANCIAL STATEMENTS (Continued)
CONSOLIDATING STATEMENTS OF INCOME AND COMPREHENSIVE INCOME
(Millions of Dollars)
(Unaudited)
Six Months Ended June 30, 2014 | |||||||||||||||||||
Parent Company | Guarantor Subsidiaries | Non-Guarantor Subsidiaries | Eliminations | Consolidated | |||||||||||||||
Operating revenues | $ | — | $ | 3,828 | $ | 2,434 | $ | — | $ | 6,262 | |||||||||
Cost of sales | — | 3,495 | 2,242 | — | 5,737 | ||||||||||||||
Gross profit | — | 333 | 192 | — | 525 | ||||||||||||||
Operating expenses: | |||||||||||||||||||
Operating expenses | — | 213 | 119 | — | 332 | ||||||||||||||
General and administrative expenses | 3 | 37 | 10 | — | 50 | ||||||||||||||
Depreciation, amortization and accretion expense | — | 43 | 18 | — | 61 | ||||||||||||||
Total operating expenses | 3 | 293 | 147 | — | 443 | ||||||||||||||
Operating (loss) income | (3 | ) | 40 | 45 | — | 82 | |||||||||||||
Other income, net | — | — | 2 | — | 2 | ||||||||||||||
Interest expense | (20 | ) | — | — | — | (20 | ) | ||||||||||||
Equity in earnings of subsidiaries | 66 | — | — | (66 | ) | — | |||||||||||||
Income (loss) before income tax expense | 43 | 40 | 47 | (66 | ) | 64 | |||||||||||||
Income tax expense | — | 8 | 13 | — | 21 | ||||||||||||||
Net income (loss) | 43 | 32 | 34 | (66 | ) | 43 | |||||||||||||
Other comprehensive loss, net of tax: | |||||||||||||||||||
Foreign currency translation adjustment | (2 | ) | — | — | — | (2 | ) | ||||||||||||
Comprehensive income (loss) | $ | 41 | $ | 32 | $ | 34 | $ | (66 | ) | $ | 41 | ||||||||
22
CST BRANDS, INC.
CONDENSED NOTES TO CONSOLIDATED AND COMBINED FINANCIAL STATEMENTS (Continued)
CONSOLIDATING AND COMBINING STATEMENTS OF INCOME AND COMPREHENSIVE INCOME
(Millions of Dollars)
(Unaudited)
Six Months Ended June 30, 2013 | |||||||||||||||||||
Parent Company | Guarantor Subsidiaries | Non-Guarantor Subsidiaries | Eliminations | Consolidated and Combined | |||||||||||||||
Operating revenues | $ | — | $ | 3,935 | $ | 2,464 | $ | — | $ | 6,399 | |||||||||
Cost of sales | — | 3,608 | 2,266 | — | 5,874 | ||||||||||||||
Gross profit | — | 327 | 198 | — | 525 | ||||||||||||||
Operating expenses: | |||||||||||||||||||
Operating expenses | — | 199 | 121 | — | 320 | ||||||||||||||
General and administrative expenses | 1 | 26 | 8 | — | 35 | ||||||||||||||
Depreciation, amortization and accretion expense | — | 42 | 18 | — | 60 | ||||||||||||||
Total operating expenses | 1 | 267 | 147 | — | 415 | ||||||||||||||
Operating (loss) income | (1 | ) | 60 | 51 | — | 110 | |||||||||||||
Other income, net | — | — | 2 | — | 2 | ||||||||||||||
Interest expense | (7 | ) | — | — | — | (7 | ) | ||||||||||||
Equity in earnings of subsidiaries | 28 | — | — | (28 | ) | — | |||||||||||||
Income (loss) before income tax expense | 20 | 60 | 53 | (28 | ) | 105 | |||||||||||||
Income tax expense | — | 25 | 16 | — | 41 | ||||||||||||||
Net income (loss) | 20 | 35 | 37 | (28 | ) | 64 | |||||||||||||
Other comprehensive loss, net of tax: | |||||||||||||||||||
Foreign currency translation adjustment | (32 | ) | — | — | — | (32 | ) | ||||||||||||
Comprehensive (loss) income | $ | (12 | ) | $ | 35 | $ | 37 | $ | (28 | ) | $ | 32 | |||||||
23
CST BRANDS, INC.
CONDENSED NOTES TO CONSOLIDATED AND COMBINED FINANCIAL STATEMENTS (Continued)
CONSOLIDATING STATEMENTS OF CASH FLOWS
(Millions of Dollars)
(Unaudited)
Six Months Ended June 30, 2014 | |||||||||||||||||||
Parent Company | Guarantor Subsidiaries | Non-Guarantor Subsidiaries | Eliminations | Consolidated | |||||||||||||||
Cash flows from operating activities: | |||||||||||||||||||
Net cash (used in) provided by operating activities | $ | (22 | ) | $ | 114 | $ | 76 | $ | — | $ | 168 | ||||||||
Cash flows from investing activities: | |||||||||||||||||||
Capital expenditures | — | (76 | ) | (12 | ) | — | (88 | ) | |||||||||||
Acquisition | — | — | (4 | ) | — | (4 | ) | ||||||||||||
Other investing activities, net | — | (1 | ) | 1 | — | — | |||||||||||||
Net cash used in investing activities | — | (77 | ) | (15 | ) | — | (92 | ) | |||||||||||
Cash flows from financing activities: | |||||||||||||||||||
Payments of long-term debt | (16 | ) | — | — | — | (16 | ) | ||||||||||||
Payments of capital lease obligations | — | (1 | ) | — | — | (1 | ) | ||||||||||||
Dividends paid | (9 | ) | — | — | — | (9 | ) | ||||||||||||
Intercompany funding | 47 | (47 | ) | — | — | — | |||||||||||||
Net cash provided by (used in) financing activities | 22 | (48 | ) | — | — | (26 | ) | ||||||||||||
Effect of foreign exchange rate changes on cash | — | — | — | — | — | ||||||||||||||
Net (decrease) increase in cash | — | (11 | ) | 61 | — | 50 | |||||||||||||
Cash at beginning of period | — | 231 | 147 | — | 378 | ||||||||||||||
Cash at end of period | $ | — | $ | 220 | $ | 208 | $ | — | $ | 428 | |||||||||
24
CST BRANDS, INC.
CONDENSED NOTES TO CONSOLIDATED AND COMBINED FINANCIAL STATEMENTS (Continued)
CONSOLIDATING AND COMBINING STATEMENTS OF CASH FLOWS
(Millions of Dollars)
(Unaudited)
Six Months Ended June 30, 2013 | |||||||||||||||||||
Parent Company | Guarantor Subsidiaries | Non-Guarantor Subsidiaries | Eliminations | Consolidated and Combined | |||||||||||||||
Cash flows from operating activities: | |||||||||||||||||||
Net cash provided by operating activities | $ | (2 | ) | $ | 232 | $ | 121 | $ | — | $ | 351 | ||||||||
Cash flows from investing activities: | |||||||||||||||||||
Capital expenditures | — | (78 | ) | (12 | ) | — | (90 | ) | |||||||||||
Acquisitions | — | — | (4 | ) | — | (4 | ) | ||||||||||||
Other investing activities, net | — | (1 | ) | (1 | ) | — | (2 | ) | |||||||||||
Net cash used in investing activities | — | (79 | ) | (17 | ) | — | (96 | ) | |||||||||||
Cash flows from financing activities: | |||||||||||||||||||
Proceeds from issuance of long-term debt | 500 | — | — | — | 500 | ||||||||||||||
Debt issuance and credit facility origination costs | (18 | ) | — | — | — | (18 | ) | ||||||||||||
Payments of capital lease obligations | — | (1 | ) | — | — | (1 | ) | ||||||||||||
Net transfers (to) from Valero | (500 | ) | 90 | 32 | — | (378 | ) | ||||||||||||
Intercompany funding | 20 | (20 | ) | — | — | — | |||||||||||||
Net cash (used in) provided by financing activities | 2 | 69 | 32 | — | 103 | ||||||||||||||
Effect of foreign exchange rate changes on cash | — | — | (5 | ) | — | (5 | ) | ||||||||||||
Net increase in cash | — | 222 | 131 | — | 353 | ||||||||||||||
Cash at beginning of year | — | 44 | 17 | — | 61 | ||||||||||||||
Cash at end of period | $ | — | $ | 266 | $ | 148 | $ | — | $ | 414 | |||||||||
25
ITEM 2. MANAGEMENT’S DISCUSSION AND ANALYSIS OF FINANCIAL CONDITION AND RESULTS OF OPERATIONS
CAUTIONARY STATEMENT FOR THE PURPOSE OF THE SAFE HARBOR PROVISIONS OF THE PRIVATE SECURITIES LITIGATION REFORM ACT OF 1995
This Quarterly Report on Form 10-Q including, without limitation, our discussion below under the heading “Outlook,” includes forward-looking statements within the meaning of Section 27A of the Securities Act of 1933 and Section 21E of the Securities Exchange Act of 1934. You can identify our forward-looking statements by the words “anticipate,” “believe,” “expect,” “plan,” “intend,” “estimate,” “project,” “projection,” “predict,” “budget,” “forecast,” “goal,” “guidance,” “target,” “could,” “should,” “may,” and similar expressions.
These forward-looking statements include, among other things, statements regarding:
• | future retail gross profits, including gasoline, diesel, heating oil and convenience store merchandise gross profits; |
• | our anticipated level of capital investments and the effect of these capital investments on our results of operations; |
• | anticipated trends in the demand for, and volumes sold of, gasoline, diesel and heating oil globally and in the regions where we operate; |
• | expectations regarding environmental, tax and other regulatory initiatives; and |
• | the effect of general economic and other conditions on retail fundamentals. |
In general, we based the forward-looking statements on our current expectations, estimates and projections about our company and the industry in which we operate. We caution you that these statements are not guarantees of future performance as they involve assumptions that, while made in good faith, may prove to be incorrect, and involve risks and uncertainties we cannot predict. In addition, we based many of these forward-looking statements on assumptions about future events that may prove to be inaccurate. Accordingly, our actual outcomes and results may differ materially from what we have expressed or forecasted in the forward-looking statements. Any differences could result from a variety of factors, including the following:
• | competitive pressures from convenience stores and other non-traditional retailers located in our markets; |
• | volatility and seasonality in crude oil, wholesale motor fuel costs and motor fuel sales; |
• | increasing consumer preferences for alternative motor fuel and improvements in fuel efficiency; |
• | seasonal trends in the retail industry; |
• | severe or unfavorable weather conditions; |
• | fluctuations in the exchange rate between the U.S. and Canadian currencies; |
• | inability to build or acquire and successfully integrate new retail sites; |
• | our ability to comply with federal, provincial and state regulations, including those related to environmental matters, the sale of alcohol and cigarettes, and employment laws and health benefits; |
• | changes in our customers’ behavior and travel as a result of changing economic conditions, labor strikes or otherwise; |
• | dangers inherent in storing and transporting motor fuel; |
• | pending or future consumer, environmental or other litigation; |
26
• | significant increases in statutory minimum wage rates; |
• | litigation or adverse publicity concerning food quality, food safety or other health concerns related to our food product merchandise or restaurant facilities; |
• | wholesale cost increases of dairy, coffee or tobacco products; |
• | future legislation or campaigns to discourage smoking; |
• | dependence on Valero for motor fuel; |
• | dependence on suppliers, including Valero, for credit terms; |
• | dependence on senior management and the ability to attract qualified employees; |
• | acts of war and terrorism; |
• | political conditions in oil producing regions and global demand for oil; |
• | dependence on our Information Technology (“IT”) systems and maintaining data security and successfully migrating to stand-alone systems; |
• | changes in accounting standards, policies or estimates; |
• | impairment of long-lived assets, intangible assets or goodwill; |
• | our ability to comply with covenants in any credit agreements or other debt instruments and availability, terms and deployment of capital; |
• | the impact of the separation and distribution of Valero’s retail business (the “spin-off”) and risks relating to our ability to operate effectively as an independent, publicly traded company, including any difficulties associated with enhancing our accounting systems and internal controls and complying with financial reporting requirements; |
• | our different capital structure as an independent company, including our access to capital, credit ratings, debt and ability to raise additional debt or equity financing; |
• | any failure to fully and/or timely achieve the expected benefits of the spin-off; |
• | a determination by the IRS that the spin-off or certain related transactions should be treated as a taxable transaction; and |
• | other unforeseen factors. |
You should consider the areas of risk described above, as well as those set forth in the section entitled “Risk Factors” included in our Report on Form 10-K for the year ended December 31, 2013 (“Form 10-K”), in connection with considering any forward-looking statements that may be made by us and our businesses generally. We cannot assure you that projected results or events reflected in the forward-looking statements will be achieved or will occur. The forward-looking statements included in this report are made as of the date of this report. We undertake no obligation to publicly release any revisions to any forward-looking statements, to report events or to report the occurrence of unanticipated events.
27
MANAGEMENT’S DISCUSSION AND ANALYSIS OF FINANCIAL CONDITION AND
RESULTS OF OPERATIONS
RESULTS OF OPERATIONS
Management’s discussion and analysis is organized as follows:
• | Executive Overview—This section provides an overview of CST Brands Inc. (“CST,” “we,” “us,” “our”) including the spin-off of from Valero Energy Corporation (“Valero”) and a description of our business segments, significance of crude oil and wholesale motor fuel prices on our revenues and cost of sales, the seasonality of our business, our network optimization, the basis of presentation with respect to the amounts presented in the discussion of our results of operations, change in accounting principle, overview of our financial results and asset impairments. |
• | Results of Operations—This section provides an analysis of our results of operations, including the results of operations of our two business segments, for the three and six months ended June 30, 2014 and 2013, and an outlook for our two business segments. |
• | Liquidity and Capital Resources—This section provides a discussion of our financial condition and cash flows. It also includes a discussion of our debt, capital requirements and other matters impacting our liquidity and capital resources. |
• | New Accounting Policies—This section describes new accounting pronouncements that we have already adopted, those that we are required to adopt in the future, and those that became applicable in the current year as a result of new circumstances. |
• | Critical Accounting Policies Involving Critical Accounting Estimates—This section describes the accounting policies and estimates that we consider most important for our business and that require significant judgment. |
28
Executive Overview
The following Management’s Discussion and Analysis (“MD&A”) section is intended to help the reader understand our results of operations and financial condition. This section is provided as a supplement to, and should be read in conjunction with, our consolidated and combined financial statements and the accompanying notes to these financial statements contained elsewhere in this report, this MD&A section and the consolidated and combined financial statements and accompanying notes to these financial statements in our Form 10-K. Our Form 10-K contains a discussion of other matters not included herein, such as disclosures regarding critical accounting policies and estimates, and contractual obligations.
On April 4, 2013, Valero’s Board of Directors approved the spin-off, which was completed on May 1, 2013. We were formed solely in contemplation of the spin-off and, prior to May 1, 2013, had not commenced operations and had no material assets, liabilities or commitments.
We are one of the largest independent retailers of motor fuel and convenience merchandise items in North America. Our operations include (i) the sale of motor fuel at convenience stores, dealer/agent sites and cardlocks, (ii) the sale of convenience merchandise items and services at convenience stores and (iii) the sale of heating oil to residential customers and heating oil and motor fuel to small commercial customers. Operating revenues from our heating oil business were approximately 5% of our consolidated and combined operating revenues for the three months and six months ended June 30, 2014 and June 30, 2013 and have been included within our Canada segment information.
We use the term “retail site” as a general term to refer to any of the following types of retail locations through which we sell merchandise and/or motor fuel to our customers:
• | a “convenience store,” which is operated by us and provides motor fuel, food, convenience merchandise items and additional services to our customers; |
• | a “dealer/agent” site, where we retain title to the motor fuel inventory and sell it directly to our customers; therefore, we manage motor fuel pricing and retain the gross profit on motor fuel sales. We provide a commission to the dealer or agent to operate the retail site; or |
• | a “cardlock,” which is an unattended, self-service fueling station that provides motor fuel to our fleet customers, such as trucking and other commercial customers. |
We have two reportable segments:
• | U.S.—As of June 30, 2014, we had 1,044 convenience stores located in Arizona, Arkansas, California, Colorado, Louisiana, New Mexico, Oklahoma, Texas and Wyoming; and |
• | Canada—As of June 30, 2014, we had 850 retail sites located in New Brunswick, Newfoundland and Labrador, Nova Scotia, Ontario, Prince Edward Island and Québec. |
The reportable segments are strategic business units that experience different operating income margins due to geographic supply and demand attributes and specific country and local regulatory environments. Performance is evaluated based on a number of performance metrics, including sales per site per day, gross profit, operating income and earnings before interest, taxes, depreciation and amortization (“EBITDA”). There are no intersegment revenues.
The Significance of Crude Oil and Wholesale Motor Fuel Prices on Our Revenues and Cost of Sales
The cost of motor fuel is directly related to the cost of crude oil. A significant portion of our gross profit is derived from the sale of motor fuel. We typically experience lower motor fuel gross profits in periods when the cost of motor fuel increases, and higher motor fuel gross profits in periods when the cost of motor fuel declines rapidly or is more volatile. Therefore, changes in our motor fuel gross profit during the three and six month periods ended June 30, 2014 and 2013 are directly related to the changes in crude oil and wholesale motor fuel prices over the same periods and are further discussed in “Results of Operations” below.
29
The following graph provides benchmark information for both crude oil and wholesale motor fuel prices during the eighteen months ended June 30, 2014:
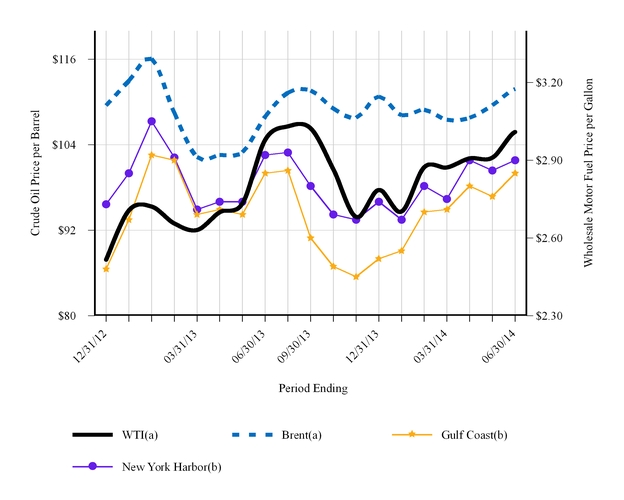
(a) Represents the average monthly spot price per barrel during the periods presented for WTI and Brent crude oil. One barrel represents 42 gallons.
(b) | Represents the average monthly spot price per gallon during the periods presented for U.S. Gulf Coast conventional gasoline and New York Harbor conventional gasoline. |
30
As discussed, we typically experience lower motor fuel gross profits in periods when the cost of motor fuel increases, and higher motor fuel gross profits in periods when the cost of motor fuel declines rapidly or is more volatile, as shown in the following table:
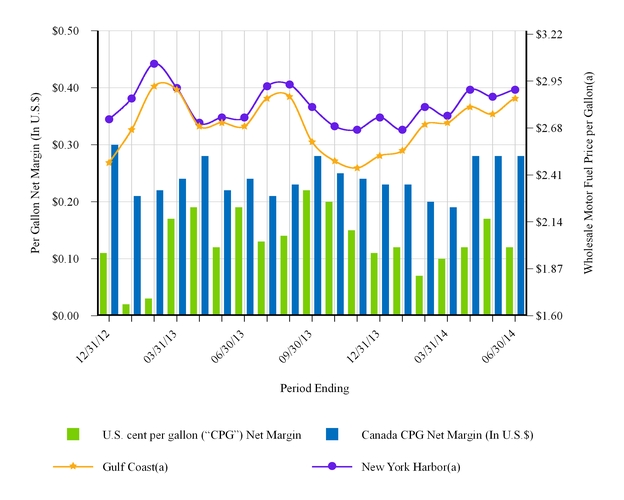
(a) | Represents the average monthly spot price per gallon during the periods presented for U.S. Gulf Coast conventional gasoline and New York Harbor conventional gasoline. |
Seasonality
Our business exhibits substantial seasonality due to the concentration of our retail sites in certain geographic areas, as well as changes in customer activity behaviors during different seasons. In general, sales volumes and operating income are highest in the second and third quarters during the summer activity months and lowest during the winter months.
Network Optimization
We have conducted market reviews across our entire U.S. system and, as a result, have identified approximately 100 company operated sites that are candidates for sale. We have engaged an outside consultant, NRC Realty & Capital Advisors, LLC, to market these properties. Stores were identified based on several criteria, and, while many of them are smaller in square footage and below our store average from an inside sales and operating cash flow perspective, these locations average over 3,000 gallons of motor fuel sold per store per day.
31
Basis of Presentation
The consolidated financial statements reflect our financial results for all periods subsequent to the spin-off while the combined financial statements reflect the financial results of Valero’s retail business for all periods prior to the spin-off.
Change in Accounting Principle
During the fourth quarter of 2013, we elected to change our method of valuing our Canada motor fuel inventory to the weighted-average cost method, whereas in all previous periods motor fuel inventory was valued using the last-in, first-out (“LIFO”) method. Comparative financial statements of prior periods have been adjusted to apply the new method retrospectively.
Financial Results
For the three months ended June 30, 2014 and 2013, we reported net income of $32 million and $41 million, respectively, and diluted earnings per share of $0.43 and $0.54, respectively. We experienced a decrease of $9 million in our consolidated gross profit during the 2014 quarter primarily due to a decline in the motor fuel gross profit in our U.S. segment and foreign exchange movements in our Canada segment. As disclosed in the graph above, steadily rising wholesale motor fuel prices during the second quarter of 2014 negatively impacted our U.S. motor fuel gross profit for our current quarter. Also impacting our 2014 net income for the three months ended June 30, 2014, were increases in operating expenses, general and administrative expenses and interest expense of $7 million, $5 million and $3 million, respectively, when compared to the same periods in 2013. The increase in operating expenses was due to an increase in the number of company operated convenience stores during 2014 and an increase in health care costs in the U.S. The increase in general and administrative expenses was the result of new costs associated with being an independent, stand-alone, public company, including additional corporate personnel and associated benefits and stock-based compensation. The increase in interest expense was the result of an increase in our indebtedness as a result of the debt issued in connection with the spin-off.
Net income for the six months ended June 30, 2014 and 2013 was $43 million and $64 million, respectively, and diluted earnings per share was $0.57 and $0.84, respectively. Year to date, our consolidated gross profit was flat compared to the prior year. Our merchandise gross profit in the U.S. improved $10 million primarily as a result of our new to industry stores, or NTIs, while our motor fuel gross profit in the U.S. declined $5 million primarily as a result of a decrease in our motor fuel gallons sold. Our gross profit in Canada declined $6 million primarily from a decrease in the value of the Canadian dollar. Also impacting our 2014 net income for the six months ended June 30, 2014, were increases in general and administrative expenses, interest expense and operating expenses of $15 million, $13 million and $12 million, respectively, when compared to the same periods in 2013. The increase in general and administrative expenses was the result of new costs associated with being an independent, stand-alone, public company, including additional corporate personnel and associated benefits and stock-based compensation. The increase in interest expense was the result of an increase in our indebtedness as a result of the debt issued in connection with the spin-off. The increase in operating expenses was due to an increase in the number of company operated convenience stores during 2014 and an increase in health care costs in the U.S.
Asset Impairments
We have not recorded any material asset impairments during the first six months of 2014. However, we have identified certain retail sites that have experienced lower than expected operating results during the first half of 2014. Our retail operations are seasonal and we generally experience our highest sales volumes and operating income during the second and third quarters during the summer activity months. We will continue to monitor these retail sites during the third quarter of 2014, considering both motor fuel gallons sold and motor fuel gross profit, among other factors. Following our evaluation of the performance of these sites subsequent to the 2014 driving season, we may record impairment charges of up to $25 million if the financial performance of these retail sites does not improve. Our results of operations and financial position could be materially and adversely affected.
32
Results of Operations
Consolidated and Combined Income Statement Analysis
Below is an analysis of our consolidated and combined income statements, which provides the primary reasons for significant increases and decreases in the various income statement line items from period to period. Comparative financial information of the prior year has been adjusted to apply the weighted-average cost method retrospectively to our Canada segment. Our consolidated and combined statements of income are as follows (in millions):
Three Months Ended | Six Months Ended | |||||||||||||||
June 30, | June 30, | |||||||||||||||
2014 | 2013 | 2014 | 2013 | |||||||||||||
Operating revenues | $ | 3,261 | $ | 3,211 | $ | 6,262 | $ | 6,399 | ||||||||
Cost of sales | 2,981 | 2,922 | 5,737 | 5,874 | ||||||||||||
Gross profit | 280 | 289 | 525 | 525 | ||||||||||||
Operating expenses: | ||||||||||||||||
Operating expenses | 168 | 161 | 332 | 320 | ||||||||||||
General and administrative expenses | 25 | 20 | 50 | 35 | ||||||||||||
Depreciation, amortization and accretion expense | 30 | 30 | 61 | 60 | ||||||||||||
Total operating expenses | 223 | 211 | 443 | 415 | ||||||||||||
Operating income | 57 | 78 | 82 | 110 | ||||||||||||
Other income, net | 1 | 1 | 2 | 2 | ||||||||||||
Interest expense | (10 | ) | (7 | ) | (20 | ) | (7 | ) | ||||||||
Income before income tax expense | 48 | 72 | 64 | 105 | ||||||||||||
Income tax expense | 16 | 31 | 21 | 41 | ||||||||||||
Net income | $ | 32 | $ | 41 | $ | 43 | $ | 64 | ||||||||
33
Three Months Ended June 30, 2014 Compared to Three Months Ended June 30, 2013
Operating revenues increased $50 million, or 2%, while gross profit declined $9 million, or 3%. Operating income declined $21 million, or 27%. The decline in operating income was primarily attributable to an increase in general and administrative expenses of $5 million and an increase in operating expenses of $7 million. These factors, along with an increase in interest expense of $3 million, were the primary reasons for the decline in net income of $9 million.
These results were driven by:
Operating revenues
Operating revenues increased $50 million, or 2%. Significant items impacting these results were:
• | A $22 million, or 1%, increase in our U.S. segment operating revenues primarily attributable to: |
◦ | An increase in the retail price per gallon of motor fuel that we sold contributed $21 million of the increase. This revenue increase was attributable to the volatility in wholesale gasoline prices, as discussed above under the heading “The Significance of Crude Oil and Wholesale Motor Fuel Prices on Our Revenues and Cost of Sales.” The average daily spot price of Gulf Coast Conventional gasoline (“GCC”) increased to $2.80 per gallon in the second quarter of 2014, compared to $2.69 per gallon in the second quarter of 2013. |
◦ | A decrease in motor fuel sales volumes of 1%, which decreased motor fuel operating revenues by $13 million. The decrease in motor fuel gallons sold resulted largely from an overall decrease in motor fuel demand caused by rising fuel prices combined with competitive factors in our markets, such as discount retailers that priced their motor fuel to gain or retain market share. |
◦ | Our merchandise revenues increased $13 million primarily as a result of our NTIs, as our average store count increased by ten stores over the same period of 2013. Also positively impacting our merchandise sales was the impact of the Easter holiday, which fell in the second quarter this year. |
• | A $28 million, or 2%, increase in our Canada segment operating revenues primarily attributable to: |
◦ | A decline of $69 million in operating revenues due to the weakness of the Canadian dollar relative to the U.S. dollar. On average, Canadian $1 was equal to U.S. $0.92 during the second quarter of 2014, and equal to U.S. $0.97 during the second quarter of 2013, representing a decrease in value of 5%. |
◦ | Excluding the effects of foreign exchange rate changes discussed above, our operating revenues increased $97 million, primarily attributable to an increase in the retail price of our motor fuel. The increase in our retail price of motor fuel was attributable to the volatility in wholesale gasoline prices, as discussed above under the heading “The Significance of Crude Oil and Wholesale Motor Fuel Prices on Our Revenues and Cost of Sales.” The average daily spot price of New York Harbor Conventional gasoline (“NYHC”) increased to $2.87 per gallon in the second quarter of 2014, compared to $2.72 per gallon in the second quarter of 2013. |
Cost of sales
Cost of sales increased $59 million, or 2%. Significant items impacting these results were:
• | A $64 million decline from the weakening of the Canadian dollar relative to the U.S. dollar. |
• | Offsetting the foreign exchange decline was an increase in our wholesale cost of motor fuel as a result of the increase in wholesale gasoline prices in both the U.S. and Canada, as discussed above. |
Operating expenses
Operating expenses increased by $7 million, or 4%, due primarily to an increase in the number of company operated convenience stores during 2014 and an increase in health care costs in the U.S.
34
General and administrative expenses
General and administrative expenses increased $5 million, or 25%, as a result of higher actual expenses as a stand-alone, publicly traded company, including additional corporate personnel and associated benefits (including health care benefits) and stock-based compensation.
Interest expense
Interest expense increased $3 million, or 43%, as a result of an increase in the amount of our indebtedness relating to our debt issued in connection with the spin-off.
Income tax expense
Income tax expense decreased $15 million primarily as a result of the decrease in income before income tax expense. Our effective tax rate decreased to 33% for the three months ended June 30, 2014 compared to an effective tax rate of 43% for the three months ended June 30, 2013. Our effective tax rate for 2013 was negatively impacted by $7 million in deferred tax expense resulting from the loss of certain state tax credits that were no longer eligible for use in our consolidated tax return after the spin-off.
Six Months Ended June 30, 2014 Compared to Six Months Ended June 30, 2013
Operating revenues declined $137 million, or 2%, while gross profit remained flat. Operating income declined $28 million, or 25%. The decline in operating income was primarily attributable to an increase in general and administrative expenses of $15 million and an increase in operating expenses of $12 million. These factors, along with an increase in interest expense of $13 million, were the primary reasons for the decline in net income of $21 million.
These results were driven by:
Operating revenues
Operating revenues declined $137 million, or 2%. Significant items impacting these results were:
• | A $107 million, or 3%, decline in our U.S. segment operating revenues primarily attributable to: |
◦ | A decline in the retail price per gallon of motor fuel that we sold contributed $43 million of the revenue decline. This decline was attributable to the volatility of wholesale gasoline prices, as discussed above under the heading “The Significance of Crude Oil and Wholesale Motor Fuel Prices on Our Revenues and Cost of Sales.” The average daily spot price of GCC decreased to $2.73 per gallon in the first half of 2014, compared to $2.76 per gallon in the first half of 2013. |
◦ | A decline in motor fuel sales volumes of 25 million gallons, which decreased motor fuel operating revenues by $84 million. The decrease in motor fuel gallons sold resulted primarily from unfavorable weather and a change from the marketing strategy we operated under prior to the spin-off. Under this strategy, we priced motor fuel with the overall objective of increasing motor fuel gallons sold with less emphasis on retail motor fuel gross margin, as more fully discussed in our Form 10-K. Also contributing to the decline in motor fuel gallons sold was an overall decrease in motor fuel demand caused by rising fuel prices combined with competitive factors in our markets, such as discount retailers that priced their motor fuel to gain or retain market share. |
◦ | Our merchandise revenues increased $21 million primarily as a result of our NTIs, as our average store count increased by eight stores over the same period of 2013. |
• | A $30 million, or 1%, decline in our Canada segment operating revenues primarily attributable to: |
◦ | A decline of $173 million in operating revenues due to the weakness of the Canadian dollar relative to the U.S. dollar. On average, Canadian $1 was equal to U.S. $0.92 during the first half of 2014, and equal to U.S. $0.98 during the first half of 2013, representing a decrease in value of 7%. |
35
◦ | Excluding the effects of foreign exchange rate changes, our operating revenues increased $143 million. This increase was primarily attributable to: |
▪ | A $120 million increase in operating revenues as a result of an increase in our motor fuel retail price. The increase in our retail price of motor fuel was attributable to the volatility in crude oil and wholesale gasoline prices, as discussed above under the heading “The Significance of Crude Oil and Wholesale Motor Fuel Prices on Our Revenues and Cost of Sales,” as well as an increase in provincial taxes in Québec. The average daily spot price of NYHC decreased to $2.81 per gallon in the first half of 2014, compared to $2.83 per gallon in the first half of 2013. The increased volatility of wholesale gas prices in the first half of 2014 compared to the first half of 2013 allowed us to maintain higher average retail prices despite a slight average decrease in the NYHC spot prices over the same periods. |
▪ | An increase in our home heating oil revenues of $32 million primarily attributable to colder weather. |
▪ | Partially offsetting these increases was a decline of $12 million attributable to a 3 million gallon decrease in the volume of motor fuel we sold as a result of colder weather and competitive factors in our markets as discussed above, primarily Québec. |
Cost of sales
Cost of sales declined $137 million, or 2%. Significant items impacting these results were:
• | A $160 million decline from the weakening of the Canadian dollar relative to the U.S. dollar. |
• | A 28 million gallon decrease in motor fuel gallons sold for the reasons discussed above. |
• | Partially offsetting the declines was an increase in our wholesale cost of motor fuel in Canada as a result of the volatility in wholesale gasoline prices, as discussed above under the heading “The Significance of Crude Oil and Wholesale Motor Fuel Prices on Our Revenues and Cost of Sales.” |
Operating expenses
Operating expenses increased by $12 million, or 4%, due to an increase in the number of company operated convenience stores during 2014 and an increase in health care costs in the U.S.
General and administrative expenses
General and administrative expenses increased $15 million, or 43%, as a result of higher actual expenses as a stand-alone, publicly traded company, including additional corporate personnel and associated benefits (including health care benefits) and stock-based compensation.
Interest expense
Interest expense increased $13 million as a result of an increase in the amount of our indebtedness relating to our debt issued in connection with the spin-off.
Income tax expense
Income tax expense decreased $20 million primarily as a result of the decrease in income before income tax expense. Our effective income tax rate decreased to 33% for the six months ended June 30, 2014 compared to an effective rate of 39% for the six months ended June 30, 2013. Our effective tax rate for 2013 was negatively impacted by $7 million in deferred tax expense resulting from the loss of certain state tax credits that were no longer eligible for use in our consolidated tax return after the spin-off.
36
Segment Results
U.S.
The following tables highlight the results of operations and certain operating metrics of our U.S. segment. The narrative following these tables provides an analysis of the results of operations of that segment (millions of dollars, except number of convenience stores, per site per day and per gallon amounts):
Three Months Ended | Six Months Ended | |||||||||||||||
June 30, | June 30, | |||||||||||||||
2014 | 2013 | 2014 | 2013 | |||||||||||||
Operating revenues: | ||||||||||||||||
Motor fuel | $ | 1,669 | $ | 1,661 | $ | 3,152 | $ | 3,280 | ||||||||
Merchandise | 345 | 332 | 646 | 625 | ||||||||||||
Other | 15 | 14 | 30 | 30 | ||||||||||||
Total operating revenues | $ | 2,029 | $ | 2,007 | $ | 3,828 | $ | 3,935 | ||||||||
Gross profit: | ||||||||||||||||
Motor fuel | $ | 65 | $ | 77 | $ | 109 | $ | 114 | ||||||||
Merchandise | 103 | 98 | 195 | 185 | ||||||||||||
Other | 14 | 14 | 29 | 28 | ||||||||||||
Total gross profit | 182 | 189 | 333 | 327 | ||||||||||||
Operating expenses | 108 | 100 | 213 | 199 | ||||||||||||
Depreciation, amortization and accretion expense | 21 | 21 | 43 | 42 | ||||||||||||
Operating income | $ | 53 | $ | 68 | $ | 77 | $ | 86 | ||||||||
Company operated retail sites at end of period | 1,044 | 1,034 | 1,044 | 1,034 | ||||||||||||
Average company operated retail sites during the period | 1,043 | 1,033 | 1,041 | 1,033 | ||||||||||||
Total system operating statistics: | ||||||||||||||||
Motor fuel sales (gallons per site per day) | 4,987 | 5,080 | 4,891 | 5,064 | ||||||||||||
Motor fuel sales (per site per day) | $ | 17,583 | $ | 17,683 | $ | 16,723 | $ | 17,552 | ||||||||
Motor fuel gross profit per gallon: | ||||||||||||||||
Motor fuel gross profit, before credit card fees | $ | 0.183 | $ | 0.207 | $ | 0.162 | $ | 0.161 | ||||||||
Credit card fees | (0.045 | ) | (0.042 | ) | (0.043 | ) | (0.041 | ) | ||||||||
Motor fuel gross profit, net | $ | 0.138 | $ | 0.165 | $ | 0.119 | $ | 0.120 | ||||||||
Merchandise sales (per site per day) | $ | 3,632 | $ | 3,524 | $ | 3,427 | $ | 3,342 | ||||||||
Merchandise gross profit, net (percentage of merchandise revenues): | ||||||||||||||||
Merchandise gross profit, before credit card fees | 30.6 | % | 30.3 | % | 31.0 | % | 30.3 | % | ||||||||
Credit card fees affect on profit | (0.8 | ) | (0.7 | ) | (0.8 | ) | (0.7 | ) | ||||||||
Merchandise gross profit, net | 29.8 | % | 29.6 | % | 30.2 | % | 29.6 | % | ||||||||
37
U.S. (continued)
Three Months Ended | Six Months Ended | |||||||||||||||
June 30, | June 30, | |||||||||||||||
2014 | 2013 | 2014 | 2013 | |||||||||||||
Company Operated Retail Sites: | ||||||||||||||||
Beginning of period | 1,041 | 1,033 | 1,036 | 1,032 | ||||||||||||
NTIs | 4 | 4 | 10 | 5 | ||||||||||||
Acquisitions | — | — | — | — | ||||||||||||
Closed | (1 | ) | (3 | ) | (2 | ) | (3 | ) | ||||||||
End of period | 1,044 | 1,034 | 1,044 | 1,034 | ||||||||||||
Average company operated retail sites during the period | 1,043 | 1,033 | 1,041 | 1,033 | ||||||||||||
Same Store Information(a): | ||||||||||||||||
Company operated retail sites | 1,011 | 1,011 | 1,005 | 1,005 | ||||||||||||
Motor fuel sales (gallons per site per day) | 4,892 | 5,124 | 4,790 | 5,086 | ||||||||||||
Merchandise sales (per site per day) | $ | 3,567 | $ | 3,544 | $ | 3,355 | $ | 3,346 | ||||||||
Merchandise gross profit percent, net | 29.7 | % | 29.5 | % | 30.0 | % | 29.5 | % | ||||||||
Merchandise sales, ex. cigarettes (per site per day) | $ | 2,527 | $ | 2,457 | $ | 2,352 | $ | 2,290 | ||||||||
Merchandise gross profit percent, net ex. cigarettes | 35.2 | % | 35.6 | % | 35.6 | % | 35.8 | % | ||||||||
Merchandise gross profit dollars | $ | 97 | $ | 96 | $ | 183 | $ | 180 | ||||||||
Other services operating revenues(b) | $ | 14 | $ | 14 | $ | 27 | $ | 28 | ||||||||
NTI Information(c): | ||||||||||||||||
Company operated retail sites at end of period | 58 | 38 | 58 | 38 | ||||||||||||
Company operated retail sites (average) | 57 | 36 | 54 | 35 | ||||||||||||
Motor fuel sales (gallons per site per day) | 9,415 | 10,073 | 9,263 | 9,936 | ||||||||||||
Merchandise sales (per site per day) | $ | 6,790 | $ | 6,904 | $ | 6,427 | $ | 6,449 | ||||||||
Merchandise gross profit percent, net | 32.5 | % | 33.3 | % | 33.0 | % | 32.9 | % | ||||||||
Merchandise sales, ex. cigarettes (per site per day) | $ | 5,458 | $ | 5,446 | $ | 5,139 | $ | 5,047 | ||||||||
Merchandise gross profit percent, net ex. cigarettes | 36.6 | % | 37.9 | % | 37.1 | % | 37.5 | % | ||||||||
(a) | The same store information consists of aggregated individual store results for all sites in operation substantially throughout both periods presented. Stores that were temporarily closed for a brief period of time during the periods being compared remain in the same store sales comparison. If a store is replaced, either at the same location or relocated to a new location, it is removed from the comparison until the new store has been in operation for substantially all of the periods being compared. |
(b) | Other services include revenues from car wash and commissions from lottery, money orders, air/water/vacuum services, video and game rentals and access to ATMs. |
(c) | New to industry convenience stores (“NTIs”) consist of all new stores opened after January 1, 2008, which is generally when we began operating our larger formatted stores that accommodate broader merchandise categories and food offerings and have more fuel dispensers than our legacy stores. |
38
Three Months Ended June 30, 2014 Compared to Three Months Ended June 30, 2013
Operating revenues increased $22 million, or 1%, and gross profit declined $7 million, or 4%. Operating income declined $15 million, or 22%, due to the decline in gross profit and an increase in operating expenses of $8 million, or 8%.
These results were driven by:
Operating revenues
• | An increase in the retail price per gallon of motor fuel that we sold, which contributed $21 million of the increase to our motor fuel operating revenues, which was attributable to the volatility in wholesale gasoline prices, as discussed above under the heading “The Significance of Crude Oil and Wholesale Motor Fuel Prices on Our Revenues and Cost of Sales.” The average daily spot price of GCC increased to $2.80 per gallon in the second quarter of 2014, compared to $2.69 per gallon in the second quarter of 2013. |
• | A decrease in motor fuel gallons sold of 1%, which decreased motor fuel operating revenues by $13 million. The decrease in motor fuel gallons sold resulted from an overall decrease in motor fuel demand caused by rising fuel prices combined with competitive factors in our markets, such as discount retailers that priced their motor fuel to gain or retain market share. |
• | Our merchandise revenues increased $13 million primarily as a result of our NTIs, as our average store count increased by ten stores over the same period of 2013, and the positive trend in same store sales. Also positively impacting our merchandise sales was the impact of the Easter holiday, which fell in the second quarter this year. |
Gross profit
• | A decrease in motor fuel gross profit of $12 million due to a $0.03 decrease in our motor fuel gross profit per gallon. The decrease in CPG was driven by volatility in crude oil and wholesale motor fuel prices, as discussed under the heading “The Significance of Crude Oil and Wholesale Motor Fuel Prices on Our Revenues and Cost of Sales.” This volatility was particularly attributable to the period from mid-May to mid-June, when wholesale motor fuel prices increased over 9%. June is historically the highest month for motor fuel gallons sold during the quarter. |
• | An increase of $5 million in our merchandise gross profit primarily from an increase in the average number of company operated convenience stores during 2014 as well as the impact of the Easter holiday. |
Operating expenses
• | Operating expenses increased $8 million, or 8%, primarily as a result of increased payroll and benefit expenses resulting from both NTIs and an increase in health care costs. |
39
Six Months Ended June 30, 2014 Compared to Six Months Ended June 30, 2013
Operating revenues declined $107 million, or 3% and gross profit increased $6 million, or 2%. Operating income decreased $9 million, or 10%, due to an increase in operating expenses of $14 million, or 7%, which was partially offset by the increase in gross profit.
These results were driven by:
Operating revenues
• | A decline in the retail price per gallon of motor fuel that we sold contributed $43 million of the decline to our motor fuel operating revenues, which was attributable to the volatility in wholesale gasoline prices, as discussed above under the heading “The Significance of Crude Oil and Wholesale Motor Fuel Prices on Our Revenues and Cost of Sales.” The average daily spot price of GCC decreased to $2.73 per gallon in the first half of 2014, compared to $2.76 per gallon in the first half of 2013. |
• | A decline in motor fuel sales volumes of 25 million gallons, which decreased motor fuel operating revenues by $84 million. The decrease in motor fuel gallons sold resulted primarily from unfavorable weather and a change from the marketing strategy we operated under prior to the spin-off. Under this strategy, we priced motor fuel with the overall objective of increasing motor fuel gallons sold with less emphasis on retail motor fuel gross margin, as more fully discussed in our Form 10-K. Also contributing to the decline in motor fuel gallons sold was an overall decrease in motor fuel demand caused by rising fuel prices combined with competitive factors in our markets, such as discount retailers that priced their motor fuel to gain or retain market share. |
• | Our merchandise revenues increased $21 million primarily as a result of our NTIs, as our average store count increased by eight stores over the same period of 2013. Our NTIs have a broader offering and typically contribute twice the merchandise sales of our legacy stores. |
Gross profit
• | A decrease in motor fuel gross profit of $5 million primarily due to a decrease in our motor fuel gallons sold for the reasons discussed above. |
• | An increase of $10 million in our merchandise gross profit primarily from an increase in the average number of company operated convenience stores during 2014 as well as an increase in our merchandise gross profit percentage during 2014. The growth in our merchandise gross profit percentage was driven by the contribution of higher profit merchandise items sold at our NTIs, such as our proprietary brand and fresh food offerings. |
Operating expenses
• | Operating expenses increased $14 million, or 7%, primarily as a result of increased payroll and benefit expenses resulting from both NTIs and an increase in health care costs. |
40
Canada
The following tables highlight the results of operations and certain operating metrics of our Canada segment. The narrative following these tables provides an analysis of the results of operations of that segment (millions of U.S. dollars, except number of retail sites, per site per day and per gallon amounts):
Three Months Ended | Six Months Ended | |||||||||||||||
June 30, | June 30, | |||||||||||||||
2014 | 2013 | 2014 | 2013 | |||||||||||||
Operating revenues: | ||||||||||||||||
Motor fuel | $ | 1,060 | $ | 1,040 | $ | 2,026 | $ | 2,062 | ||||||||
Merchandise | 66 | 67 | 119 | 126 | ||||||||||||
Other | 106 | 97 | 289 | 276 | ||||||||||||
Total operating revenues | $ | 1,232 | $ | 1,204 | $ | 2,434 | $ | 2,464 | ||||||||
Gross profit: | ||||||||||||||||
Motor fuel | $ | 62 | $ | 63 | $ | 111 | $ | 116 | ||||||||
Merchandise | 18 | 19 | 33 | 35 | ||||||||||||
Other | 18 | 18 | 48 | 47 | ||||||||||||
Total gross profit | 98 | 100 | 192 | 198 | ||||||||||||
Operating expenses | 60 | 61 | 119 | 121 | ||||||||||||
Depreciation, amortization and accretion expense | 9 | 9 | 18 | 18 | ||||||||||||
Operating income | $ | 29 | $ | 30 | $ | 55 | $ | 59 | ||||||||
Retail sites (end of period): | ||||||||||||||||
Company operated | 279 | 265 | 279 | 265 | ||||||||||||
Dealers / Agents (fuel only) | 498 | 498 | 498 | 498 | ||||||||||||
Cardlock (fuel only) | 73 | 78 | 73 | 78 | ||||||||||||
Total retail sites (end of period) | 850 | 841 | 850 | 841 | ||||||||||||
Average retail sites during the period: | ||||||||||||||||
Company operated | 279 | 264 | 275 | 263 | ||||||||||||
Dealers / Agents (fuel only) | 497 | 500 | 498 | 503 | ||||||||||||
Cardlock (fuel only) | 74 | 77 | 75 | 79 | ||||||||||||
Average retail sites during the period | 850 | 841 | 848 | 845 | ||||||||||||
Total system operating statistics: | ||||||||||||||||
Motor fuel sales (gallons per site per day) | 3,256 | 3,315 | 3,178 | 3,210 | ||||||||||||
Motor fuel sales (per site per day) | $ | 13,706 | $ | 13,576 | $ | 13,198 | $ | 13,491 | ||||||||
Motor fuel gross profit per gallon: | ||||||||||||||||
Motor fuel gross profit, before credit card fees | $ | 0.269 | $ | 0.269 | $ | 0.250 | $ | 0.258 | ||||||||
Credit card fees | (0.023 | ) | (0.022 | ) | (0.022 | ) | (0.022 | ) | ||||||||
Motor fuel gross profit, net | $ | 0.246 | $ | 0.247 | $ | 0.228 | $ | 0.236 | ||||||||
Company operated retail site statistics: | ||||||||||||||||
Merchandise sales (per site per day) | $ | 2,589 | $ | 2,798 | $ | 2,386 | $ | 2,646 | ||||||||
Merchandise gross profit, net (percentage of merchandise revenues): | ||||||||||||||||
Merchandise gross profit, before credit card fees | 28.9 | % | 28.6 | % | 28.9 | % | 28.4 | % | ||||||||
Credit card fees affect on profit | (0.8 | ) | (0.7 | ) | (0.8 | ) | (0.7 | ) | ||||||||
Merchandise gross profit, net | 28.1 | % | 27.9 | % | 28.1 | % | 27.7 | % | ||||||||
41
Canada (continued)
Company Operated(b) | ||||||||||||||||
Three Months Ended | Six Months Ended | |||||||||||||||
June 30, | June 30, | |||||||||||||||
2014 | 2013 | 2014 | 2013 | |||||||||||||
Retail Sites: | ||||||||||||||||
Beginning of period | 276 | 262 | 272 | 261 | ||||||||||||
NTIs | — | — | 1 | — | ||||||||||||
Acquisitions | 2 | 1 | 4 | 1 | ||||||||||||
Conversions, net(a) | 1 | 2 | 2 | 3 | ||||||||||||
Closed | — | — | — | — | ||||||||||||
End of period | 279 | 265 | 279 | 265 | ||||||||||||
Average company operated retail sites during the period | 279 | 264 | 275 | 263 | ||||||||||||
Average foreign exchange rate for $1 CAD to USD | 0.92207 | 0.97260 | 0.91717 | 0.98153 | ||||||||||||
Same Store Information ($ amounts in CAD)(c),(d): | ||||||||||||||||
Company operated retail sites | 259 | 259 | 258 | 258 | ||||||||||||
Motor fuel sales (gallons per site per day) | 3,427 | 3,532 | 3,382 | 3,482 | ||||||||||||
Merchandise sales (per site per day) | $ | 2,852 | $ | 2,893 | $ | 2,636 | $ | 2,720 | ||||||||
Merchandise gross profit percent, net | 28.1 | % | 27.9 | % | 28.2 | % | 27.7 | % | ||||||||
Merchandise sales, ex. cigarettes (per site per day) | $ | 1,428 | $ | 1,458 | $ | 1,324 | $ | 1,361 | ||||||||
Merchandise gross profit percent, net ex. cigarettes | 36.9 | % | 36.8 | % | 37.1 | % | 37.2 | % | ||||||||
Merchandise gross profit dollars | $ | 19 | $ | 19 | $ | 35 | $ | 35 | ||||||||
Other services operating revenues(e) | $ | 4 | $ | 4 | $ | 9 | $ | 8 | ||||||||
NTI Information ($ amounts in CAD)(c),(f): | ||||||||||||||||
Company operated retail sites at end of period | 24 | 16 | 24 | 16 | ||||||||||||
Company operated retail sites (average) | 24 | 16 | 24 | 16 | ||||||||||||
Motor fuel sales (gallons per site per day) | 5,231 | 5,706 | 5,132 | 5,539 | ||||||||||||
Merchandise sales (per site per day) | $ | 3,209 | $ | 3,384 | $ | 2,935 | $ | 3,112 | ||||||||
Merchandise gross profit percent, net | 29.2 | % | 29.4 | % | 28.9 | % | 29.1 | % | ||||||||
Merchandise sales, ex. cigarettes (per site per day) | $ | 1,745 | $ | 1,802 | $ | 1,604 | $ | 1,652 | ||||||||
Merchandise gross profit percent, net ex. cigarettes | 37.2 | % | 39.0 | % | 36.8 | % | 38.8 | % | ||||||||
42
Canada (continued)
Dealers/Agents(b) | ||||||||||||
Three Months Ended | Six Months Ended | |||||||||||
June 30, | June 30, | |||||||||||
2014 | 2013 | 2014 | 2013 | |||||||||
Retail Sites: | ||||||||||||
Beginning of period | 498 | 501 | 499 | 507 | ||||||||
New dealers | 2 | 2 | 4 | 3 | ||||||||
Conversions, net(a) | (1 | ) | (2 | ) | (2 | ) | (3 | ) | ||||
Closed or de-branded | (1 | ) | (3 | ) | (3 | ) | (9 | ) | ||||
End of period | 498 | 498 | 498 | 498 | ||||||||
Average retail sites during the period | 497 | 500 | 498 | 503 | ||||||||
Same Store Information(d): | ||||||||||||
Retail sites | 471 | 471 | 466 | 466 | ||||||||
Motor fuel sales (gallons per site per day) | 2,714 | 2,826 | 2,601 | 2,684 | ||||||||
(a) | Conversions represent stores that have changed their classification from dealers/agents to company owned and operated or vice versa. Changes in classification result when we either take over the operations of dealers/agents or convert an existing company owned and operated store to dealers/agents. |
(b) | Company operated retail sites sell motor fuel and merchandise and we only retain the gross profit from motor fuel sales at dealers/agents. |
(c) | All amounts presented are stated in Canadian dollars to remove the impact of foreign exchange and all fuel information excludes amounts related to cardlock operations. |
(d) | The same store information consists of aggregated individual store results for all sites in operation substantially throughout both periods presented. Stores that were temporarily closed for a brief period of time during the periods being compared remain in the same store sales comparison. If a store is replaced, either at the same location or relocated to a new location, it is removed from the comparison until the new store has been in operation for substantially all of the periods being compared. |
(e) | Other services include revenues from car wash and commissions from lottery, money orders, air/water/vacuum services, video and game rentals and access to ATMs. |
(f) | NTIs consist of all new stores opened after January 1, 2008, which is generally when we began operating our larger formatted stores that accommodate broader merchandise categories and food offerings. NTIs exclude dealers/agents. |
43
Three Months Ended June 30, 2014 Compared to Three Months Ended June 30, 2013
Operating revenues increased $28 million, or 2%, and gross profit declined $2 million, or 2%, which was the primary reason for the operating income decline of $1 million, or 3%.
Significant items impacting these results included:
Operating revenues
• | A decline of $69 million in operating revenues due to the weakness of the Canadian dollar relative to the U.S. dollar. On average, Canadian $1 was equal to U.S. $0.92 during the second quarter of 2014, and equal to U.S. $0.97 during the second quarter of 2013, representing a decrease in value of 5%. |
• | Excluding the effects of foreign exchange rate changes, our operating revenues increased $97 million, primarily attributable to an increase in the retail price of our motor fuel. The increase in our retail price of motor fuel was attributable to the volatility in wholesale gasoline prices, as discussed above under the heading “The Significance of Crude Oil and Wholesale Motor Fuel Prices on Our Revenues and Cost of Sales,” as well as an increase in provincial taxes in Québec. The average daily spot price of NYHC increased to $2.87 per gallon in the second quarter of 2014, compared to $2.72 per gallon in the second quarter of 2013. |
Gross profit
• | The decrease in the value of the Canadian dollar resulted in a $5 million gross profit decline. |
• | Excluding the effects of foreign exchange, our motor fuel gross profit increased $3 million while our merchandise gross profit was flat. The increase in our motor fuel gross profit was attributable to a $.01 per gallon increase. |
Six Months Ended June 30, 2014 Compared to Six Months Ended June 30, 2013
Operating revenues declined $30 million, or 1%, and gross profit declined $6 million, or 3%, which was the primary reason for the operating income decline of $4 million, or 7%.
Significant items impacting these results included:
Operating revenues
• | A decline of $173 million in operating revenues due to the weakness of the Canadian dollar relative to the U.S. dollar. On average, Canadian $1 was equal to U.S. $0.92 during the first half of 2014, and equal to U.S. $0.98 during the first half of 2013, representing a decrease in value of 7%. |
• | Excluding the effects of foreign exchange rate changes, our operating revenues increased $143 million. This increase was primarily attributable to: |
◦ | A $120 million increase in operating revenues primarily attributable to an increase in the retail price of our motor fuel. The increase in our retail price of motor fuel was attributable to the volatility in wholesale gasoline prices, as discussed above under the heading “The Significance of Crude Oil and Wholesale Motor Fuel Prices on Our Revenues and Cost of Sales,” as well as an increase in provincial taxes in Québec. The average daily spot price of NYHC decreased to $2.81 per gallon in the first half of 2014, compared to $2.83 per gallon in the first half of 2013. The increased volatility of wholesale gas prices in the first half of 2014 compared to the first half of 2013 allowed us to maintain higher average retail prices despite a slight average decrease in the NYHC spot prices over the same periods. |
◦ | An increase in our home heating oil revenues of $32 million primarily attributable to colder weather. |
◦ | Partially offsetting these increases was a decline of $12 million attributable to a 3 million gallon decrease in the volume of motor fuel we sold as a result of colder weather and an overall decrease in motor fuel demand caused by rising fuel prices combined with competitive factors in our markets, primarily Québec, such as discount retailers that priced their motor fuel to gain or retain market share. |
44
Gross profit
• | The decrease in the value of the Canadian dollar resulted in a $14 million gross profit decline. |
• | Excluding the effects of foreign exchange, our motor fuel gross profit increased $3 million while our merchandise gross profit was flat. The increase in our motor fuel gross profit was attributable to a per gallon increase of slightly less than one cent. |
• | Excluding the effects of foreign exchange, our gross profit from other revenues increased $4 million, primarily due to the increase in home heating revenues for the reasons discussed above. |
Outlook
U.S.
The U.S. segment continues to operate in a very competitive environment. The upward trend in crude oil prices remained unusually high through the second quarter, caused in part by global tension, which could potentially keep the price of crude oil high until the tension subsides. Regarding fuel, we expect to continue to see volatile pricing and intense competition, including from our peers, and high volume retailers. Cross promotional programs entered into between grocers and convenience stores continue to represent a competitive challenge. We believe that our experience and our focus on maximizing gross profit allow us to compete effectively in this competitive environment. Our scale, distribution capabilities, private label penetration, and team members position us to offer a delightful, convenient shopping occasion favored by today’s consumer. We vary our offerings and retail prices by location in order to better serve our local customers. We will continue our aggressive growth strategy regarding our NTI program, projecting to build 30 stores in 2014. Aside from the ability to serve substantially more customers, our NTIs provide more product variety and enhanced offerings such as expanded food service. As we introduce more NTIs into our network each year, we expect that our higher margin food offerings will become a more significant part of our inside-store sales. As reflected in our results, we expect to continue to grow our merchandise sales and gross profit in 2014.
Canada
Like our U.S. segment, the Canada segment continues to operate in a very competitive environment. Certain non-traditional competitors, such as discount warehouse memberships and grocery chains, have added motor fuel offerings. Cross promotional programs also are a competitive challenge. While currently representing a limited amount of our motor fuel supply, we are expanding our fuel offering into a wider portfolio of brands, which allows us to gain insight into expanded marketing tools that impact consumer behavior. Similar to the U.S., we believe there is an opportunity to better serve consumers by increasing our offerings to include more grocery items and/or an expanded food service offering specific to each of our markets. The increased offerings in our stores have, in part, allowed us to expand our same store gross margin percentage during the year, which we expect to continue in 2014. Our results were negatively impacted by the weakness of the Canadian dollar relative to the U.S. dollar and, based on current forecasts, will most likely continue for at least the near-term.
45
Liquidity and Capital Resources
Cash Flows
Net cash provided by operating activities for the six months ended June 30, 2014 was $168 million compared to net cash provided by operating activities of $351 million for the six months ended June 30, 2013. The cash provided by operating activities during 2013 was positively impacted by $342 million due to the change related to our payment terms on motor fuel purchased from Valero, which were increased to “net 10” days after taking title to the motor fuel. Changes in cash provided by or used for working capital are shown in Note 12 of the condensed notes to the consolidated and combined financial statements included elsewhere in this report.
Net cash used in investing activities for the six months ended June 30, 2014 was $92 million, compared to net cash used in investing activities of $96 million for the six months ended June 30, 2013. Net cash used in investing activities for both periods primarily related to capital expenditures, as described further under the heading “Capital Requirements” below.
Net cash used in financing activities for the six months ended June 30, 2014 was $26 million, related to the payment of long-term debt and dividends, compared to net cash provided by financing activities of $103 million for the six months ended June 30, 2013. Cash provided by financing activities in 2013 related to the issuance of long-term debt, net against cash transferred to Valero. During the first half of 2013, we transferred $378 million of net cash to Valero, primarily from proceeds of our new term loan facility, which were not retained by us, offset by the net cash activity between us and Valero prior to the separation and distribution.
Non–GAAP Measures
EBITDA is a non-U.S. GAAP financial measure that represents net income before income taxes, interest expense and depreciation, amortization and accretion expense. EBITDAR is a non-U.S. GAAP financial measure that further adjusts EBITDA by excluding minimum rent expense. We believe that EBITDA and EBITDAR are useful to investors and creditors in evaluating our operating performance because (a) they facilitate management’s ability to measure the operating performance of our business on a consistent basis by excluding the impact of items not directly resulting from our retail operations; (b) securities analysts and other interested parties use such calculations as a measure of financial performance and debt service capabilities; and (c) the financial covenants in our debt agreements use EBITDA and EBITDAR in calculating our total lease adjusted leverage ratio and fixed charge coverage ratio. EBITDA and EBITDAR are not recognized terms under U.S. GAAP and do not purport to be alternatives to net income as a measure of operating performance or to cash flows from operating activities as a measure of liquidity. EBITDA and EBITDAR have limitations as analytical tools and should not be considered in isolation or as a substitute for analysis of our results of operations as reported under U.S. GAAP.
The following table presents a reconciliation of net income to EBITDA and EBITDAR (in millions):
Three Months Ended | Six Months Ended | |||||||||||||||
June 30, | June 30, | |||||||||||||||
2014 | 2013 | 2014 | 2013 | |||||||||||||
Net income | $ | 32 | $ | 41 | $ | 43 | $ | 64 | ||||||||
Interest expense | 10 | 7 | 20 | 7 | ||||||||||||
Income tax expense | 16 | 31 | 21 | 41 | ||||||||||||
Depreciation, amortization and accretion | 30 | 30 | 61 | 60 | ||||||||||||
EBITDA | 88 | 109 | 145 | 172 | ||||||||||||
Minimum rent expense | 7 | 7 | 14 | 13 | ||||||||||||
EBITDAR | $ | 95 | $ | 116 | $ | 159 | $ | 185 | ||||||||
46
Debt
As of June 30, 2014, our debt consisted of the following (in millions):
5.00% senior notes due 2023 | $ | 550 | ||
Term loan due 2018 (interest rate of 1.90% at June 30, 2014) | 472 | |||
Total debt outstanding | 1,022 | |||
Less current portion | 41 | |||
Debt, less current portion | $ | 981 | ||
We also have an undrawn revolving credit facility with an aggregate principal amount of up to $300 million. As of June 30, 2014, after taking into account letters of credit and the maximum lease adjusted leverage ratio constraint to availability, approximately $121 million was available for future borrowings. The credit facilities contain certain customary representations and warranties, covenants and events of default as well as certain financial covenants. The credit facilities also contain financial covenants (as defined in the credit agreement) consisting of (a) a maximum total lease adjusted leverage ratio set at 3.75 to 1.00, (b) a minimum fixed charge coverage ratio set at 1.30 to 1.00, and (c) limitations on expansion capital expenditures. As of June 30, 2014, our lease adjusted leverage ratio and fixed charge coverage ratio were 3.42 to 1.00 and 2.17 to 1.00, respectively.
As of June 30, 2014, we also had capital lease obligations of $7 million of which $1 million are current obligations.
See Note 5 of the condensed notes to the consolidated and combined financial statements included elsewhere in this report for additional disclosures of our indebtedness.
Capital Requirements
Our capital expenditures and investments relate primarily to the acquisition of land and the construction of NTIs. We also spend capital to improve and renovate our existing retail sites, which we refer to as sustaining capital and, from time to time, we enter into strategic acquisitions. In 2014, our capital expenditures will also include amounts related to the purchase and improvement of our new corporate campus. We believe we have adequate liquidity from cash on hand and borrowing capacity under our revolving credit facility to continue to operate and grow our business for the next twelve months.
During 2014, we expect to expand and upgrade our portfolio of retail sites. We expect to build 30 NTIs in the U.S., primarily focused in key markets in Texas. In Canada, we expect to complete 8 NTIs, focused in the Greater Toronto, Ottawa and Montreal areas. During the first half of 2014, we completed 10 NTIs in the U.S. and one NTI in Canada.
The following table outlines our capital expenditures by segment for the six months ended June 30, 2014 and 2013 (in millions):
Six Months Ended June 30, | ||||||||
2014 | 2013 | |||||||
U.S. Segment | ||||||||
NTI | $ | 54 | $ | 48 | ||||
Sustaining capital | 22 | 30 | ||||||
$ | 76 | $ | 78 | |||||
Canada Segment | ||||||||
NTI | $ | 4 | $ | 2 | ||||
Sustaining capital | 8 | 10 | ||||||
Acquisitions | 4 | 4 | ||||||
16 | 16 | |||||||
Total capital expenditures and acquisitions | $ | 92 | $ | 94 | ||||
47
On July 31, 2014, we closed on the purchase of an existing distribution warehouse with adjoining office facilities located in San Antonio, Texas for $43 million. The purchase was funded by available cash on hand. These facilities will allow us to consolidate our current San Antonio regional distribution center (“RDC”) with future corporate service center office space. We will begin to transition our RDC operations from our current warehouse in Schertz, Texas to these facilities beginning in the third quarter and expect to complete the RDC move in the first quarter of 2015.
We expect total capital expenditures for 2014 to be in the range of $295 million to $320 million, which includes nonrecurring capital costs of $43 million related to the purchase discussed above and $12 million associated with IT infrastructure. The IT infrastructure costs are necessary for us to establish separate hardware and software systems related to being a stand-alone, publicly traded company. We transitioned to our own enterprise reporting system during the second quarter of 2014 and we expect to be substantially complete in transitioning to our independent IT infrastructure before the end of 2014.
Other Matters Impacting Liquidity and Capital Resources
Cash Held by Our Canadian Subsidiary
As of June 30, 2014, $208 million of cash was held in Canada. We intend to reinvest earnings indefinitely in our Canadian operations even though we are not restricted from repatriating such earnings to the U.S. in the form of cash dividends. Should we decide to repatriate such earnings, we would incur and pay taxes on the amounts repatriated. In addition, such repatriation could cause us to record deferred tax expense that could significantly impact our results of operations.
Dividends
Quarterly dividend activity was as follows:
Quarter Ended | Record Date | Payment Date | Cash Distribution (per share) | Cash Distribution (in millions) | ||||||||
December 31, 2013 | December 31, 2013 | January 15, 2014 | $ | 0.0625 | $ | 4.7 | ||||||
March 31, 2014 | March 31, 2014 | April 15, 2014 | 0.0625 | 4.7 | ||||||||
June 30, 2014 | June 30, 2014 | July 15, 2014 | 0.0625 | 4.7 | ||||||||
We expect to continue the practice of paying quarterly cash dividends, though the timing, declaration, amount and payment of future dividends to stockholders will fall within the discretion of our Board of Directors. Our indebtedness also restricts our ability to pay dividends. As such, there can be no assurance we will continue to pay dividends in the future.
Purchase of the General Partner and Incentive Distribution Rights (“IDRs”) in Lehigh Gas Partners LP (“LGP”)
On August 6, 2014, we entered into definitive agreements to purchase from Lehigh Gas Corporation 100% of the membership interests in Lehigh Gas GP LLC, the general partner of LGP, a publicly traded limited partnership traded on the New York Stock Exchange, and all of the outstanding IDRs in LGP. As part of these transactions, we will pay $17 million in cash and approximately 2.04 million shares of CST common stock.
The transaction overall does not involve the sale or purchase of any of the common or subordinated units of LGP. The closing of the transactions are subject to customary conditions, including consent of the lenders and modification of CST’s and LGP’s credit facilities. The transactions are expected to close early in the fourth quarter of 2014.
Stock Repurchase Plan
On August 5, 2014, our Board of Directors approved a stock repurchase plan under which we are authorized to purchase shares of our common stock up to a maximum dollar amount of $200 million, until such authorization is exhausted or withdrawn by our Board of Directors. Under the stock repurchase program, we are authorized to repurchase, from time-to-time, shares of our outstanding common stock in the open market, at management’s discretion, based on market and business conditions, applicable legal requirements and other factors, or pursuant to an issuer repurchase plan or
48
agreement that may be in effect. The repurchase program does not obligate us to acquire any specific amount of common stock and will continue until otherwise modified or terminated by our Board of Directors at any time at its sole discretion and without notice. We have not purchased any shares under this plan as of the date of this filing.
New Accounting Policies
As discussed in Note 1 of the condensed notes to the consolidated and combined financial statements included elsewhere in this report, the adoption of certain new financial accounting pronouncements has not had, and is not expected to have, a material effect on our financial statements.
In April 2014, the Financial Accounting Standards Board issued Accounting Standards Update 2014-08 (“ASU 2014-08”), Presentation of Financial Statements (Topic 205) and Property, Plant and Equipment (Topic 360): Reporting Discontinued Operations and Disclosures of Disposals of Components of an Entity. ASU 2014-08, required to be applied prospectively for reporting periods beginning after December 15, 2014, limits discontinued operations reporting to disposals of components of an entity that represent strategic shifts that have, or will have, a major effect on operations and financial results. The amendment requires expanded disclosures for discontinued operations and also requires additional disclosures regarding disposals of individually significant components that do not qualify as discontinued operations. Early adoption is permitted, but only for disposals (or classifications as held for sale) that have not been reported in financial statements previously issued or available for issuance. This amendment has no impact on our current disclosures, but will in the future if we dispose of any individually significant components.
In May 2014, the Financial Accounting Standards Board issued Accounting Standards Update 2014-09 (“ASU 2014-09”), Revenue from Contracts with Customers. ASU 2014-09 requires an entity to recognize the amount of revenue to which it expects to be entitled for the transfer of promised goods or services to customers. The ASU will replace most existing revenue recognition guidance in U.S. GAAP when it becomes effective. ASU 2014-09 will become effective for us in the first quarter of 2017 and early adoption is not permitted. The standard permits the use of either the retrospective or cumulative effect transition method. We are evaluating the effect that ASU 2014-09 will have on our consolidated financial statements and related disclosures. We have not yet selected a transition method nor have we determined the effect of the standard on our ongoing financial reporting.
Critical Accounting Policies
The preparation of financial statements in accordance with GAAP requires us to make estimates and assumptions that affect the amounts reported in our financial statements and accompanying notes. Actual results could differ from those estimates.
As disclosed in our Form 10-K for the year ended December 31, 2013, during the fourth quarter of 2013, we elected to change our method of valuing our Canada motor fuel inventory to the weighted-average cost method, whereas in all previous periods motor fuel inventory was valued using the LIFO method. Comparative financial statements of prior periods have been adjusted to apply the weighted-average cost method retrospectively.
There have been no material changes to the critical accounting policies described in our Form 10-K.
ITEM 3. QUANTITATIVE AND QUALITATIVE DISCLOSURES ABOUT MARKET RISK
Interest Rate Risk
As of June 30, 2014, the term loan had an outstanding balance of $472 million, and we had not borrowed under the revolving credit facility. As of June 30, 2014, the borrowing rate on the term loan and revolving credit facility was 1.90% (effective 30 day LIBOR rate plus a spread of 1.75%).
The annualized effect of a one percentage point change in floating interest rates on our variable rate debt obligations outstanding at June 30, 2014 would be to change interest expense by approximately $5 million. At this time we have not entered into any interest rate swaps or other derivative instruments to hedge the effects of adverse fluctuations in interest rates.
49
Foreign Currency Risk
Our financial statements are reported in U.S. dollars. However, a substantial portion of our operations are located in Canada. As such, our reported results of operations, cash flows and financial position as they relate to our Canadian operations are impacted by fluctuations in the exchange rate between the Canadian and U.S. dollars. We have not historically hedged or managed our risk associated with our exposure to the Canadian dollar/U.S. dollar exchange rate. As of June 30, 2014, $208 million of cash was held in Canada.
Item 4. Controls and Procedures
(a) Evaluation of disclosure controls and procedures.
Our management has evaluated, with the participation of our principal executive officer and principal financial officer, the effectiveness of our disclosure controls and procedures (as defined in Rule 13a-15 under the Securities Exchange Act of 1934) as of the end of the period covered by this report, and has concluded that our disclosure controls and procedures were effective as of June 30, 2014.
(b) Changes in internal control over financial reporting.
The SEC, as required by Section 404 of the Sarbanes-Oxley Act, adopted rules that generally require every company that files reports with the SEC to evaluate its effectiveness of internal controls over financial reporting. Our management, with the participation of our principal executive and principal financial officers, will not be required to evaluate the effectiveness of our internal controls over financial reporting until the filing of our 2014 Annual Report on Form 10-K, due to a transition period established by the SEC rules applicable to new public companies.
There has been no change in our internal control over financial reporting that occurred during our last fiscal quarter that has materially affected, or is reasonably likely to materially affect, our internal control over financial reporting.
PART II – OTHER INFORMATION
Item 1. Legal Proceedings
On October 30, 2013, the State of Colorado filed a lawsuit against Valero and CST and several of their subsidiaries and affiliates claiming that, prior to the spin-off, Valero and its former retail subsidiaries filed claims with and recovered funds from Colorado’s Underground Storage Tank (“UST”) Fund and failed to disclose the existence of and/or recoveries from insurance policies, which are alleged to provide coverage for the same remediation activities. The case is subject to the accelerated “CAPP” rules of procedure in Colorado and a trial date is set for March 30, 2015. During the first quarter of 2014, the plaintiffs filed an amended complaint seeking forfeiture of amounts paid by the UST Fund or payment of amounts recovered from insurers for these sites, which they alleged to be in excess of $15 million. While Valero has and continues to maintain control over the historical insurance policies at issue, we are unaware of any insurance claims that were made, or proceeds received, for costs associated with UST remediation at sites in Colorado, other than a settlement in 2002, which was reported to the State. The State agreed to accept a portion of the proceeds from that settlement apportioned to retail sites in Colorado and to release all claims for the sites potentially involved in those insurance recovery actions. We believe that there is no factual basis for the State’s claims and that there are numerous legal defenses to these claims. Both Valero and CST have made demands on the other under the terms of the Separation and Distribution Agreement, which CST and Valero have agreed to resolve after the underlying matters is resolved if necessary. We are working jointly and intend to vigorously defend this litigation.
A lawsuit was filed on behalf of the State of Louisiana in the first quarter of 2014 in Louisiana state court against Valero and CST and several of their subsidiaries and affiliates making claims for pre-spin-off claims and recoveries by Valero and its former retail subsidiaries from Louisiana’s UST Fund. This case is in the very initial stages of litigation. Although the claims are similar to those alleged in the Colorado case previously discussed, this litigation involves only sites in Louisiana. We do not believe that these claims have any factual basis, and that we have numerous legal defenses to these claims. Valero and CST are working jointly and we intend to vigorously defend this litigation.
50
A lawsuit was filed on behalf of the State of Pennsylvania in Pennsylvania state court against numerous fuel retailers, including Valero and CST and several of their subsidiaries and affiliates for pre-spin-off claims and recoveries by Valero and its former retail subsidiaries against the Pennsylvania UST Fund. CST’s business never operated sites in Pennsylvania and we do not believe that we are a proper party to this litigation. We will be seeking a dismissal from this litigation.
We have not recorded a loss contingency liability with respect to these matters as we are unable to estimate the possible loss or range of loss for any of these lawsuits at this stage of the litigation.
Item 1A. Risk Factors
There have been no material changes to the risk factors disclosed in the section entitled “Risk Factors” in our Annual Report on Form 10-K for the fiscal year ending December 31, 2013.
Item 2. Unregistered Sales of Equity Securities and Use of Proceeds
The following table contains information about our purchases of equity securities during the second quarter of 2014:
Period | Total Number of Shares Purchased (a) | Average Price Paid per Share | Total Number of Shares Purchased as Part of a Publicly Announced Plan (b) | Maximum Dollar Amount that May Yet Be Spent Under the Plan (b) | |||||||||
April 1-30, 2014 | — | $ | — | — | — | ||||||||
May 1-31, 2014 | 10,964 | $ | 31.79 | — | — | ||||||||
June 1-30, 2014 | — | $ | — | — | — | ||||||||
Total | 10,964 | $ | 31.79 | — | |||||||||
(a) | Represents shares withheld to pay income taxes upon the vesting of restricted stock awards. |
(b) | On August 5, 2014 our Board of Directors authorized a stock repurchase plan under which we are authorized to purchase shares of our common stock up to a maximum dollar amount of $200 million, until such authorization is exhausted or withdrawn by our Board of Directors. |
51
Item 6. Exhibits
Exhibit No. | Description |
3.1 | Amended and Restated Bylaws of the Company (incorporated by reference to Exhibit 3.1 to the Company’s Current Report on Form 8-K filed with the Securities and Exchange Commission on April 15, 2014) |
10.1* | Amended and Restated 2013 Omnibus Stock and Incentive Plan |
31.1* | Certification of Chief Executive Officer Pursuant to Section 302 of the Sarbanes-Oxley Act of 2002 |
31.2* | Certification of Chief Financial Officer Pursuant to Section 302 of the Sarbanes-Oxley Act of 2002 |
32.1* | Certification of Chief Executive Officer Pursuant to Section 906 of the Sarbanes-Oxley Act of 2002 |
32.2* | Certification of Chief Financial Officer Pursuant to Section 906 of the Sarbanes-Oxley Act of 2002 |
101** | Interactive Data Files |
* | Filed herewith. |
** | Furnished herewith. |
52
SIGNATURE
Pursuant to the requirements of the Securities Exchange Act of 1934, the registrant has duly caused this report to be signed on its behalf by the undersigned, thereunto duly authorized.
CST BRANDS, INC. | |||
/s/ Clayton E. Killinger | |||
By: | Clayton E. Killinger | ||
Title: | Senior Vice President and Chief Financial Officer | ||
(Duly Authorized Officer and Principal Financial and | |||
Accounting Officer) | |||
Date: August 12, 2014
53