Attached files
| file | filename |
|---|---|
| 8-K - 8-K - CARRIAGE SERVICES INC | a8-kxinvestorpresentationx.htm |

1 Carriage Services, Inc. Investor Presentation Q3 2014
2 Confidential Certain statements made herein or elsewhere by, or on behalf of, the Company that are not historical facts are intended to be forward‐looking statements within the meaning of Section 27A of the Securities Act of 1933, as amended, and Section 21E of the Securities Exchange Act of 1934, as amended. These statements are based on assumptions that the Company believes are reasonable; however, many important factors, as discussed under “Forward‐Looking Statements” in the Company’s Annual Report on Form 10‐K for the year ended December 31, 2013, could cause the Company’s results in the future to differ materially from the forward‐looking statements made herein and in any other documents or oral presentations made by, or on behalf of, the Company. Forward-looking statements contained herein regarding acquisitions include assumptions about the pricing, timing, and terms and conditions of such acquisitions. We can provide no assurances that our growth strategy will be successfully implemented. In particular, we can provide no assurances that we will find attractive acquisition targets, that we will succeed in negotiating the terms and conditions reflected in the model, or that we will execute any acquisitions during the next five years (including 2014). Forward-looking statements contained herein regarding the performance of our acquisition and same store businesses include assumptions related to future revenue growth. We can provide no assurances that our acquisition and same store businesses will generate the revenue growth set forth herein, or any revenue growth at all. The Company assumes no obligation to update or publicly release any revisions to forward-looking statements made herein or any other forward‐looking statements made by, or on behalf of, the Company. A copy of the Company’s Form 10‐K, and other Carriage Services information and news releases, are available at www.carriageservices.com.
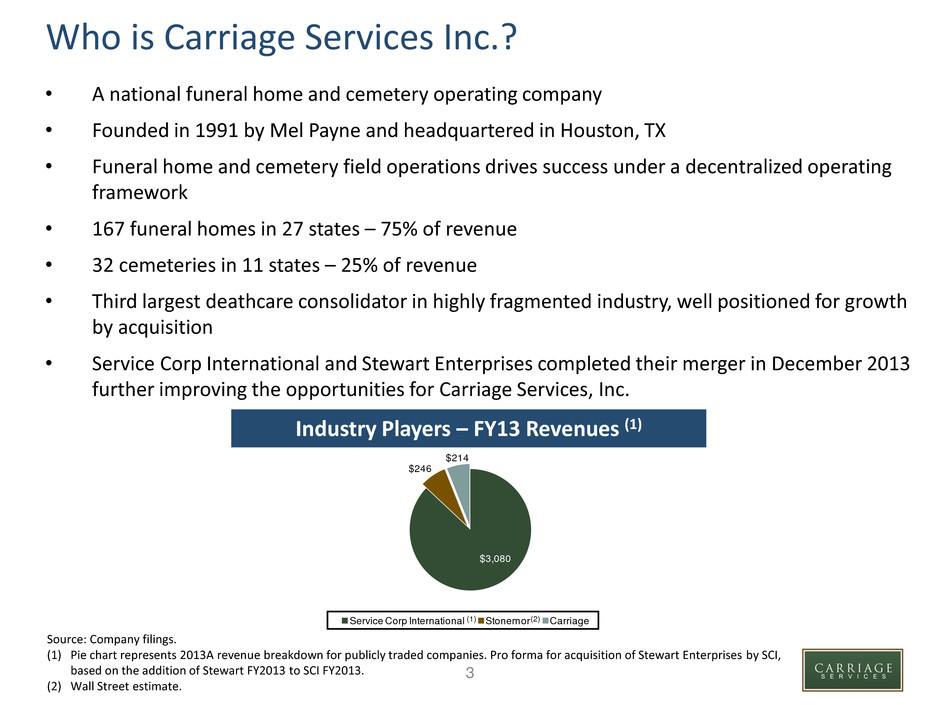
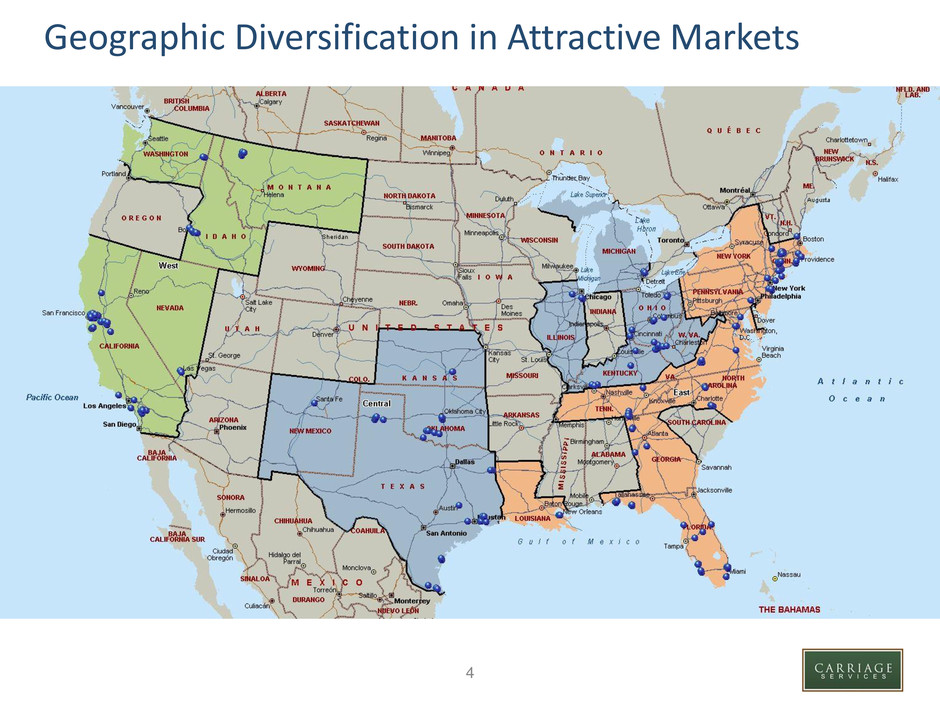
3 $3,080 $246 $214 Service Corp International Stonemor Carriage Who is Carriage Services Inc.? • A national funeral home and cemetery operating company • Founded in 1991 by Mel Payne and headquartered in Houston, TX • Funeral home and cemetery field operations drives success under a decentralized operating framework • 167 funeral homes in 27 states – 75% of revenue • 32 cemeteries in 11 states – 25% of revenue • Third largest deathcare consolidator in highly fragmented industry, well positioned for growth by acquisition • Service Corp International and Stewart Enterprises completed their merger in December 2013 further improving the opportunities for Carriage Services, Inc. 3 Industry Players – FY13 Revenues (1) Source: Company filings. (1) Pie chart represents 2013A revenue breakdown for publicly traded companies. Pro forma for acquisition of Stewart Enterprises by SCI, based on the addition of Stewart FY2013 to SCI FY2013. (2) Wall Street estimate. (1) (2)
4 Geographic Diversification in Attractive Markets 4
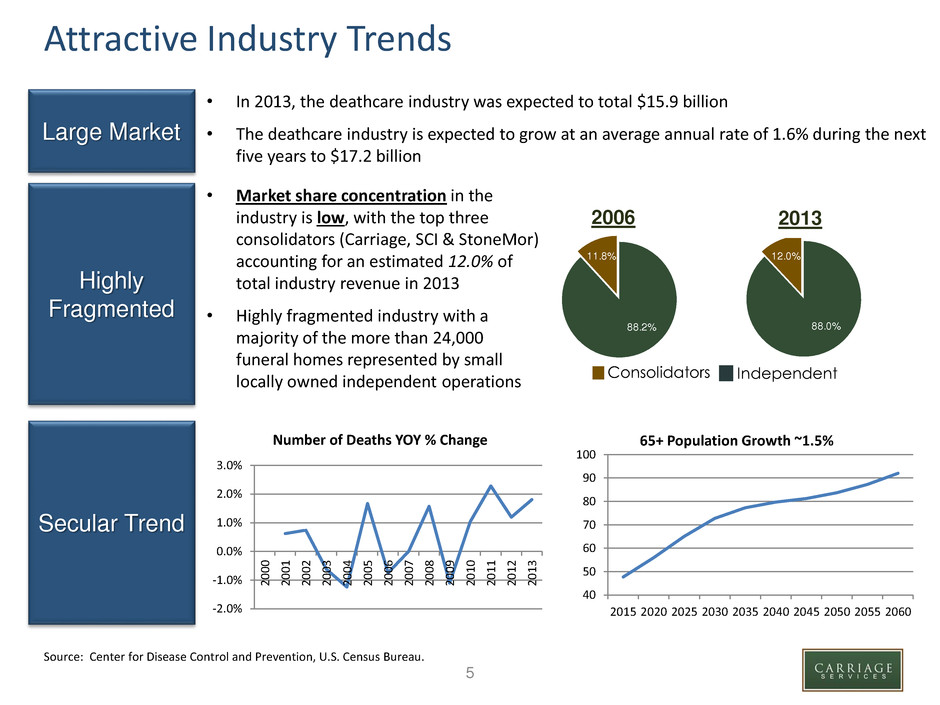
5 Attractive Industry Trends 2006 2013 Consolidators Independent Source: Center for Disease Control and Prevention, U.S. Census Bureau Large Market Highly Fragmented Secular Trend 5 88.2% 11.8% 88.0% 12.0% Source: Center for Disease Control and Prevention, U.S. Census Bureau. • In 2013, the deathcare industry was expected to total $15.9 billion • The deathcare industry is expected to grow at an average annual rate of 1.6% during the next five years to $17.2 billion • Market share concentration in the industry is low, with the top three consolidators (Carriage, SCI & StoneMor) accounting for an estimated 12.0% of total industry revenue in 2013 • Highly fragmented industry with a majority of the more than 24,000 funeral homes represented by small locally owned independent operations -2.0% -1.0% 0.0% 1.0% 2.0% 3.0% 2 0 0 0 2 0 0 1 2 0 0 2 2 0 0 3 2 0 0 4 2 0 0 5 2 0 0 6 2 0 0 7 2 0 0 8 2 0 0 9 2 0 1 0 2 0 1 1 2 0 1 2 2 0 1 3 Number of Deaths YOY % Change 40 50 60 70 80 90 100 2015 2020 2025 2030 2035 2040 2045 2050 2055 2060 65+ Population Growth ~1.5%

6 Differentiation in Funeral & Cemetery Industry • Carriage’s success has and will continue to be defined by three strategic models: • Standards Operating Model • Focuses on growing market share and employing high performance people which together drive long term operating and financial performance • Designed to achieve modest same store revenue growth and strong and sustainable Field EBITDA Margins at the local business level • Designed to have the Managing Partner and staff share in Field EBITDA growth 6 • Strategic Acquisition Model • Disciplined acquisition in selected markets • 4E Leadership Model • Energy, Energize, Edge, Execution • Standards Operating Model requires strong leadership to grow an entrepreneurial, high value, local personal service and sales business • 4E Leaders have a winning, competitive spirit and want to make a difference not only in their business and community but in Carriage’s performance and reputation Standards Operating Model
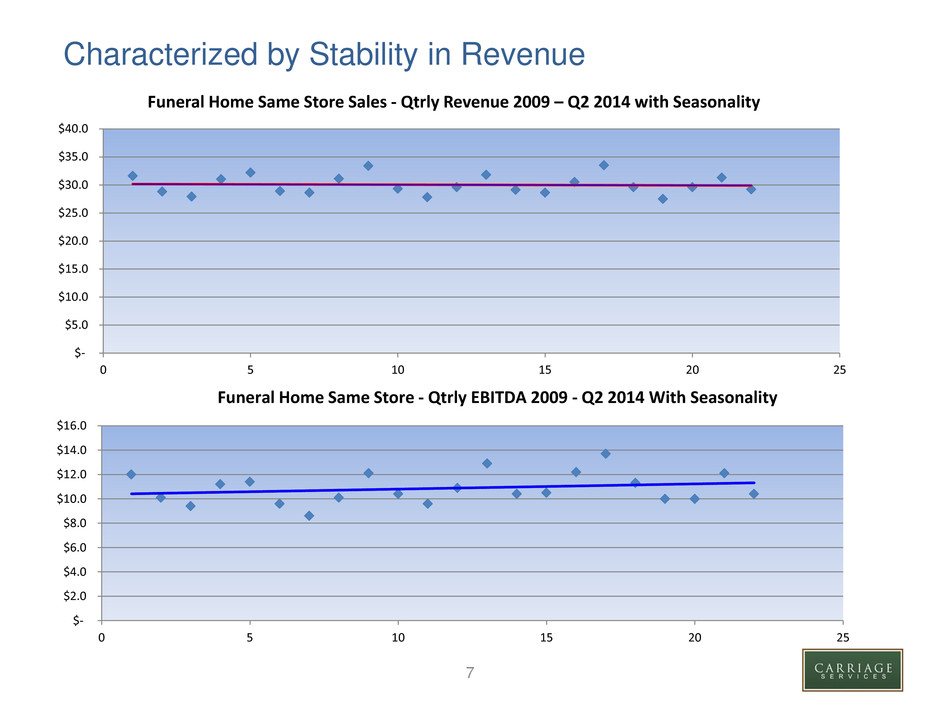
7 $- $5.0 $10.0 $15.0 $20.0 $25.0 $30.0 $35.0 $40.0 0 5 10 15 20 25 Funeral Home Same Store Sales - Qtrly Revenue 2009 – Q2 2014 with Seasonality $- $2.0 $4.0 $6.0 $8.0 $10.0 $12.0 $14.0 $16.0 0 5 10 15 20 25 Funeral Home Same Store - Qtrly EBITDA 2009 - Q2 2014 With Seasonality Characterized by Stability in Revenue
8 Our Growth Strategy • Adopt a pro-growth business model within an industry that is characterized by its low growth, low technology, and stable earnings • Modest growth in sales of our base businesses resulting in improved margins • Relatively fixed regional and corporate overhead allows for modest increases in Same Store Sales and EBITDA to have greater impact on Free Cash Flow • Make targeted and strategic acquisitions to accelerate growth while maintaining financial discipline • A majority of acquired Field EBITDA falls to Consolidated EBITDA due to operating leverage
9 Disciplined and Targeted Acquisition Strategy 9 • Our Goal is to acquire $16-$18 million in new annual revenue through acquisitions • Target leading performers with strong heritage in their local markets • Comprehensive analysis of a candidate’s financial profile and market demographics • Focus on markets that perform better than the industry average and are generally insulated from economic and demographic changes • Only consider businesses that will provide an immediate positive impact on cash flow • Concentrate on higher revenue, higher margin, accretive businesses • Exercise Financial Discipline through Valuation Model • Maintain a stable and predictable business model • Sustain EBITDA growth in line with revenue growth from acquisitions Recent Acquisitions at a Glance DATE NAME 5/15/2014 Everly Community Funeral Care (Falls Church, VA) 5/15/2014 Everly Wheatley Funeral Home (Alexandria, VA.) 5/15/2014 Garden of Memories (Metairie, LA) 5/15/2014 Garden of Memories Funeral Home (Metairie, LA) 5/15/2014 Greenwood Funeral Home (New Orleans, LA) 5/15/2014 Shoen Funeral Home (New Orleans, LA) 5/15/2014 Tharp-Sontheimer-Tharp Funeral Home (Metairie, LA) 11/19/2013 Heritage Funeral Homes & Cremation Servces (Chattanooga, TN) 11/19/2013 Heritage Funeral Homes & Crematory (Ft. Oglethorpe, GA) 12/28/2012 Havenbrook Funeral Home (Norma, OK) 12/21/2012 Crespo & Jirrels Funeral and Cremation Services (Baytown, TX) 12/11/2012 Cumby Family Funeral Service (High Point, NC & Archdale, NC) 9/26/2012 Schmidt Funeral Home (Katy, TX) 9/27/2012 Lawton Ritter Gray Funeral Home (Lawton, OK) 6/27/2012 Gray Funeral Home (Grandfield, OK) 3/13/2012 Conner Westbury Funeral Home (Griffin, GA) 2/21/2012 James J. Terry Funeral Home (Downingtown, PA) 12/13/2011 Bryant Funeral Home (New York, NY)
10 SCI Acquisition closed May 15, 2014 • On May 15, 2014, we closed the acquisition of six businesses from Service Corporation International (“SCI”) • Entered two new large strategic markets • New Orleans • Acquired 4 businesses • Improving demographics • Low cremation rates compared to industry average • Alexandria, VA • Acquired 2 businesses • Improving demographics • Decided on these businesses after rigorous due diligence process • FTC approved the deal.
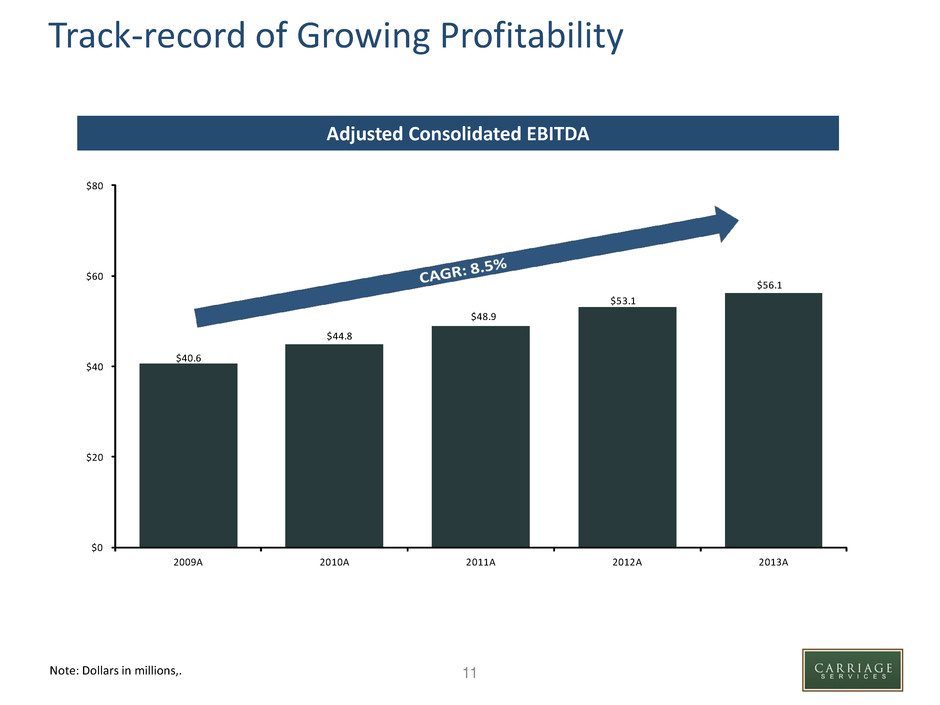
11 $40.6 $44.8 $48.9 $53.1 $56.1 $0 $20 $40 $60 $80 2009A 2010A 2011A 2012A 2013A Adjusted Consolidated EBITDA Note: Dollars in millions. Track-record of Growing Profitability Note: Dollars in millions,.

12 Note: Dollars in millions. Stable, Diversified Revenue Profile Note: Dollars in millions. Funeral Acquisition $0.3 $5.7 $14.2 $25.8 $35.9 Same Store Funeral 120.3 119.8 118.8 118.6 118.8 Cemeteries 39.3 37.8 36.5 38.3 40.5 Financial Revenue 9.7 14.2 14.0 16.7 18.8 $9.7 $14.2 $14.0 $16.7 $18.8 $39.3 $37.8 $36.5 $38.3 $40.5 $120.3 $119.8 $118.8 $118.6 $118.8 $0.3 $5.7 $14.2 $25.8 $35.9 $169.7 $177.5 $183.5 $199.4 $214.0 $0.0 $50.0 $100.0 $150.0 $200.0 $250.0 2009A 2010A 2011A 2012A 2013A
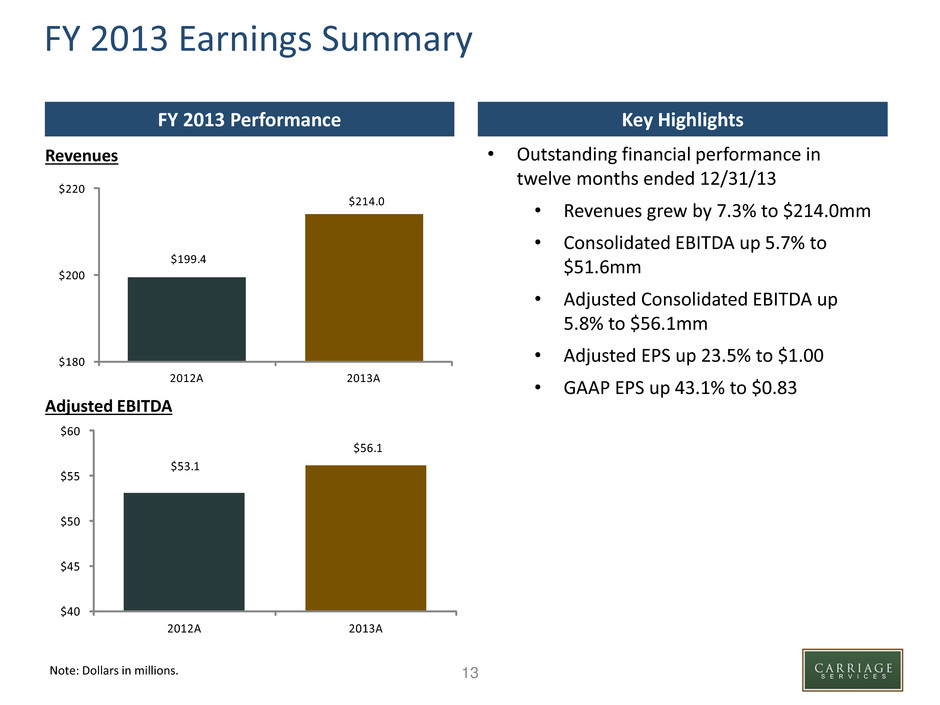
13 FY 2013 Earnings Summary Key Highlights FY 2013 Performance Revenues Adjusted EBITDA Note: Dollars in millions. $199.4 $214.0 $180 $200 $220 2012A 2013A $53.1 $56.1 $40 $45 $50 $55 $60 2012A 2013A • Outstanding financial performance in twelve months ended 12/31/13 • Revenues grew by 7.3% to $214.0mm • Consolidated EBITDA up 5.7% to $51.6mm • Adjusted Consolidated EBITDA up 5.8% to $56.1mm • Adjusted EPS up 23.5% to $1.00 • GAAP EPS up 43.1% to $0.83 Note: Dollars in millions.
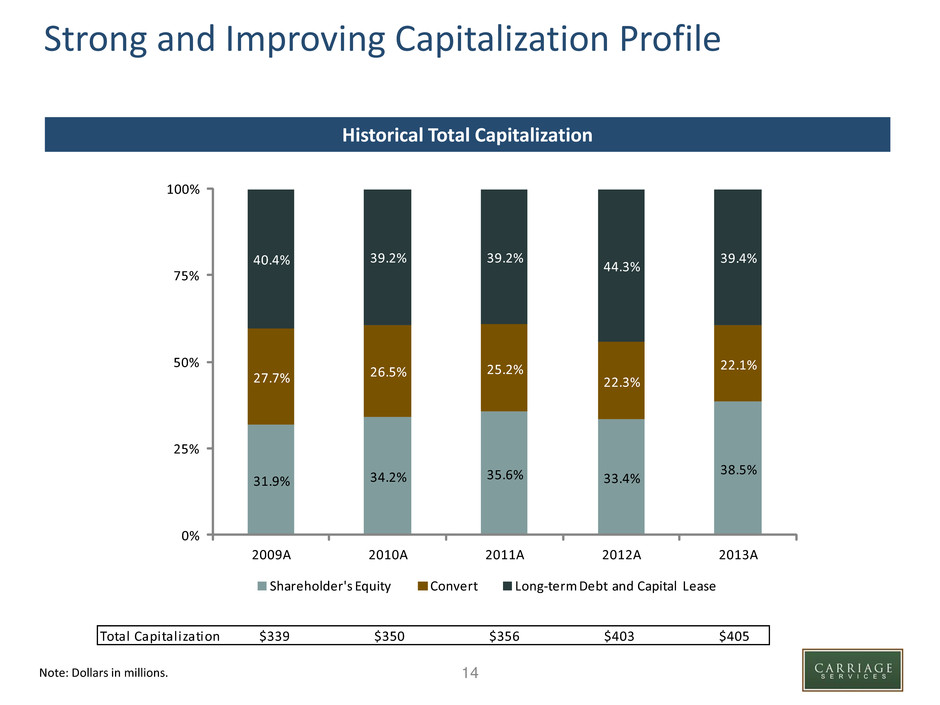
14 Strong and Improving Capitalization Profile Historical Total Capitalization Note: Dollars in millions. Total Capitalization $339 $350 $356 $403 $405 31.9% 34.2% 35.6% 33.4% 38.5% 27.7% 26.5% 25.2% 22.3% 22.1% 40.4% 39.2% 39.2% 44.3% 39.4% 0% 25% 50% 75% 100% 2009A 2010A 2011A 2012A 2013A Shareholder's Equity Convert Long-term Debt and Capital Lease
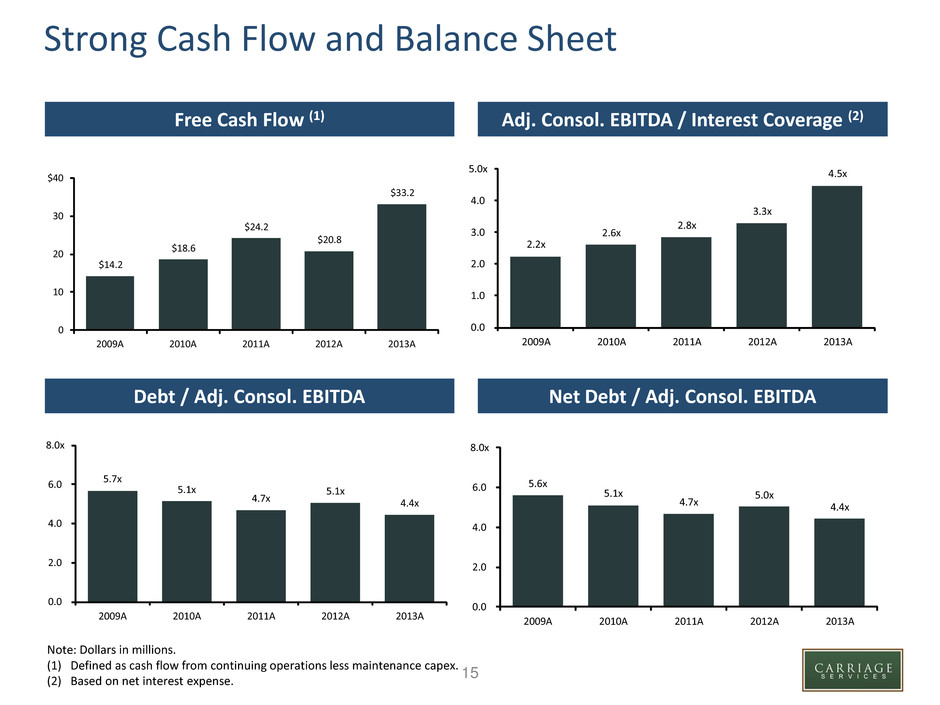
15 Strong Cash Flow and Balance Sheet Adj. Consol. EBITDA / Interest Coverage (2) Free Cash Flow (1) Adjusted EBITDA Note: Dollars in millions. Net Debt / Adj. Consol. EBITDA Debt / Adj. Consol. EBITDA Note: Dollars in millions. (1) Defined as cash flow from continuing operations less maintenance capex. (2) Based on net interest expense. 2.2x 2.6x 2.8x 3.3x 4.5x 0.0 1.0 2.0 3.0 4.0 5.0x 2009A 2010A 2011A 2012A 2013A 5.7x 5.1x 4.7x 5.1x 4.4x 0.0 2.0 4.0 6.0 8.0x 2009A 2010A 2011A 2012A 2013A 5.6x 5.1x 4.7x 5.0x 4.4x 0.0 2.0 4.0 6.0 8.0x 2009A 2010A 2011A 2012A 2013A $14.2 $18.6 $24.2 $20.8 $33.2 0 10 20 30 $40 2009A 2010A 2 11A 2012A 2013A
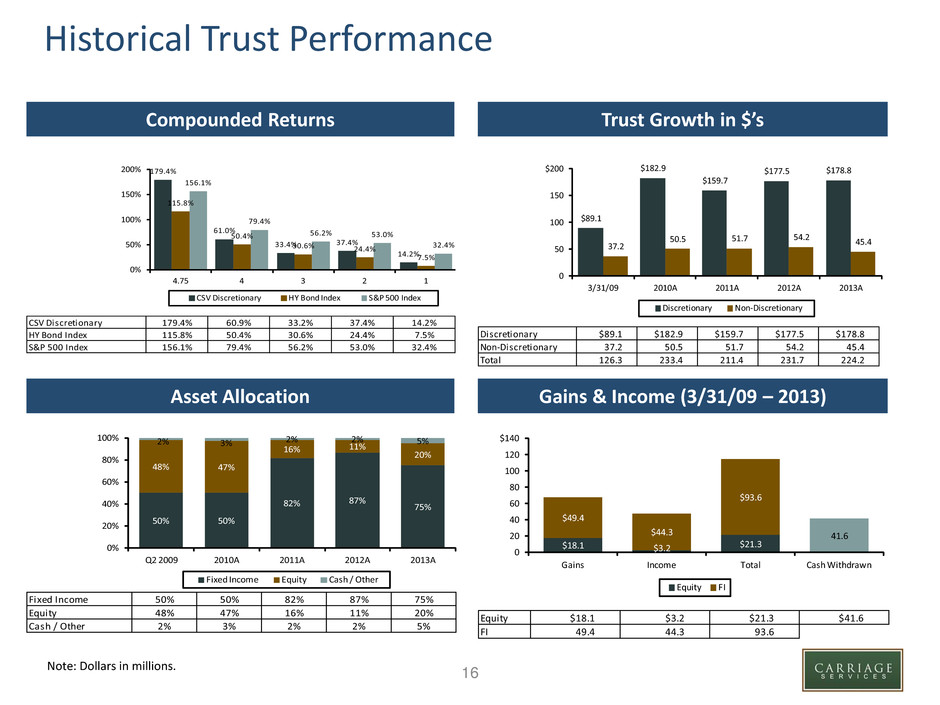
16 Historical Trust Performance Trust Growth in $’s Compounded Returns Adjusted EBITDA Note: Dollars in millions. Gains & Income (3/31/09 – 2013) Asset Allocation Fixed Income 50% 50% 82% 87% 75% Equity 48% 47% 16% 11% 20% Cash / Other 2% 3% 2% 2% 5% 50% 50% 82% 87% 75% 48% 47% 16% 11% 20% 2% 3% 2% 2% 5% 0% 20% 40% 60% 80% 100% Q2 2009 2010A 2011A 2012A 2013A Fixed Income Equity Cash / Other CSV Discretionary 179.4% 60.9% 33.2% 37.4% 14.2% HY Bond Index 115.8% 50.4% 30.6% 24.4% 7.5% S&P 500 Index 156.1% 79.4% 56.2% 53.0% 32.4% 179.4% 61.0% 33.4% 37.4% 14.2% 115.8% 50.4% 30.6% 24.4% 7.5% 156.1% 79.4% 56.2% 53.0% 32.4% 0% 50% 100% 150% 200% 4.75 4 3 2 1 CSV Discretionary HY Bond Index S&P 500 Index Note: Dollars in millions. Equity $18.1 $3.2 $21.3 $41.6 FI 49.4 44.3 93.6 $18.1 $3.2 $21.3 41.6 $49.4 $44.3 $93.6 0 20 40 60 80 100 120 $140 Gains Income Total Cash Withdrawn Equity FI Discretionary $89.1 $182.9 $159.7 $177.5 $178.8 Non-Discretionary 37.2 50.5 51.7 54.2 45.4 Total 126.3 233.4 211.4 231.7 224.2 $89.1 $182.9 $159.7 $177.5 $178.8 37.2 50.5 51.7 54.2 45.4 0 50 100 150 $200 3/31/09 2010A 2011A 2012A 2013A Discretionary Non-Discretionary
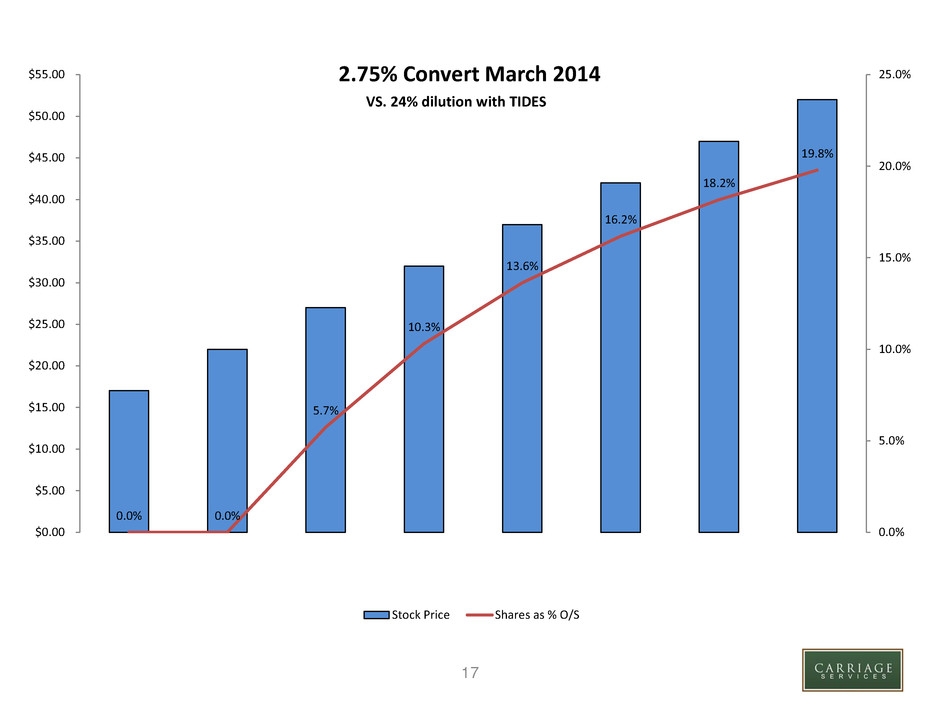
17 0.0% 0.0% 5.7% 10.3% 13.6% 16.2% 18.2% 19.8% 0.0% 5.0% 10.0% 15.0% 20.0% 25.0% $0.00 $5.00 $10.00 $15.00 $20.00 $25.00 $30.00 $35.00 $40.00 $45.00 $50.00 $55.00 2.75% Convert March 2014 Stock Price Shares as % O/S VS. 24% dilution with TIDES
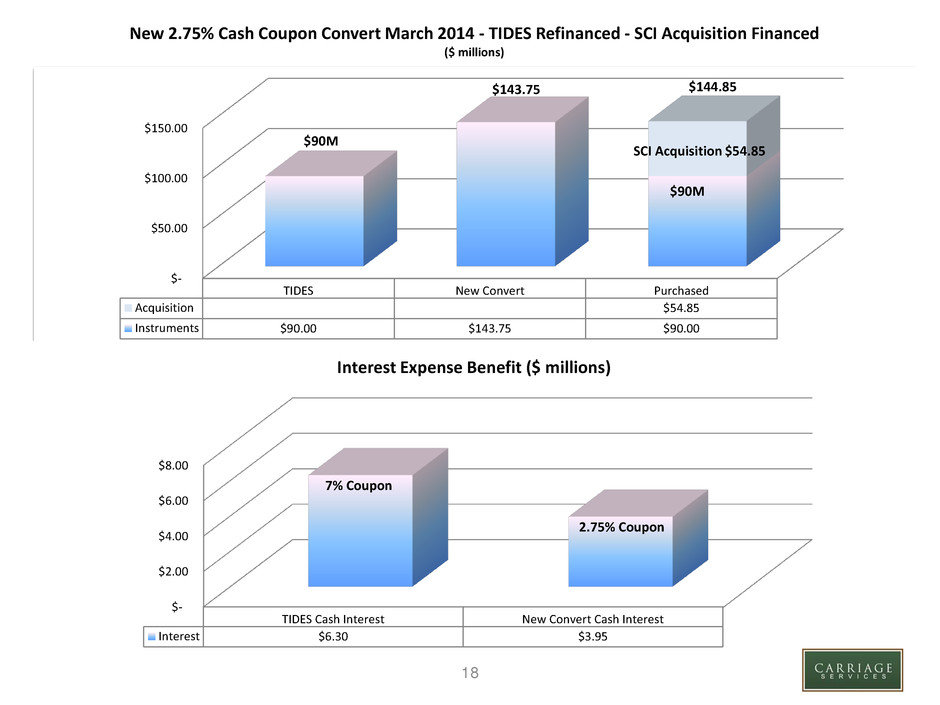
18 $- $50.00 $100.00 $150.00 TIDES New Convert Purchased Acquisition $54.85 Instruments $90.00 $143.75 $90.00 New 2.75% Cash Coupon Convert March 2014 - TIDES Refinanced - SCI Acquisition Financed ($ millions) $90M $143.75 $90M SCI Acquisition $54.85 $144.85 $- $2.00 $4.00 $6.00 $8.00 TIDES Cash Interest New Convert Cash Interest Interest $6.30 $3.95 Interest Expense Benefit ($ millions) 7% Coupon 2.75% Coupon
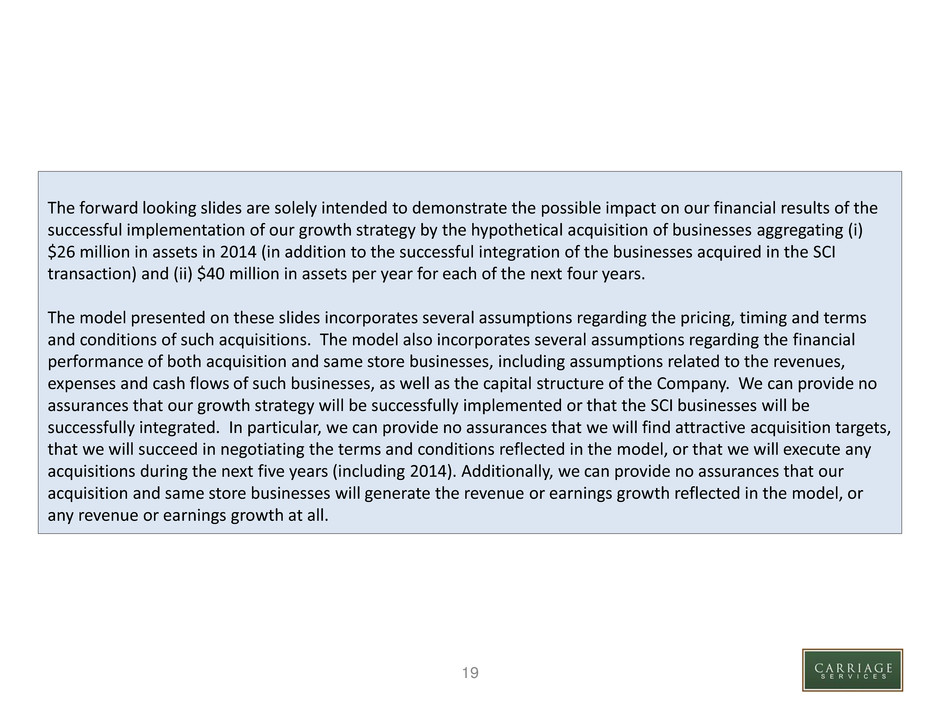
19 The forward looking slides are solely intended to demonstrate the possible impact on our financial results of the successful implementation of our growth strategy by the hypothetical acquisition of businesses aggregating (i) $26 million in assets in 2014 (in addition to the successful integration of the businesses acquired in the SCI transaction) and (ii) $40 million in assets per year for each of the next four years. The model presented on these slides incorporates several assumptions regarding the pricing, timing and terms and conditions of such acquisitions. The model also incorporates several assumptions regarding the financial performance of both acquisition and same store businesses, including assumptions related to the revenues, expenses and cash flows of such businesses, as well as the capital structure of the Company. We can provide no assurances that our growth strategy will be successfully implemented or that the SCI businesses will be successfully integrated. In particular, we can provide no assurances that we will find attractive acquisition targets, that we will succeed in negotiating the terms and conditions reflected in the model, or that we will execute any acquisitions during the next five years (including 2014). Additionally, we can provide no assurances that our acquisition and same store businesses will generate the revenue or earnings growth reflected in the model, or any revenue or earnings growth at all.
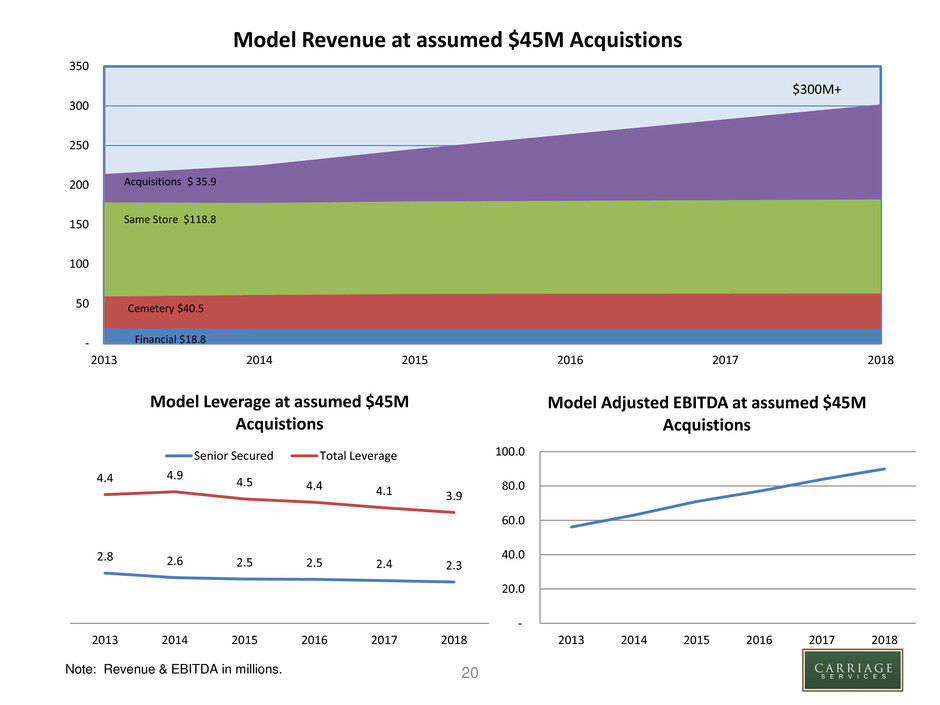
20 Note: Revenue & EBITDA in millions. - 50 100 150 200 250 300 350 2013 2014 2015 2016 2017 2018 Model Revenue at assumed $45M Acquistions Acquisitions $ 35.9 Same Store $118.8 Cemetery $40.5 Financial $18.8 $300M+ 2.8 2.6 2.5 2.5 2.4 2.3 4.4 4.9 4.5 4.4 4.1 3.9 2013 2014 2015 2016 2017 2018 Model Leverage at assumed $45M Acquistions Senior Secured Total Leverage - 20.0 40.0 60.0 80.0 100.0 2013 2014 2015 2016 2017 2018 Model Adjusted EBITDA at assumed $45M Acquistions
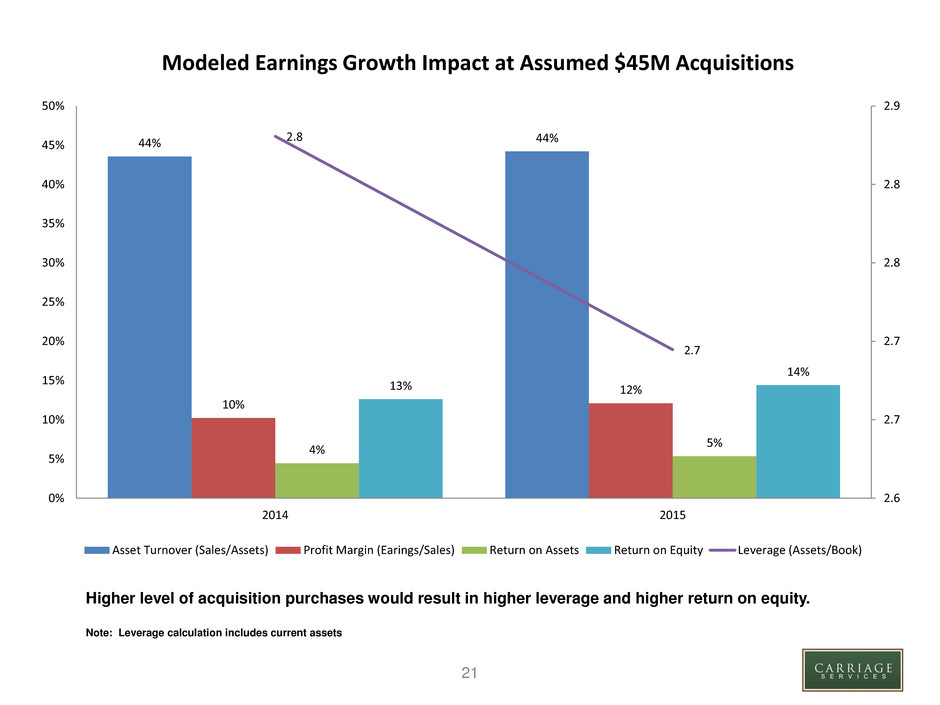
21 Higher level of acquisition purchases would result in higher leverage and higher return on equity. Note: Leverage calculation includes current assets 44% 44% 10% 12% 4% 5% 13% 14% 2.8 2.7 2.6 2.7 2.7 2.8 2.8 2.9 0% 5% 10% 15% 20% 25% 30% 35% 40% 45% 50% 2014 2015 Asset Turnover (Sales/Assets) Profit Margin (Earings/Sales) Return on Assets Return on Equity Leverage (Assets/Book) Modeled Earnings Growth Impact at Assumed $45M Acquisitions
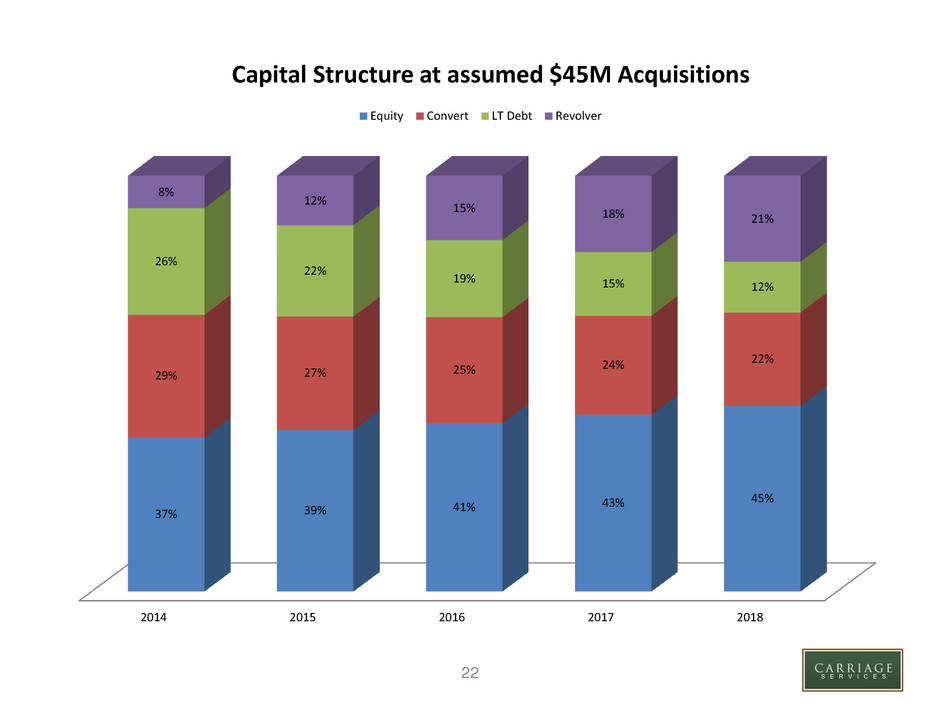
22 2014 2015 2016 2017 2018 37% 39% 41% 43% 45% 29% 27% 25% 24% 22% 26% 22% 19% 15% 12% 8% 12% 15% 18% 21% Capital Structure at assumed $45M Acquisitions Equity Convert LT Debt Revolver

23 Appendix
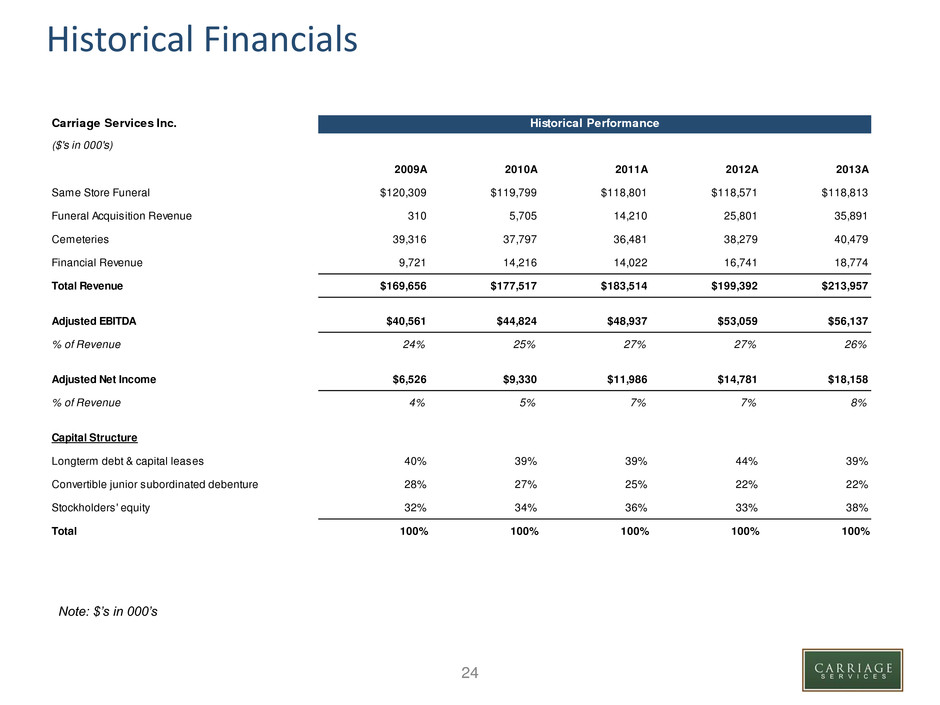
24 Historical Financials Carriage Services Inc. Historical Performance ($'s in 000's) 2009A 2010A 2011A 2012A 2013A Same Store Funeral $120,309 $119,799 $118,801 $118,571 $118,813 Funeral Acquisition Revenue 310 5,705 14,210 25,801 35,891 Cemeteries 39,316 37,797 36,481 38,279 40,479 Financial Revenue 9,721 14,216 14,022 16,741 18,774 Total Revenue $169,656 $177,517 $183,514 $199,392 $213,957 Adjusted EBITDA $40,561 $44,824 $48,937 $53,059 $56,137 % of Revenue 24% 25% 27% 27% 26% Adjusted Net Income $6,526 $9,330 $11,986 $14,781 $18,158 % of Revenue 4% 5% 7% 7% 8% Capital Structure Longterm debt & capital leases 40% 39% 39% 44% 39% Convertible junior subordinated debenture 28% 27% 25% 22% 22% Stockholders' equity 32% 34% 36% 33% 38% Total 100% 100% 100% 100% 100% Note: $’s in 000’s
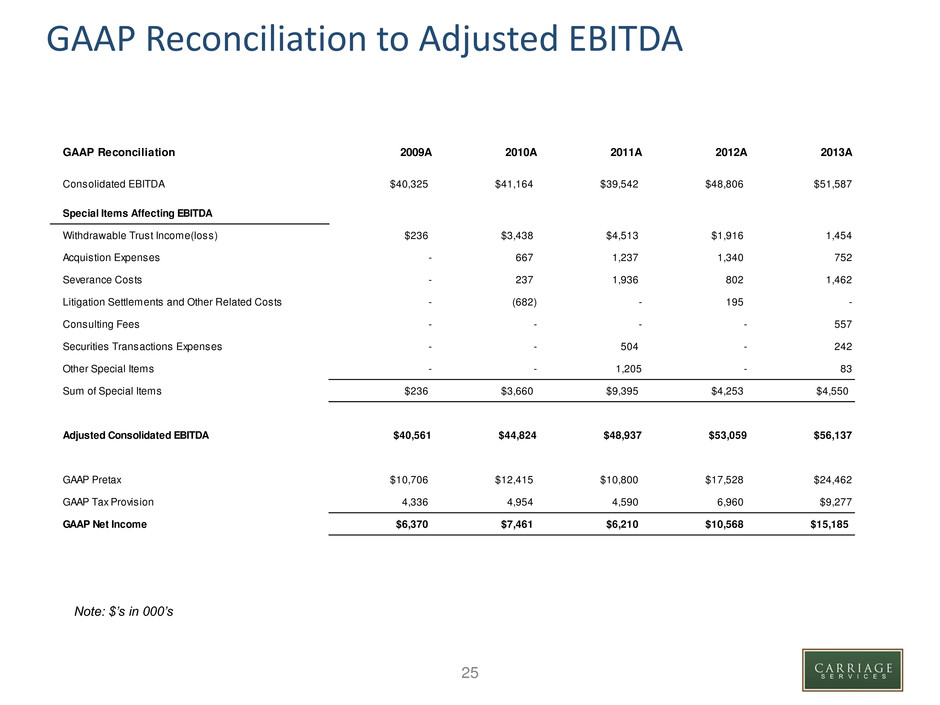
25 GAAP Reconciliation to Adjusted EBITDA GAAP Reconciliation 2009A 2010A 2011A 2012A 2013A Consolidated EBITDA $40,325 $41,164 $39,542 $48,806 $51,587 Special Items Affecting EBITDA Withdrawable Trust Income(loss) $236 $3,438 $4,513 $1,916 1,454 Acquistion Expenses - 667 1,237 1,340 752 Severance Costs - 237 1,936 802 1,462 Litigation Settlements and Other Related Costs - (682) - 195 - Consulting Fees - - - - 557 Securities Transactions Expenses - - 504 - 242 Other Special Items - - 1,205 - 83 Sum of Special Items $236 $3,660 $9,395 $4,253 $4,550 Adjuste Consolidated EBITDA $40,561 $44,824 $48,937 $53,059 $56,137 GAAP Pretax $10,706 $12,415 $10,800 $17,528 $24,462 GAAP Tax Provision 4,336 4,954 4,590 6,960 $9,277 GAAP Net Income $6,370 $7,461 $6,210 $10,568 $15,185 Note: $’s in 000’s
