Attached files
| file | filename |
|---|---|
| 8-K - FORM 8-K - Trinseo S.A. | d774065d8k.htm |
| EX-99.1 - EX-99.1 - Trinseo S.A. | d774065dex991.htm |
Exhibit 99.2
|
|

Exhibit 99.2
Jefferies –
Global Industrials Conference
August 12, 2014
™ Trademark
|
|
Introductions & Disclosure Rules
Introductions
Chris Pappas, President & CEO
David Stasse, Vice President, Treasury & Investor Relations
Disclosure Rules
The forward looking statements contained in this presentation involve risks and uncertainties that may affect the Company’s operations, markets, products, services, prices and other factors. These risks and uncertainties include, but are not limited to, economic, competitive, legal, governmental and technological factors. Accordingly, there is no assurance that the Company’s expectations expressed in such forward looking statements will be realized. The Company assumes no obligation to provide revisions to any forward looking statements in this presentation should circumstances change.
This presentation contains financial measures that are not in accordance with generally accepted accounting principles in the US (“GAAP”) including Adjusted EBITDA. We believe these measures provide relevant and meaningful information to investors and lenders about the ongoing operating results of the Company. Such measures when referenced herein should not be viewed as an alternative to GAAP measures of performance. We have provided a reconciliation of Adjusted EBITDA in the Appendix section of this presentation.
| 2 |
|
|
|
Business Overview
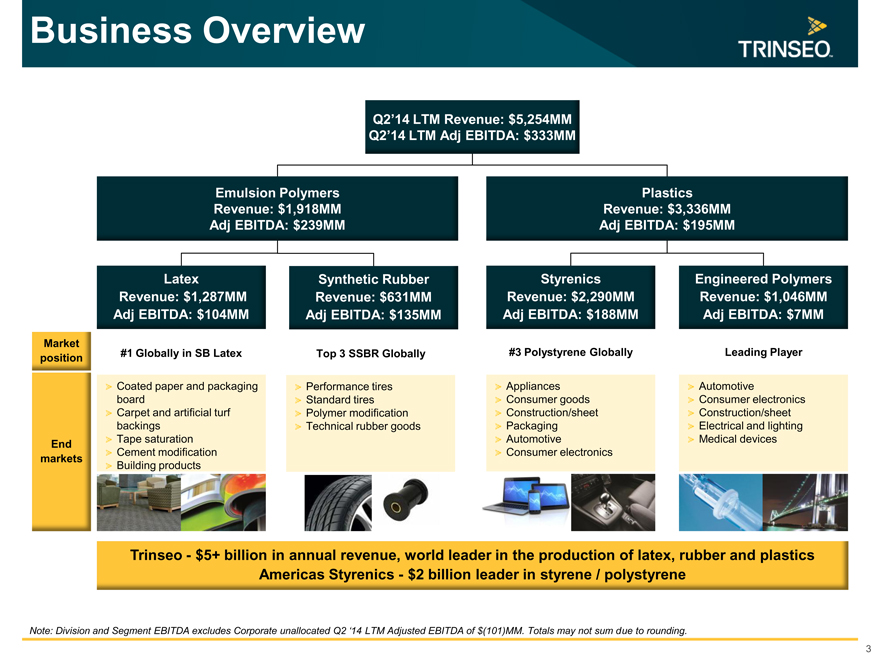
Q2’14 LTM Revenue: $5,254MM
Q2’14 LTM Adj EBITDA: $333MM
Emulsion Polymers Plastics
Revenue: $1,918MM Revenue: $3,336MM
Adj EBITDA: $239MM Adj EBITDA: $195MM
Latex Synthetic Rubber Styrenics Engineered Polymers
Revenue: $1,287MM Revenue: $631MM Revenue: $2,290MM Revenue: $1,046MM
Adj EBITDA: $104MM Adj EBITDA: $135MM Adj EBITDA: $188MM Adj EBITDA: $7MM
Market
position #1 Globally in SB Latex Top 3 SSBR Globally #3 Polystyrene Globally Leading Player
Coated paper and packaging Performance tires Appliances Automotive
board Standard tires Consumer goods Consumer electronics
Carpet and artificial turf Polymer modification Construction/sheet Construction/sheet
backings Technical rubber goods Packaging Electrical and lighting
End Tape saturation Automotive Medical devices
markets Cement modification Consumer electronics
Building products
Trinseo - $5+ billion in annual revenue, world leader in the production of latex, rubber and plastics
Americas Styrenics - $2 billion leader in styrene / polystyrene
Note: Division and Segment EBITDA excludes Corporate unallocated Q2 ‘14 LTM Adjusted EBITDA of $(101)MM. Totals may not sum due to rounding.
| 3 |
|
|
|
Latex
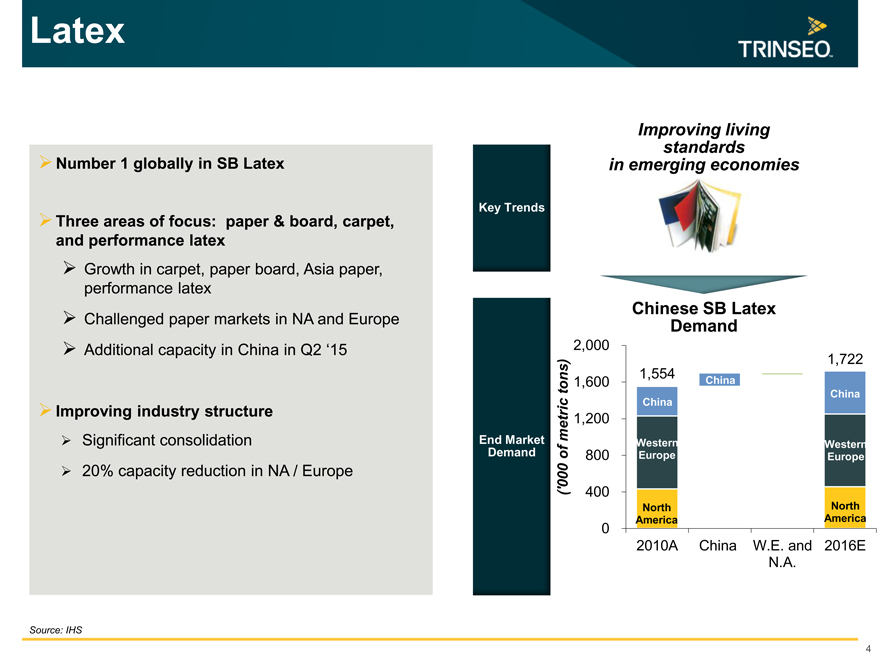
Number 1 globally in SB Latex
Three areas of focus: paper & board, carpet, and performance latex
Growth in carpet, paper board, Asia paper, performance latex Challenged paper markets in NA and Europe
Additional capacity in China in Q2 ‘15
Improving industry structure
Significant consolidation
20% capacity reduction in NA / Europe
Key Trends
End Market Demand
Improving living standards in emerging economies
Chinese SB Latex Demand
2,000
1,722
1,554
1,600 China
China
1,200
Western Western
of 800 Europe Europe
‘000
(400
North North
America America
0
2010A China W.E. and 2016E
N.A.
metric tons)
Source: IHS
| 4 |
|
|
|
Synthetic Rubber
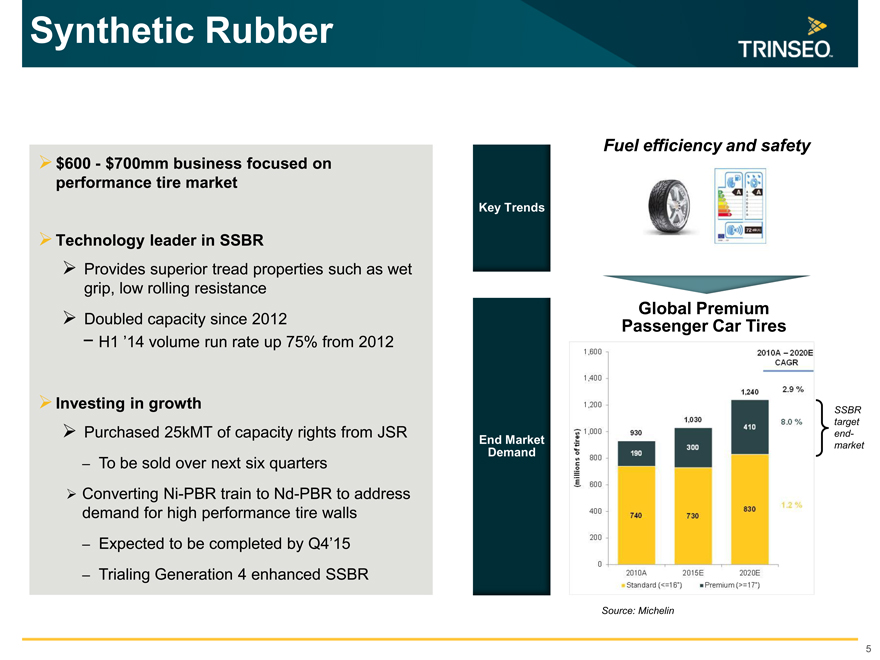
$600—$700mm business focused on performance tire market
Technology leader in SSBR
Provides superior tread properties such as wet grip, low rolling resistance Doubled capacity since 2012
- H1 ’14 volume run rate up 75% from 2012
Investing in growth
Purchased 25kMT of capacity rights from JSR
– To be sold over next six quarters
Converting Ni-PBR train to Nd-PBR to address demand for high performance tire walls
– Expected to be completed by Q4’15
– Trialing Generation 4 enhanced SSBR
Key Trends
End Market Demand
Fuel efficiency and safety
Global Premium Passenger Car Tires
SSBR target end- market
Source: Michelin
(millions of tires) 200 400 600 800 1000 1200 1400 1600 2010A - 2020E CAGR SSBR target end- market 2010A 2015E 2020E Standard (<=16”) Premium(>=17”) 930 1030 1240 190 300 410 740 730 830 2.9% 8.0% 1.2%
| 5 |
|
|
|
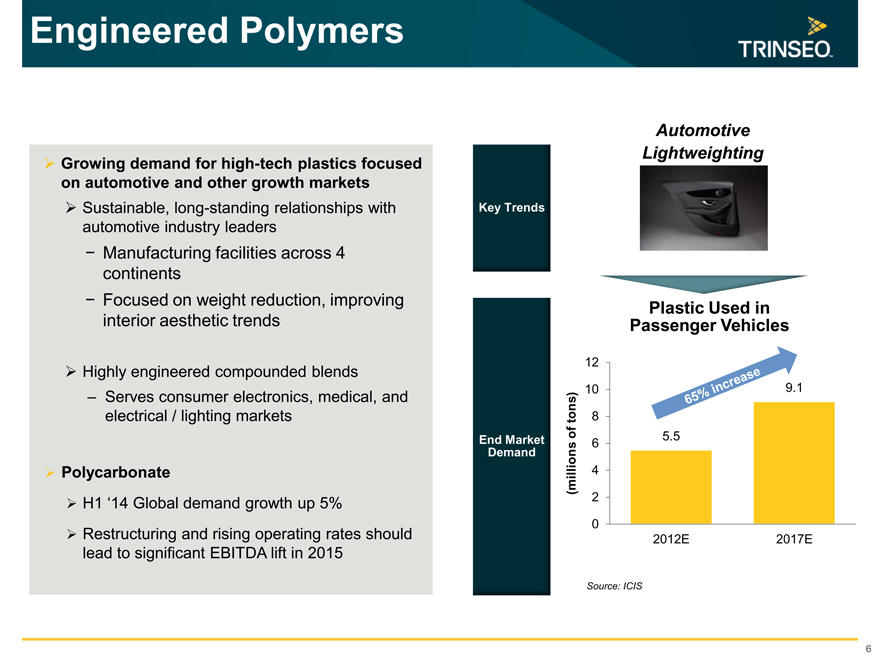
Engineered Polymers
Growing demand for high-tech plastics focused on automotive and other growth markets
Sustainable, long-standing relationships with automotive industry leaders
- Manufacturing facilities across 4 continents
- Focused on weight reduction, improving interior aesthetic trends
Highly engineered compounded blends
– Serves consumer electronics, medical, and electrical / lighting markets
Polycarbonate
H1 ‘14 Global demand growth up 5%
Restructuring and rising operating rates should lead to significant EBITDA lift in 2015
Key Trends
End Market Demand
Automotive Lightweighting
Plastic Used in Passenger Vehicles
12
10 9.1
tons) 8
of 5.5
ns 6
o
l li 4
(mi 2
0
2012E 2017E
Source: ICIS
| 6 |
|
|
|
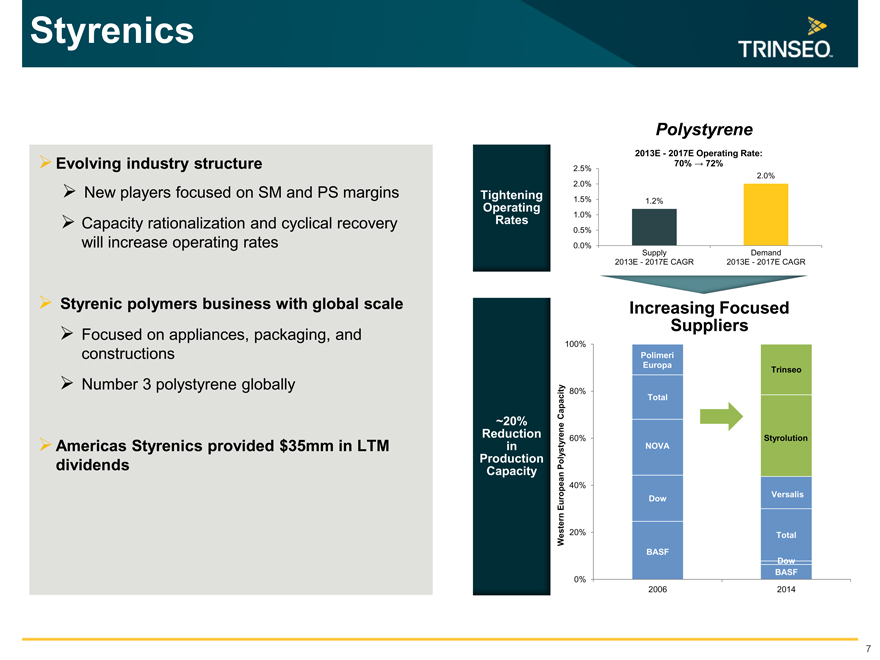
Styrenics
Evolving industry structure
New players focused on SM and PS margins Capacity rationalization and cyclical recovery will increase operating rates
Styrenic polymers business with global scale
Focused on appliances, packaging, and constructions Number 3 polystyrene globally
Americas Styrenics provided $35mm in LTM dividends
Increasing Focused
Suppliers
100%
Polimeri
Europa Trinseo
ity 80%
Total
~20%
Reduction 60% Styrolution
in ysty NOVA
Production Western European Polystyrene Capacity
Capacity
40%
European Dow Versalis
Western 20% Total
BASF
Dow
BASF
0%
2006 2014
| 7 |
|
|
|
Financial Overview
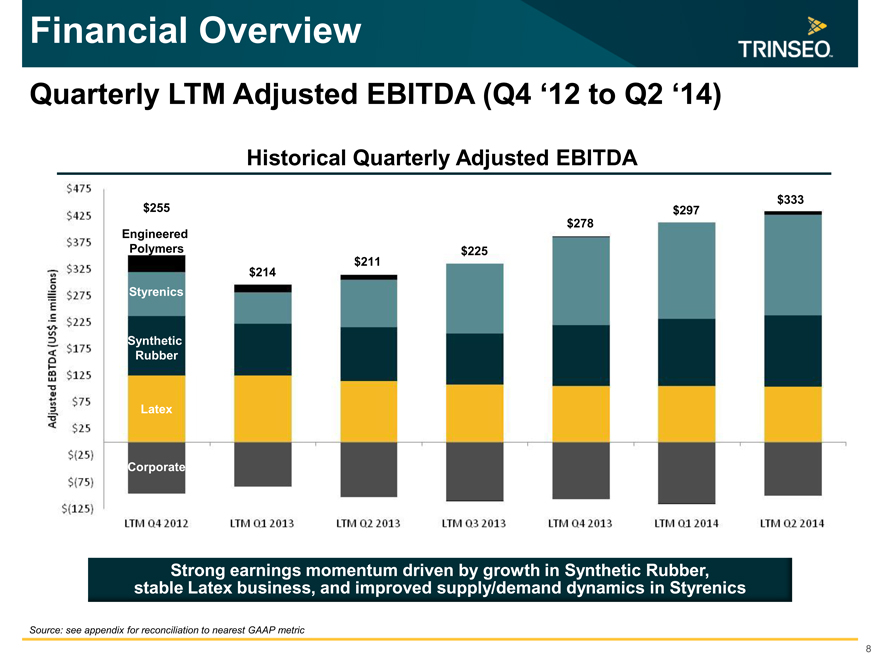
Quarterly LTM Adjusted EBITDA (Q4 ‘12 to Q2 ‘14)
Historical Quarterly Adjusted EBITDA
$333
$255 $297
$278
Engineered
Polymers $225
$211
$214
Styrenics
Synthetic
Rubber
Latex
Corporate
Strong earnings momentum driven by growth in Synthetic Rubber, stable Latex business, and improved supply/demand dynamics in Styrenics
LTM Q4 2012 LTM Q1 2013 LTM Q2 2013 LTM Q3 2013 LTM Q4 2013 LTM Q1 2014 LTM Q2 2014
Source: see appendix for reconciliation to nearest GAAP metric
| 8 |
|
|
|
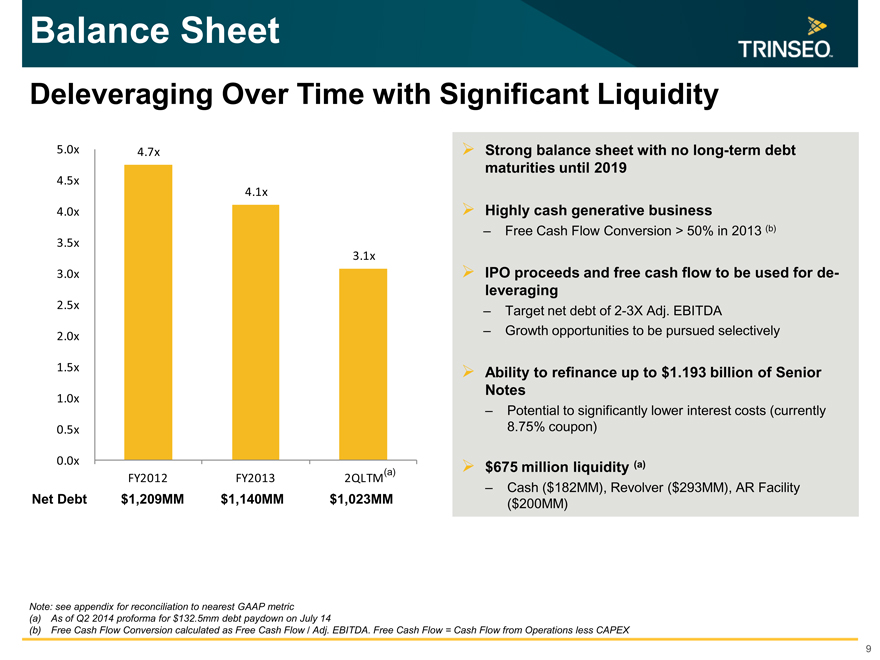
Balance Sheet
Deleveraging Over Time with Significant Liquidity
5.0x 4.7x
4.5x
4.1x
4.0x
3.5x
3.1x
3.0x
2.5x
2.0x
1.5x
1.0x
0.5x
0.0x
FY2012 FY2013 2QLTM(a)
Net Debt $1,209MM $1,140MM $1,023MM
Strong balance sheet with no long-term debt maturities until 2019
Highly cash generative business
– Free Cash Flow Conversion > 50% in 2013 (b)
IPO proceeds and free cash flow to be used for de-leveraging
– Target net debt of 2-3X Adj. EBITDA
– Growth opportunities to be pursued selectively
Ability to refinance up to $1.193 billion of Senior Notes
– Potential to significantly lower interest costs (currently 8.75% coupon)
$675 million liquidity (a)
– Cash ($182MM), Revolver ($293MM), AR Facility
($200MM)
Note: see appendix for reconciliation to nearest GAAP metric
| (a) |
|
As of Q2 2014 proforma for $132.5mm debt paydown on July 14 |
(b) Free Cash Flow Conversion calculated as Free Cash Flow / Adj. EBITDA. Free Cash Flow = Cash Flow from Operations less CAPEX
9
|
|
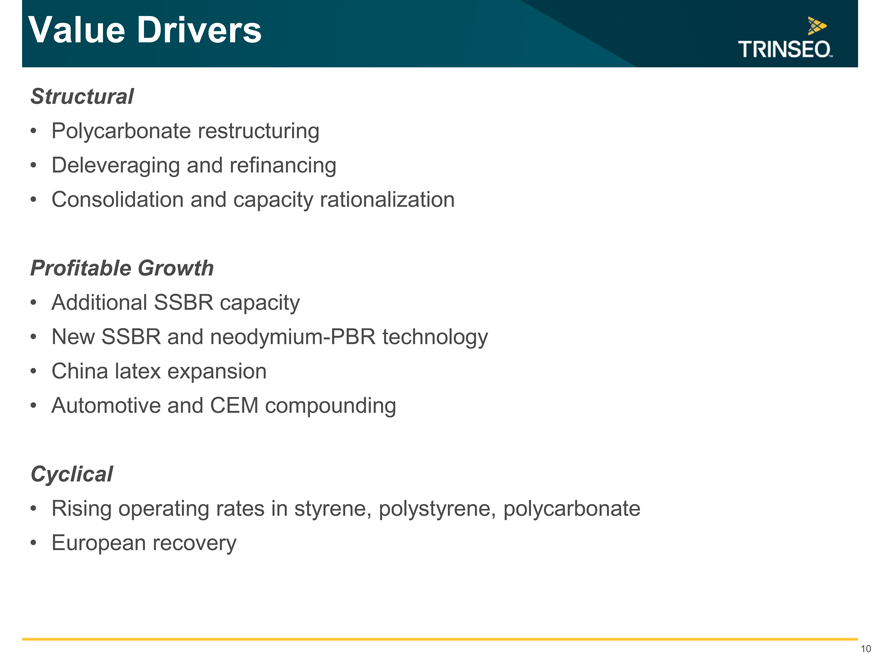
Value Drivers
Structural
Polycarbonate restructuring
Deleveraging and refinancing
Consolidation and capacity rationalization
Profitable Growth
Additional SSBR capacity
New SSBR and neodymium-PBR technology
China latex expansion
Automotive and CEM compounding
Cyclical
Rising operating rates in styrene, polystyrene, polycarbonate
European recovery
10
|
|
Appendix
™ Trademark
|
|
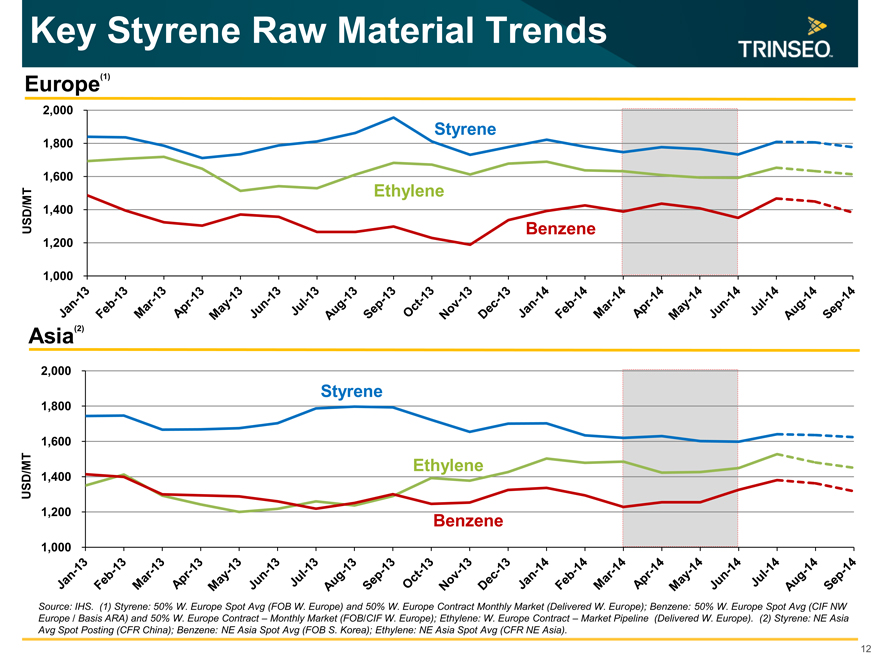
Key Styrene Raw Material Trends
Europe(1)
2,000
Styrene
1,800
1,600
Ethylene
1,400
USD/MT Benzene
1,200
1,000
| (2) |
|
| Jan-13 |
|
Feb-13 Mar-13 Apr-13 May-13 Jun-13 Jul-13 Aug-13 Sep-13 Oct-13 Nov-13 Dec-13 Jan-14 Feb-14 Mar-14 Apr-14 May-14 Jun-14 Jul-14 Aug-14 Sep-14 |
Asia(2)
2,000
Styrene
1,800
1,600
Ethylene
USD/MT 1,400
1,200 Benzene
1,000
| Jan-13 |
|
Feb-13 Mar-13 Apr-13 May-13 Jun-13 Jul-13 Aug-13 Sep-13 Oct-13 Nov-13 Dec-13 Jan-14 Feb-14 Mar-14 Apr-14 May-14 Jun-14 Jul-14 Aug-14 Sep-14 |
Source: IHS. (1) Styrene: 50% W. Europe Spot Avg (FOB W. Europe) and 50% W. Europe Contract Monthly Market (Delivered W. Europe); Benzene: 50% W. Europe Spot Avg (CIF NW Europe / Basis ARA) and 50% W. Europe Contract – Monthly Market (FOB/CIF W. Europe); Ethylene: W. Europe Contract – Market Pipeline (Delivered W. Europe). (2) Styrene: NE Asia Avg Spot Posting (CFR China); Benzene: NE Asia Spot Avg (FOB S. Korea); Ethylene: NE Asia Spot Avg (CFR NE Asia).
12
|
|
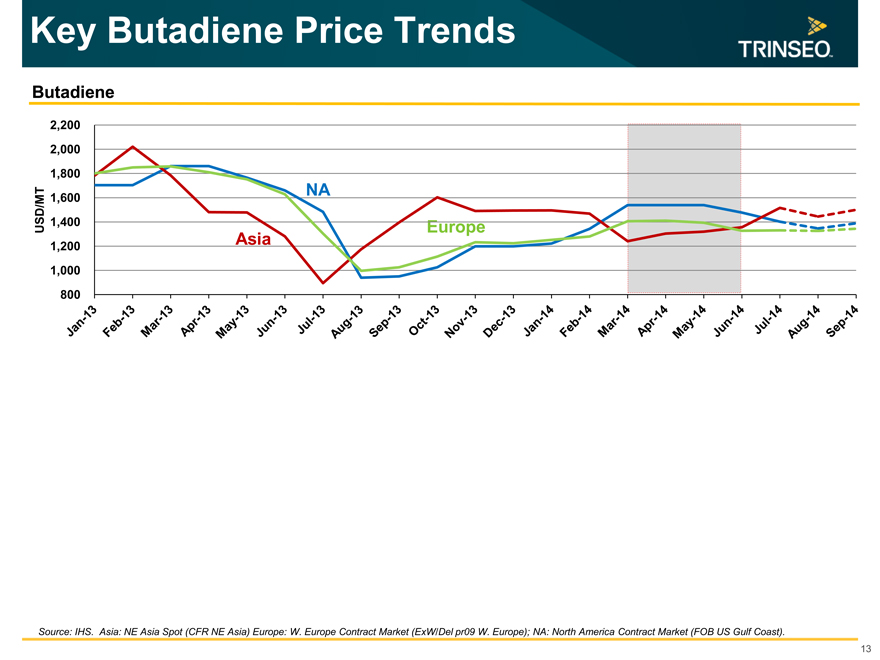
Key Butadiene Price Trends
Butadiene
2,200
2,000
1,800
1,600 NA
USD/MT 1,400 Europe
1,200 Asia
1,000
| Jan-13 |
|
Feb-13 Mar-13 Apr-13 May-13 Jun-13 Jul-13 Aug-13 Sep-13 Oct-13 Nov-13 Dec-13 Jan-14 Feb-14 Mar-14 Apr-14 May-14 Jun-14 Jul-14 Aug-14 Sep-14 |
800
Source: IHS. Asia: NE Asia Spot (CFR NE Asia) Europe: W. Europe Contract Market (ExW/Del pr09 W. Europe); NA: North America Contract Market (FOB US Gulf Coast).
13
|
|
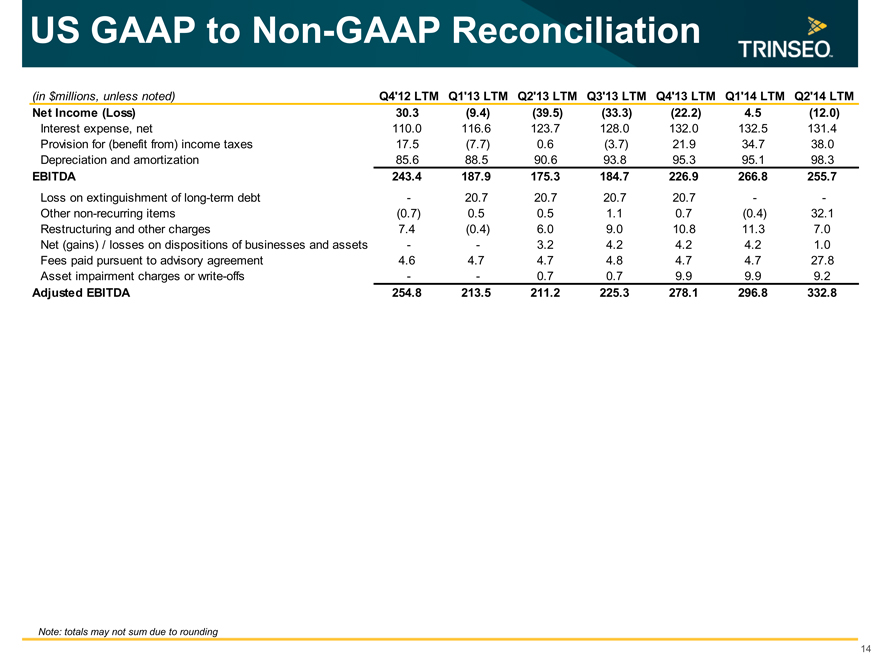
US GAAP to Non-GAAP Reconciliation
(in $millions, unless noted) Q4’12 LTM Q1’13 LTM Q2’13 LTM Q3’13 LTM Q4’13 LTM Q1’14 LTM Q2’14 LTM
Net Income (Loss) 30.3 (9.4) (39.5) (33.3) (22.2) 4.5 (12.0)
Interest expense, net 110.0 116.6 123.7 128.0 132.0 132.5 131.4
Provision for (benefit from) income taxes 17.5 (7.7) 0.6 (3.7) 21.9 34.7 38.0
Depreciation and amortization 85.6 88.5 90.6 93.8 95.3 95.1 98.3
EBITDA 243.4 187.9 175.3 184.7 226.9 266.8 255.7
Loss on extinguishment of long-term debt - 20.7 20.7 20.7 20.7 - -
Other non-recurring items (0.7) 0.5 0.5 1.1 0.7 (0.4) 32.1
Restructuring and other charges 7.4 (0.4) 6.0 9.0 10.8 11.3 7.0
Net (gains) / losses on dispositions of businesses and assets - - 3.2 4.2 4.2 4.2 1.0
Fees paid pursuent to advisory agreement 4.6 4.7 4.7 4.8 4.7 4.7 27.8
Asset impairment charges or write-offs - - 0.7 0.7 9.9 9.9 9.2
Adjusted EBITDA 254.8 213.5 211.2 225.3 278.1 296.8 332.8
Note: totals may not sum due to rounding
14