Attached files
| file | filename |
|---|---|
| 8-K - 8-K - NORTHSTAR REALTY FINANCE CORP. | a14-18789_18k.htm |
Exhibit 99.1
|
|
Investor Presentation August 2014 399 Park Avenue, 18th Floor, New York, NY 10022 | 212.547.2600 | nrfc.com |
|
|
1 Safe Harbor This presentation contains certain “forward-looking statements” within the meaning of the Private Securities Litigation Reform Act of 1995, Section 27A of the Securities Act of 1933, as amended, or Securities Act, and Section 21E of the Securities Exchange Act of 1934, as amended, or Exchange Act, including statements about future results, projected yields, rates of return and performance, projected cash available for distribution, projected cash from any single source of investment or fee stream, projected expenses, expected and weighted average return on equity, market and industry trends, investment opportunities, business conditions and other matters, including, among other things: the ability to consummate our proposed merger with Griffin-American Healthcare REIT II, Inc. (“Griffin-American”) on the terms proposed or at all; the resulting effects of becoming an externally managed company, including the payment of substantial fees to our manager, the allocation of investments by our manager among us and our manager's other managed companies, and various conflicts of interest in our relationship with NSAM; the occurrence of any event, change or other circumstances that could give rise to the termination of the definitive merger agreement with Griffin-American; the inability to complete the merger or failure to satisfy other conditions to completion of the merger with Griffin-American; the inability to complete the merger within the expected time period or at all, including due to the failure to obtain the Griffin-American stockholder approval, the approval of our stockholders or the failure to satisfy other conditions to completion of the merger, including that a governmental entity may prohibit, delay or refuse to grant approval for the consummation of the merger; risks related to disruption of management's attention from the ongoing business operations due to the proposed merger; the effect of the announcement of the proposed merger on our or Griffin-American's relationships with their respective customers, tenants, lenders, operating results and businesses generally; the scalability of our investment platform, in particular, the healthcare real estate portfolio; the performance of Griffin-American's portfolio and our healthcare real estate portfolio generally; the projected net operating income of our portfolio and Griffin-American's portfolio and associated cap rate, including the ability to achieve the growth, obtain the lease payments and step ups in contractual lease payments, and maintain dividend payments, at current or anticipated levels, or at all; the diversification of our portfolio; our ability to finance the merger with Griffin-American; our ability to close on our recent commitments to acquire real estate investments and engage in joint venture transactions on the terms contemplated or at all; the timing and amount of borrowings under our revolving credit facility; our ability to comply with the various affirmative and negative covenants, including the financial covenants, required by our revolving credit facility; the anticipated strength and growth of our business; our liquidity and financial flexibility; our ability to realize the benefits of our relationship with Aerium, including our ability to source and consummate investment opportunities internationally; our ability to source and close on attractive investment opportunities, both domestically and internationally; whether we will realize any potential upside in our limited partnership interest in real estate private equity funds or any appreciation above our original cost basis of our real estate portfolio or our CRE loans; performance of our investments relative to our expectations and the impact on our actual return on invested equity, as well as the cash generated from these investments and available for distribution; whether we will produce higher CAD per share in the coming quarters, or ever; the ability to complete the common and preferred investments in a $406 million industrial portfolio (the “Industrial Portfolio”) and the limited partnership interest investments in three private equity funds (all of which are referenced in this presentation) on the terms contemplated or at all; our dividend yield; the size and timing of offerings or capital raises; the ability to opportunistically participate in commercial real estate re-financings; the ability to capitalize on attractive investment opportunities; our ability to realize the projections related to cash available for distribution and underlying assumptions; the projected returns on, and cash earned from, investments, including investments funded by drawings from our credit facilities and securities offerings and equity and debt capital. Forward-looking statements are generally identifiable by use of forward-looking terminology such as “may,” “will,” “should,” “potential,” “intend,” “expect,” “seek,” “anticipate,” “estimate,” “believe,” “could,” “project,” “predict,” “hypothetical,” “continue,” “future” or other similar words or expressions. All forward-looking statements included in this presentation are based upon information available to the Northstar Realty Finance Corp. (the “Company”) on the date hereof and the Company is under no duty to update any of the forward-looking statements after the date of this presentation to conform these statements to actual results. The forward-looking statements involve a number of significant risks and uncertainties. Factors that could have a material adverse effect on the Company’s operations and future prospects are set forth in the Company’s Annual Report on Form 10-K for the fiscal year ended December 31, 2013, including the section entitled “Risk Factors”. The factors set forth in the Risk Factors section and otherwise described in the Company’s filings with SEC could cause the Company’s actual results to differ significantly from those contained in any forward-looking statement contained in this presentation. The Company does not guarantee that the assumptions underlying such forward-looking statements are free from errors. Unless otherwise stated, historical financial information and per share and other data is as of June 30, 2014. This presentation is for informational purposes only and does not constitute an offer to sell or a solicitation of an offer to buy any securities of the Company. The endnotes herein contain important information that is material to an understanding of this presentation and you should read this presentation only with and in context of the endnotes. |
|
|
Overview of NorthStar Realty Finance(1) 2 NorthStar Realty Finance (NYSE: NRF) is a premier diversified commercial real estate investment company that is organized as a REIT and is managed by NorthStar Asset Management Group Inc. (NYSE: NSAM), a global asset management firm Proven track record of investing through commercial real estate cycles and across a variety of real estate sectors and capital structures, utilizing a diligent investment strategy driving attractive risk-adjusted returns to shareholders 19% compounded annual stockholder return since IPO in 2004 $14 billion of diversified commercial real estate assets Attractive current income through dividend yield (currently 8.9%) with upside from embedded real estate asset value Significant insider ownership |
|
|
3 NRF Consistent Outperformance(2) Price to 2015E AFFO / CADx Compound Annual Total Return NRF has significantly outperformed equity and commercial mortgage REITs since its IPO in 2004 through opportunistic investments and sector leading dividend growth . NRF (IPO October 2004) through August 1, 2014 Average = 15.1 19.1 16.6 14.7 14.5 14.2 11.7 +/ - 11 8.0 10.0 12.0 14.0 16.0 18.0 20.0 22.0 -10% -5% 0% 5% 10% 15% 20% Commercial Mortgage REITs S&P 500 MSCI U.S. REIT Index (RMS) NRF |
|
|
Overview of NorthStar Realty Finance(3) 4 Diversification across a broad spectrum of commercial real estate investments ($ in millions) Owned commercial real estate $ 10,581 Commercial real estate loans 1,306 Assets underlying deconsolidated CRE loan CDOs 1,423 Commercial real estate securities 872 Total assets $ 14,183 Commercial Owned commercial real estate, 75% Commercial real estate loans, 9% Assets underlying deconsolidated CRE loan CDOs, 10% Commercial real estate securities, 6% |
|
|
NRF Q3 & Q4 2014 Annualized Projected CAD(4) * May 2014 investor presentation indicated that annualized CAD projection of $1.58-1.70 per share was based on 198 million fully diluted shares outstanding, reflecting exchangeable notes on an as-converted basis prior to the spin-off of NorthStar Asset Management Group Inc. (the “Spin-Off”). Certain exchangeable notes converted following the Spin-Off and the CAD projection above assumes all remaining exchangeable notes convert in the third quarter 2014, which results in 208 million fully diluted shares. See reconciliation of CAD to net income (loss) attributable to common stockholders at the end of the presentation. 5 $Amount 2014 gross cash available for distribution $624-$630 less: corporate debt and preferred costs $117-$122 less: cash G&A and management fees $168-$174 Q3 & Q4 2014 annualized projected CAD * $328-$345 Q3 & Q4 2014 annualized projected CAD per share * $1.60-$1.68 Healthcare Manufactured housing Hotel Office, retail and industrial net lease Multifamily $- $20 $40 $60 $80 $100 $120 $140 $160 $180 $200 $220 Other RXR investment CDO equity distributions CDO bonds discounts 2011 - 2014 loan investments Real estate PE Investments Real estate (Amounts in millions, except per share data ) |
|
|
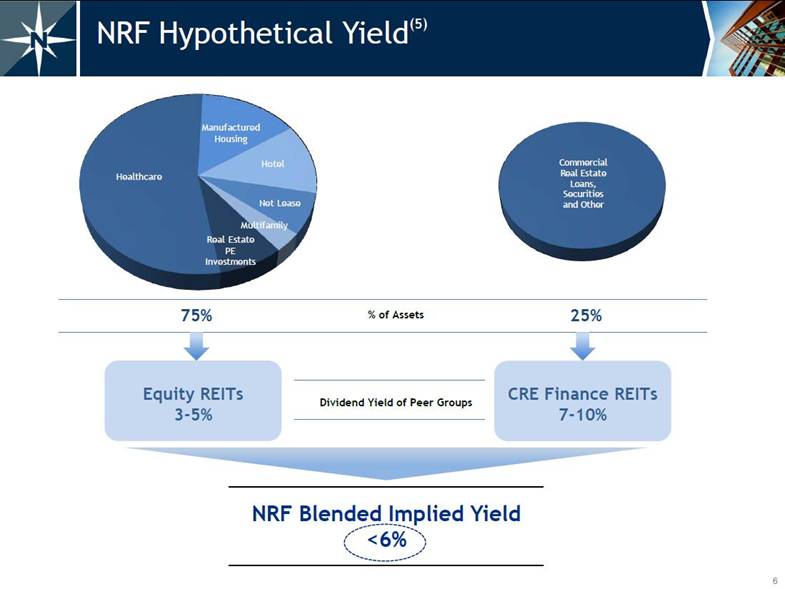
6 NRF Hypothetical Yield(5) % of Assets NRF Blended Implied Yield <6% Dividend Yield of Peer Groups Commercial Real Estate Loans, Securities and Other Healthcare Manufactured Housing Hotel Net Lease Multifamily Real Estate PE Investments |
|
|
7 2014 NRF Investments(6) Year-to-date, NRF committed to $3.3 billion of diversified commercial real estate investments with an expected current yield on equity of approximately 14% Excludes the agreement to acquire Griffin-American Healthcare REIT II, Inc. (“Griffin-American”) for $4 billion |
|
|
8 NRF Real Estate Portfolio – Healthcare(7) Pro Forma NorthStar Realty Healthcare Portfolio Current NorthStar Realty Healthcare Portfolio + Griffin-American transaction is expected to create best in class healthcare portfolio with substantial size, stability and diversification Griffin-American transaction triples the NOI of NorthStar Realty's Healthcare portfolio and significantly improves profile with addition of MOBs Total 2015E NOI $382 million Total 2015E NOI $126 million RIDEA NNN NNN RIDEA Medical Office 28.6% Hospitals 5.4% Skilled Nursing 29.5% Senior Housing 36.5% Medical Office 0.2% Senior Housing 50.1% Skilled Nursing 49.7% |
|
|
9 NRF Real Estate Portfolio – Healthcare(8) 146 properties 6 million square feet 87.9% on-campus/affiliated Minimal rollover; low CapEx required 6.4 year average remaining lease term 92.4% occupancy 194 properties 10,677 beds 58.7% NNN / 41.3% RIDEA 10.7 year average remaining lease term 1.3x EBITDAR Coverage 108 properties 12,674 beds 10.3 year average remaining lease term 1.4x EBITDAR Coverage 14 properties (Acute, LTAC and Rehab) 817 beds 12.9 year average remaining lease term 3.3x EBITDAR Coverage Falls of Neuse Raleigh Medical Office Building, Raleigh, North Carolina Tall Trees Care Home, UK MOBs Senior Housing Skilled Nursing Facilities Hospitals Lafayette Physical Rehabilitation Hospital, Lafayette, LA Bessemer Medical Office Building, Bessemer, AL Wellspring & Evergreen CCRC, Cincinnati, OH Castleton Skilled Nursing Facility, Castleton, IN |
|
|
10 NRF Real Estate Portfolio – Healthcare(9) NRF portfolio pro forma for the Griffin-American transaction presents one of the highest concentrations of MOBs among the diversified healthcare REIT portfolios Asset Mix Implied Cap Rate Price / 2015E AFFO Dividend Yield 29% 18% 14% 13% 29% 18% 18% 29% 20% 24% 27% 34% 16% 30% 35% 4% 5% 7% 4% 5% 1% 15% 3% 0% 20% 40% 60% 80% 100% Pro Forma NRF VTR HCN HCP MOB SNF SH NNN SH RIDEA Hospitals Life Sciences Other 6.2% 6.1% 5.9% 5.6% 6.0% 6.4% VTR HCP HCN 16.9x 15.6x 14.8x 10.0x 12.0x 14.0x 16.0x 18.0x HCN HCP VTR 5.2% 4.9% 4.6% 0.0% 2.0% 4.0% 6.0% 8.0% HCP HCN VTR |
|
|
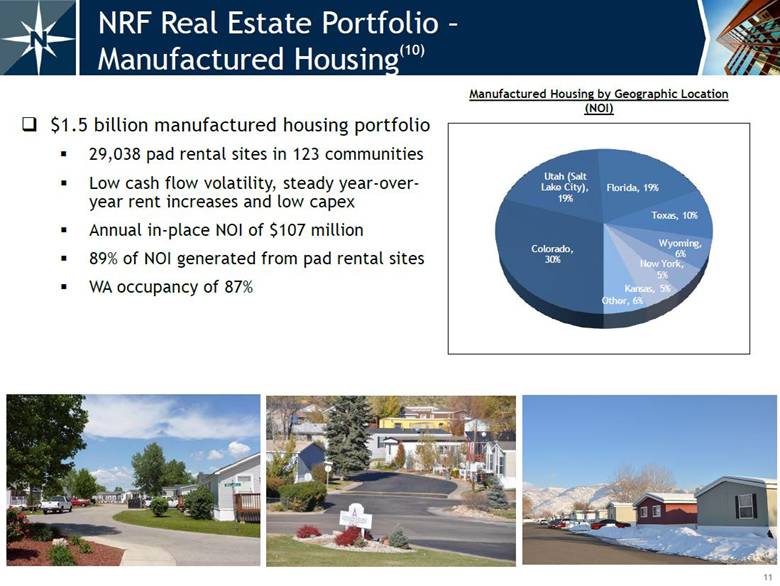
11 $1.5 billion manufactured housing portfolio 29,038 pad rental sites in 123 communities Low cash flow volatility, steady year-over-year rent increases and low capex Annual in-place NOI of $107 million 89% of NOI generated from pad rental sites WA occupancy of 87% NRF Real Estate Portfolio – Manufactured Housing(10) Manufactured Housing by Geographic Location (NOI) Colorado, 30% Utah (Salt Lake City), 19% Florida, 19% Texas, 10% Wyoming, 6% New York, 5% Kansas, 5% Other, 6% |
|
|
12 $1.3 billion hotel portfolio 67 extended stay and premium branded select service hotels Approximately 8,022 keys 81% affiliated with Marriott or Hilton Annual trailing NOI of $94 million NRF’s cost basis reflects a significant discount to estimated portfolio-wide replacement cost NRF Real Estate Portfolio – Hotel(11) Hotel by Geographic Location (NOI) West, 25% Northeast, 23% Southwest, 22% Southeast, 18% Mid - Atlantic, 7% Midwest, 5% |

|
|
13 NRF Real Estate Portfolio – Other(12) $781 million predominately triple net lease office, retail and industrial portfolio Annual in-place NOI of $62 million $370 million multifamily portfolio with over 4,500 units Annual in-place NOI of $22 million Net Lease by Property Type (NOI) Net Lease by Geographic Location (NOI) Multifamily by Geographic Location (NOI) Industrial, 51% Office, 41% Retail, 8% |

|
|
14 NRF New Loan Originations(13) $0.7 billion of invested equity in new loans in 2012-2014 92% directly originated $1.4 trillion of loan maturities expected over the next four years: Originated Loan Example NRF directly originated a $255 million loan secured by the Row NYC (formerly Milford Plaza) hotel located in Times Square, New York City Initial current yield on equity of 12.5% with a 35% ownership interest in the hotel and retail component of the hotel, pro-rata with NorthStar Income $0 $100 $200 $300 $400 2014 2015 2016 2017 ($ in billions) Commercial Banks, Savings Institutions Insurance Companies GSE's & Fed Related Mortgage Pools CMBS |
|
|
15 RXR Investment(14) Strategic $340 million debt and equity investment in RXR Realty, LLC (“RXR”), a leading real estate owner, developer and investment management company focused on high-quality real estate in the New York Tri-State area RXR is led by the former management team of Reckson Associates Realty Corp., which was sold to SL Green Realty Corp. in 2007, generating a 715% total return to Reckson shareholders from its IPO in 1995 RXR has assembled a portfolio of trophy assets that include 75 Rockefeller Plaza, 237 Park Avenue, 340 Madison Avenue, 450 Lexington Avenue, 620 Avenue of the Americas, the Starrett-Lehigh Building and 1330 Avenues of the Americas 340 Madison Avenue, New York, NY 75 Rockefeller Plaza, New York, NY Starrett-Lehigh Building, New York, NY |
|
|
16 Aerium Investment / European Investments NRF acquired a minority interest in Aerium Group (“Aerium”) for €50 million in connection with expanding internationally Aerium, established in 1988, is a pan-European commercial real estate investment manager headquartered in Luxembourg with offices in London, Paris, Istanbul, Geneva, Dusseldorf and Bahrain Aerium manages €6.1 billion of real estate assets across 12 countries and employs over 180 professionals Aerium and NorthStar Realty are sourcing real estate acquisitions and loan originations across Europe |
|
|
17 NRF Real Estate PE Investments(15) PE Investments by Underlying Geographic Location (NAV as of March 31, 2014) PE Investments by Underlying Investment Type (NAV as of March 31, 2014) West 21% Primarily Various U.S. 17% Northeast 12% Europe 11% Southeast 11% Midwest 9% Mid - Atlantic 7% Cash 7% Asia 5% ($ in millions) Aggregate / Weighted Average PE Investments Number of funds 85 Number of general partners 47 Initial NAV $1,825 Closing NAV as a percentage of net cost 72% Reported annual NAV growth 16% Underlying assets, at cost $52,200 Implied leverage 41% Investment $820 Return of capital $211 |
|
|
18 As of August 6, 2014, principal proceeds NRF could receive from its owned CDO bonds is $611 million, of which $477 million were repurchased at significant discounts to par and had a WA original credit rating of A Potential realizable cash flow of $319 million Purchase price of $158 million (67% discount to par) NRF Owned CDO Principal $611 million Repurchased at Discounts $477 million NRF CDO Bonds Repurchased(16) $- $100 $200 $300 $400 $500 $600 $700 ($ in millions) |

|
|
19 Name Position Yrs of Exp Relevant Background David T. Hamamoto Chairman and Chief Executive Officer 30 NorthStar Capital - Co-Founder Goldman, Sachs & Co. - Co-Founder and Partner of Real Estate Principal Investment (Whitehall Funds) Albert Tylis President 16 Bryan Cave / Robinson Silverman - Senior Attorney ASA Institute - Director of Corporate Finance and General Counsel Daniel R. Gilbert Chief Investment and Operating Officer 20 NorthStar Capital – Head of Mezzanine Lending Business Merrill Lynch - Group Head in Global Principal Investment and Commercial Real Estate Debra A. Hess Chief Financial Officer 28 Newcastle Investment Corp. – Chief Financial Officer Fortress Investment Group – Managing Director Goldman, Sachs & Co. – Vice President, Manager of Financial Reporting Ronald J. Lieberman Executive Vice President and General Counsel 19 Hunton & Williams – Partner, Real Estate Capital Markets Skadden, Arps, Slate, Meagher and Flom – Associate, Corporate and Securities Daniel D. Raffe Executive Vice President and Head of Portfolio Management 25 GE Business Property – Head of East and Midwest real estate acquisitions Cushman & Wakefield – Managing Director, Real Estate Capital Markets Steven B. Kauff Executive Vice President Structuring and Tax 27 NorthStar Capital – Structuring and Tax Arthur Anderson – Real Estate & Hospitality, Tax Consulting Pricewaterhouse Coopers – Real Estate Industry, Tax Consulting Robert S. Riggs Managing Director 26 Olympus Real Estate Partners - Partner GE Capital Realty Group – COO and EVP of Equity Investing Seasoned Executive Team(17) |
|
|
20 Appendix PE Investment Examples Reconciliation of NRF Q3 & Q4 2014 Annualized Projected Cash Available for Distribution Presentation Endnotes |
|
|
21 PE Investments Example(18) PE Investment I: $282 million equity Acquired from TIAA-CREF Potential Return Matrix on NRF Investment Consolidated Fund IRRs From Reported 9-30-12 NAVs 5% 10% 15% 20% Resulting NRF IRR 8% 18% 27% 37% Resulting Recovery as a Percentage of Cost of Underlying Assets (Including Income) 86% 100% 121% 141% Priority returns and structure expected to enhance long-term IRR and resulting profits 85% / 15% NRF receives 85% of all cash distributions from the Funds until NRF receives a 1.5x multiple on its invested capital Liquidation at June 30, 2012 NAV = $430 million of distributions to NRF PE Investment II: $353 million equity Acquired from NJDOI Partnered with Goldman Sachs Asset Management |

|
|
22 Reconciliation of NRF Q3 & Q4 2014 Annualized Projected CAD(19) Reconciliation of NRF Projected Cash Available for Distribution ("CAD") (Amount in millions except per share data) NRF Q3 & Q4 2014 Annualized Projected CAD Net income (loss) attributable to common stockholders 123 $ - 140 $ Adjustments: Depreciation and amortization items 196 - 196 CDO bond discounts 13 - 13 Distributions to joint venture partners (4) - (4) - Projected CAD 328 $ - 345 $ Projected CAD per share 1.60 $ - 1.68 $ |
|
|
23 Presentation Endnotes NRF dividend yield based on closing price on August 8, 2014 and expected annualized dividend per share for Q3 & Q4 2014 of $1.60. NRF Consistent Outperformance Compounded Annual Total Return: Based on price performance including reinvestment of dividends. Commercial Mortgage REITs includes the average of companies that had their IPO prior to the recent financial crisis including ABR, NCT, RAS and STAR. Price to 2015 AFFO/ CADx: Consensus estimate per SNL for all sectors except commercial mortgage REITs which represents I/B/E/S consensus estimate reported by FactSet. Prices based on August 8, 2014 market close. The most comparable reported earnings metric to NRF’s reported CAD based on analyst consensus for 2014 estimates are used for presentation purposes and should not be considered as an alternative to NRF reported CAD. In addition, our methodology for calculating CAD may differ from the methodologies used by other comparable companies, including other REITs, when calculating the same or similar supplemental financial measures and may not be comparable with these companies. For further information relating to NRF’s calculation of CAD refer to NRF’s form 10-Q. Assets include assets underlying deconsolidated debt CDOs, and are pro forma for the announced $4 billion acquisition of Griffin-American, a $273 million hotel portfolio acquired in August 2014, a commitment to purchase a $406 million industrial portfolio and limited partnership interests in three private real estate equity funds purchased in July 2014. NRF Q3 & Q4 2014 Annualized Projected CAD: Constitutes forward-looking information based on data as of August 8, 2014. Represents investments made through August 8, 2014 and our existing capital sources, unless otherwise noted. Actual CAD and each individual line item presented herein could vary significantly from the projections presented. Pro forma effects related to the Griffin-American transaction are excluded from this presentation. Real estate: Includes a $406 million industrial portfolio NRF entered into an agreement to invest in during the second quarter 2014. CDO bond discounts: Annual accretion on an effective yield basis based on expected maturity and recovery of each CDO bond. Other: Includes Aerium, CDO management fees and CDO bond coupon income. Corporate debt and preferred costs: Based on corporate debt and preferred stock outstanding as of August 8, 2014 and (i) assumes the newly issued 3.0% senior notes are refinanced at its September 2014 maturity date and (ii) assumes remaining other outstanding exchangeable notes are converted into common equity in the third quarter 2014. Cash G&A and management fees: Excludes any equity-based compensation and certain non-recurring items. Per share data: Includes common shares, deferred LTIP units and RSUs not subject to performance hurdles outstanding as of August 8, 2014 and (i) assumes the newly issued 3.0% senior notes are refinanced at its September 2014 maturity date and (ii) and assumes all remaining outstanding exchangeable notes are converted into common equity during the third quarter 2014. Total 2014 weighted average shares equals approximately 205 million. |
|
|
24 Assets are as of June 30, 2014 pro forma for the announced $4 billion acquisition of Griffin-American, a $273 million hotel portfolio acquired in August 2014, a commitment to purchase a $406 million industrial portfolio and limited partnership interests in the three private real estate equity funds purchased in July 2014. 2014 NRF Investments Expected Current Yield: Management provides no assurances that the weighted average life or cash flow of investments will be consistent with management’s expectations or that CRE loans or other investments, will payoff at par, if at all. Actual results could differ materially from expectations. Includes a $406 million industrial portfolio NRF entered into an agreement to invest in during the second quarter 2014. Projected NOI from the healthcare portfolio represents cash flow expected to be received by NRF. For net lease properties represents the contractual rent less operating expenses and for RIDEA properties represents projected property level NOI. Includes the announced $4 billion Griffin-American portfolio. Healthcare REIT Benchmarking Pro forma NRF includes the $4 billion Griffin-American portfolio and based on 2015 estimated NOI. Peer companies based on public filings as of March 31, 2014. The most comparable reported earnings metric to NRF’s reported CAD based on analyst consensus for 2014 estimates are used for presentation purposes and should not be considered as an alternative to NRF reported CAD. In addition, our methodology for calculating CAD may differ from the methodologies used by other comparable companies, including other REITs, when calculating the same or similar supplemental financial measures and may not be comparable with these companies. For further information relating to NRF’s calculation of CAD refer to NRF’s form 10-Q. NOI represents trailing twelve month actual net operating income for communities owned by NRF for a period of greater than twelve months and annualized actual NOI from acquisition date through June 30, 2014 for communities owned by NRF for less than twelve months. NOI also includes rent from pad sites and homes and interest from seller financing. NOI represents trailing twelve months. NRF Real Estate Portfolio - Other Net lease: NOI represents contractual rent less operating expenses annualized based on second quarter 2014 amounts. Multifamily: NOI represents trailing twelve month net operating income for properties owned by NRF for a period of greater than twelve months and annualized actual NOI from acquisition date through June 30, 2014 for properties owned by NRF for less than twelve months. Presentation Endnotes (continued) |
|
|
25 New Loan Originations Invested equity primarily relates to loan investments made in 2012 through August 6, 2014 excluding the RXR investment. Expected loan maturities: Source: Barclays Capital U.S. Securitization Research: CMBS - Scaling the maturity wall 8/16/13. Compiled using data from US Federal Reserve, FDIC and Barclays Capital Row NYC Loan example: NRF funded $109 million and NorthStar Income funded $146 million. RXR Realty owns varying interests in each property. PE Investments: Based on financial data reported by the underlying funds as of March 31, 2014, except as otherwise noted. Closing NAV as a percentage of net cost: Net cost represents total funded capital less distributions received. Reported Annual NAV growth: Measured from the agreed upon NAV at date of acquisition, or Initial NAV. The reported NAV growth for PE Fund Investments owned for less than twelve months is annualized based on actual reported income from Initial NAV through March 31, 2014. Implied leverage: For funds with investment-level financing, calculated as debt divided by assets at fair value. Investment: Includes $38 million of contributions funded subsequent to initial closings and includes $108 million related to investments that closed subsequent to June 30, 2014. CDO Bonds Repurchased NRF owned CDO principal amount of $611 million represents maximum principal amount NRF can receive. There is no assurance that NRF will receive that maximum amount. Shaded portions represent a range of potential recovery with the high end representing the maximum principal amount recoverable. Includes employees of NorthStar Asset Management Group Inc. and its affiliates. PE Investment II NJDOI: Pension Fund E, a common trust fund created under New Jersey statute. IRRs represent return projections beginning from reported September 30, 2012 NAV of $910 million including potential capital calls from the funds and returns on such capital. These returns are hypothetical and illustrative only. Returns assume approximate 4 year weighted average life and 9 year total life of the investment. Actual returns could be materially different and consolidated fund IRRs could be negative. Presentation Endnotes (continued) |
|
|
26 Reconciliation of NRF Projected Q3 & Q4 2014 Annualized Projected CAD CDO bond discounts: For CAD, discount on CDO bonds are accreted on an effective yield basis based on expected maturity and recovery of each CDO bond. Depreciation and amortization items: Projected 2014 CAD includes depreciation and amortization of $170 million; straight-line rental income of $(4) million; amortization of above/below market leases of $(4) million; amortization of deferred financing costs of $8 million; amortization of discounts on financings and other of $10 million; and amortization of equity-based compensation of $16 million. Per share data: Includes common shares, deferred LTIP units and RSUs not subject to performance hurdles outstanding as of August 6, 2014 and (i) assumes the newly issued 3.0% senior notes are refinanced at its September 2014 maturity date and (ii) and assumes all remaining outstanding exchangeable notes are converted into common equity during the third quarter 2014. Total 2014 weighted average shares equals approximately 205 million. Presentation Endnotes (continued) |
|
|
27 399 Park Avenue, 18th Floor, New York, NY 10022 | 212.547.2600 | nrfc.com |