Attached files
| file | filename |
|---|---|
| 8-K - 8-K - Addus HomeCare Corp | d774345d8k.htm |
Exhibit 99.1
|
|

Exhibit 99.1
Addus SM HomeCare
Coordinated Personal Home Care
A pre-acute solution to the post-acute problemSM
Avondale Partners Healthcare Conference Boston, MA
August 11, 2014
|
|
Forward-Looking Statements
The following information contains, or may be deemed to contain, forward-looking statements. By their nature, forward-looking statements involve risks and uncertainties because they relate to events and depend on circumstances that may or may not occur in the future. The future results of Addus may vary from the results expressed in, or implied by, the following forward-looking statements, possibly to a material degree, and historical results may not be an indication of future performance. For a discussion of some of the important factors that could cause Addus’ results to differ from those expressed in, or implied by,the following forward-looking statements, please refer to Addus’ most recent Annual Report on Form 10-K, and its Quarterly Reports on Form 10-Q, each of which is available at www.SEC.gov, particularly the Sections entitled “Risk Factors”. Addus undertakes no obligation to update or revise any forward-looking statements, except as may be required by law.
2
|
|
Mission
It is the primary mission of Addus HealthCare to improve the health and well being of our consumers through the provision of quality, cost-effective home and community based services.
We will accomplish our goals by fostering an environment in which our employees enthusiastically support and advance our mission.
Reward for accomplishing our mission includes pride in our organization, contribution to the community and a reasonable profit.
3
|
|
About Addus
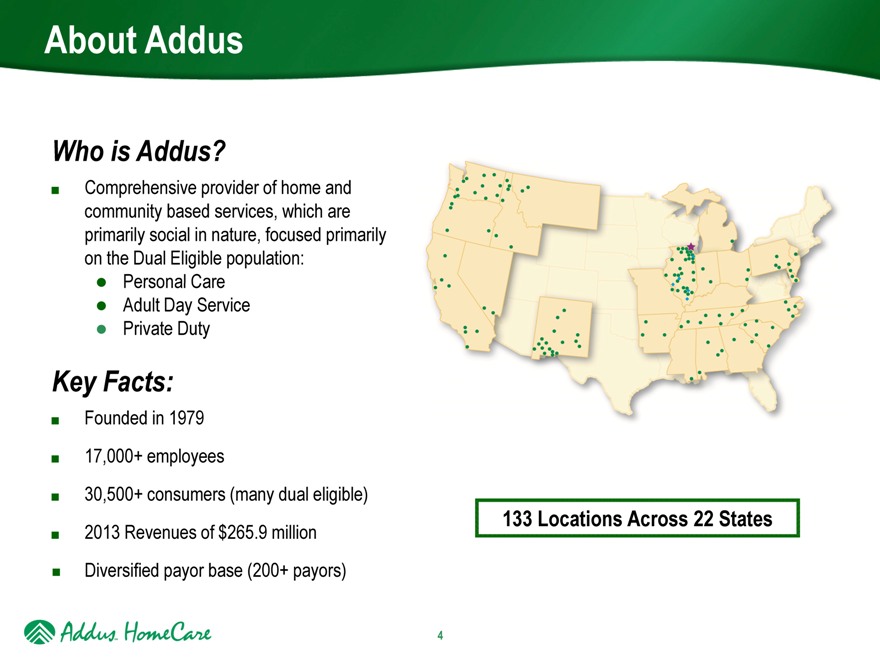
Who is Addus?
Comprehensive provider of home and community based services, which are primarily social in nature, focused primarily on the Dual Eligible population: Personal Care Adult Day Service Private Duty
Key Facts:
Founded in 1979
17,000+ employees
30,500+ consumers (many dual eligible)
2013 Revenues of $265.9 million
Diversified payor base (200+ payors)
133 Locations Across 22 States
4
|
|
Who We Serve
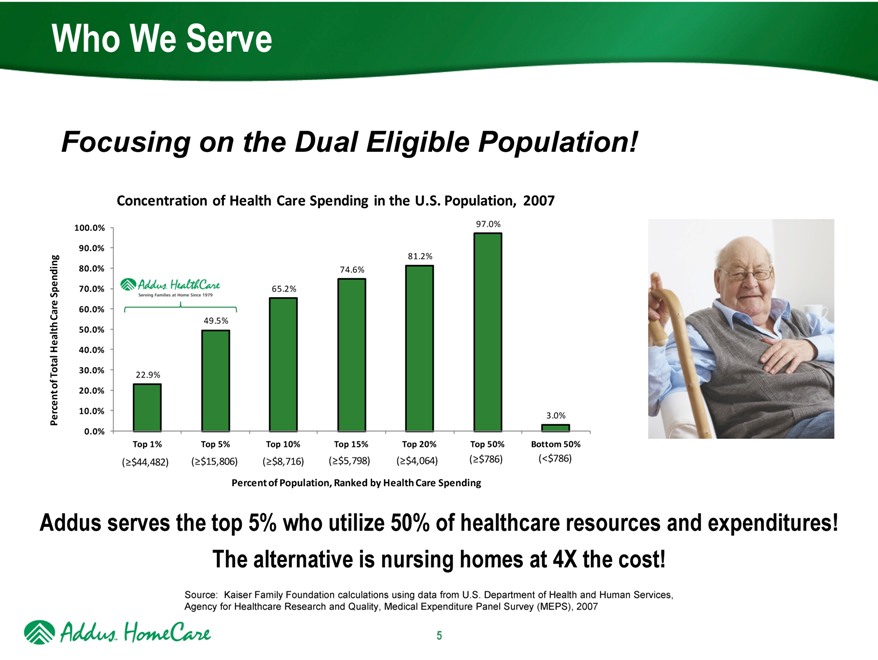
Focusing on the Dual Eligible Population!
Concentration of Health Care Spending in the U.S. Population, 2007
100.0% 97.0%
90.0%
81.2%
80.0% 74.6%
70.0% 65.2%
60.0%
49.5%
50.0%
40.0%
30.0% 22.9%
20.0%
10.0% 3.0%
0.0%
Top 1% Top 5% Top 10% Top 15% Top 20% Top 50% Bottom 50%
($44,482)($15,806)($8,716)($5,798)($4,064)($786)(<$786)
Percentof Population, Ranked by Health Care Spending
Percent of Total Healthcare spending
Addus serves the top 5% who utilize 50% of healthcare resources and expenditures! The alternative is nursing homes at 4X the cost!
Source: Kaiser Family Foundation calculations using data from U.S. Department of Health and Human Services, Agency for Healthcare Research and Quality, Medical Expenditure Panel Survey (MEPS), 2007
5
|
|
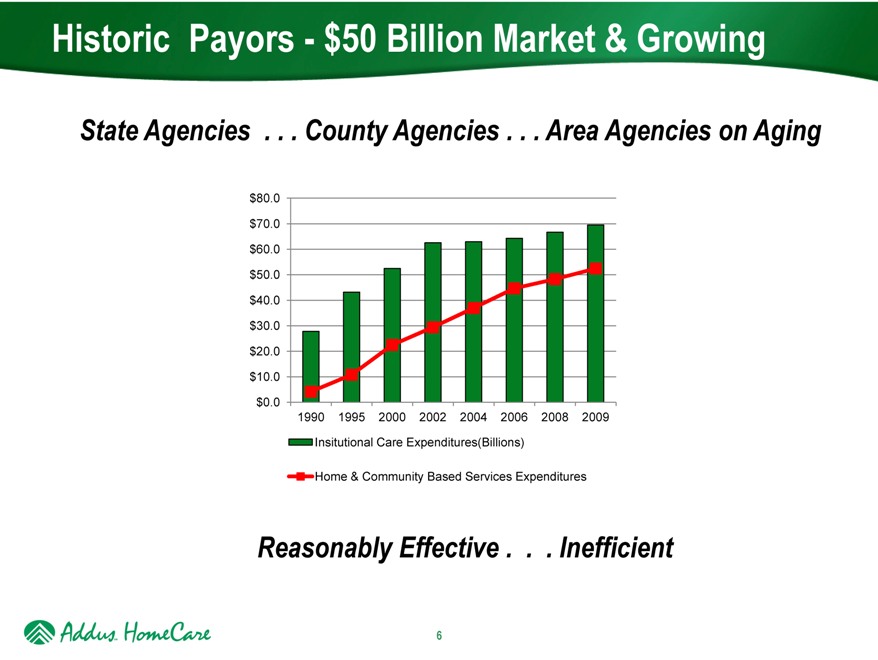
Historic Payors - $50 Billion Market & Growing
State Agencies . . . County Agencies . . . Area Agencies on Aging
$80.0
$70.0
$60.0
$50.0
$40.0
$30.0
$20.0
$10.0
$0.0
1990 1995 2000 2002 2004 2006 2008 2009
Insitutional Care Expenditures(Billions)
Home & Community Based Services Expenditures
Reasonably Effective . . . Inefficient
6
|
|
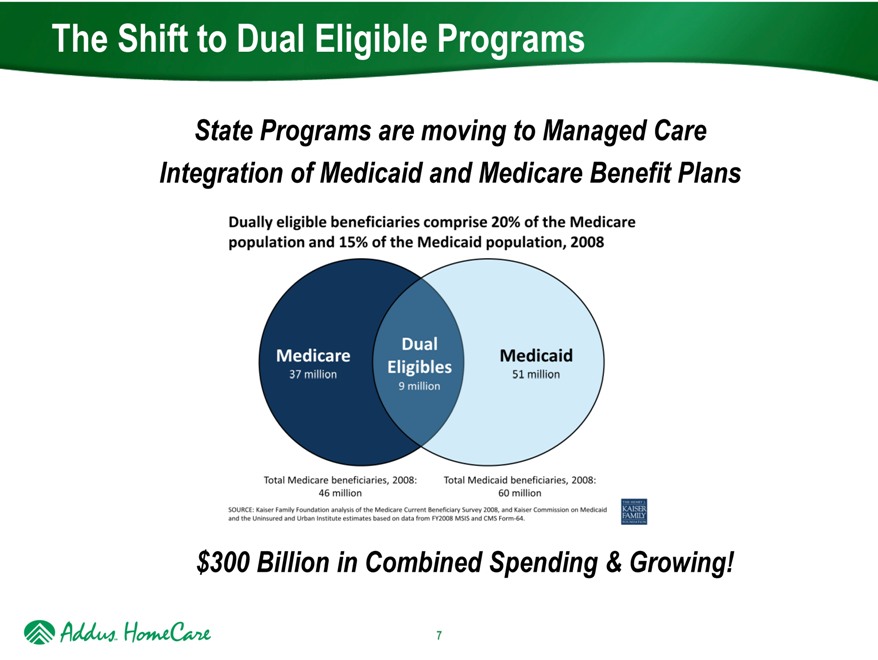
The Shift to Dual Eligible Programs
State Programs are moving to Managed Care Integration of Medicaid and Medicare Benefit Plans
Dually eligible beneficiaries comprise 20% of the Medicare population and 15% of the Medicaid population, 2008
Medicare
37 million
Dual Eligibles
9 million
Medicaid 51 million
Total Medicare beneficiaries, 2008: 46 million
Total Medicaid beneficiaries, 2008: 60 million
SOURCE: Kaiser Family Foundation analysis of the Medicare Current Beneficiary Survey 2008, and Kaiser Commission on Medicaid and the Uninsured and Urban institute estimates based on data from FY2008 MSIS and CMS Form-64.
$300 Billion in Combined Spending & Growing!
7
|
|
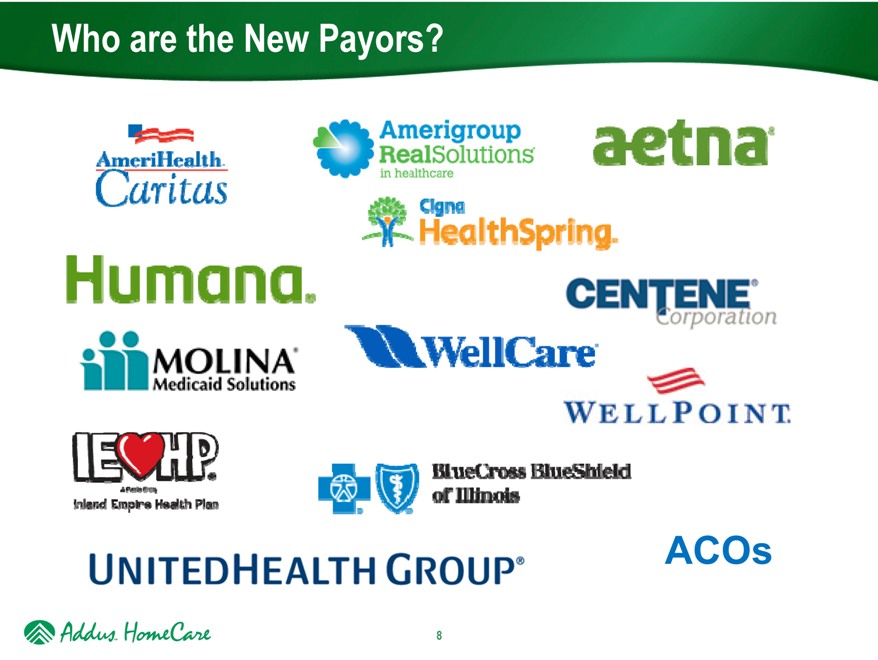
Who are the New Payors?
8
|
|
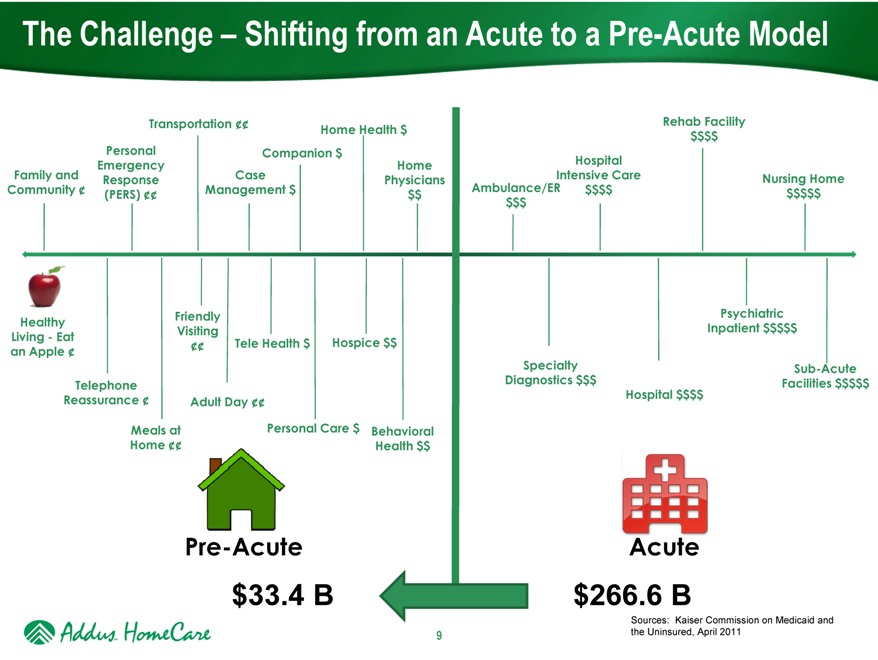
The Challenge – Shifting from an Acute to a Pre-Acute Model
Transportation ¢¢ Home Health $ Rehab Facility
$$$$
Personal Companion $
Emergency Home Hospital
Family and Response Case Physicians Intensive Care Nursing Home
Community ¢(PERS) ¢¢ $$$ $$$$$ $ $$ Management $ Ambulance/ER
$$$
Healthy Friendly Psychiatric
Living - Eat Visiting $$$$Inpatient$
an Apple ¢ ¢¢ Tele Health $ Hospice$$
Specialty Sub-Acute
Telephone $$ $$$$$ Diagnostics$ Facilities
Reassurance ¢ Adult Day ¢¢ $$$Hospital$
Meals at Personal Care $ Behavioral
Home ¢¢ Health $$
Pre-Acute Acute
$33.4 B $266.6 B
Sources: Kaiser Commission on Medicaid and
the Uninsured, April 2011
9
|
|
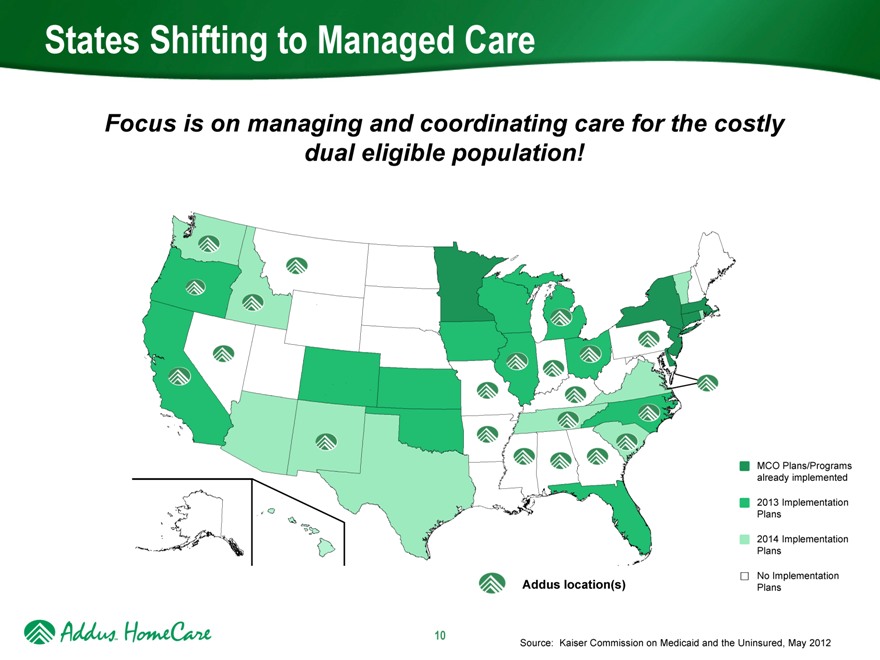
States Shifting to Managed Care
Focus is on managing and coordinating care for the costly dual eligible population!
MCO Plans/Programs already implemented
2013 Implementation Plans
2014 Implementation Plans
No Implementation Plans
Addus location(s)
Source: Kaiser Commission on Medicaid and the Uninsured, May 2012
10
|
|
Addus Dual AdvantageTM - The New Paradigm
Long-term care risk makes it essential that health plan dual eligible members live safely and healthfully at home as long as possible…
11
|
|
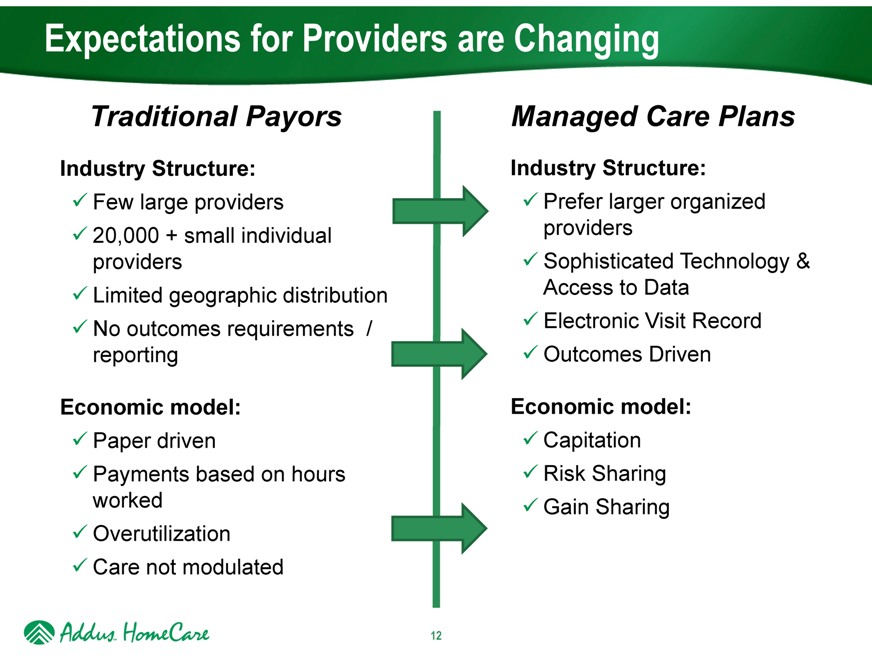
Expectations for Providers are Changing
Traditional Payors
Industry Structure:
Few large providers
20,000 + small individual
providers
Limited geographic distribution
No outcomes requirements /
reporting
Economic model:
Paper driven
Payments based on hours worked
Overutilization
Care not modulated
Managed Care Plans
Industry Structure:
Prefer larger organized providers
Sophisticated Technology & Access to Data
Electronic Visit Record
Outcomes Driven
Economic model:
Capitation
Risk Sharing
Gain Sharing
12
|
|
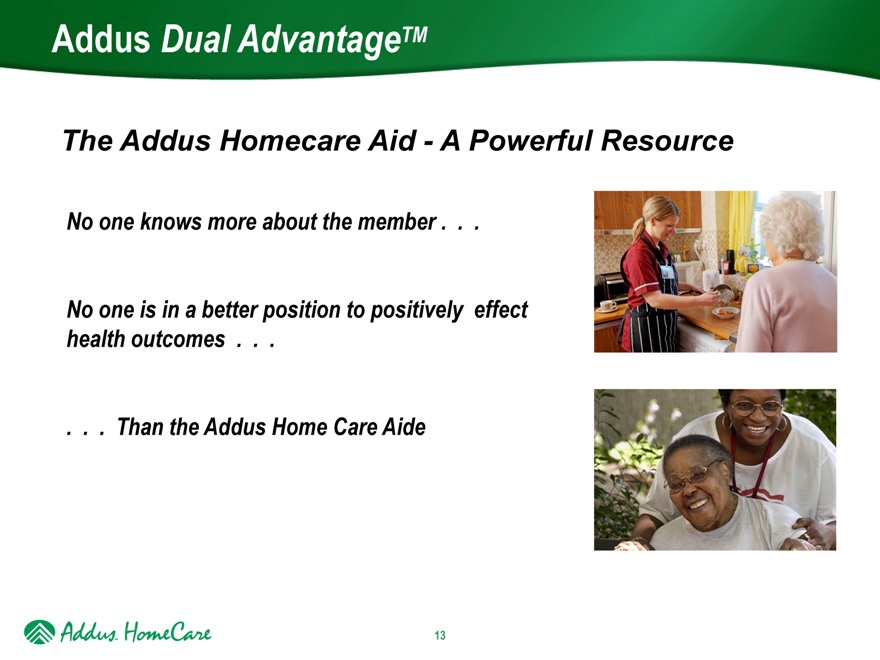
Addus Dual AdvantageTM
The Addus Homecare Aid—A Powerful Resource
No one knows more about the member . . .
No one is in a better position to positively effect health outcomes . . .
. . . Than the Addus Home Care Aide
13
|
|
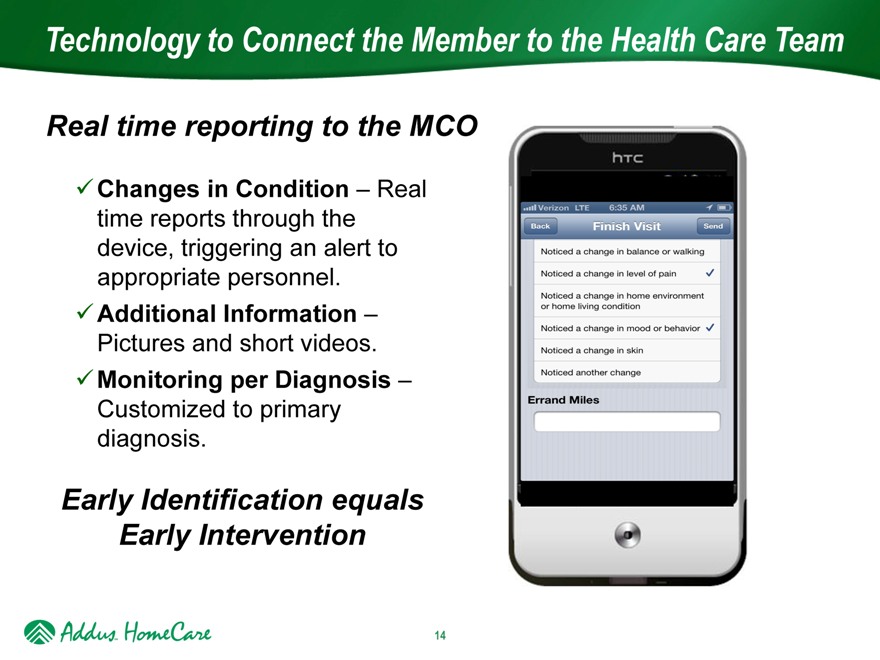
Technology to Connect the Member to the Health Care Team
Real time reporting to the MCO
Changes in Condition – Real time reports through the device, triggering an alert to appropriate personnel.
Additional Information –
Pictures and short videos.
Monitoring per Diagnosis –
Customized to primary diagnosis.
Early Identification equals Early Intervention
14
|
|
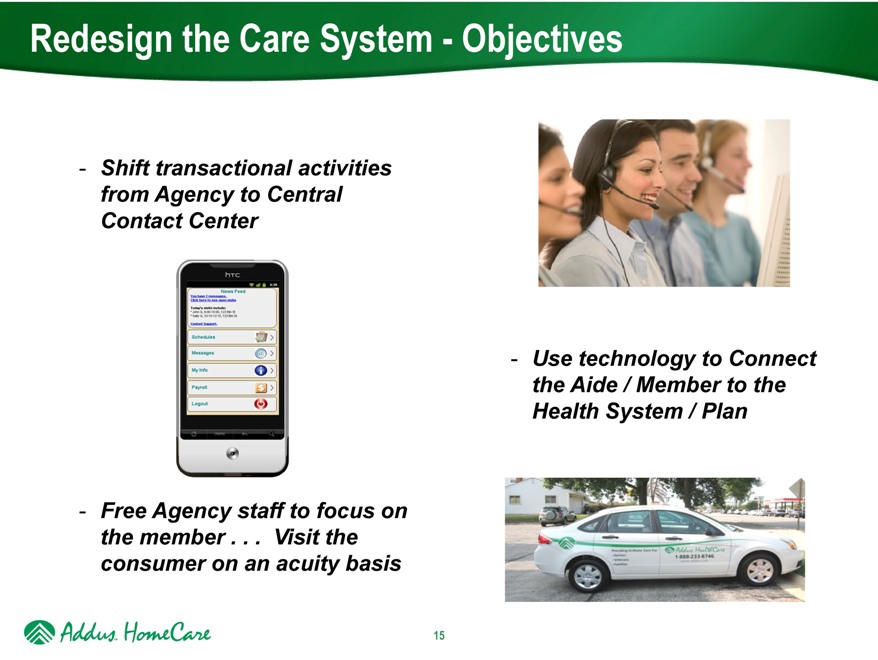
Redesign the Care System—Objectives
- Shift transactional activities from Agency to Central Contact Center
- Free Agency staff to focus on the member . . . Visit the consumer on an acuity basis
- Use technology to Connect the Aide / Member to the Health System / Plan
15
|
|
Video of Addus Services
To view a video about Addus service visit:
https://www.youtube.com/watchv=EAaPHI6t-6Y
16
|
|
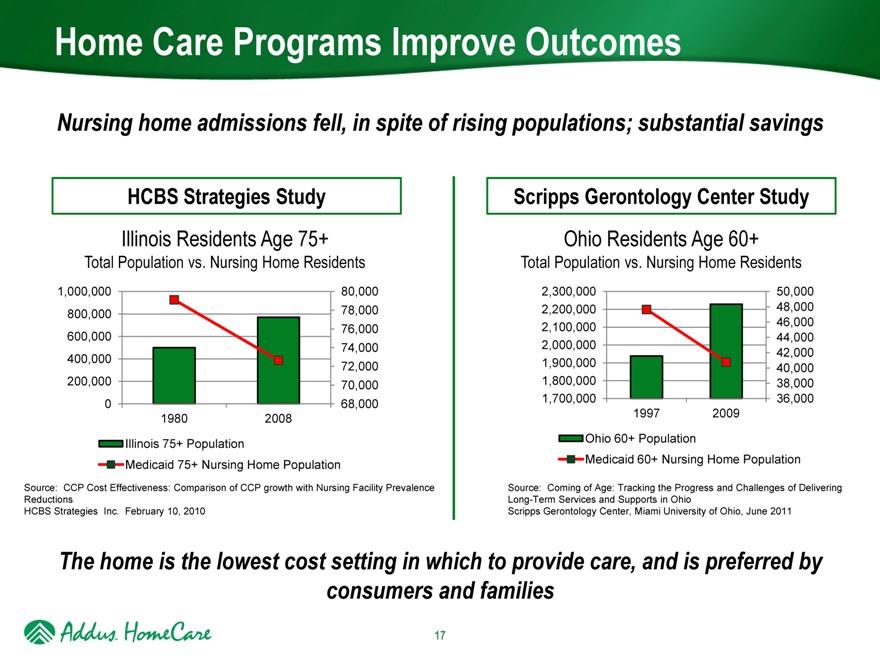
Home Care Programs Improve Outcomes
Nursing home admissions fell, in spite of rising populations; substantial savings
HCBS Strategies Study
Illinois Residents Age 75+
Total Population vs. Nursing Home Residents
1,000,000 80,000
800,000 78,000
600,000 76,000
74,000
400,000 72,000
200,000 70,000
0 68,000
1980 2008
Illinois 75+ Population
Medicaid 75+ Nursing Home Population
Source: CCP Cost Effectiveness: Comparison of CCP growth with Nursing Facility Prevalence Reductions HCBS Strategies Inc. February 10, 2010
Scripps Gerontology Center Study
Ohio Residents Age 60+
Total Population vs. Nursing Home Residents
2,300,000 50,000
2,200,000 48,000
2,100,000 46,000
2,000,000 44,000
42,000
1,900,000 40,000
1,800,000 38,000
1,700,000 36,000
1997 2009
Ohio 60+ Population
Medicaid 60+ Nursing Home Population
Source: Coming of Age: Tracking the Progress and Challenges of Delivering Long-Term Services and Supports in Ohio Scripps Gerontology Center, Miami University of Ohio, June 2011
The home is the lowest cost setting in which to provide care, and is preferred by consumers and families
17
|
|
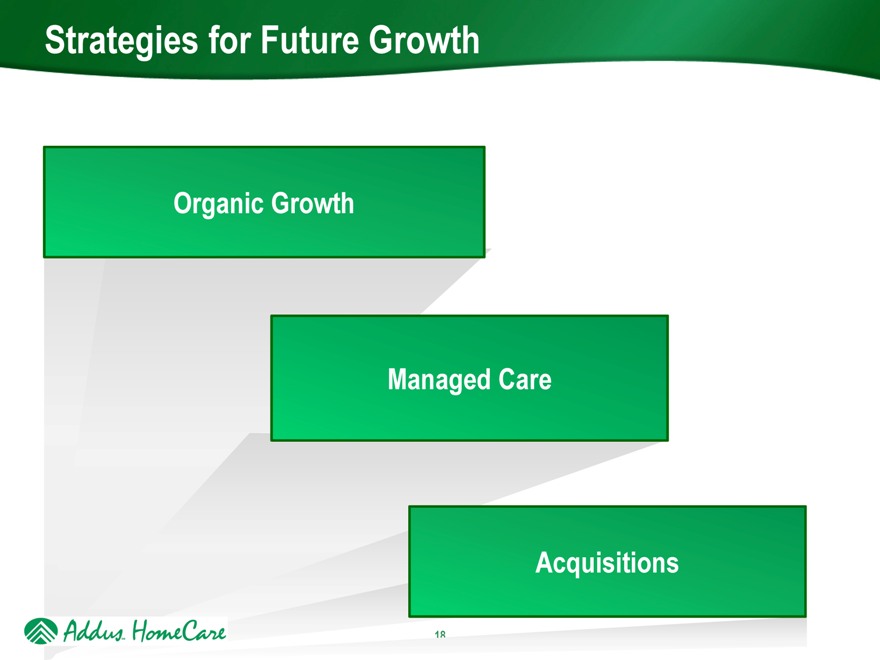
Strategies for Future Growth
Organic Growth
Managed Care
Acquisitions
18
|
|
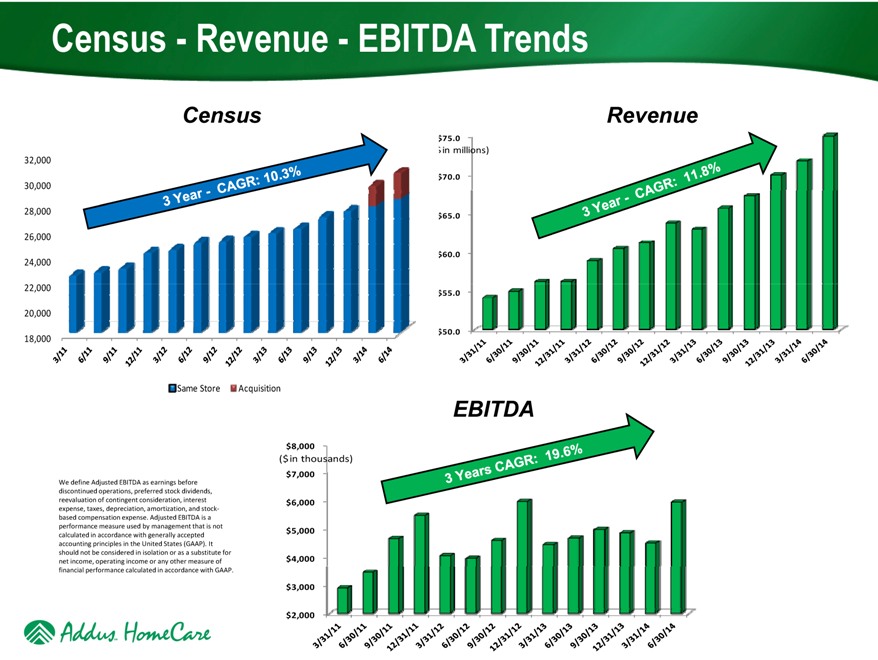
Census—Revenue—EBITDA Trends
Census
32,000
30,000
28,000
26,000
24,000
22,000
20,000
18,000
Same Store Acquisition
Revenue
$75.0
in millions)
$70.0
$65.0
$60.0
$55.0
$50.0
EBITDA
$8,000
($ in thousands)
$7,000
$6,000
$5,000
$4,000
$3,000
$2,000
We define Adjusted EBITDA as earnings before discontinued operations, preferred stock dividends, reevaluation of contingent consideration, interest expense, taxes, depreciation, amortization, and stockbased compensation expense. Adjusted EBITDA is a performance measure used by management that is not calculated in accordance with generally accepted accounting principles in the United States (GAAP). It should not be considered in isolation or as a substitute for net income, operating income or any other measure of financial performance calculated in accordance with GAAP.
|
|
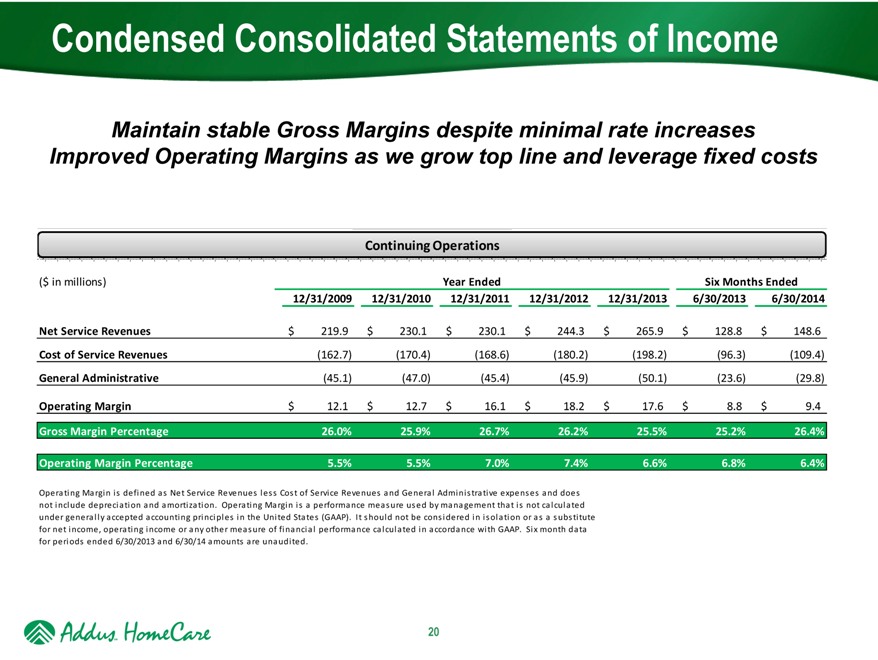
Condensed Consolidated Statements of Income
Maintain stable Gross Margins despite minimal rate increases Improved Operating Margins as we grow top line and leverage fixed costs
Continuing Operations
($ in millions) Year Ended Six Months Ended
12/31/2009 12/31/2010 12/31/2011 12/31/2012 12/31/2013 6/30/2013 6/30/2014
Net Service Revenues $ 219.9 $ 230.1 $ 230.1 $ 244.3 $ 265.9 $ 128.8 $ 148.6
Cost of Service Revenues (162.7) (170.4) (168.6) (180.2) (198.2) (96.3) (109.4)
General Administrative (45.1) (47.0) (45.4) (45.9) (50.1) (23.6) (29.8)
Operating Margin $ 12.1 $ 12.7 $ 16.1 $ 18.2 $ 17.6 $ 8.8 $ 9.4
Gross Margin Percentage 26.0% 25.9% 26.7% 26.2% 25.5% 25.2% 26.4%
Operating Margin Percentage 5.5% 5.5% 7.0% 7.4% 6.6% 6.8% 6.4%
Operating Margin is defined as Net Service Revenues less Cost of Service Revenues and General Administrative expenses and does not include depreciation and amortization. Operating Margin is a performance measure used by management that is not calculated under generally accepted accounting principles in the United States (GAAP). It should not be considered in isolation or as a substitute for net income, operating income or any other measure of financial performance calculated in accordance with GAAP. Six month data for periods ended 6/30/2013 and 6/30/14 amounts are unaudited.
20
|
|
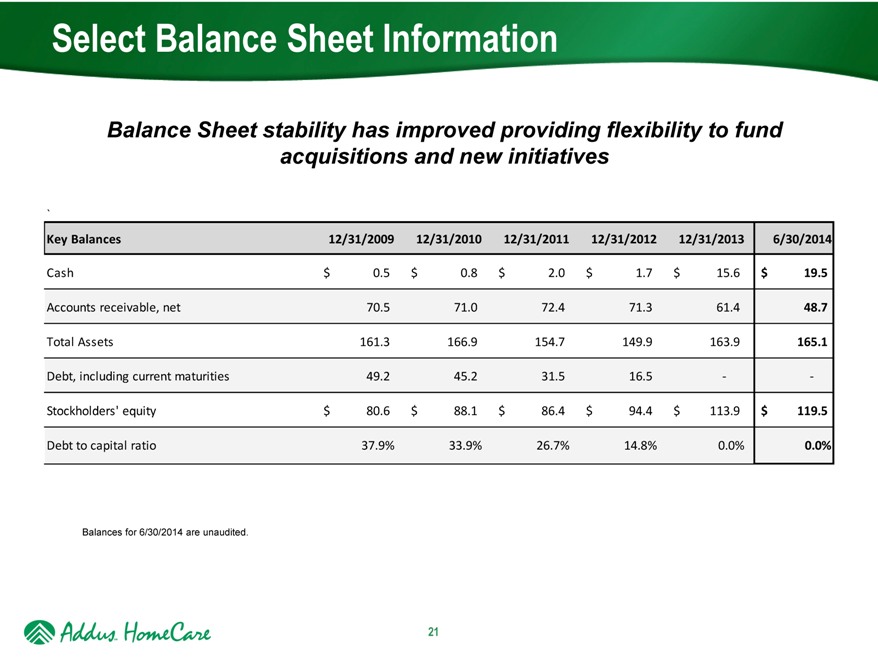
Select Balance Sheet Information
Balance Sheet stability has improved providing flexibility to fund acquisitions and new initiatives
`
Key Balances 12/31/2009 12/31/2010 12/31/2011 12/31/2012 12/31/2013 6/30/2014
Cash $ 0.5 $ 0.8 $ 2.0 $ 1.7 $ 15.6 $ 19.5
Accounts receivable, net 70.5 71.0 72.4 71.3 61.4 48.7
Total Assets 161.3 166.9 154.7 149.9 163.9 165.1
Debt, including current maturities 49.2 45.2 31.5 16.5
Stockholders’ equity $ 80.6 $ 88.1 $ 86.4 $ 94.4 $ 113.9 $ 119.5
Debt to capital ratio 37.9% 33.9% 26.7% 14.8% 0.0% 0.0%
Balances for 6/30/2014 are unaudited.
21
|
|
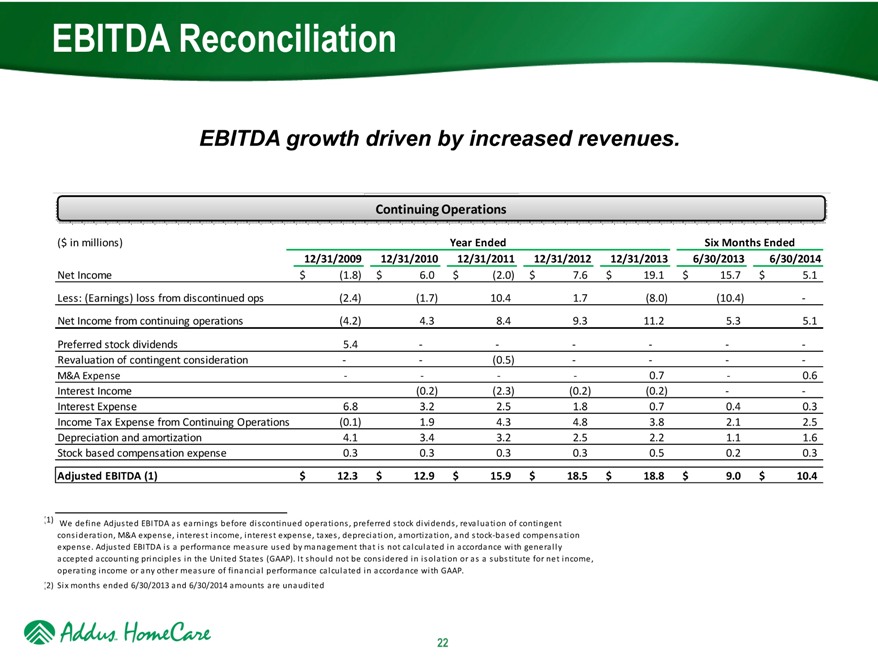
EBITDA Reconciliation
EBITDA growth driven by increased revenues.
Continuing Operations
($ in millions) Year Ended Six Months Ended
12/31/2009 12/31/2010 12/31/2011 12/31/2012 12/31/2013 6/30/2013 6/30/2014
Net Income $ (1.8) $ 6.0 $ (2.0) $ 7.6 $ 19.1 $ 15.7 $ 5.1
Less: (Earnings) loss from discontinued ops (2.4) (1.7) 10.4 1.7 (8.0) (10.4)
Net Income from continuing operations (4.2) 4.3 8.4 9.3 11.2 5.3 5.1
Preferred stock dividends 5.4
Revaluation of contingent consideration (0.5)
M&A Expense 0.7 0.6
Interest Income (0.2) (2.3) (0.2) (0.2)
Interest Expense 6.8 3.2 2.5 1.8 0.7 0.4 0.3
Income Tax Expense from Continuing Operations (0.1) 1.9 4.3 4.8 3.8 2.1 2.5
Depreciation and amortization 4.1 3.4 3.2 2.5 2.2 1.1 1.6
Stock based compensation expense 0.3 0.3 0.3 0.3 0.5 0.2 0.3
Adjusted EBITDA (1) $ 12.3 $ 12.9 $ 15.9 $ 18.5 $ 18.8 $ 9.0 $ 10.4
| (1) |
|
We define Adjusted EBITDA as earnings before discontinued operations, preferred stock dividends, revaluation of contingent consideration, M&A expense, interest income, interest expense, taxes, depreciation, amortization, and stock based compensation expense. Adjusted EBITDA is a performance measure used by management that is not calculated in accordance with generally accepted accounting principles in the United States (GAAP). It should not be considered in isolation or as a substitute for net income, operating income or any other measure of financial performance calculated in accordance with GAAP.
| (2) |
|
Six months ended 6/30/2013 and 6/30/2014 amounts are unaudited |
22
|
|

Strategies for Future Growth
Organic Growth
Managed Care
Acquisitions
23