Attached files
| file | filename |
|---|---|
| EX-31.01 - EXHIBIT 31.01 - 180 DEGREE CAPITAL CORP. /NY/ | v386187_ex31-01.htm |
| EX-31.02 - EXHIBIT 31.02 - 180 DEGREE CAPITAL CORP. /NY/ | v386187_ex31-02.htm |
| EX-32 - EXHIBIT 32 - 180 DEGREE CAPITAL CORP. /NY/ | v386187_ex32.htm |
UNITED STATES
SECURITIES AND EXCHANGE COMMISSION
WASHINGTON, D. C. 20549
Form 10-Q
x QUARTERLY REPORT PURSUANT TO SECTION 13 OR 15(d) OF THE SECURITIES EXCHANGE ACT OF 1934
For the quarterly period ended June 30, 2014
¨ TRANSITION REPORT PURSUANT TO SECTION 13 OR 15(d) OF THE SECURITIES EXCHANGE ACT OF 1934
For the transition period from ____________ to _____________
Commission file number: 0-11576
HARRIS & HARRIS GROUP, INC.
(Exact Name of Registrant as Specified in Its Charter)
| New York | 13-3119827 | |
| (State or Other Jurisdiction of | (I.R.S. Employer Identification No.) | |
| Incorporation or Organization) |
| 1450 Broadway, New York, New York | 10018 | |
| (Address of Principal Executive Offices) | (Zip Code) |
(212) 582-0900
(Registrant's Telephone Number, Including Area Code)
Indicate by check mark whether the registrant: (1) has filed all reports required to be filed by Section 13 or 15(d) of the Securities Exchange Act of 1934 during the preceding 12 months (or for such shorter period that the registrant was required to file such reports), and (2) has been subject to such filing requirements for the past 90 days.
Yes x No ¨
Indicate by check mark whether the registrant has submitted electronically and posted on its corporate Web site, if any, every Interactive Data File required to be submitted and posted pursuant to Rule 405 of Regulation S-T during the preceding 12 months (or for such shorter period that the registrant was required to submit and post such files).
Yes ¨ No ¨
Indicate by check mark whether the registrant is a large accelerated filer, an accelerated filer, a non-accelerated filer, or a smaller reporting company. See the definitions of "large accelerated filer," "accelerated filer" and "smaller reporting company" in Rule 12b-2 of the Exchange Act. (Check one):
| Large accelerated filer ¨ | Accelerated filer x |
| Non-accelerated filer ¨ | Smaller reporting company ¨ |
| (Do not check if a smaller reporting company) |
Indicate by check mark whether the registrant is a shell company (as defined in Rule 12b-2 of the Exchange Act).
Yes ¨ No x
Indicate the number of shares outstanding of each of the issuer's classes of common stock, as of the latest practicable date.
| Class | Outstanding at August 8, 2014 | |
| Common Stock, $0.01 par value per share | 31,245,664 shares |
Harris & Harris Group, Inc.
Form 10-Q, June 30, 2014
Item 1. Consolidated Financial Statements
In the opinion of management, these financial statements reflect all adjustments, consisting of valuation adjustments and normal recurring accruals, necessary for a fair statement of our financial position, results of operations and cash flows for such periods.
Harris & Harris Group, Inc.® (the "Company," "us," "our" and "we"), is an internally managed, non-diversified management investment company that has elected to operate as a business development company ("BDC") under the Investment Company Act of 1940 (the "1940 Act"). Certain information and disclosures normally included in the consolidated financial statements in accordance with accounting principles generally accepted in the United States of America ("GAAP") have been condensed or omitted as permitted by Regulation S-X and Regulation S-K. Accordingly, they do not include all information and disclosures necessary for a fair presentation of our financial position, results of operations and cash flows in conformity with GAAP. The results of operations for any interim period are not necessarily indicative of the results for the full year. The accompanying consolidated financial statements should be read in conjunction with the audited consolidated financial statements and notes thereto contained in our Annual Report on Form 10-K for the year ended December 31, 2013.
| 1 |
|
CONSOLIDATED STATEMENTS OF ASSETS AND LIABILITIES (Unaudited) |
| June 30, 2014 | December 31, 2013 | |||||||
| ASSETS | ||||||||
| Investments, in portfolio securities at value: | ||||||||
| Unaffiliated privately held companies (cost: $23,151,547 and $29,277,213, respectively) | $ | 16,316,588 | $ | 29,199,564 | ||||
| Unaffiliated rights to milestone payments (adjusted cost basis: $3,921,420 and $3,291,750, respectively) | 4,127,104 | 3,489,433 | ||||||
| Unaffiliated publicly traded securities (cost: $1,741,128 and $2,451,410, respectively) | 3,136,045 | 5,570,796 | ||||||
| Non-controlled affiliated privately held companies (cost: $76,518,770 and $71,843,448, respectively) | 70,276,348 | 54,287,040 | ||||||
| Controlled affiliated privately held companies (cost: $9,636,633 and $9,065,972, respectively) | 2,266,746 | 1,352,626 | ||||||
| Total, investments in private portfolio companies, rights to milestone payments and public securities at value (cost: $114,969,498 and $115,929,793, respectively) | $ | 96,122,831 | $ | 93,899,459 | ||||
| Investments, in U.S. Treasury securities at value (cost: $0 and $18,999,765, respectively) | 0 | 18,999,810 | ||||||
| Cash | 24,676,324 | 8,538,548 | ||||||
| Receivable from sales of investments (Note 3) | 0 | 448,886 | ||||||
| Funds held in escrow from sales of investments at value (Note 3) | 1,447,933 | 1,786,390 | ||||||
| Receivable from portfolio company | 54,485 | 54,160 | ||||||
| Interest receivable | 21,602 | 22,804 | ||||||
| Prepaid expenses (Note 3) | 751,375 | 991,409 | ||||||
| Other assets | 299,305 | 322,480 | ||||||
| Total assets | $ | 123,373,855 | $ | 125,063,946 | ||||
| LIABILITIES & NET ASSETS | ||||||||
| Post retirement plan liabilities (Note 8) | $ | 1,152,671 | $ | 1,120,262 | ||||
| Accounts payable and accrued liabilities | 964,753 | 785,608 | ||||||
| Deferred rent | 330,708 | 353,001 | ||||||
| Written call options payable (premiums received: $145,426 and $112,382, respectively) (Note 7) | 47,500 | 103,500 | ||||||
| Total liabilities | 2,495,632 | 2,362,371 | ||||||
| Net assets | $ | 120,878,223 | $ | 122,701,575 | ||||
| Net assets are comprised of: | ||||||||
| Preferred stock, $0.10 par value, 2,000,000 shares authorized; none issued | $ | 0 | $ | 0 | ||||
| Common stock, $0.01 par value, 45,000,000 shares authorized at 6/30/14 and 12/31/13; 33,074,404 and 33,026,178 issued at 6/30/14 and 12/31/13, respectively | 330,744 | 330,262 | ||||||
| Additional paid in capital (Note 9) | 214,748,521 | 214,320,241 | ||||||
| Accumulated net operating and realized loss | (72,869,464 | ) | (67,449,176 | ) | ||||
| Accumulated unrealized depreciation of investments | (18,748,741 | ) | (22,021,407 | ) | ||||
| Accumulated other comprehensive income (Note 8) | 822,694 | 927,186 | ||||||
| Treasury stock, at cost (1,828,740 shares at 6/30/14 and 12/31/13) | (3,405,531 | ) | (3,405,531 | ) | ||||
| Net assets | $ | 120,878,223 | $ | 122,701,575 | ||||
| Shares outstanding | 31,245,664 | 31,197,438 | ||||||
| Net asset value per outstanding share | $ | 3.87 | $ | 3.93 | ||||
The accompanying unaudited notes are an integral part of these consolidated financial statements.
| 2 |
|
CONSOLIDATED STATEMENTS OF OPERATIONS (Unaudited) |
| Three Months Ended June 30, | Six Months Ended June 30, | |||||||||||||||
| 2014 | 2013 | 2014 | 2013 | |||||||||||||
| Investment income: | ||||||||||||||||
| Interest from: | ||||||||||||||||
| Unaffiliated companies | $ | 36,447 | $ | 56,851 | $ | 86,682 | $ | 131,846 | ||||||||
| Non-controlled affiliated companies | 41,095 | 22,207 | 83,371 | 37,512 | ||||||||||||
| Controlled affiliated companies | 36,607 | 62,390 | 71,333 | 109,194 | ||||||||||||
| Cash and U.S. Treasury securities and other | 2,929 | 3,374 | 6,478 | 9,033 | ||||||||||||
| Miscellaneous income | 16,757 | 45,141 | 32,262 | 87,468 | ||||||||||||
| Total investment income | 133,835 | 189,963 | 280,126 | 375,053 | ||||||||||||
| Expenses: | ||||||||||||||||
| Salaries, benefits and stock-based compensation (Note 9) | 1,247,426 | 1,442,714 | 2,659,786 | 2,760,399 | ||||||||||||
| Administration and operations | 206,960 | 169,950 | 337,440 | 304,042 | ||||||||||||
| Professional fees | 385,352 | 277,138 | 597,223 | 662,868 | ||||||||||||
| Interest and other debt expenses | 94,276 | 5,874 | 187,996 | 11,705 | ||||||||||||
| Directors’ fees and expenses | 93,131 | 58,406 | 186,408 | 130,876 | ||||||||||||
| Rent | 80,065 | 101,486 | 148,091 | 202,701 | ||||||||||||
| Insurance expense | 84,007 | 96,180 | 167,940 | 172,303 | ||||||||||||
| Custody fees | 14,228 | 13,981 | 29,019 | 27,774 | ||||||||||||
| Depreciation | 13,245 | 14,172 | 26,450 | 27,896 | ||||||||||||
| Total expenses | 2,218,690 | 2,179,901 | 4,340,353 | 4,300,564 | ||||||||||||
| Net operating loss | (2,084,855 | ) | (1,989,938 | ) | (4,060,227 | ) | (3,925,511 | ) | ||||||||
| Net realized gain (loss): | ||||||||||||||||
| Realized gain (loss) from investments: | ||||||||||||||||
| Unaffiliated companies | 3,946,838 | 105,313 | 3,946,838 | 105,313 | ||||||||||||
| Non-Controlled affiliated companies | 588,221 | 0 | (6,711,063 | ) | (4,236,033 | ) | ||||||||||
| Publicly traded companies | 960,882 | 7,651,057 | 1,333,497 | 8,544,061 | ||||||||||||
| Written call options | 197,309 | (150,710 | ) | 86,653 | (126,762 | ) | ||||||||||
| Purchased put options | 0 | (15,127 | ) | 0 | (72,209 | ) | ||||||||||
| Realized gain (loss) from investments | 5,693,250 | 7,590,533 | (1,344,075 | ) | 4,214,370 | |||||||||||
| Income tax expense (Note 10) | 0 | 161 | 15,986 | 22,171 | ||||||||||||
| Net realized gain (loss) from investments | 5,693,250 | 7,590,372 | (1,360,061 | ) | 4,192,199 | |||||||||||
| Net decrease (increase) in unrealized depreciation on investments: | ||||||||||||||||
| Investments | 796,969 | (1,095,489 | ) | 3,183,622 | 2,052,705 | |||||||||||
| Written call options | (77,309 | ) | (400,184 | ) | 89,044 | (274,824 | ) | |||||||||
| Net decrease (increase) in unrealized depreciation on investments | 719,660 | (1,495,673 | ) | 3,272,666 | 1,777,881 | |||||||||||
| Net realized and unrealized gains on investments | 6,412,910 | 6,094,699 | 1,912,605 | 5,970,080 | ||||||||||||
| Net increase (decrease) in net assets resulting from operations: | ||||||||||||||||
| Total | $ | 4,328,055 | $ | 4,104,761 | $ | (2,147,622 | ) | $ | 2,044,569 | |||||||
| Per average basic and diluted outstanding share | $ | 0.14 | $ | 0.13 | $ | (0.07 | ) | $ | 0.07 | |||||||
| Average outstanding shares | 31,201,574 | 31,118,358 | 31,199,518 | 31,117,624 | ||||||||||||
The accompanying unaudited notes are an integral part of these consolidated financial statements.
| 3 |
|
CONSOLIDATED STATEMENTS OF COMPREHENSIVE INCOME (LOSS) (Unaudited) |
| Three Months Ended June 30, | Six Months Ended June 30, | |||||||||||||||
| 2014 | 2013 | 2014 | 2013 | |||||||||||||
| Net increase (decrease) resulting from operations | $ | 4,328,055 | $ | 4,104,761 | $ | (2,147,622 | ) | $ | 2,044,569 | |||||||
| Other comprehensive income (loss): | ||||||||||||||||
| Prior service cost (Note 8) | 0 | 0 | 0 | 1,101,338 | ||||||||||||
| Amortization of prior service cost | (52,246 | ) | (43,538 | ) | (104,492 | ) | (87,076 | ) | ||||||||
| Other comprehensive (loss) income | (52,246 | ) | (43,538 | ) | (104,492 | ) | 1,014,262 | |||||||||
| Comprehensive income (loss) | $ | 4,275,809 | $ | 4,061,223 | $ | (2,252,114 | ) | $ | 3,058,831 | |||||||
The accompanying unaudited notes are an integral part of these consolidated financial statements.
| 4 |
|
CONSOLIDATED STATEMENTS OF CASH FLOWS (Unaudited) |
| Six Months Ended | Six Months Ended | |||||||
| June 30, 2014 | June 30, 2013 | |||||||
| Cash flows (used in) provided by operating activities: | ||||||||
| Net (decrease) increase in net assets resulting from operations | $ | (2,147,622 | ) | $ | 2,044,569 | |||
| Adjustments to reconcile net (decrease) increase in net assets resulting from operations to net cash provided by (used in) operating activities: | ||||||||
| Net realized gain and unrealized appreciation on investments | (1,928,591 | ) | (5,992,251 | ) | ||||
| Depreciation of fixed assets, amortization of premium or discount on U.S. government securities and prepaid assets and accretion of bridge note interest | (140,878 | ) | (138,475 | ) | ||||
| Stock-based compensation expense | 497,634 | 630,201 | ||||||
| Amortization of prior service cost | (104,492 | ) | 1,014,262 | |||||
| Purchase of U.S. government securities | (19,999,044 | ) | (55,998,943 | ) | ||||
| Sale of U.S. government securities | 38,998,052 | 56,000,000 | ||||||
| Purchase of affiliated portfolio companies | (9,714,299 | ) | (6,429,843 | ) | ||||
| Purchase of unaffiliated portfolio companies | (240,500 | ) | (678,307 | ) | ||||
| Payments received on debt investments | 224,711 | 627,773 | ||||||
| Proceeds from sale of investments and conversion of bridge notes | 9,766,197 | 13,161,839 | ||||||
| Proceeds from call option premiums | 338,229 | 844,498 | ||||||
| Payments for put and call option purchases | (218,532 | ) | (309,578 | ) | ||||
| Changes in assets and liabilities: | ||||||||
| Receivable from sales of investments | 448,886 | (3,783,586 | ) | |||||
| Restricted funds | 0 | (10 | ) | |||||
| Receivable from portfolio company | (325 | ) | 19,670 | |||||
| Interest receivable | 1,202 | 32,942 | ||||||
| Prepaid expenses | 240,034 | (143,923 | ) | |||||
| Other assets | (2,209 | ) | 0 | |||||
| Post retirement plan liabilities | 32,409 | (1,050,365 | ) | |||||
| Accounts payable and accrued liabilities | 179,145 | 50,120 | ||||||
| Deferred rent | (22,293 | ) | (18,959 | ) | ||||
| Net cash provided by (used in) operating activities | 16,207,714 | (118,366 | ) | |||||
| Cash flows from investing activities: | ||||||||
| Purchase of fixed assets | (1,066 | ) | (3,909 | ) | ||||
| Net cash used in investing activities | (1,066 | ) | (3,909 | ) | ||||
| Cash flows from financing activities: | ||||||||
| Payment of withholdings related to net settlement of restricted stock | (68,872 | ) | (61,917 | ) | ||||
| Net cash used in financing activities | (68,872 | ) | (61,917 | ) | ||||
| Net increase (decrease) in cash | $ | 16,137,776 | $ | (184,192 | ) | |||
| Cash at beginning of the period | 8,538,548 | 8,379,111 | ||||||
| Cash at end of the period | $ | 24,676,324 | $ | 8,194,919 | ||||
| Supplemental disclosures of cash flow information: | ||||||||
| Income taxes paid | $ | 15,986 | $ | 22,171 | ||||
| Supplemental schedule of non-cash activities: | ||||||||
| Impact of plan amendment on post-retirement plan liabilities | $ | (104,492 | ) | $ | 1,014,262 | |||
The accompanying unaudited notes are an integral part of these consolidated financial statements.
| 5 |
|
CONSOLIDATED STATEMENTS OF CHANGES IN NET ASSETS (Unaudited) |
| Six Months Ended | Year Ended | |||||||
| June 30, 2014 | December 31, 2013 | |||||||
| Changes in net assets from operations: | ||||||||
| Net operating loss | $ | (4,060,227 | ) | $ | (8,022,206 | ) | ||
| Net realized (loss) gain on investments | (1,360,061 | ) | 18,516,268 | |||||
| Net decrease (increase) in unrealized depreciation on investments | 3,183,622 | (18,284,402 | ) | |||||
| Net increase in unrealized appreciation on written call options | 89,044 | 1,382 | ||||||
| Net decrease in net assets resulting from operations | (2,147,622 | ) | (7,788,958 | ) | ||||
| Changes in net assets from capital stock transactions: | ||||||||
| Acquisition of vested restricted stock awards to pay required employee withholding tax | (68,872 | ) | (123,183 | ) | ||||
| Stock-based compensation expense | 497,634 | 1,249,756 | ||||||
| Net increase in net assets resulting from capital stock transactions | 428,762 | 1,126,573 | ||||||
| Changes in net assets from accumulated other comprehensive income: | ||||||||
| Other comprehensive (loss) income | (104,492 | ) | 927,186 | |||||
| Net (decrease) increase in net assets resulting from accumulated other comprehensive income | (104,492 | ) | 927,186 | |||||
| Net decrease in net assets | (1,823,352 | ) | (5,735,199 | ) | ||||
| Net Assets: | ||||||||
| Beginning of the period | 122,701,575 | 128,436,774 | ||||||
| End of the period | $ | 120,878,223 | $ | 122,701,575 | ||||
The accompanying unaudited notes are an integral part of these consolidated financial statements.
| 6 |
|
CONSOLIDATED SCHEDULE OF INVESTMENTS AS OF JUNE 30, 2014 (Unaudited) |
| Method of | Primary | Shares/ | ||||||||||||||
| Valuation (1) | Industry (2) | Cost | Principal | Value | ||||||||||||
| Investments in Unaffiliated Companies (3) – | ||||||||||||||||
| 19.5% of net assets at value | ||||||||||||||||
| Private Placement Portfolio (Illiquid) (4) – | ||||||||||||||||
| 13.5% of net assets at value | ||||||||||||||||
| Bridgelux, Inc. (5)(8)(10) | Energy | |||||||||||||||
| Manufacturing high-power light emitting | ||||||||||||||||
| diodes (LEDs) and arrays | ||||||||||||||||
| Series B Convertible Preferred Stock | (M) | $ | 1,000,000 | 1,861,504 | $ | 330,208 | ||||||||||
| Series C Convertible Preferred Stock | (M) | 1,352,196 | 2,130,699 | 377,961 | ||||||||||||
| Series D Convertible Preferred Stock | (M) | 1,371,622 | 999,999 | 1,152,335 | ||||||||||||
| Series E Convertible Preferred Stock | (M) | 672,599 | 440,334 | 707,435 | ||||||||||||
| Series E-1 Convertible Preferred Stock | (M) | 386,073 | 399,579 | 471,034 | ||||||||||||
| Warrants for Series C Convertible Preferred | ||||||||||||||||
| Stock expiring 12/31/14 | ( I ) | 168,270 | 163,900 | 540 | ||||||||||||
| Warrants for Series D Convertible Preferred | ||||||||||||||||
| Stock expiring 8/26/14 | ( I ) | 88,531 | 124,999 | 11,416 | ||||||||||||
| Warrants for Series D Convertible Preferred | ||||||||||||||||
| Stock expiring 3/10/15 | ( I ) | 40,012 | 41,666 | 12,502 | ||||||||||||
| Warrants for Series E Convertible Preferred | ||||||||||||||||
| Stock expiring 12/31/17 | ( I ) | 93,969 | 170,823 | 181,791 | ||||||||||||
| Warrants for Common Stock expiring 6/1/16 | ( I ) | 72,668 | 132,100 | 928 | ||||||||||||
| Warrants for Common Stock expiring 8/9/18 | ( I ) | 148,409 | 171,183 | 12,726 | ||||||||||||
| Warrants for Common Stock expiring 10/21/18 | ( I ) | 18,816 | 84,846 | 3,140 | ||||||||||||
| 5,413,165 | 3,262,016 | |||||||||||||||
| Cambrios Technologies Corporation (5)(8)(10) | Electronics | |||||||||||||||
| Developing nanowire-enabled electronic | ||||||||||||||||
| materials for the display industry | ||||||||||||||||
| Series B Convertible Preferred Stock | (M) | 1,294,025 | 1,294,025 | 790,475 | ||||||||||||
| Series C Convertible Preferred Stock | (M) | 1,300,000 | 1,300,000 | 794,126 | ||||||||||||
| Series D Convertible Preferred Stock | (M) | 515,756 | 515,756 | 709,165 | ||||||||||||
| Series D-2 Convertible Preferred Stock | (M) | 92,400 | 92,400 | 80,850 | ||||||||||||
| Series D-4 Convertible Preferred Stock | (M) | 216,168 | 216,168 | 189,147 | ||||||||||||
| 3,418,349 | 2,563,763 | |||||||||||||||
| Cobalt Technologies, Inc. (5)(8)(9)(10)(11) | Energy | |||||||||||||||
| Developing processes for making bio- | ||||||||||||||||
| butanol through biomass fermentation | ||||||||||||||||
| Series C-1 Convertible Preferred Stock | (M) | 749,998 | 352,112 | 469,577 | ||||||||||||
| Series D-1 Convertible Preferred Stock | (M) | 122,070 | 48,828 | 70,771 | ||||||||||||
| Series E-1 Convertible Preferred Stock | (M) | 114,938 | 46,089 | 56,424 | ||||||||||||
| Warrants for Series E-1 Pref. Stock expiring on 10/9/22 | ( I ) | 2,781 | 1,407 | 1,440 | ||||||||||||
| Warrants for Series E-1 Pref. Stock expiring on 3/11/23 | ( I ) | 5,355 | 2,707 | 2,813 | ||||||||||||
| 995,142 | 601,025 | |||||||||||||||
The accompanying unaudited notes are an integral part of these consolidated financial statements.
| 7 |
|
HARRIS & HARRIS GROUP, INC. CONSOLIDATED SCHEDULE OF INVESTMENTS AS OF JUNE 30, 2014 (Unaudited) |
| Method of | Primary | Shares/ | ||||||||||||||
| Valuation (1) | Industry (2) | Cost | Principal | Value | ||||||||||||
| Investments in Unaffiliated Companies (3) – | ||||||||||||||||
| 19.5% of net assets at value (Cont.) | ||||||||||||||||
| Private Placement Portfolio (Illiquid) (4) – | ||||||||||||||||
| 13.5% of net assets at value (Cont.) | ||||||||||||||||
| GEO Semiconductor Inc. (5) | Electronics | |||||||||||||||
| Developing programmable, high-performance | ||||||||||||||||
| video and geometry processing solutions | ||||||||||||||||
| Participation Agreement with Montage | ||||||||||||||||
| Capital relating to the following assets: | ||||||||||||||||
| Warrants for Series A Pref. Stock expiring on 9/17/17 | ( I ) | $ | 66,684 | 100,000 | $ | 97,724 | ||||||||||
| Warrants for Series A-1 Pref. Stock expiring on 6/30/18 | ( I ) | 23,566 | 34,500 | 37,601 | ||||||||||||
| Loan and Security Agreement with GEO Semiconductor | ||||||||||||||||
| relating to the following assets: | ||||||||||||||||
| Warrants for Series A Pref. Stock expiring on 3/1/18 | ( I ) | 7,512 | 10,000 | 9,227 | ||||||||||||
| Warrants for Series A-1 Pref. Stock expiring on 6/29/18 | ( I ) | 7,546 | 10,000 | 9,461 | ||||||||||||
| 105,308 | 154,013 | |||||||||||||||
| Mersana Therapeutics, Inc. (5)(8)(9)(10)(12) | Life Sciences | |||||||||||||||
| Developing antibody drug conjugates | ||||||||||||||||
| for cancer therapy | ||||||||||||||||
| Series A-1 Convertible Preferred Stock | (M) | 683,538 | 635,081 | 683,538 | ||||||||||||
| Common Stock | (M) | 3,875,395 | 350,539 | 108,667 | ||||||||||||
| 4,558,933 | 792,205 | |||||||||||||||
| Molecular Imprints, Inc. (5)(8)(10)(13) | Electronics | |||||||||||||||
| Manufacturing nanoimprint lithography | ||||||||||||||||
| capital equipment for non-semiconductor | ||||||||||||||||
| manufacturing markets | ||||||||||||||||
| Series A Convertible Preferred Stock | (M) | 928,884 | 928,884 | 928,884 | ||||||||||||
| Nanosys, Inc. (5)(8) | Energy | |||||||||||||||
| Developing inorganic nanowires and | ||||||||||||||||
| quantum dots for use in LED-backlit devices | ||||||||||||||||
| Series C Convertible Preferred Stock | (M) | 1,500,000 | 803,428 | 977,659 | ||||||||||||
| Series D Convertible Preferred Stock | (M) | 3,000,003 | 1,016,950 | 2,014,088 | ||||||||||||
| Series E Convertible Preferred Stock | (M) | 496,573 | 433,688 | 661,331 | ||||||||||||
| Unsecured Convertible Bridge Note, 4%, acquired 7/16/12 | (M) | 47,255 | $ | 43,821 | 123,080 | |||||||||||
| 5,043,831 | 3,776,158 | |||||||||||||||
The accompanying unaudited notes are an integral part of these consolidated financial statements.
| 8 |
|
HARRIS & HARRIS GROUP, INC. CONSOLIDATED SCHEDULE OF INVESTMENTS AS OF JUNE 30, 2014 (Unaudited) |
| Method of | Primary | Shares/ | ||||||||||||||
| Valuation (1) | Industry (2) | Cost | Principal | Value | ||||||||||||
| Investments in Unaffiliated Companies (3) – | ||||||||||||||||
| 19.5% of net assets at value (Cont.) | ||||||||||||||||
| Private Placement Portfolio (Illiquid) (4) – | ||||||||||||||||
| 13.5% of net assets at value (Cont.) | ||||||||||||||||
| Nano Terra, Inc. (5)(9) | Energy | |||||||||||||||
| Developing surface chemistry and nano- | ||||||||||||||||
| manufacturing solutions | ||||||||||||||||
| Senior secured debt, 12.0%, maturing on 12/1/15 | ( I ) | $ | 525,012 | $ | 560,415 | $ | 554,400 | |||||||||
| Warrants for Series A-2 Pref. Stock expiring on 2/22/21 | ( I ) | 69,168 | 446,248 | 21,125 | ||||||||||||
| Warrants for Series C Pref. Stock expiring on 11/15/22 | ( I ) | 35,403 | 241,662 | 88,979 | ||||||||||||
| 629,583 | 664,504 | |||||||||||||||
| Nantero, Inc. (5)(8)(9)(10) | Electronics | |||||||||||||||
| Developing a high-density, nonvolatile, | ||||||||||||||||
| random access memory chip, enabled | ||||||||||||||||
| by carbon nanotubes | ||||||||||||||||
| Series A Convertible Preferred Stock | (M) | 489,999 | 345,070 | 1,349,224 | ||||||||||||
| Series B Convertible Preferred Stock | (M) | 323,000 | 207,051 | 809,569 | ||||||||||||
| Series C Convertible Preferred Stock | (M) | 571,329 | 188,315 | 736,312 | ||||||||||||
| Series D Convertible Preferred Stock | (M) | 139,075 | 35,569 | 139,075 | ||||||||||||
| 1,523,403 | 3,034,180 | |||||||||||||||
| OHSO Clean, Inc. (5)(14) | Life Sciences | |||||||||||||||
| Developing natural, hypoallergenic household | ||||||||||||||||
| cleaning products enabled by nanotechnology- | ||||||||||||||||
| enabled formulations of thyme oil | ||||||||||||||||
| Participation Agreement with Montage | ||||||||||||||||
| Capital relating to the following assets: | ||||||||||||||||
| Senior secured debt, 13.00%, maturing on 3/31/15 | ( I ) | 443,207 | $ | 552,640 | 523,840 | |||||||||||
| Warrants for Series C Pref. Stock expiring on 3/30/22 | ( I ) | 91,742 | 1,109,333 | 16,000 | ||||||||||||
| 534,949 | 539,840 | |||||||||||||||
| Total Unaffiliated Private Placement Portfolio (cost: $23,151,547) | $ | 16,316,588 | ||||||||||||||
The accompanying unaudited notes are an integral part of these consolidated financial statements.
| 9 |
|
HARRIS & HARRIS GROUP, INC. CONSOLIDATED SCHEDULE OF INVESTMENTS AS OF JUNE 30, 2014 (Unaudited) |
| Method of | Primary | Shares/ | ||||||||||||||
| Valuation (1) | Industry (2) | Cost | Principal | Value | ||||||||||||
| Rights to Milestone Payments (Illiquid) (6) – | ||||||||||||||||
| 3.4% of net assets at value | ||||||||||||||||
| Amgen, Inc. (8)(10) | Life Sciences | |||||||||||||||
| Rights to Milestone Payments from | ||||||||||||||||
| Acquisition of BioVex Group, Inc. | ( I ) | $ | 3,291,750 | $ | 3,291,750 | $ | 3,496,847 | |||||||||
| Laird Technologies, Inc. (8)(10) | Energy | |||||||||||||||
| Rights to Milestone Payments from Merger & | ||||||||||||||||
| Acquisition of Nextreme Thermal Solutions, Inc. | ( I ) | 0 | 0 | 0 | ||||||||||||
| Canon, Inc. (8)(10) | Electronics | |||||||||||||||
| Rights to Milestone Payments from | ||||||||||||||||
| Acquisition of Molecular Imprints, Inc. | ( I ) | 629,670 | $ | 629,670 | 630,257 | |||||||||||
| Total Unaffiliated Rights to Milestone Payments (cost: $3,921,420) | $ | 4,127,104 | ||||||||||||||
| Publicly Traded Portfolio (7) – | ||||||||||||||||
| 2.6% of net assets at value | ||||||||||||||||
| Solazyme, Inc. (5)(10)(15) | Energy | |||||||||||||||
| Developing algal biodiesel, industrial | ||||||||||||||||
| chemicals and specialty ingredients using | ||||||||||||||||
| synthetic biology | ||||||||||||||||
| Common Stock | (M) | $ | 118,099 | 50,000 | $ | 589,000 | ||||||||||
| Champions Oncology, Inc. (5)(10) | Life Sciences | |||||||||||||||
| Developing its TumorGraftTM platform for | ||||||||||||||||
| personalized medicine and drug development | ||||||||||||||||
| Common Stock | (M) | 1,622,629 | 2,523,895 | 2,523,895 | ||||||||||||
| Warrants for Common Stock expiring 1/29/18 | ( I ) | 400 | 40,000 | 23,150 | ||||||||||||
| 1,623,029 | 2,547,045 | |||||||||||||||
| Total Unaffiliated Publicly Traded Portfolio (cost: $1,741,128) | $ | 3,136,045 | ||||||||||||||
| Total Investments in Unaffiliated Companies (cost: $28,814,095) | $ | 23,579,737 | ||||||||||||||
The accompanying unaudited notes are an integral part of these consolidated financial statements.
| 10 |
|
HARRIS & HARRIS GROUP, INC. CONSOLIDATED SCHEDULE OF INVESTMENTS AS OF JUNE 30, 2014 (Unaudited) |
| Method of | Primary | Shares/ | ||||||||||||||
| Valuation (1) | Industry (2) | Cost | Principal | Value | ||||||||||||
| Investments in Non-Controlled | ||||||||||||||||
| Affiliated Companies (3) – | ||||||||||||||||
| 58.1% of net assets at value | ||||||||||||||||
| Private Placement Portfolio (Illiquid) (16) – | ||||||||||||||||
| 58.1% of net assets at value | ||||||||||||||||
| ABSMaterials, Inc. (5)(8)(9) | Energy | |||||||||||||||
| Developing nano-structured absorbent | ||||||||||||||||
| materials for environmental remediation | ||||||||||||||||
| Series A Convertible Preferred Stock | (M) | $ | 435,000 | 390,000 | $ | 471,900 | ||||||||||
| Series B Convertible Preferred Stock | (M) | 1,217,644 | 1,037,751 | 1,255,679 | ||||||||||||
| 1,652,644 | 1,727,579 | |||||||||||||||
| Adesto Technologies Corporation (5)(8)(17) | Electronics | |||||||||||||||
| Developing low-power, high-performance | ||||||||||||||||
| memory devices | ||||||||||||||||
| Series A Convertible Preferred Stock | (M) | 2,200,000 | 6,547,619 | 1,388,276 | ||||||||||||
| Series B Convertible Preferred Stock | (M) | 2,200,000 | 5,952,381 | 1,262,070 | ||||||||||||
| Series C Convertible Preferred Stock | (M) | 1,485,531 | 2,122,187 | 479,218 | ||||||||||||
| Series D Convertible Preferred Stock | (M) | 1,393,147 | 1,466,470 | 1,040,812 | ||||||||||||
| Series D-1 Convertible Preferred Stock | (M) | 703,740 | 987,706 | 561,291 | ||||||||||||
| Series E Convertible Preferred Stock | (M) | 2,499,999 | 3,508,771 | 9,969,781 | ||||||||||||
| 10,482,417 | 14,701,448 | |||||||||||||||
| AgBiome, LLC (formerly AgInnovation, LLC) (5)(8)(9)(10) | Life Sciences | |||||||||||||||
| Providing early stage research and discovery for | ||||||||||||||||
| agriculture and utilizing the crop microbiome to | ||||||||||||||||
| identify products that reduce risk and improve yield | ||||||||||||||||
| Series A-1 Convertible Preferred Stock | (M) | 2,000,000 | 2,000,000 | 2,456,834 | ||||||||||||
| Series A-2 Convertible Preferred Stock | (M) | 521,740 | 417,392 | 564,906 | ||||||||||||
| 2,521,740 | 3,021,740 | |||||||||||||||
| Contour Energy Systems, Inc. (5)(8)(9)(10) | Energy | |||||||||||||||
| Developing batteries using | ||||||||||||||||
| nano-structured materials | ||||||||||||||||
| Series A Convertible Preferred Stock | (M) | 2,009,995 | 2,565,798 | 0 | ||||||||||||
| Series B Convertible Preferred Stock | (M) | 1,300,000 | 812,500 | 0 | ||||||||||||
| Series C Convertible Preferred Stock | (M) | 1,200,000 | 1,148,325 | 0 | ||||||||||||
| 4,509,995 | 0 | |||||||||||||||
The accompanying unaudited notes are an integral part of these consolidated financial statements.
| 11 |
|
HARRIS & HARRIS GROUP, INC. CONSOLIDATED SCHEDULE OF INVESTMENTS AS OF JUNE 30, 2014 (Unaudited) |
| Method of | Primary | Shares/ | ||||||||||||||
| Valuation (1) | Industry (2) | Cost | Principal | Value | ||||||||||||
| Investments in Non-Controlled | ||||||||||||||||
| Affiliated Companies (3) – | ||||||||||||||||
| 58.1% of net assets at value (Cont.) | ||||||||||||||||
| Private Placement Portfolio (Illiquid) (16) – | ||||||||||||||||
| 58.1% of net assets at value (Cont.) | ||||||||||||||||
| D-Wave Systems, Inc. (8)(9)(18) | Electronics | |||||||||||||||
| Developing high-performance | ||||||||||||||||
| quantum computing systems | ||||||||||||||||
| Series 1 Class B Convertible Preferred Stock | (M) | $ | 1,002,074 | 1,144,869 | $ | 2,327,977 | ||||||||||
| Series 1 Class C Convertible Preferred Stock | (M) | 487,804 | 450,450 | 915,945 | ||||||||||||
| Series 1 Class D Convertible Preferred Stock | (M) | 748,473 | 855,131 | 1,738,823 | ||||||||||||
| Series 1 Class E Convertible Preferred Stock | (M) | 248,049 | 269,280 | 547,554 | ||||||||||||
| Series 1 Class F Convertible Preferred Stock | (M) | 238,323 | 258,721 | 526,083 | ||||||||||||
| Series 1 Class H Convertible Preferred Stock | (M) | 909,088 | 460,866 | 937,125 | ||||||||||||
| Series 2 Class D Convertible Preferred Stock | (M) | 736,019 | 678,264 | 1,379,182 | ||||||||||||
| Series 2 Class E Convertible Preferred Stock | (M) | 659,493 | 513,900 | 1,044,964 | ||||||||||||
| Series 2 Class F Convertible Preferred Stock | (M) | 633,631 | 493,747 | 1,003,985 | ||||||||||||
| Warrants for Common Stock expiring 6/30/15 | ( I ) | 98,644 | 153,890 | 71,258 | ||||||||||||
| Warrants for Common Stock expiring 5/12/19 | ( I ) | 26,357 | 20,415 | 10,721 | ||||||||||||
| 5,787,955 | 10,503,617 | |||||||||||||||
| EchoPixel, Inc. (5)(8)(9)(10) | Life Sciences | |||||||||||||||
| Developing algorithms and software to improve | ||||||||||||||||
| visualization of data for life science and | ||||||||||||||||
| healthcare applications | ||||||||||||||||
| Series Seed Convertible Preferred Stock | (M) | 1,250,000 | 4,194,630 | 1,250,000 | ||||||||||||
| Ensemble Therapeutics Corporation (5)(8)(9) | Life Sciences | |||||||||||||||
| Developing DNA-Programmed ChemistryTM | ||||||||||||||||
| for the discovery of new classes of therapeutics | ||||||||||||||||
| Series B Convertible Preferred Stock | (H) | 2,000,000 | 1,449,275 | 1,030,781 | ||||||||||||
| Series B-1 Convertible Preferred Stock | (H) | 679,754 | 492,575 | 2,719,014 | ||||||||||||
| 2,679,754 | 3,749,795 | |||||||||||||||
| Enumeral Biomedical Corp. (5)(8)(9)(19) | Life Sciences | |||||||||||||||
| Developing therapeutics and diagnostics | ||||||||||||||||
| through functional assaying of single cells | ||||||||||||||||
| Series A Convertible Preferred Stock | (M) | 1,026,832 | 957,038 | 908,635 | ||||||||||||
| Series A-1 Convertible Preferred Stock | (M) | 750,000 | 576,923 | 613,852 | ||||||||||||
| Series A-2 Convertible Preferred Stock | (M) | 1,050,001 | 724,138 | 859,395 | ||||||||||||
| Series B Convertible Preferred Stock | (M) | 1,000,000 | 470,588 | 818,471 | ||||||||||||
| Secured Convertible Bridge Note, 12%, acquired 2/3/14 | ( I ) | 204,766 | $ | 250,000 | 629,821 | |||||||||||
| Warrants for Common Stock expiring 2/2/24 | ( I ) | 57,567 | 231,481 | 138,876 | ||||||||||||
| 4,089,166 | 3,969,050 | |||||||||||||||
The accompanying unaudited notes are an integral part of these consolidated financial statements
| 12 |
|
HARRIS & HARRIS GROUP, INC. CONSOLIDATED SCHEDULE OF INVESTMENTS AS OF JUNE 30, 2014 (Unaudited) |
| Method of | Primary | Shares/ | ||||||||||||||
| Valuation (1) | Industry (2) | Cost | Principal | Value | ||||||||||||
| Investments in Non-Controlled | ||||||||||||||||
| Affiliated Companies (3) – | ||||||||||||||||
| 58.1% of net assets at value (Cont.) | ||||||||||||||||
| Private Placement Portfolio (Illiquid) (16) – | ||||||||||||||||
| 58.1% of net assets at value (Cont.) | ||||||||||||||||
| HZO, Inc. (5)(8)(9) | Electronics | |||||||||||||||
| Developing novel industrial coatings that | ||||||||||||||||
| protect electronics against damage from liquids | ||||||||||||||||
| Common Stock | (M) | $ | 666,667 | 405,729 | $ | 436,605 | ||||||||||
| Series I Convertible Preferred Stock | (M) | 5,709,835 | 2,266,894 | 8,144,723 | ||||||||||||
| Series II Convertible Preferred Stock | (M) | 2,000,003 | 539,710 | 2,255,610 | ||||||||||||
| 8,376,505 | 10,836,938 | |||||||||||||||
| Laser Light Engines, Inc. (5)(8)(9) | Energy | |||||||||||||||
| Manufacturing solid-state light sources for | ||||||||||||||||
| digital cinema and large-venue projection displays | ||||||||||||||||
| Series A Convertible Preferred Stock | ( I ) | 2,000,000 | 7,499,062 | 0 | ||||||||||||
| Series B Convertible Preferred Stock | ( I ) | 3,095,802 | 13,571,848 | 0 | ||||||||||||
| Secured Convertible Bridge Note, 12%, acquired 10/7/11 | ( I ) | 200,000 | $ | 200,000 | 0 | |||||||||||
| Secured Convertible Bridge Note, 12%, acquired 11/17/11 | ( I ) | 95,652 | $ | 95,652 | 0 | |||||||||||
| Secured Convertible Bridge Note, 12%, acquired 12/21/11 | ( I ) | 82,609 | $ | 82,609 | 0 | |||||||||||
| Secured Convertible Bridge Note, 12%, acquired 3/5/12 | ( I ) | 434,784 | $ | 434,784 | 0 | |||||||||||
| Secured Convertible Bridge Note, 12%, acquired 7/26/12 | ( I ) | 186,955 | $ | 186,955 | 0 | |||||||||||
| Secured Convertible Bridge Note, 20%, acquired 4/29/13 | ( I ) | 166,667 | $ | 166,667 | 0 | |||||||||||
| Secured Convertible Bridge Note, 20%, acquired 7/22/13 | ( I ) | 166,667 | $ | 166,667 | 0 | |||||||||||
| Secured Convertible Bridge Note, 10%, acquired 10/30/13 | ( I ) | 80,669 | $ | 80,669 | 0 | |||||||||||
| Secured Convertible Bridge Note, 10%, acquired 2/5/14 | ( I ) | 19,331 | $ | 19,331 | 0 | |||||||||||
| Secured Convertible Bridge Note, 10%, acquired 6/24/14 | ( I ) | 13,771 | $ | 13,745 | 13,771 | |||||||||||
| 6,542,907 | 13,771 | |||||||||||||||
| Metabolon, Inc. (5)(8)(10) | Life Sciences | |||||||||||||||
| Developing service and diagnostic products | ||||||||||||||||
| through the use of a metabolomics, or | ||||||||||||||||
| biochemical, profiling platform | ||||||||||||||||
| Series B Convertible Preferred Stock | (M) | 2,500,000 | 371,739 | 2,997,991 | ||||||||||||
| Series B-1 Convertible Preferred Stock | (M) | 706,214 | 148,696 | 1,199,196 | ||||||||||||
| Series C Convertible Preferred Stock | (M) | 1,000,000 | 1,000,000 | 2,756,500 | ||||||||||||
| Series D Convertible Preferred Stock | (M) | 1,499,999 | 835,882 | 2,304,109 | ||||||||||||
| Series E Convertible Preferred Stock | (M) | 1,225,000 | 444,404 | 1,225,000 | ||||||||||||
| Warrants for Series B-1 Convertible Preferred | ||||||||||||||||
| Stock expiring 3/25/15 | ( I ) | 293,786 | 74,348 | 172,233 | ||||||||||||
| 7,224,999 | 10,655,029 | |||||||||||||||
The accompanying unaudited notes are an integral part of these consolidated financial statements.
| 13 |
|
HARRIS & HARRIS GROUP, INC. CONSOLIDATED SCHEDULE OF INVESTMENTS AS OF JUNE 30, 2014 (Unaudited) |
| Method of | Primary | Shares/ | ||||||||||||||
| Valuation (1) | Industry (2) | Cost | Principal | Value | ||||||||||||
| Investments in Non-Controlled | ||||||||||||||||
| Affiliated Companies (3) – | ||||||||||||||||
| 58.1% of net assets at value (Cont.) | ||||||||||||||||
| Private Placement Portfolio (Illiquid) (16) – | ||||||||||||||||
| 58.1% of net assets at value (Cont.) | ||||||||||||||||
| OpGen, Inc. (8) | Life Sciences | |||||||||||||||
| Developing tools for genomic sequence | ||||||||||||||||
| assembly and analysis | ||||||||||||||||
| Series A Convertible Preferred Stock | (M) | $ | 610,017 | 610,017 | $ | 610,017 | ||||||||||
| Common Stock | (M) | 3,260,000 | 29,883 | 1,494 | ||||||||||||
| 3,870,017 | 611,511 | |||||||||||||||
| Produced Water Absorbents, Inc. (5)(8)(9) | Energy | |||||||||||||||
| Developing nano-structured absorbent materials | ||||||||||||||||
| for environmental remediation of contaminated | ||||||||||||||||
| water in the oil and gas industries | ||||||||||||||||
| Series A Convertible Preferred Stock | (M) | 1,000,000 | 1,000,000 | 187,500 | ||||||||||||
| Series B Convertible Preferred Stock | (M) | 1,496,865 | 5,987,460 | 2,390,004 | ||||||||||||
| Series B-2 Convertible Preferred Stock | (M) | 1,015,427 | 4,322,709 | 1,645,885 | ||||||||||||
| Series B-3 Convertible Preferred Stock | (M) | 978,641 | 3,914,564 | 1,562,570 | ||||||||||||
| Series C Convertible Preferred Stock | (M) | 1,000,268 | 2,667,380 | 923,584 | ||||||||||||
| Warrants for Series B-2 Preferred Stock expiring | ||||||||||||||||
| upon liquidation event | ( I ) | 65,250 | 300,000 | 73,557 | ||||||||||||
| 5,556,451 | 6,783,100 | |||||||||||||||
| Senova Systems, Inc. (5)(8)(9) | Life Sciences | |||||||||||||||
| Developing next-generation sensors to measure pH | ||||||||||||||||
| Series B Convertible Preferred Stock | (M) | 1,218,462 | 1,350,000 | 540,000 | ||||||||||||
| Series B-1 Convertible Preferred Stock | (M) | 1,083,960 | 2,759,902 | 1,103,960 | ||||||||||||
| Secured Convertible Bridge Note, 10%, acquired 6/25/14 | (M) | 250,411 | $ | 250,000 | 250,411 | |||||||||||
| Warrants for Series B Preferred Stock expiring 10/15/17 | ( I ) | 131,538 | 164,423 | 65,753 | ||||||||||||
| Warrants for Series B Preferred Stock expiring 4/24/18 | ( I ) | 20,000 | 25,000 | 9,997 | ||||||||||||
| 2,704,371 | 1,970,121 | |||||||||||||||
The accompanying unaudited notes are an integral part of these consolidated financial statements.
| 14 |
|
HARRIS & HARRIS GROUP, INC. CONSOLIDATED SCHEDULE OF INVESTMENTS AS OF JUNE 30, 2014 (Unaudited) |
| Method of | Primary | Shares/ | ||||||||||||||
| Valuation (1) | Industry (2) | Cost | Principal | Value | ||||||||||||
| Investments in Non-Controlled | ||||||||||||||||
| Affiliated Companies (3) – | ||||||||||||||||
| 58.1% of net assets at value (Cont.) | ||||||||||||||||
| Private Placement Portfolio (Illiquid) (16) – | ||||||||||||||||
| 58.1% of net assets at value (Cont.) | ||||||||||||||||
| SiOnyx, Inc. (5)(8)(9) | Electronics | |||||||||||||||
| Developing silicon-based optoelectronic | ||||||||||||||||
| products enabled by its proprietary Black Silicon | ||||||||||||||||
| Series A Convertible Preferred Stock | (M) | $ | 750,000 | 233,499 | $ | 0 | ||||||||||
| Series A-1 Convertible Preferred Stock | (M) | 890,000 | 2,966,667 | 0 | ||||||||||||
| Series A-2 Convertible Preferred Stock | (M) | 2,445,000 | 4,207,537 | 0 | ||||||||||||
| Series B-1 Convertible Preferred Stock | (M) | 1,169,561 | 1,892,836 | 0 | ||||||||||||
| Series C Convertible Preferred Stock | (M) | 1,171,316 | 1,674,030 | 0 | ||||||||||||
| Secured Convertible Bridge Note, 8%, acquired 1/31/14 | (M) | 1,324,114 | $ | 1,281,125 | 174,436 | |||||||||||
| Secured Convertible Bridge Note, 8%, acquired 5/9/14 | (M) | 78,073 | $ | 93,976 | 234,220 | |||||||||||
| Warrants for Series B-1 Convertible Preferred | ||||||||||||||||
| Stock expiring 2/23/17 | ( I ) | 130,439 | 247,350 | 0 | ||||||||||||
| Warrants for Common Stock expiring 3/28/17 | ( I ) | 84,207 | 418,507 | 0 | ||||||||||||
| Warrants for Common Stock expiring 5/9/19 | ( I ) | 17,010 | 3,208 | 0 | ||||||||||||
| 8,059,720 | 408,656 | |||||||||||||||
| Ultora, Inc. (5)(8)(9)(10) | Energy | |||||||||||||||
| Developing energy-storage devices | ||||||||||||||||
| enabled by carbon nanotubes | ||||||||||||||||
| Series A Convertible Preferred Stock | (M) | 886,830 | 17,736 | 0 | ||||||||||||
| Series B Convertible Preferred Stock | (M) | 236,603 | 2,347,254 | 0 | ||||||||||||
| Secured Convertible Bridge Note, 5%, acquired 5/7/14 | (M) | 86,696 | $ | 86,039 | 73,993 | |||||||||||
| 1,210,129 | 73,993 | |||||||||||||||
| Total Non-Controlled Private Placement Portfolio (cost: $76,518,770) | $ | 70,276,348 | ||||||||||||||
| Total Investments in Non-Controlled Affiliated Companies (cost: $76,518,770) | $ | 70,276,348 | ||||||||||||||
The accompanying unaudited notes are an integral part of these consolidated financial statements.
| 15 |
|
HARRIS & HARRIS GROUP, INC. CONSOLIDATED SCHEDULE OF INVESTMENTS AS OF JUNE 30, 2014 (Unaudited) |
| Method of | Primary | Shares/ | ||||||||||||||
| Valuation (1) | Industry (2) | Cost | Principal | Value | ||||||||||||
| Investments in Controlled | ||||||||||||||||
| Affiliated Companies (3) – | ||||||||||||||||
| 1.9% of net assets at value | ||||||||||||||||
| Private Placement Portfolio (Illiquid) (20) – | ||||||||||||||||
| 1.9% of net assets at value | ||||||||||||||||
| ProMuc, Inc. (5)(8)(9) | Life Sciences | |||||||||||||||
| Developing synthetic mucins for the | ||||||||||||||||
| nutritional, food and healthcare markets | ||||||||||||||||
| Common Stock | (M) | $ | 1 | 1,000 | $ | 1 | ||||||||||
| Secured Convertible Bridge Note, 8%, acquired 12/18/13 | (M) | 364,959 | $ | 350,000 | 364,959 | |||||||||||
| 364,960 | 364,960 | |||||||||||||||
| SynGlyco, Inc. (5)(8)(9) | Life Sciences | |||||||||||||||
| Developed synthetic carbohydrates for | ||||||||||||||||
| pharmaceutical applications | ||||||||||||||||
| Common Stock | ( I ) | 2,729,817 | 57,463 | 0 | ||||||||||||
| Series A' Convertible Preferred Stock | ( I ) | 4,855,627 | 4,855,627 | 0 | ||||||||||||
| Senior Secured Debt, 12.00%, maturing on 12/11/14 | ( I ) | 466,298 | $ | 500,000 | 751,500 | |||||||||||
| Secured Convertible Bridge Note, 8%, acquired 1/23/13 | ( I ) | 391,173 | $ | 350,000 | 350,154 | |||||||||||
| Secured Convertible Bridge Note, 8%, acquired 4/25/13 | ( I ) | 328,758 | $ | 300,000 | 300,132 | |||||||||||
| 8,771,673 | 1,401,786 | |||||||||||||||
| UberSeq, Inc. (5)(8)(9)(10)(21) | Life Sciences | |||||||||||||||
| Developing translational genomics solutions | ||||||||||||||||
| Series Seed Convertible Preferred Stock | (M) | 500,000 | 500,000 | 500,000 | ||||||||||||
| Total Controlled Private Placement Portfolio (cost: $9,636,633) | $ | 2,266,746 | ||||||||||||||
| Total Investments in Controlled Affiliated Companies (cost: $9,636,633) | $ | 2,266,746 | ||||||||||||||
| Total Private Placement and Publicly Traded Portfolio (cost: $114,969,498) | $ | 96,122,831 | ||||||||||||||
| Total Investments (cost: $114,969,498) | $ | 96,122,831 | ||||||||||||||
The accompanying unaudited notes are an integral part of these consolidated financial statements.
| 16 |
|
HARRIS & HARRIS GROUP, INC. CONSOLIDATED SCHEDULE OF INVESTMENTS AS OF JUNE 30, 2014 (Unaudited) |
| Method of | Number of | |||||||||
| Valuation (1) | Contracts | Value | ||||||||
| Written Call Options – | ||||||||||
| (0.04)% of net assets at value | ||||||||||
| Solazyme, Inc. — Strike Price $12.50, September 20, 2014 | (M) | 500 | $ | (47,500 | ) | |||||
| Total Written Call Options (Premiums Received $145,426) | $ | (47,500 | ) | |||||||
The accompanying unaudited notes are an integral part of these consolidated financial statements.
| 17 |
|
HARRIS & HARRIS GROUP, INC. CONSOLIDATED SCHEDULE OF INVESTMENTS AS OF JUNE 30, 2014 (Unaudited) |
Notes to Consolidated Schedule of Investments
| (1) | See "Footnote to Consolidated Schedule of Investments" on page 32 for a description of the "Valuation Procedures." |
| (2) | We classify "Energy" companies as those that seek to improve performance, productivity or efficiency, and to reduce environmental impact, waste, cost, energy consumption or raw materials. We classify "Electronics" companies as those that address problems in electronics-related industries, including semiconductors. We classify "Life Sciences" companies as those that address problems in life sciences-related industries, including biotechnology, agriculture, advanced materials and chemicals, healthcare, bioprocessing, water, industrial biotechnology, food, nutrition and energy. |
| (3) | Investments in unaffiliated companies consist of investments in which we own less than five percent of the voting shares of the portfolio company. Investments in non-controlled affiliated companies consist of investments in which we own five percent or more, but less than 25 percent, of the voting shares of the portfolio company, or where we hold one or more seats on the portfolio company’s Board of Directors but do not control the company. Investments in controlled affiliated companies consist of investments in which we own 25 percent or more of the voting shares of the portfolio company or otherwise control the company. |
| (4) | The aggregate cost for federal income tax purposes of investments in unaffiliated privately held companies is $23,151,547. The gross unrealized appreciation based on the tax cost for these securities is $1,599,294. The gross unrealized depreciation based on the tax cost for these securities is $8,434,253. |
| (5) | All or a portion of the investments or instruments are pledged as collateral under our loan facility. |
| (6) | The aggregate cost for federal income tax purposes of investments in unaffiliated rights to milestone payments is $3,921,420. The gross unrealized appreciation based on the tax cost for these securities is $205,684. The gross unrealized depreciation based on the tax cost for these securities is $0. |
| (7) | The aggregate cost for federal income tax purposes of investments in unaffiliated publicly traded companies is $1,741,128. The gross unrealized appreciation based on the tax cost for these securities is $1,394,917. The gross unrealized depreciation based on the tax cost for these securities is $0. |
| (8) | We are subject to legal restrictions on the sale of our investment(s) in this company. |
| (9) | These investments are development-stage companies. A development-stage company is defined as a company that is devoting substantially all of its efforts to establishing a new business, and either it has not yet commenced its planned principal operations, or it has commenced such operations but has not realized significant revenue from them. |
| (10) | Represents a non-income producing security. Investments that have not paid dividends or interest within the last 12 months are considered to be non-income producing. |
| (11) | Cobalt Technologies, Inc., also does business as Cobalt Biofuels. |
| (12) | With our investment in the Mersana Therapeutics, Inc., Series A-1 financing, we received a warrant to purchase 277,760 shares of Series A-2 Convertible Preferred Stock. The ability to exercise the warrant is contingent upon Mersana's achievement of certain milestones. Mersana has not achieved those milestones as of June 30, 2014, and, therefore, this warrant is a contingent asset as of that date. The warrant will expire on July 27, 2022. |
The accompanying unaudited notes are an integral part of this consolidated schedule.
| 18 |
|
HARRIS & HARRIS GROUP, INC. CONSOLIDATED SCHEDULE OF INVESTMENTS AS OF JUNE 30, 2014 (Unaudited) |
| (13) | Upon the closing of Canon's acquisition of Molecular Imprints, Inc.'s semiconductor lithography equipment business, a new spin-out company, which retained the name Molecular Imprints, Inc., was formed. These shares represent our investment in the new company. |
| (14) | OHSO Clean, Inc. also does business as CleanWell Company. |
| (15) | All of the shares of this security are held in connection with written call option contracts and are, therefore, pledged to brokers. |
| (16) | The aggregate cost for federal income tax purposes of investments in non-controlled affiliated privately held companies is $76,518,770. The gross unrealized appreciation based on the tax cost for these securities is $17,696,781. The gross unrealized depreciation based on the tax cost for these securities is $23,939,203. |
| (17) | Adesto Technologies Corporation's Series E shares have certain rights and preferences in a sale or IPO that are not ascribed to the other classes of stock. |
| (18) | D-Wave Systems, Inc., is located and is doing business primarily in Canada. We invested in D-Wave Systems, Inc., through Parallel Universes, Inc., a Delaware company. Our investment is denominated in Canadian dollars and is subject to foreign currency translation. See "Note 3. Summary of Significant Accounting Policies." |
| (19) | At June 30, 2014, Enumeral Biomedical Corp. was part of our private placement portfolio. On July 31, 2014, Enumeral completed a reverse merger into a publicly traded shell company and is traded publicly on the OTC market. See "Note 12. Subsequent Events." |
| (20) | The aggregate cost for federal income tax purposes of investments in controlled affiliated companies is $9,636,633. The gross unrealized appreciation based on the tax cost for these securities is $0. The gross unrealized depreciation based on the tax cost for these securities is $7,369,887. |
| (21) | Initial investment was made in 2014. |
The accompanying unaudited notes are an integral part of this consolidated schedule.
| 19 |
|
HARRIS & HARRIS GROUP, INC. CONSOLIDATED SCHEDULE OF INVESTMENTS AS OF DECEMBER 31, 2013 (Unaudited) |
| Method of | Primary | Shares/ | ||||||||||||||
| Valuation (1) | Industry (2) | Cost | Principal | Value | ||||||||||||
| Investments in Unaffiliated Companies (3) – | ||||||||||||||||
| 31.2% of net assets at value | ||||||||||||||||
| Private Placement Portfolio (Illiquid) (4) – | ||||||||||||||||
| 23.8% of net assets at value | ||||||||||||||||
| Bridgelux, Inc. (5)(8)(10) | Energy | |||||||||||||||
| Manufacturing high-power light emitting | ||||||||||||||||
| diodes (LEDs) and arrays | ||||||||||||||||
| Series B Convertible Preferred Stock | (M) | $ | 1,000,000 | 1,861,504 | $ | 318,898 | ||||||||||
| Series C Convertible Preferred Stock | (M) | 1,352,196 | 2,130,699 | 365,014 | ||||||||||||
| Series D Convertible Preferred Stock | (M) | 1,371,622 | 999,999 | 1,070,897 | ||||||||||||
| Series E Convertible Preferred Stock | (M) | 672,599 | 440,334 | 704,760 | ||||||||||||
| Series E-1 Convertible Preferred Stock | (M) | 386,073 | 399,579 | 468,606 | ||||||||||||
| Warrants for Series C Convertible Preferred | ||||||||||||||||
| Stock expiring 12/31/14 | ( I ) | 168,270 | 163,900 | 2,762 | ||||||||||||
| Warrants for Series D Convertible Preferred | ||||||||||||||||
| Stock expiring 8/26/14 | ( I ) | 88,531 | 124,999 | 40,686 | ||||||||||||
| Warrants for Series D Convertible Preferred | ||||||||||||||||
| Stock expiring 3/10/15 | ( I ) | 40,012 | 41,666 | 19,466 | ||||||||||||
| Warrants for Series E Convertible Preferred | ||||||||||||||||
| Stock expiring 12/31/17 | ( I ) | 93,969 | 170,823 | 190,679 | ||||||||||||
| Warrants for Common Stock expiring 6/1/16 | ( I ) | 72,668 | 132,100 | 1,656 | ||||||||||||
| Warrants for Common Stock expiring 8/9/18 | ( I ) | 148,409 | 171,183 | 13,538 | ||||||||||||
| Warrants for Common Stock expiring 10/21/18 | ( I ) | 18,816 | 84,846 | 3,680 | ||||||||||||
| 5,413,165 | 3,200,642 | |||||||||||||||
| Cambrios Technologies Corporation (5)(8)(10) | Electronics | |||||||||||||||
| Developing nanowire-enabled electronic | ||||||||||||||||
| materials for the display industry | ||||||||||||||||
| Series B Convertible Preferred Stock | (M) | 1,294,025 | 1,294,025 | 1,165,383 | ||||||||||||
| Series C Convertible Preferred Stock | (M) | 1,300,000 | 1,300,000 | 1,170,764 | ||||||||||||
| Series D Convertible Preferred Stock | (M) | 515,756 | 515,756 | 773,634 | ||||||||||||
| Series D-2 Convertible Preferred Stock | (M) | 92,400 | 92,400 | 92,400 | ||||||||||||
| Series D-4 Convertible Preferred Stock | (M) | 216,168 | 216,168 | 216,168 | ||||||||||||
| 3,418,349 | 3,418,349 | |||||||||||||||
| Cobalt Technologies, Inc. (5)(8)(9)(11) | Energy | |||||||||||||||
| Developing processes for making bio- | ||||||||||||||||
| butanol through biomass fermentation | ||||||||||||||||
| Series C-1 Convertible Preferred Stock | (M) | 749,998 | 352,112 | 704,400 | ||||||||||||
| Series D-1 Convertible Preferred Stock | (M) | 122,070 | 48,828 | 106,152 | ||||||||||||
| Series E-1 Convertible Preferred Stock | (M) | 114,938 | 46,089 | 84,634 | ||||||||||||
| Warrants for Series E-1 Pref. Stock expiring on 10/9/22 | ( I ) | 2,781 | 1,407 | 2,163 | ||||||||||||
| Warrants for Series E-1 Pref. Stock expiring on 3/11/23 | ( I ) | 5,355 | 2,707 | 4,209 | ||||||||||||
| 995,142 | 901,558 | |||||||||||||||
The accompanying unaudited notes are an integral part of these consolidated financial statements.
| 20 |
|
HARRIS & HARRIS GROUP, INC. CONSOLIDATED SCHEDULE OF INVESTMENTS AS OF DECEMBER 31, 2013 (Unaudited) |
| Method of | Primary | Shares/ | ||||||||||||||
| Valuation (1) | Industry (2) | Cost | Principal | Value | ||||||||||||
| Investments in Unaffiliated Companies (3) – | ||||||||||||||||
| 31.2% of net assets at value (Cont.) | ||||||||||||||||
| Private Placement Portfolio (Illiquid) (4) – | ||||||||||||||||
| 23.8% of net assets at value (Cont.) | ||||||||||||||||
| Ensemble Therapeutics Corporation (5)(8)(9)(12) | Life Sciences | |||||||||||||||
| Developing DNA-Programmed ChemistryTM | ||||||||||||||||
| for the discovery of new classes of therapeutics | ||||||||||||||||
| Series B Convertible Preferred Stock | (H) | $ | 2,000,000 | 1,449,275 | $ | 1,419,855 | ||||||||||
| Secured Convertible Bridge Note, 8%, acquired 9/11/08 | (H) | 356,567 | $ | 250,211 | 1,321,657 | |||||||||||
| Secured Convertible Bridge Note, 8%, acquired 12/10/09 | (H) | 64,767 | $ | 48,868 | 253,257 | |||||||||||
| Secured Convertible Bridge Note, 8%, acquired 1/25/12 | (H) | 126,386 | $ | 109,400 | 548,354 | |||||||||||
| Secured Convertible Bridge Note, 8%, acquired 3/28/13 | (H) | 78,121 | $ | 73,598 | 361,996 | |||||||||||
| Secured Convertible Bridge Note, 8%, acquired 6/24/13 | (H) | 26,845 | $ | 25,759 | 126,201 | |||||||||||
| Secured Convertible Bridge Note, 8%, acquired 7/8/13 | (H) | 14,530 | $ | 13,983 | 68,467 | |||||||||||
| 2,667,216 | 4,099,787 | |||||||||||||||
| GEO Semiconductor Inc. (5) | Electronics | |||||||||||||||
| Developing programmable, high-performance | ||||||||||||||||
| video and geometry processing solutions | ||||||||||||||||
| Participation Agreement with Montage | ||||||||||||||||
| Capital relating to the following assets: | ||||||||||||||||
| Warrants for Series A Pref. Stock expiring on 9/17/17 | ( I ) | 66,684 | 100,000 | 82,270 | ||||||||||||
| Warrants for Series A-1 Pref. Stock expiring on 6/30/18 | ( I ) | 23,566 | 34,500 | 32,132 | ||||||||||||
| Loan and Security Agreement with GEO Semiconductor | ||||||||||||||||
| relating to the following assets: | ||||||||||||||||
| Warrants for Series A Pref. Stock expiring on 3/1/18 | ( I ) | 7,512 | 10,000 | 8,007 | ||||||||||||
| Warrants for Series A-1 Pref. Stock expiring on 6/29/18 | ( I ) | 7,546 | 10,000 | 8,478 | ||||||||||||
| 105,308 | 130,887 | |||||||||||||||
| Mersana Therapeutics, Inc. (5)(8)(9)(10)(13) | Life Sciences | |||||||||||||||
| Developing antibody drug conjugates | ||||||||||||||||
| for cancer therapy | ||||||||||||||||
| Series A-1 Convertible Preferred Stock | (M) | 443,038 | 411,630 | 443,038 | ||||||||||||
| Common Stock | (M) | 3,875,395 | 350,539 | 108,667 | ||||||||||||
| 4,318,433 | 551,705 | |||||||||||||||
| Molecular Imprints, Inc. (5)(8)(10)(14)(15) | Electronics | |||||||||||||||
| Manufacturing nanoimprint | ||||||||||||||||
| lithography capital equipment | ||||||||||||||||
| Series B Convertible Preferred Stock | ( I ) | 2,000,000 | 1,333,333 | 1,876,501 | ||||||||||||
| Series C Convertible Preferred Stock | ( I ) | 2,406,595 | 1,285,071 | 2,359,061 | ||||||||||||
| Non-Convertible Bridge Note | ( I ) | 0 | $ | 0 | 4,043,381 | |||||||||||
| 4,406,595 | 8,278,943 | |||||||||||||||
The accompanying unaudited notes are an integral part of these consolidated financial statements.
| 21 |
|
HARRIS & HARRIS GROUP, INC. CONSOLIDATED SCHEDULE OF INVESTMENTS AS OF DECEMBER 31, 2013 (Unaudited) |
| Method of | Primary | Shares/ | ||||||||||||||
| Valuation (1) | Industry (2) | Cost | Principal | Value | ||||||||||||
| Investments in Unaffiliated Companies (3) – | ||||||||||||||||
| 31.2% of net assets at value (Cont.) | ||||||||||||||||
| Private Placement Portfolio (Illiquid) (4) – | ||||||||||||||||
| 23.8% of net assets at value (Cont.) | ||||||||||||||||
| Nanosys, Inc. (5)(8) | Energy | |||||||||||||||
| Developing inorganic nanowires and | ||||||||||||||||
| quantum dots for use in LED-backlit devices | ||||||||||||||||
| Series C Convertible Preferred Stock | (M) | $ | 1,500,000 | 803,428 | $ | 1,098,762 | ||||||||||
| Series D Convertible Preferred Stock | (M) | 3,000,003 | 1,016,950 | 2,196,781 | ||||||||||||
| Series E Convertible Preferred Stock | (M) | 496,573 | 433,688 | 705,827 | ||||||||||||
| Unsecured Convertible Bridge Note, 4%, acquired 7/16/12 | (M) | 46,385 | $ | 43,821 | 127,016 | |||||||||||
| 5,042,961 | 4,128,386 | |||||||||||||||
| Nano Terra, Inc. (5)(9) | Energy | |||||||||||||||
| Developing surface chemistry and nano- | ||||||||||||||||
| manufacturing solutions | ||||||||||||||||
| Senior secured debt, 12.0%, maturing on 12/1/15 | ( I ) | 663,322 | $ | 698,725 | 680,000 | |||||||||||
| Warrants for Series A-2 Pref. Stock expiring on 2/22/21 | ( I ) | 69,168 | 446,248 | 21,858 | ||||||||||||
| Warrants for Series C Pref. Stock expiring on 11/15/22 | ( I ) | 35,403 | 241,662 | 90,476 | ||||||||||||
| 767,893 | 792,334 | |||||||||||||||
| Nantero, Inc. (5)(8)(9)(10) | Electronics | |||||||||||||||
| Developing a high-density, nonvolatile, | ||||||||||||||||
| random access memory chip, enabled | ||||||||||||||||
| by carbon nanotubes | ||||||||||||||||
| Series A Convertible Preferred Stock | (M) | 489,999 | 345,070 | 1,349,224 | ||||||||||||
| Series B Convertible Preferred Stock | (M) | 323,000 | 207,051 | 809,569 | ||||||||||||
| Series C Convertible Preferred Stock | (M) | 571,329 | 188,315 | 736,312 | ||||||||||||
| Series D Convertible Preferred Stock | (M) | 139,075 | 35,569 | 139,075 | ||||||||||||
| 1,523,403 | 3,034,180 | |||||||||||||||
| OHSO Clean, Inc. (5)(16) | Life Sciences | |||||||||||||||
| Developing natural, hypoallergenic household | ||||||||||||||||
| cleaning products enabled by nanotechnology- | ||||||||||||||||
| enabled formulations of thyme oil | ||||||||||||||||
| Participation Agreement with Montage | ||||||||||||||||
| Capital relating to the following assets: | ||||||||||||||||
| Senior secured debt, 13.00%, maturing on 3/31/15 | ( I ) | 527,006 | $ | 624,640 | 592,100 | |||||||||||
| Warrants for Series C Pref. Stock expiring on 3/30/22 | ( I ) | 91,742 | 1,109,333 | 70,693 | ||||||||||||
| 618,748 | 662,793 | |||||||||||||||
| Total Unaffiliated Private Placement Portfolio (cost: $29,277,213) | $ | 29,199,564 | ||||||||||||||
The accompanying unaudited notes are an integral part of these consolidated financial statements.
| 22 |
|
HARRIS & HARRIS GROUP, INC. CONSOLIDATED SCHEDULE OF INVESTMENTS AS OF DECEMBER 31, 2013 (Unaudited) |
| Method of | Primary | Shares/ | ||||||||||||||
| Valuation (1) | Industry (2) | Cost | Principal | Value | ||||||||||||
| Rights to Milestone Payments (Illiquid) (6) – | ||||||||||||||||
| 2.9% of net assets at value | ||||||||||||||||
| Amgen, Inc. (8)(10) | Life Sciences | |||||||||||||||
| Rights to Milestone Payments from | ||||||||||||||||
| Acquisition of BioVex Group, Inc. | ( I ) | $ | 3,291,750 | $ | 3,291,750 | $ | 3,489,433 | |||||||||
| Laird Technologies, Inc. (8)(10) | Energy | |||||||||||||||
| Rights to Milestone Payments from Merger & | ||||||||||||||||
| Acquisition of Nextreme Thermal Solutions, Inc. | ( I ) | 0 | 0 | 0 | ||||||||||||
| Total Unaffiliated Rights to Milestone Payments (cost: $3,291,750) | $ | 3,489,433 | ||||||||||||||
| Publicly Traded Portfolio (7) – | ||||||||||||||||
| 4.5% of net assets at value | ||||||||||||||||
| Solazyme, Inc. (5)(10)(17) | Energy | |||||||||||||||
| Developing algal biodiesel, industrial | ||||||||||||||||
| chemicals and specialty ingredients using | ||||||||||||||||
| synthetic biology | ||||||||||||||||
| Common Stock | (M) | $ | 396,564 | 167,834 | $ | 1,827,712 | ||||||||||
| Champions Oncology, Inc. (5)(10) | Life Sciences | |||||||||||||||
| Developing its TumorGraftTM platform for | ||||||||||||||||
| personalized medicine and drug development | ||||||||||||||||
| Common Stock | (M) | 2,054,446 | 3,099,651 | 3,719,582 | ||||||||||||
| Warrants for Common Stock expiring 1/29/18 | ( I ) | 400 | 40,000 | 23,502 | ||||||||||||
| 2,054,846 | 3,743,084 | |||||||||||||||
| Total Unaffiliated Publicly Traded Portfolio (cost: $2,451,410) | $ | 5,570,796 | ||||||||||||||
| Total Investments in Unaffiliated Companies (cost: $35,020,373) | $ | 38,259,793 | ||||||||||||||
The accompanying unaudited notes are an integral part of these consolidated financial statements.
| 23 |
|
HARRIS & HARRIS GROUP, INC. CONSOLIDATED SCHEDULE OF INVESTMENTS AS OF DECEMBER 31, 2013 (Unaudited) |
| Method of | Primary | Shares/ | ||||||||||||||
| Valuation (1) | Industry (2) | Cost | Principal | Value | ||||||||||||
| Investments in Non-Controlled | ||||||||||||||||
| Affiliated Companies (3) – | ||||||||||||||||
| 44.2% of net assets at value | ||||||||||||||||
| Private Placement Portfolio (Illiquid) (18) – | ||||||||||||||||
| 44.2% of net assets at value | ||||||||||||||||
| ABSMaterials, Inc. (5)(8)(9) | Energy | |||||||||||||||
| Developing nano-structured absorbent | ||||||||||||||||
| materials for environmental remediation | ||||||||||||||||
| Series A Convertible Preferred Stock | (M) | $ | 435,000 | 390,000 | $ | 471,900 | ||||||||||
| Series B Convertible Preferred Stock | (M) | 717,644 | 624,528 | 755,679 | ||||||||||||
| 1,152,644 | 1,227,579 | |||||||||||||||
| Adesto Technologies Corporation (5)(8)(19) | Electronics | |||||||||||||||
| Developing low-power, high-performance | ||||||||||||||||
| memory devices | ||||||||||||||||
| Series A Convertible Preferred Stock | (M) | 2,200,000 | 6,547,619 | 1,388,276 | ||||||||||||
| Series B Convertible Preferred Stock | (M) | 2,200,000 | 5,952,381 | 1,262,070 | ||||||||||||
| Series C Convertible Preferred Stock | (M) | 1,485,531 | 2,122,187 | 449,963 | ||||||||||||
| Series D Convertible Preferred Stock | (M) | 1,393,147 | 1,466,470 | 1,070,067 | ||||||||||||
| Series D-1 Convertible Preferred Stock | (M) | 703,740 | 987,706 | 561,291 | ||||||||||||
| Series E Convertible Preferred Stock | (M) | 2,499,999 | 3,508,771 | 9,969,781 | ||||||||||||
| 10,482,417 | 14,701,448 | |||||||||||||||
| AgBiome, LLC (formerly AgInnovation, LLC) (5)(8)(9)(10)(20) | Life Sciences | |||||||||||||||
| Providing early stage research and discovery for | ||||||||||||||||
| agriculture and utilizing the crop microbiome to | ||||||||||||||||
| identify products that reduce risk and improve yield | ||||||||||||||||
| Series A-1 Convertible Preferred Stock | (M) | 2,000,000 | 2,000,000 | 2,456,834 | ||||||||||||
| Series A-2 Convertible Preferred Stock | (M) | 521,740 | 417,392 | 564,906 | ||||||||||||
| 2,521,740 | 3,021,740 | |||||||||||||||
| Contour Energy Systems, Inc. (5)(8)(9)(10)(21) | Energy | |||||||||||||||
| Developing batteries using | ||||||||||||||||
| nano-structured materials | ||||||||||||||||
| Series A Convertible Preferred Stock | (M) | 2,009,995 | 2,565,798 | 0 | ||||||||||||
| Series B Convertible Preferred Stock | (M) | 1,300,000 | 812,500 | 0 | ||||||||||||
| Series C Convertible Preferred Stock | (M) | 1,200,000 | 1,148,325 | 90,844 | ||||||||||||
| 4,509,995 | 90,844 | |||||||||||||||
The accompanying unaudited notes are an integral part of these consolidated financial statements.
| 24 |
|
HARRIS & HARRIS GROUP, INC. CONSOLIDATED SCHEDULE OF INVESTMENTS AS OF DECEMBER 31, 2013 (Unaudited) |
| Method of | Primary | Shares/ | ||||||||||||||
| Valuation (1) | Industry (2) | Cost | Principal | Value | ||||||||||||
| Investments in Non-Controlled | ||||||||||||||||
| Affiliated Companies (3) – | ||||||||||||||||
| 44.2% of net assets at value (Cont.) | ||||||||||||||||
| Private Placement Portfolio (Illiquid) (18) – | ||||||||||||||||
| 44.2% of net assets at value (Cont.) | ||||||||||||||||
| D-Wave Systems, Inc. (8)(9)(10)(22) | Electronics | |||||||||||||||
| Developing high-performance | ||||||||||||||||
| quantum computing systems | ||||||||||||||||
| Series 1 Class B Convertible Preferred Stock | (M) | $ | 1,002,074 | 1,144,869 | $ | 1,399,831 | ||||||||||
| Series 1 Class C Convertible Preferred Stock | (M) | 487,804 | 450,450 | 550,765 | ||||||||||||
| Series 1 Class D Convertible Preferred Stock | (M) | 748,473 | 855,131 | 1,045,569 | ||||||||||||
| Series 1 Class E Convertible Preferred Stock | (M) | 248,049 | 269,280 | 329,249 | ||||||||||||
| Series 1 Class F Convertible Preferred Stock | (M) | 238,323 | 258,721 | 316,338 | ||||||||||||
| Series 2 Class D Convertible Preferred Stock | (M) | 736,019 | 678,264 | 829,313 | ||||||||||||
| Series 2 Class E Convertible Preferred Stock | (M) | 659,493 | 513,900 | 628,345 | ||||||||||||
| Series 2 Class F Convertible Preferred Stock | (M) | 633,631 | 493,747 | 603,704 | ||||||||||||
| Warrants for Common Stock expiring 6/30/15 | ( I ) | 98,644 | 153,890 | 37,617 | ||||||||||||
| 4,852,510 | 5,740,731 | |||||||||||||||
| EchoPixel, Inc. (5)(8)(9)(10)(23) | Life Sciences | |||||||||||||||
| Developing algorithms and software to improve | ||||||||||||||||
| visualization of data for life science and | ||||||||||||||||
| healthcare applications | ||||||||||||||||
| Series Seed Convertible Preferred Stock | (M) | 750,000 | 2,516,778 | 750,000 | ||||||||||||
| Enumeral Biomedical Corp. (5)(8)(9)(10) | Life Sciences | |||||||||||||||
| Developing therapeutics and diagnostics | ||||||||||||||||
| through functional assaying of single cells | ||||||||||||||||
| Series A Convertible Preferred Stock | (M) | 1,026,832 | 957,038 | 690,538 | ||||||||||||
| Series A-1 Convertible Preferred Stock | (M) | 750,000 | 576,923 | 425,939 | ||||||||||||
| Series A-2 Convertible Preferred Stock | (M) | 1,050,001 | 724,138 | 566,027 | ||||||||||||
| 2,826,833 | 1,682,504 | |||||||||||||||
| HZO, Inc. (5)(8)(9) | Electronics | |||||||||||||||
| Developing novel industrial coatings that | ||||||||||||||||
| protect electronics against damage from liquids | ||||||||||||||||
| Series A Convertible Preferred Stock | (M) | 666,667 | 4,057,294 | 1,130,362 | ||||||||||||
| Series B Convertible Preferred Stock | (M) | 5,502,838 | 21,879,365 | 6,095,592 | ||||||||||||
| 6,169,505 | 7,225,954 | |||||||||||||||
The accompanying unaudited notes are an integral part of these consolidated financial statements.
| 25 |
|
HARRIS & HARRIS GROUP, INC. CONSOLIDATED SCHEDULE OF INVESTMENTS AS OF DECEMBER 31, 2013 (Unaudited) |
| Method of | Primary | Shares/ | ||||||||||||||
| Valuation (1) | Industry (2) | Cost | Principal | Value | ||||||||||||
| Investments in Non-Controlled | ||||||||||||||||
| Affiliated Companies (3) – | ||||||||||||||||
| 44.2% of net assets at value (Cont.) | ||||||||||||||||
| Private Placement Portfolio (Illiquid) (18) – | ||||||||||||||||
| 44.2% of net assets at value (Cont.) | ||||||||||||||||
| Kovio, Inc. (5)(8)(9)(24) | Electronics | |||||||||||||||
| Developing semiconductor products using | ||||||||||||||||
| printed electronics and thin-film technologies | ||||||||||||||||
| Series A' Convertible Preferred Stock | (M) | $ | 5,242,993 | 2,160,000 | $ | 0 | ||||||||||
| Series B' Convertible Preferred Stock | (M) | 2,006,540 | 3,015,493 | 0 | ||||||||||||
| Secured Subordinated Convertible Bridge Note, 7%, | ||||||||||||||||
| acquired 6/7/13 | (M) | 50,000 | $ | 50,000 | 0 | |||||||||||
| 7,299,533 | 0 | |||||||||||||||
| Laser Light Engines, Inc. (5)(8)(9) | Energy | |||||||||||||||
| Manufacturing solid-state light sources for | ||||||||||||||||
| digital cinema and large-venue projection displays | ||||||||||||||||
| Series A Convertible Preferred Stock | ( I ) | 2,000,000 | 7,499,062 | 0 | ||||||||||||
| Series B Convertible Preferred Stock | ( I ) | 3,095,802 | 13,571,848 | 0 | ||||||||||||
| Secured Convertible Bridge Note, 12%, acquired 10/7/11 | ( I ) | 200,000 | $ | 200,000 | 0 | |||||||||||
| Secured Convertible Bridge Note, 12%, acquired 11/17/11 | ( I ) | 95,652 | $ | 95,652 | 0 | |||||||||||
| Secured Convertible Bridge Note, 12%, acquired 12/21/11 | ( I ) | 82,609 | $ | 82,609 | 0 | |||||||||||
| Secured Convertible Bridge Note, 12%, acquired 3/5/12 | ( I ) | 434,784 | $ | 434,784 | 0 | |||||||||||
| Secured Convertible Bridge Note, 12%, acquired 7/26/12 | ( I ) | 186,955 | $ | 186,955 | 0 | |||||||||||
| Secured Convertible Bridge Note, 20%, acquired 4/29/13 | ( I ) | 166,667 | $ | 166,667 | 0 | |||||||||||
| Secured Convertible Bridge Note, 20%, acquired 7/22/13 | ( I ) | 166,667 | $ | 166,667 | 0 | |||||||||||
| Secured Convertible Bridge Note, 10%, acquired 10/30/13 | ( I ) | 82,061 | $ | 80,669 | 164,122 | |||||||||||
| 6,511,197 | 164,122 | |||||||||||||||
| Metabolon, Inc. (5)(8)(10) | Life Sciences | |||||||||||||||
| Developing service and diagnostic products | ||||||||||||||||
| through the use of a metabolomics, or | ||||||||||||||||
| biochemical, profiling platform | ||||||||||||||||
| Series B Convertible Preferred Stock | (M) | 2,500,000 | 371,739 | 2,997,991 | ||||||||||||
| Series B-1 Convertible Preferred Stock | (M) | 706,214 | 148,696 | 1,199,196 | ||||||||||||
| Series C Convertible Preferred Stock | (M) | 1,000,000 | 1,000,000 | 2,756,500 | ||||||||||||
| Series D Convertible Preferred Stock | (M) | 1,499,999 | 835,882 | 2,304,109 | ||||||||||||
| Series E Convertible Preferred Stock | (M) | 1,225,000 | 444,404 | 1,225,000 | ||||||||||||
| Warrants for Series B-1 Convertible Preferred | ||||||||||||||||
| Stock expiring 3/25/15 | ( I ) | 293,786 | 74,348 | 216,408 | ||||||||||||
| 7,224,999 | 10,699,204 | |||||||||||||||
| OpGen, Inc. (8) | Life Sciences | |||||||||||||||
| Developing tools for genomic sequence | ||||||||||||||||
| assembly and analysis | ||||||||||||||||
| Series A Convertible Preferred Stock | (M) | 245,000 | 245,000 | 245,000 | ||||||||||||
| Common Stock | (M) | 3,260,000 | 29,883 | 0 | ||||||||||||
| 3,505,000 | 245,000 | |||||||||||||||
The accompanying unaudited notes are an integral part of these consolidated financial statements.
| 26 |
|
HARRIS & HARRIS GROUP, INC. CONSOLIDATED SCHEDULE OF INVESTMENTS AS OF DECEMBER 31, 2013 (Unaudited) |
| Method of | Primary | Shares/ | ||||||||||||||
| Valuation (1) | Industry (2) | Cost | Principal | Value | ||||||||||||
| Investments in Non-Controlled | ||||||||||||||||
| Affiliated Companies (3) – | ||||||||||||||||
| 44.2% of net assets at value (Cont.) | ||||||||||||||||
| Private Placement Portfolio (Illiquid) (18) – | ||||||||||||||||
| 44.2% of net assets at value (Cont.) | ||||||||||||||||
| Produced Water Absorbents, Inc. (5)(8)(9) | Energy | |||||||||||||||
| Developing nano-structured absorbent materials | ||||||||||||||||
| for environmental remediation of contaminated | ||||||||||||||||
| water in the oil and gas industries | ||||||||||||||||
| Series A Convertible Preferred Stock | (M) | $ | 1,000,000 | 1,000,000 | $ | 125,000 | ||||||||||
| Series B Convertible Preferred Stock | (M) | 1,626,641 | 6,506,564 | 1,751,641 | ||||||||||||
| Secured Convertible Bridge Note, 8%, acquired 11/14/13 | (M) | 832,789 | $ | 824,119 | 832,789 | |||||||||||
| 3,459,430 | 2,709,430 | |||||||||||||||
| Senova Systems, Inc. (5)(8)(9) | Life Sciences | |||||||||||||||
| Developing next-generation sensors to measure pH | ||||||||||||||||
| Series B Convertible Preferred Stock | (M) | 1,218,462 | 1,350,000 | 540,000 | ||||||||||||
| Series B-1 Convertible Preferred Stock | (M) | 583,960 | 1,509,902 | 603,960 | ||||||||||||
| Warrants for Series B Preferred Stock expiring 10/15/17 | ( I ) | 131,538 | 164,423 | 65,753 | ||||||||||||
| Warrants for Series B Preferred Stock expiring 4/24/18 | ( I ) | 20,000 | 25,000 | 9,997 | ||||||||||||
| 1,953,960 | 1,219,710 | |||||||||||||||
| SiOnyx, Inc. (5)(8)(9) | Electronics | |||||||||||||||
| Developing silicon-based optoelectronic | ||||||||||||||||
| products enabled by its proprietary Black Silicon | ||||||||||||||||
| Series A Convertible Preferred Stock | (M) | 750,000 | 233,499 | 43,781 | ||||||||||||
| Series A-1 Convertible Preferred Stock | (M) | 890,000 | 2,966,667 | 556,250 | ||||||||||||
| Series A-2 Convertible Preferred Stock | (M) | 2,445,000 | 4,207,537 | 788,913 | ||||||||||||
| Series B-1 Convertible Preferred Stock | (M) | 1,169,561 | 1,892,836 | 451,903 | ||||||||||||
| Series C Convertible Preferred Stock | (M) | 1,171,316 | 1,674,030 | 970,526 | ||||||||||||
| Secured Convertible Bridge Note, 8%, acquired 7/22/13 | (M) | 433,209 | $ | 418,066 | 859,729 | |||||||||||
| Secured Convertible Bridge Note, 8%, acquired 10/2/13 | (M) | 426,520 | $ | 418,066 | 859,729 | |||||||||||
| Warrants for Series B-1 Convertible Preferred | ||||||||||||||||
| Stock expiring 2/23/17 | ( I ) | 130,439 | 247,350 | 18,165 | ||||||||||||
| Warrants for Common Stock expiring 3/28/17 | ( I ) | 84,207 | 418,507 | 21,387 | ||||||||||||
| 7,500,252 | 4,570,383 | |||||||||||||||
| Ultora, Inc. (5)(8)(9) | Energy | |||||||||||||||
| Developing energy-storage devices | ||||||||||||||||
| enabled by carbon nanotubes | ||||||||||||||||
| Series A Convertible Preferred Stock | (M) | 886,830 | 17,736 | 1,788 | ||||||||||||
| Series B Convertible Preferred Stock | (M) | 236,603 | 2,347,254 | 236,603 | ||||||||||||
| 1,123,433 | 238,391 | |||||||||||||||
| Total Non-Controlled Private Placement Portfolio (cost: $71,843,448) | $ | 54,287,040 | ||||||||||||||
| Total Investments in Non-Controlled Affiliated Companies (cost: $71,843,448) | $ | 54,287,040 | ||||||||||||||
The accompanying unaudited notes are an integral part of these consolidated financial statements.
| 27 |
|
HARRIS & HARRIS GROUP, INC. CONSOLIDATED SCHEDULE OF INVESTMENTS AS OF DECEMBER 31, 2013 (Unaudited) |
| Method of | Primary | Shares/ | ||||||||||||||
| Valuation (1) | Industry (2) | Cost | Principal | Value | ||||||||||||
| Investments in Controlled | ||||||||||||||||
| Affiliated Companies (3) – | ||||||||||||||||
| 1.1% of net assets at value | ||||||||||||||||
| Private Placement Portfolio (Illiquid) (25) – | ||||||||||||||||
| 1.1% of net assets at value | ||||||||||||||||
| SynGlyco, Inc. (5)(8)(9)(26) | Life Sciences | |||||||||||||||
| Developing synthetic carbohydrates for | ||||||||||||||||
| pharmaceutical applications | ||||||||||||||||
| Common Stock | ( I ) | $ | 2,729,817 | 57,463 | $ | 0 | ||||||||||
| Series A' Convertible Preferred Stock | ( I ) | 4,855,627 | 4,855,627 | 0 | ||||||||||||
| Senior Secured Debt, 12.00%, maturing on 12/11/14 | ( I ) | 436,637 | $ | 500,000 | 831,828 | |||||||||||
| Secured Convertible Bridge Note, 8%, acquired 1/23/13 | ( I ) | 376,312 | $ | 350,000 | 91,389 | |||||||||||
| Secured Convertible Bridge Note, 8%, acquired 4/25/13 | ( I ) | 316,504 | $ | 300,000 | 78,334 | |||||||||||
| 8,714,897 | 1,001,551 | |||||||||||||||
| ProMuc, Inc. (5)(8)(9)(22) | Life Sciences | |||||||||||||||
| Developing synthetic mucins for the | ||||||||||||||||
| nutritional, food and healthcare markets | ||||||||||||||||
| Common Stock | (M) | 1 | 1,000 | 1 | ||||||||||||
| Secured Convertible Bridge Note, 8%, acquired 12/18/13 | (M) | 351,074 | $ | 350,000 | 351,074 | |||||||||||
| 351,075 | 351,075 | |||||||||||||||
| Total Controlled Private Placement Portfolio (cost: $9,065,972) | $ | 1,352,626 | ||||||||||||||
| Total Investments in Controlled Affiliated Companies (cost: $9,065,972) | $ | 1,352,626 | ||||||||||||||
| Total Private Placement and Publicly Traded Portfolio (cost: $115,929,793) | $ | 93,899,459 | ||||||||||||||
The accompanying unaudited notes are an integral part of these consolidated financial statements.
| 28 |
|
HARRIS & HARRIS GROUP, INC. CONSOLIDATED SCHEDULE OF INVESTMENTS AS OF DECEMBER 31, 2013 (Unaudited) |
| Method of | Shares/ | |||||||||||||
| Valuation (1) | Cost | Principal | Value | |||||||||||
| U.S. Government Securities (27) – | ||||||||||||||
| 15.5% of net assets at value | ||||||||||||||
| U.S. Treasury Bill — due date 01/23/14 | (M) | $ | 18,999,765 | $ | 19,000,000 | $ | 18,999,810 | |||||||
| Total Investments in U.S. Government Securities (cost: $18,999,765) | $ | 18,999,810 | ||||||||||||
| Total Investments (cost: $134,929,558) | $ | 112,899,269 | ||||||||||||
| Method of | Number of | |||||||||
| Valuation (1) | Contracts | Value | ||||||||
| Written Call Options (22) – | ||||||||||
| (0.1)% of net assets at value | ||||||||||
| Solazyme, Inc. — Strike Price $12.50, March 22, 2014 | (M) | 1,500 | $ | 103,500 | ||||||
| Total Written Call Options (Premiums Received $112,382) | $ | (103,500 | ) | |||||||
The accompanying unaudited notes are an integral part of these consolidated financial statements.
| 29 |
|
HARRIS & HARRIS GROUP, INC. CONSOLIDATED SCHEDULE OF INVESTMENTS AS OF DECEMBER 31, 2013 (Unaudited) |
Notes to Consolidated Schedule of Investments
| (1) | See "Footnote to Consolidated Schedule of Investments" on page 32 for a description of the "Valuation Procedures." |
| (2) | We classify "Energy" companies as those that seek to improve performance, productivity or efficiency, and to reduce environmental impact, waste, cost, energy consumption or raw materials. We classify "Electronics" companies as those that address problems in electronics-related industries, including semiconductors. We classify "Life Sciences" companies as those that address problems in life sciences-related industries, including biotechnology, agriculture, advanced materials and chemicals, healthcare, bioprocessing, water, industrial biotechnology, food, nutrition and energy. |
| (3) | Investments in unaffiliated companies consist of investments in which we own less than five percent of the voting shares of the portfolio company. Investments in non-controlled affiliated companies consist of investments in which we own five percent or more, but less than 25 percent, of the voting shares of the portfolio company, or where we hold one or more seats on the portfolio company’s Board of Directors but do not control the company. Investments in controlled affiliated companies consist of investments in which we own 25 percent or more of the voting shares of the portfolio company or otherwise control the company. |
| (4) | The aggregate cost for federal income tax purposes of investments in unaffiliated privately held companies is $29,277,213. The gross unrealized appreciation based on the tax cost for these securities is $6,909,761. The gross unrealized depreciation based on the tax cost for these securities is $6,987,410. |
| (5) | All or a portion of the investments or instruments are pledged as collateral under our loan facility. |
| (6) | The aggregate cost for federal income tax purposes of investments in unaffiliated rights to milestone payments is $3,291,750. The gross unrealized appreciation based on the tax cost for these securities is $197,683. The gross unrealized depreciation based on the tax cost for these securities is $0. |
| (7) | The aggregate cost for federal income tax purposes of investments in unaffiliated publicly traded companies is $2,451,410. The gross unrealized appreciation based on the tax cost for these securities is $3,119,386. The gross unrealized depreciation based on the tax cost for these securities is $0. |
| (8) | We are subject to legal restrictions on the sale of our investment(s) in this company. |
| (9) | These investments are development-stage companies. A development-stage company is defined as a company that is devoting substantially all of its efforts to establishing a new business, and either it has not yet commenced its planned principal operations, or it has commenced such operations but has not realized significant revenue from them. |
| (10) | Represents a non-income producing security. Investments that have not paid dividends or interest within the last 12 months are considered to be non-income producing. |
| (11) | Cobalt Technologies, Inc., also does business as Cobalt Biofuels. |
| (12) | With our investments in convertible bridge notes issued by Ensemble Therapeutics Corporation, we received warrants to purchase a number of shares of the class of stock sold in the next financing of Ensemble Therapeutics Corporation equal to $260,989 divided by the price per share of the class of stock sold in the next financing of Ensemble Therapeutics Corporation. The ability to exercise these warrants is, therefore, contingent on Ensemble Therapeutics Corporation completing successfully a subsequent round of financing. These warrants shall expire and no longer be exercisable on dates ranging from September 10, 2015, through July 8, 2020. The cost basis of these warrants is $157. |
The accompanying unaudited notes are an integral part of this consolidated schedule.
| 30 |
|
HARRIS & HARRIS GROUP, INC. CONSOLIDATED SCHEDULE OF INVESTMENTS AS OF DECEMBER 31, 2013 (Unaudited) |
| (13) | With our investment in the Mersana Therapeutics, Inc., Series A-1 financing, we received a warrant to purchase 277,760 shares of Series A-2 Convertible Preferred Stock. The ability to exercise the warrant is contingent upon Mersana's achievement of certain milestones. Mersana has not achieved those milestones as of December 31, 2013, and, therefore, this warrant is a contingent asset as of that date. The warrant will expire on July 27, 2022. |
| (14) | As part of a loan the Company made to Molecular Imprints in the second quarter of 2011, we received a liquidation preference payable upon a sale of the company equal to three times the principal of the loan, or $4,044,450. This preference is senior to the preferences of the outstanding preferred stock. While the loan has since been repaid, this liquidation preference remains outstanding as of December 31, 2013. |
| (15) | On February 13, 2014, Molecular Imprints, Inc., announced that it had signed an agreement to sell its semiconductor lithography equipment business to Canon, Inc. See "Note 13. Subsequent Events" in the 2013 Annual Report on Form 10-K. |
| (16) | OHSO Clean, Inc. also does business as CleanWell Company. |
| (17) | A portion of this security is held in connection with written call option contracts: 150,000 shares, having a fair value of $1,633,500, have been pledged to brokers. |
| (18) | The aggregate cost for federal income tax purposes of investments in non-controlled affiliated privately held companies is $71,843,448. The gross unrealized appreciation based on the tax cost for these securities is $10,212,841. The gross unrealized depreciation based on the tax cost for these securities is $27,769,249. |
| (19) | Adesto Technologies Corporation's Series E shares have certain rights and preferences in a sale or IPO that are not ascribed to the other classes of stock. |
| (20) | On January 29, 2013, AgInnovation, LLC, changed its name to AgBiome, LLC. |
| (21) | On February 27, 2014, the board of directors of Contour Energy Systems, Inc., adopted a plan of complete liquidation and dissolution. See "Note 13. Subsequent Events" in the 2013 Annual Report on Form 10-K. |
| (22) | D-Wave Systems, Inc., is located and is doing business primarily in Canada. We invested in D-Wave Systems, Inc., through Parallel Universes, Inc., a Delaware company. Our investment is denominated in Canadian dollars and is subject to foreign currency translation. See "Note 2. Summary of Significant Accounting Policies" in the 2013 Annual Report on Form 10-K. |
| (23) | Initial investment was made in 2013. |
| (24) | On January 21, 2014, substantially all of Kovio's assets were sold to Thin Film Electronics ASA. See "Note 13. Subsequent Events" in the 2013 Annual Report on Form 10-K. |
| (25) | The aggregate cost for federal income tax purposes of investments in controlled affiliated companies is $9,065,972. The gross unrealized appreciation based on the tax cost for these securities is $0. The gross unrealized depreciation based on the tax cost for these securities is $7,713,346. |
| (26) | On October 31, 2013, Ancora sold a substantial portion of its assets, including the use of its corporate name, to Corden Pharma International US, Inc. ("Corden"). The remaining assets formed a new company, SynGlyco, Inc., of which we continue to own shares. SynGlyco may receive future royalty payments based upon certain sales targets and other terms of the Corden acquisition. |
| (27) | The aggregate cost for federal income tax purposes of our U.S. government securities is $18,999,765. The gross unrealized appreciation on the tax cost for these securities is $45. The gross unrealized depreciation on the tax cost of these securities is $0. |
The accompanying unaudited notes are an integral part of this consolidated schedule.
| 31 |
|
HARRIS & HARRIS GROUP, INC. FOOTNOTE TO CONSOLIDATED SCHEDULE OF INVESTMENTS |
VALUATION PROCEDURES
I. Determination of Net Asset Value
The 1940 Act requires periodic valuation of each investment in the portfolio of the Company to determine its net asset value. Under the 1940 Act, unrestricted securities with readily available market quotations are to be valued at the current market value; all other assets must be valued at "fair value" as determined in good faith by or under the direction of the Board of Directors.
The Board of Directors is also responsible for (1) determining overall valuation guidelines and (2) ensuring that the investments of the Company are valued within the prescribed guidelines.
The Valuation Committee, comprised of all of the independent Board members, is responsible for determining the valuation of the Company’s assets within the guidelines established by the Board of Directors. The Valuation Committee receives information and recommendations from management. An independent valuation firm also reviews select portfolio company valuations. The independent valuation firm does not provide proposed valuations.
The fair values assigned to these investments are based on available information and do not necessarily represent amounts that might ultimately be realized when that investment is sold, as such amounts depend on future circumstances and cannot reasonably be determined until the individual investments are actually liquidated or become readily marketable.
The Deal Team meets at the end of each quarter to discuss portfolio companies and propose fair valuations for all private securities. The Valuation Committee book is prepared with the use of data from primary sources whenever reasonably practicable. Proposed valuations for each portfolio company are communicated to the Valuation Committee in the Valuation Committee book and at the Valuation Committee meeting after the end of each quarter. The Valuation Committee determines the fair value of each private security and publicly traded securities without reliable market quotations. All valuations are then reported to the full Board of Directors along with the Chief Financial Officer’s calculation of net asset value.
II. Approaches to Determining Fair Value
Accounting Standards Codification Topic 820, "Fair Value Measurements and Disclosures," ("ASC 820") defines fair value as the price that would be received to sell an asset or paid to transfer a liability in an orderly transaction between market participants at the measurement date (exit price). It applies fair value terminology to all valuations whereas the 1940 Act applies market value terminology to readily marketable assets and fair value terminology to other assets.
The main approaches to measuring fair value utilized are the market approach and the income approach.
| 32 |
| · | Market Approach (M): The market approach may use quantitative inputs such as prices and other relevant information generated by market transactions involving identical or comparable assets or liabilities and the values of market multiples derived from a set of comparable companies. The market approach may also use qualitative inputs such as progress toward milestones, the long-term potential of the business, current and future financing requirements and the rights and preferences of certain securities versus those of other securities. The selection of the relevant inputs used to derive value under the market approach requires judgment considering factors specific to the significance and relevance of each input to deriving value. |
| · | Income Approach (I): The income approach uses valuation techniques to convert future amounts (for example, cash flows or earnings) to a single present value amount (discounted). The measurement is based on the value indicated by current market expectations about those future amounts. Those valuation techniques include present value techniques; option-pricing models, such as the Black-Scholes-Merton formula (a closed-form model) and a binomial model (a lattice model), which incorporate present value techniques; and the multi-period excess earnings method, which is used to measure the fair value of certain assets. |
| · | Hybrid Approach (H): The hybrid approach uses elements of both the market approach and the income approach. The hybrid approach calculates values using the market and income approach, individually. The resulting values are then distributed among the share classes based on probability of exit outcomes. |
ASC Topic 820 classifies the inputs used to measure fair value by these approaches into the following hierarchy:
| · | Level 1: Unadjusted quoted prices in active markets for identical assets or liabilities. |
| · | Level 2: Quoted prices in active markets for similar assets or liabilities, or quoted prices for identical or similar assets or liabilities in markets that are not active, or inputs other than quoted prices that are observable for the asset or liability, either directly or indirectly, for substantially the full term of the financial instrument. Level 2 inputs are in those markets for which there are few transactions, the prices are not current, little public information exists or instances where prices vary substantially over time or among brokered market makers; and |
| · | Level 3: Inputs to the valuation methodology are unobservable and significant to the fair value measurement. Unobservable inputs are those inputs that reflect our own assumptions that market participants would use to price the asset or liability based upon the best available information. |
Financial assets and liabilities are classified in their entirety based on the lowest level of input that is significant to the fair value measurement and are not necessarily an indication of risks associated with the investment.
III. Investment Categories
The Company’s investments can be classified into five broad categories for valuation purposes:
| 33 |
| · | Equity-related securities; |
| · | Long-term fixed-income securities; |
| · | Short-term fixed-income securities; |
| · | Investments in intellectual property, patents, research and development in technology or product development; and |
| · | All other securities. |
The Company applies the methods for determining fair value discussed above to the valuation of investments in each of these five broad categories as follows:
| A. | EQUITY-RELATED SECURITIES |
Equity-related securities, including options or warrants, are fair valued using the market or income approaches. The following factors may be considered when the market approach is used to fair value these types of securities:
| § | Readily available public market quotations; |
| § | The cost of the Company’s investment; |
| § | Transactions in a company's securities or unconditional firm offers by responsible parties as a factor in determining valuation; |
| § | The financial condition and operating results of the company; |
| § | The company's progress towards milestones; |
| § | The long-term potential of the business and technology of the company; |
| § | The values of similar securities issued by companies in similar businesses; |
| § | Multiples to revenue, net income or EBITDA that similar securities issued by companies in similar businesses receive; |
| § | The proportion of the company's securities we own and the nature of any rights to require the company to register restricted securities under applicable securities laws; and |
| § | The rights and preferences of the class of securities we own as compared with other classes of securities the portfolio company has issued. |
When the income approach is used to value warrants, the Company uses the Black-Scholes-Merton formula.
| 34 |
| B. | LONG-TERM FIXED-INCOME SECURITIES |
| 1. | Readily Marketable. Long-term fixed-income securities for which market quotations are readily available are valued using the most recent bid quotations when available. |
| 2. | Not Readily Marketable. Long-term fixed-income securities for which market quotations are not readily available are fair valued using the income approach. The factors that may be considered when valuing these types of securities by the income approach include: |
| · | Credit quality; |
| · | Interest rate analysis; |
| · | Quotations from broker-dealers; |
| · | Prices from independent pricing services that the Board believes are reasonably reliable; and |
| · | Reasonable price discovery procedures and data from other sources. |
| C. | SHORT-TERM FIXED-INCOME SECURITIES |
Short-term fixed-income securities are valued in the same manner as long-term fixed-income securities until the remaining maturity is 60 days or less, after which time such securities may be valued at amortized cost if there is no concern over payment at maturity.
D. INVESTMENTS IN INTELLECTUAL PROPERTY, PATENTS, RESEARCH AND DEVELOPMENT IN TECHNOLOGY OR PRODUCT DEVELOPMENT
Such investments are fair valued using the market approach. The Company may consider factors specific to these types of investments when using the market approach including:
| · | The cost of the Company’s investment; |
| · | Investments in the same or substantially similar intellectual property or patents or research and development in technology or product development or offers by responsible third parties; |
| · | The results of research and development; |
| · | Product development and milestone progress; |
| · | Commercial prospects; |
| · | Term of patent; |
| · | Projected markets; and |
| · | Other subjective factors. |
| 35 |
| E. | ALL OTHER SECURITIES |
All other securities are reported at fair value as determined in good faith by the Valuation Committee using the approaches for determining valuation as described above.
For all other securities, the reported values shall reflect the Valuation Committee's judgment of fair values as of the valuation date using the outlined basic approaches of valuation discussed in Section II. They do not necessarily represent an amount of money that would be realized if we had to sell such assets in an immediate liquidation. Thus, valuations as of any particular date are not necessarily indicative of amounts that we may ultimately realize as a result of future sales or other dispositions of investments we hold.
IV. Frequency of Valuation
The Valuation Committee shall value the Company’s investment assets (i) as of the end of each calendar quarter at the time sufficiently far in advance of filing of the Company’s reports on Form 10-Q and Form 10-K to enable preparation thereof, (ii) as of within 48 hours of pricing any common stock of the Company by the Company (exclusive of Sundays and holidays) unless the proposed sale price is at least 200 percent of any reasonable net asset value of such shares, and (iii) as of any other time requested by the Board of Directors.
V. Regular Review
The Chief Operating Officer and Chief Financial Officer shall review these Valuation Procedures on an annual basis to determine the continued appropriateness and accuracy of the methodologies used in valuing the Company’s investment assets, and will report any proposed modifications to these Valuation Procedures to the Board of Directors for consideration and approval.
The Chief Executive Officer, the Chief Operating Officer and the individuals responsible for preparing the Valuation Committee book shall meet quarterly before each Valuation Committee meeting to review the methodologies for the valuation of each security, and will highlight any changes to the Valuation Committee.
VI. Other Assets
Non-investment assets, such as fixtures and equipment, shall be valued using the cost approach less accumulated depreciation at rates determined by management and reviewed by the Audit Committee. Valuation of such assets is not the responsibility of the Valuation Committee.
| 36 |
|
NOTES TO CONSOLIDATED FINANCIAL STATEMENTS (Unaudited) |
NOTE 1. THE COMPANY
Harris & Harris Group, Inc. (the "Company," "us," "our" and "we"), is a non-diversified management investment company operating as a business development company ("BDC") under the Investment Company Act of 1940 (the "1940 Act") that specializes in making investments in companies commercializing and integrating products enabled by nanotechnology and microsystems. We operate as an internally managed investment company whereby our officers and employees, under the general supervision of our Board of Directors, conduct our operations.
H&H Ventures Management, Inc.SM ("Ventures") is a 100 percent wholly owned subsidiary of the Company. Ventures is taxed under Subchapter C (a "C Corporation") of the Internal Revenue Code of 1986 (the "Code"). Harris Partners I, L.P, is a limited partnership and, from time to time, may be used to hold certain interests in portfolio companies. The partners of Harris Partners I, L.P., are Ventures (sole general partner) and the Company (sole limited partner). Ventures pays taxes on income generated by its operations as well as on any non-passive investment income generated by Harris Partners I, L.P. For the period ended June 30, 2014, there was no non-passive investment income generated by Harris Partners I, L.P. Ventures, as the sole general partner, consolidates Harris Partners I, L.P. for financial reporting purposes. The Company consolidates its wholly owned subsidiary, Ventures, for financial reporting purposes.
NOTE 2. INTERIM FINANCIAL STATEMENTS
Our interim financial statements have been prepared in accordance with the instructions to Form 10-Q and Article 10 of Regulation S-X and in conformity with accounting principles generally accepted in the United States of America ("GAAP") applicable to interim financial information. Accordingly, they do not include all information and disclosures necessary for a fair statement of our financial position, results of operations and cash flows in conformity with GAAP for annual financial statements. In the opinion of management, these financial statements reflect all adjustments, consisting of valuation adjustments and normal recurring accruals, necessary for a fair statement of our financial position, results of operations and cash flows for such periods. The results of operations for any interim period are not necessarily indicative of the results for the full year. These financial statements should be read in conjunction with the financial statements and notes thereto contained in our Annual Report on Form 10-K for the fiscal year ended December 31, 2013.
NOTE 3. SUMMARY OF SIGNIFICANT ACCOUNTING POLICIES
The following is a summary of significant accounting policies followed in the preparation of the consolidated financial statements:
Principles of Consolidation. The consolidated financial statements have been prepared in accordance with GAAP and include the accounts of the Company and its wholly owned subsidiary. In accordance with GAAP and Regulation S-X, the Company may only consolidate its interests in investment company subsidiaries and controlled operating companies whose business consists of providing services to the Company. Our wholly owned subsidiary, Ventures, is a controlled operating company that provides services to us and is, therefore, consolidated. All significant inter-company accounts and transactions have been eliminated in consolidation. Certain prior period amounts have been reclassified to conform to the current period presentation.
| 37 |
Use of Estimates. The preparation of the consolidated financial statements in conformity with GAAP requires management to make estimates and assumptions that affect the reported amounts of assets and liabilities and contingent assets and liabilities and the reported amounts of revenues and expenses. Actual results could differ from these estimates, and the differences could be material. The most significant estimates relate to the fair valuations of our investments.
Portfolio Investment Valuations. Investments are stated at "value" as defined in the 1940 Act and in the applicable regulations of the Securities and Exchange Commission ("SEC") and in accordance with GAAP. Value, as defined in Section 2(a)(41) of the 1940 Act, is (i) the market price for those securities for which a market quotation is readily available and (ii) the fair value as determined in good faith by, or under the direction of, the Board of Directors for all other assets. (See "Valuation Procedures" in the "Footnote to Consolidated Schedule of Investments.") As of June 30, 2014, our financial statements include privately held investments fair valued at $93,009,936. The fair values of our privately held investments and warrants of Champions Oncology, Inc., a publicly traded company, were determined in good faith by, or under the direction of, the Board of Directors. Upon sale of investments, the values that are ultimately realized may be different from what is presently estimated. The difference could be material.
Cash. Cash includes demand deposits. Cash is carried at cost, which approximates fair value.
Unaffiliated Rights to Milestone Payments. At June 30, 2014, and December 31, 2013, the outstanding potential milestone payments from Amgen, Inc.’s acquisition of BioVex Group, Inc., were valued at $3,496,847 and $3,489,433, respectively. The milestone payments are derivatives and valued using the probability-adjusted, present value of proceeds from future payments that would be due upon successful completion of certain regulatory and sales milestones. If all remaining milestones are met, we would receive $9,526,393. There can be no assurance as to how much of this amount we will ultimately realize or when it will be realized, if at all. At June 30, 2014, the outstanding potential milestone payments from Canon, Inc.'s acquisition of Molecular Imprints, Inc., were valued at $630,257. If all remaining milestones are met, we would receive $1,735,582. There can be no assurance as to how much of this amount we will ultimately realize or when it will be realized, if at all. At June 30, 2014, and December 31, 2013, the outstanding potential milestone payments from Laird Technologies, Inc.’s acquisition of Nextreme Thermal Solutions, Inc., were valued at $0.
Receivable from Sales of Investments. At June 30, 2014, we had no receivables from sales of investments. At December 31, 2013, we had a receivable totaling $448,886 from the sales of 43,073 shares of Solazyme, Inc., which settled on January 2 and January 6, 2014, and 2,075 shares of Champions Oncology, Inc., which settled on January 3, 2014.
Funds Held in Escrow from Sale of Investment. At June 30, 2014, and December 31, 2013, there were funds held in escrow fair valued at $1,447,933 and $1,786,390, respectively, relating to the sales of Xradia, Inc., to Carl Zeiss AG and Molecular Imprints, Inc., to Canon, Inc. Funds held in escrow are valued using certain discounts applied to the amounts withheld. Funds held in escrow totaling $1,235,312 and $1,139,515 from the Xradia transaction were released in January and July of 2014, respectively. Funds held in escrow valued at $308,418 from the Molecular Imprints transaction are expected to be released in April of 2016 and April of 2017, net of any settlement of any indemnity claims and expenses related to the transaction. If the funds held in escrow for this transaction are released in full, we would receive $625,000 and realize a gain of $316,582.
| 38 |
Prepaid Expenses. We include prepaid insurance premiums and deferred financing charges in "Prepaid expenses." Prepaid insurance premiums are recognized over the term of the insurance contract and are included in "Insurance expense" in the Consolidated Statements of Operations. Deferred financing charges consist of fees and expenses paid in connection with the closing of loan facilities and are capitalized at the time of payment. Deferred financing charges are amortized over the term of the loan facility discussed in "Note 5. Debt." Amortization of the financing charges is included in "Interest and other debt expense" in the Consolidated Statements of Operations.
Property and Equipment. Property and equipment are included in "Other assets" and are carried at $220,754 and $246,138 at June 30, 2014, and December 31, 2013, respectively, representing cost, less accumulated depreciation of $394,678 and $375,600, respectively. Depreciation is provided using the straight-line method over the estimated useful lives of the property and equipment. We estimate the useful lives to be five to ten years for furniture and fixtures, three years for computer equipment, and the lesser of ten years or the remaining life of the lease for leasehold improvements. All of our fixed assets are pledged as collateral under the Company's four-year $20,000,000 Multi-Draw Term Loan Facility Credit Agreement, by and among the Company, as borrower, Orix Corporate Capital, Inc., as administrative agent and lender and the other lenders party thereto from time to time (the "Loan Facility").
Post Retirement Plan Liabilities. The Company provides a Retiree Medical Benefit Plan for employees who meet certain eligibility requirements. Until it was terminated on May 5, 2011, the Company also provided an Executive Mandatory Retirement Benefit Plan for certain individuals employed by us in a bona fide executive or high policy-making position. The net periodic postretirement benefit cost for the year is determined as the sum of service cost for the year and interest on the accumulated postretirement benefit obligation. Unrecognized actuarial gains and losses are recognized as net periodic benefit cost pursuant to the Company's historical accounting policy. The impact of plan amendments are amortized over the service period as a component of "Accumulated other comprehensive income."
Interest Income Recognition. Interest income, including amortization of premium and accretion of discount, is recorded on an accrual basis. When accrued interest is determined to not be recoverable, the Company ceases accruing interest and writes off any previously accrued interest. Securities are deemed to be non-income producing if, on their last interest or dividend date, no cash was paid or no cash or in-kind dividends were declared. These write-offs are reversed through interest income. During the three months and six months ended June 30, 2014, the Company earned $71,029 and $144,592, respectively, in interest on U.S. government securities, senior secured debt, participation agreements, subordinated secured debt, non-convertible promissory notes and interest-bearing accounts. During the three months and six months ended June 30, 2013, the Company earned $80,608 and $175,817, respectively, in interest on U.S. government securities, senior secured debt, participation agreements, subordinated secured debt, non-convertible promissory notes and interest-bearing accounts. During the three months and six months ended June 30, 2014, the Company recorded, on a net basis, $62,806 and $135,534, respectively, of bridge note interest. The total for the six months ended June 30, 2014, includes a partial write-off of previously accrued bridge note interest of $1,392. During the three months and six months ended June 30, 2013, the Company recorded $79,355 and $139,236, respectively, of bridge note interest.
| 39 |
Loan Fees. Loan fees received in connection with our venture debt investments are deferred. The unearned fee income is accreted into income based on the effective interest method over the life of the investment. Total loan fees accreted into investment income were $16,757 and $32,262 for the three months and six months ended June 30, 2014, respectively. Total loan fees accreted into investment income were $15,140 and $27,467 for the three months and six months ended June 30, 2013, respectively.
Call Options. The Company writes covered call options on publicly traded securities with the intention of earning option premiums. Option premiums may increase the Company’s realized gains and, therefore, may help increase distributable income, but may limit the realized gains on the security. When a Company writes (sells) an option, an amount equal to the premium received by the Company is recorded in the Consolidated Statements of Assets and Liabilities as a liability. The amount of the liability is subsequently marked-to-market to reflect the current market value of the option written. When an option expires, the Company realizes a gain on the option to the extent of the premiums received. Premiums received from writing options that are exercised or closed are added to the proceeds or offset against the amount paid on the transaction to determine the realized gain or loss. At June 30, 2014, and December 31, 2013, the Company had 50,000 and 150,000 shares, respectively, of Solazyme, Inc., covered by call option contracts. In the event these contracts are exercised, the Company would be required to deliver those shares to the counterparty.
Stock-Based Compensation. The Company has a stock-based employee compensation plan. The Company accounts for the Amended and Restated Harris & Harris Group, Inc. 2012 Equity Incentive Plan (the "Stock Plan") by determining the fair value of all share-based payments to employees, including the fair value of grants of employee stock options and restricted stock awards, and records these amounts as an expense in the Consolidated Statements of Operations over the vesting period with a corresponding increase to our additional paid-in capital. At June 30, 2014, and December 31, 2013, the increase to our operating expenses was offset by the increase to our additional paid-in capital, resulting in no net impact to our net asset value. Additionally, the Company does not record the potential tax benefits associated with the expensing of stock options or restricted stock because the Company currently intends to qualify as a regulated investment company ("RIC") under Subchapter M of the Code, and the deduction attributable to such expensing, therefore, is unlikely to provide any additional tax savings. The amount of non-cash, stock-based compensation expense recognized in the Consolidated Statements of Operations is based on the fair value of the awards the Company expects to vest, recognized over the vesting period on a straight-line basis for each award, and adjusted for actual awards vested and pre-vesting forfeitures. The forfeiture rate is estimated at the time of grant and revised, if necessary, in subsequent periods if the actual forfeiture rate differs from the estimated rate and is accounted for in the current period and prospectively. See "Note 9. Stock-Based Compensation" for further discussion.
Rent expense. Our lease at 1450 Broadway, New York, New York, commenced on January 21, 2010. The lease expires on December 31, 2019. The base rent is $36 per square foot with a 2.5 percent increase per year over the 10 years of the lease, subject to a full abatement of rent for four months and a rent credit for six months throughout the lease term. Certain leasehold improvements were also paid for on our behalf by the landlord, the cost of which is accounted for as property and equipment and "Deferred rent" in the accompanying Consolidated Statements of Assets and Liabilities. These leasehold improvements are depreciated over the lease term. We also lease office space in California and North Carolina. We apply these rent abatements, credits, escalations and landlord payments on a straight-line basis in the determination of rent expense over the lease term.
| 40 |
Realized Gain or Loss and Unrealized Appreciation or Depreciation of Portfolio Investments. Realized gain or loss is recognized when an investment is disposed of and is computed as the difference between the Company's cost basis in the investment at the disposition date and the net proceeds received from such disposition. Realized gains and losses on investment transactions are determined by specific identification. Unrealized appreciation or depreciation is computed as the difference between the fair value of the investment and the cost basis of such investment.
Income Taxes. As we intend to qualify as a RIC under Subchapter M of the Code, the Company does not accrue for income taxes. The Company has capital loss carryforwards that can be used to offset net realized capital gains. The Company recognizes interest and penalties in income tax expense. We pay federal, state and local income taxes on behalf of our wholly owned subsidiary, Ventures, which is a C corporation. See "Note 10. Income Taxes" for further discussion.
Foreign Currency Translation. The accounting records of the Company are maintained in U.S. dollars. All assets and liabilities denominated in foreign currencies are translated into U.S. dollars based on the rate of exchange of such currencies against U.S. dollars on the date of valuation. The Company does not isolate the portion of the results of operations that arises from changes in foreign currency rates on investments held on its Consolidated Statements of Operations. For the three months ended June 30, 2014, included in the net decrease in unrealized depreciation on investments was an unrealized gain of $206,811 resulting from foreign currency translation. For the six months ended June 30, 2014, included in the net decrease in unrealized depreciation on investments was an unrealized loss of $9,162 resulting from foreign currency translation. For the three months and six months ended June 30, 2013, included in the net decrease in unrealized depreciation on investments was an unrealized loss of $197,041 and $310,047, respectively, resulting from foreign currency translation.
Securities Transactions. Securities transactions are accounted for on the date the transaction for the purchase or sale of the securities is entered into by the Company (i.e., trade date).
Concentration of Credit Risk. The Company places its cash and cash equivalents with financial institutions and, at times, cash held in depository accounts may exceed the Federal Deposit Insurance Corporation insured limit.
Recent Accounting Pronouncements. In May 2014, the FASB issued ASU 2014-09, "Revenue from Contracts with Customers (Topic 606)," which is the new comprehensive revenue recognition standard that will supersede all existing revenue recognition guidance under GAAP. The standard's core principle is that a company will recognize revenue when it transfers promised goods or services to a customer in an amount that reflects the consideration to which the company expects to be entitled in exchange for those goods or services. This ASU is effective for annual and interim periods beginning on or after December 15, 2016, and early adoption is not permitted. Entities will have the option of using either a full retrospective approach or a modified approach to adopt the guidance in the ASU. The Company is currently evaluating the impact of adopting this guidance.
In June 2014, the FASB issued ASU 2014-12, "Compensation - Stock Compensation (Topic 718): Accounting for Share-Based Payments When the Terms of an Award Provide That a Performance Target Could be Achieved after the Requisite Service Period." This ASU provides more explicit guidance for treating share-based payment awards that require a specific performance target that affects vesting and that could be achieved after the requisite service period as a performance condition. The new guidance is effective for annual and interim reporting periods beginning after December 15, 2015. The Company does not expect the adoption of this guidance to have a material impact on the consolidated financial statements.
| 41 |
NOTE 4. BUSINESS RISKS AND UNCERTAINTIES
We invest primarily in privately held companies, the securities of which are inherently illiquid. We also have investments in small publicly traded companies. Although these companies are publicly traded, their stock may not trade at high volumes and prices can be volatile, which may restrict our ability to sell our positions. These privately held and publicly traded businesses tend to not have attained profitability, and many of these businesses also lack management depth and have limited or no history of operations. Because of the speculative nature of our investments and the lack of a liquid market for and restrictions on transfers of privately held investments, there is greater risk of loss relative to traditional marketable investment securities.
We do not choose investments based on a strategy of diversification. We also do not rebalance the portfolio should one of our portfolio companies increase in value substantially relative to the rest of the portfolio. Therefore, the value of our portfolio may be more vulnerable to microeconomic events affecting a single sector, industry or portfolio company and to general macroeconomic events that may be unrelated to our portfolio companies. These factors may subject the value of our portfolio to greater volatility than a company that follows a diversification strategy. As of June 30, 2014, and December 31, 2013, our largest 10 investments by value accounted for approximately 79 percent and 75 percent, respectively, of the value of our equity-focused venture capital portfolio, excluding the rights to milestone payments. Our largest three investments, by value, Adesto Technologies Corporation, HZO, Inc., and Metabolon, Inc., accounted for approximately 16 percent, 12 percent and 12 percent, respectively, of our equity-focused venture capital portfolio as of June 30, 2014. Adesto Technologies, HZO and Metabolon are privately held portfolio companies. As of December 31, 2013, our largest three investments, by value, Adesto Technologies Corporation, Metabolon, Inc., and Molecular Imprints, Inc., accounted for approximately 17 percent, 12 percent and 9 percent, respectively, of our equity-focused venture capital portfolio.
Approximately 97 percent of the portion of our equity-focused venture capital portfolio that was fair valued was comprised of securities of 26 privately held companies and warrants of one publicly traded company. Because there is typically no public or readily ascertainable market for our interests in the small privately held companies in which we invest, the valuation of the securities in that portion of our portfolio is determined in good faith by our Valuation Committee, which is comprised of all of the independent members of our Board of Directors. The values are determined in accordance with our Valuation Procedures and are subject to significant estimates and judgments. The fair value of the securities in our portfolio may differ significantly from the values that would be placed on these securities if a ready market for the securities existed. Any changes in valuation are recorded in our Consolidated Statements of Operations as "Net decrease (increase) in unrealized depreciation on investments." Changes in valuation of any of our investments in privately held companies from one period to another may be significant.
| 42 |
NOTE 5. DEBT
On September 30, 2013, the Company terminated the $10,000,000 Revolving Loan Agreement by and between the Company and TD Bank, N.A., dated February 24, 2011. At the date of termination, there was no principal outstanding under this credit facility, and no termination fees were incurred in connection with ending this credit facility.
On September 30, 2013, the Company entered into a four-year $20,000,000 Multi-Draw Term Loan Facility Credit Agreement, by and among the Company, as borrower, Orix Corporate Capital, Inc., as administrative agent and lender and the other lenders party thereto from time to time (the "Loan Facility") that may be used by the Company to fund investments in portfolio companies. The Loan Facility replaces the Company’s prior credit facility with TD Bank, NA. The Loan Facility, among other things, matures on September 30, 2017, and bears interest at 10 percent per annum in cash. The Company has the option to have interest accrue at a rate of 13.5 percent per annum if the Company decides not to pay interest in cash monthly. The Company currently plans to pay interest in cash if and when any borrowings are outstanding. The Loan Facility also requires payment of a draw fee on each borrowing equal to 1.0 percent of such borrowing and an unused commitment fee of 1.0 percent per annum. Fee payments under the Loan Facility are made quarterly in arrears. The Company may prepay the loans or reduce the aggregate commitments under the Loan Facility at any time prior to the maturity date, as long as certain conditions are met, including payment of required prepayment or termination fees. The Loan Facility is secured by all of the assets of the Company and its wholly owned subsidiaries, subject to certain customary exclusions. The Loan Facility contains certain affirmative and negative covenants, including without limitation: (a) maintenance of certain minimum liquidity requirements; (b) maintenance of an eligible asset leverage ratio of not less than 4.0:1.0; (c) limitations on liens; (d) limitations on the incurrence of additional indebtedness; and (e) limitations on structural changes, mergers and disposition of assets (other than in the normal course of our business activities).
At June 30, 2014, and December 31, 2013, the Company had no outstanding debt. The weighted average annual interest rate for the three months and six months ended June 30, 2014, was zero percent, exclusive of amortization of closing fees and other expenses. The weighted average debt outstanding for the three months and six months ended June 30, 2014, was $0. The remaining capacity under the Loan Facility was $20,000,000 at June 30, 2014. Fees and expenses of $700,000 related to establishing the Loan Facility have been deferred and included as "Prepaid expenses" as of June 30, 2014. These amounts are amortized over the term of the Loan Facility, and $87,440 was amortized in the six months ended June 30, 2014. At June 30, 2014, the Company was in compliance with all covenants required by the Loan Facility.
| 43 |
NOTE 6. FAIR VALUE OF INVESTMENTS
At June 30, 2014, our financial assets were categorized as follows in the fair value hierarchy:
| Fair Value Measurement at Reporting Date Using: | ||||||||||||||||
| Description | June 30, 2014 | Unadjusted
Quoted Prices in Active Markets for Identical Assets (Level 1) | Significant
Other Observable Inputs (Level 2) | Significant
Unobservable Inputs (Level 3) | ||||||||||||
| Privately Held Portfolio Companies: | ||||||||||||||||
| Preferred Stock | $ | 82,918,390 | $ | 0 | $ | 0 | $ | 82,918,390 | ||||||||
| Bridge Notes | 2,514,976 | 0 | 0 | 2,514,976 | ||||||||||||
| Warrants | 921,633 | 0 | 0 | 921,633 | ||||||||||||
| Rights to Milestone Payments | 4,127,104 | 0 | 0 | 4,127,104 | ||||||||||||
| Common Stock | 546,767 | 0 | 0 | 546,767 | ||||||||||||
| Senior Secured Debt | 1,305,901 | 0 | 0 | 1,305,901 | ||||||||||||
| Participation Agreement | 675,165 | 0 | 0 | 675,165 | ||||||||||||
| Publicly Traded Portfolio Companies: | ||||||||||||||||
| Common Stock | $ | 3,112,895 | $ | 3,112,895 | $ | 0 | $ | 0 | ||||||||
| Total Investments: | $ | 96,122,831 | $ | 3,112,895 | $ | 0 | $ | 93,009,936 | ||||||||
| Funds Held in Escrow From | ||||||||||||||||
| Sales of Investments: | $ | 1,447,933 | $ | 0 | $ | 0 | $ | 1,447,933 | ||||||||
| Total Financial Assets: | $ | 97,570,764 | $ | 3,112,895 | $ | 0 | $ | 94,457,869 | ||||||||
| Liabilities: | ||||||||||||||||
| Written Call Options | $ | 47,500 | $ | 47,500 | $ | 0 | $ | 0 | ||||||||
| Total Liabilities: | $ | 47,500 | $ | 47,500 | $ | 0 | $ | 0 | ||||||||
Significant Unobservable Inputs
The table below presents the valuation technique and quantitative information about the significant unobservable inputs utilized by the Company in the fair value measurements of Level 3 assets. Unobservable inputs are those inputs for which little or no market data exists and, therefore, require an entity to develop its own assumptions.
| 44 |
| Fair
Value at June 30, 2014 |
Valuation
Technique(s) |
Unobservable Input | Range
(Weighted Average(a)) | |||||||
| Private Offering Price | $1.38 ($1.38) | |||||||||
| Probability of Exit Outcomes | 25% - 75% (b) | |||||||||
| Preferred Stock | $ | 3,749,795 | Hybrid Approach | Probability of Achieving Milestones | 26% - 80% (b) | |||||
| Probability of Exit Outcomes | 0% - 100% (b) | |||||||||
| Preferred Stock | 0 | Income Approach | Probability of Achieving Milestones | 0% - 100% (b) | ||||||
| Private Offering Price | $0.10 - $3.91 ($1.74) | |||||||||
| Non-Performance Risk | 0% - 94% (2.1%) | |||||||||
| Revenue Multiples | 1.26 - 8.80 (2.94) | |||||||||
| Illiquidity Discounts | 20% - 30% (23.1%) | |||||||||
| Preferred Stock | 79,168,595 | Market Approach | Probability of Exit Outcomes | 0% - 100% (b) | ||||||
| 1,293,877 | Income Approach | Private Offering Price | $1.00 ($1.00) | |||||||
| Bridge Notes | 1,221,099 | Market Approach | Non-Performance Risk | 0% (0%) | ||||||
| Private Offering Price | $0.001 - $1.076 ($0.92) | |||||||||
| Common Stock | 546,767 | Market Approach | Non-Performance Risk | 0% (0%) | ||||||
| Warrants | 921,633 | Black-Sholes- Merton Model |
Stock Price Volatility Expected Term |
$0.00 - $2.76 ($1.17) 64.3% - 107% (104%) 0.16 - 9.60 Years (4.0) | ||||||
| Rights to Milestone Payments |
4,127,104 | Probability Weighted Discounted Cash Flow |
Probability of Achieving Independent Milestones
Probability of Achieving Dependent Milestones |
0% - 80% (b) 0% - 30% (b) | ||||||
| Participation Agreements(c) |
675,165 | Income Approach | Warrant Adjusted Effective Yield Effective Yield Non-Performance Risk Participation Payment Risk Stock Price Volatility Expected Term |
22.8% (22.8%) 22.8% (22.8%) 0% (0%) 0% (0%) $0.09 - $0.50 ($0.46) 107% (107%) 3.22 - 7.75 Years (3.89) | ||||||
| Senior Secured Debt | 1,305,901 | Income Approach | Effective Yield Non-Performance Risk |
15.8% (6.7%) 0% (0%) | ||||||
| Funds Held in Escrow From Sales of Investments |
1,447,933 | Escrow Discounts | 0 - 50% (11%) | |||||||
| Total |
$ | 94,457,869 | ||||||||
(a) Weighted average based on fair value at June 30, 2014.
(b) Weighted average has not been disclosed owing to the wide range of possible values.
(c) In connection with our investments in participation agreements in GEO Semiconductor, Inc., and OHSO Clean, Inc., we received warrants to purchase stock. See "Warrants" for a discussion of the valuation methodology used.
Valuation Methodologies and Inputs for Level 3 Assets
The following sections describe the valuation techniques and significant unobservable inputs used to measure Level 3 assets.
| 45 |
Preferred Stock, Bridge Notes and Common Stock
Preferred stock, bridge notes and common stock are valued by either a market, income or hybrid approach using internal models with inputs, most of which are not market observable. Common inputs for valuing Level 3 preferred stock, bridge note and private common stock investments include: prices from recently executed private transactions in a company’s securities or unconditional firm offers, revenue multiples of comparable publicly traded companies, M&A transactions consummated by comparable companies, discounts for lack of marketability, rights and preferences of the class of securities we own as compared with other classes of securities the portfolio company has issued, particularly related to potential liquidity scenarios of an IPO or an acquisition transaction, and management’s best estimate of risk attributable to non-performance risk. Certain securities are valued using the present value of future cash flows. We define non-performance risk as the risk that the price per share (or implied valuation of a portfolio company) or the effective yield of a debt security of a portfolio company, as applicable, does not appropriately represent the risk that a portfolio company with negative cash flow will be: (a) unable to raise capital, will need to be shut down and will not return our invested capital; or (b) able to raise capital, but at a valuation significantly lower than the implied post-money valuation of the last round of financing. We assess non-performance risk for each private portfolio company quarterly. Our assessment of non-performance risk typically includes an evaluation of the financial condition and operating results of the company, the company's progress towards milestones, and the long-term potential of the business and technology of the company and how this potential may or may not affect the value of the shares owned by us. An increase to the non-performance risk or a decrease in the private offering price of a future round of financing from that of the most recent round would result in a lower fair value measurement and/or a change in the distribution of value among the classes of securities we own.
Bridge notes commonly contain terms that provide for the conversion of the full amount of principal, and sometimes interest, into shares of preferred stock at a defined price per share and/or the price per share of the next round of financing. The use of a discount for non-performance risk in the valuation of bridge notes would indicate the potential for conversion of only a portion of the principal, plus interest when applicable, into shares of preferred stock or the potential that a conversion event will not occur and that the likely outcome of a liquidation of assets would result in payment of less than the remaining principal outstanding of the note. An increase in non-performance risk would result in a lower fair value measurement.
Warrants
We use the Black-Scholes-Merton option-pricing model to determine the fair value of warrants held in our portfolio. Option pricing models, including the Black-Scholes-Merton model, require the use of subjective input assumptions, including expected volatility, expected life, expected dividend rate, and expected risk-free rate of return. In the Black-Scholes-Merton model, variations in the expected volatility or expected term assumptions have a significant impact on fair value. Because certain securities underlying the warrants in our portfolio are not publicly traded, many of the required input assumptions are more difficult to estimate than they would be if a public market for the underlying securities existed.
| 46 |
An input to the Black-Scholes-Merton option-pricing model is the value per share of the type of stock for which the warrant is exercisable as of the date of valuation. This input is derived according to the methodologies discussed in "Preferred Stock, Bridge Notes and Common Stock."
Rights to Milestone Payments
Rights to milestone payments are valued using a probability-weighted discounted cash flow model. As part of Amgen Inc.’s acquisition of our former portfolio company, BioVex Group, Inc., we are entitled to potential future milestone payments based upon the achievement of certain regulatory and sales milestones. We are also entitled to future milestone payments from Laird Technologies Inc.'s acquisition of our former portfolio company, Nextreme Thermal Solutions, Inc., and from Canon, Inc.'s acquisition of Molecular Imprints, Inc. We assign probabilities to the achievements of the various milestones. Milestones identified as independent milestones can be achieved irrespective of the achievement of other contractual milestones. Dependent milestones are those that can only be achieved after another, or series of other, milestones are achieved. The interest rates used in these models are observable inputs from sources such as the Federal Reserve published interest rates.
Participation Agreements and Senior Secured Debt
We invest in venture debt investments through participation agreements and senior secured debt. We value these securities using an income approach. The income approach uses valuation techniques to convert future amounts (for example, cash flows or earnings) to a single present value amount (discounted). The measurement is based on the value indicated by current market expectations about those future amounts. Common inputs for valuing Level 3 debt investments include: the effective yield of the debt investment or, in the case where we have received warrant coverage, the warrant-adjusted effective yield of the security, adjustments for changes in the yields of comparable publicly traded high-yield debt funds and risk-free interest rates and an assessment of non-performance risk. For those debt investments made through participation agreements, we include discounts for the risk of breach of the participation agreements. For venture debt investments, an increase in yields would result in a lower fair value measurement. Furthermore, yields would decrease, and value would increase, if the company is exceeding targets and risk has been substantially reduced from the level of risk that existed at the time of investment. Yields would increase, and values would decrease, if the company is failing to meet its targets and risk has been increased from the level of risk that existed at the time of investment.
| 47 |
The following chart shows the components of change in the financial assets categorized as Level 3 for the three months ended June 30, 2014.
| Beginning Balance 4/1/2014 | Total Realized Gains (Losses) Included in Changes in Net Assets | Transfers | Total
Unrealized (Depreciation) Appreciation Included in Changes in Net Assets | Investments in Portfolio Companies, Interest on Bridge Notes, and Amortization of Loan Fees, Net | Disposals | Ending Balance 6/30/2014 | Amount of Total (Depreciation) Appreciation for the Period Included in Changes in Net Assets Attributable to the Change in Unrealized Gains or Losses Relating to Assets Still Held at the Reporting Date | |||||||||||||||||||||||||
| Preferred Stock | $ | 70,633,956 | $ | 4,263,420 | $ | 1,897,462 | 1,2 | $ | 5,720,997 | $ | 6,889,016 | $ | (6,486,461 | ) | $ | 82,918,390 | $ | 5,549,964 | ||||||||||||||
| Bridge Notes | 5,402,815 | 0 | (3,653,987 | )1 | 68,236 | 697,912 | 0 | 2,514,976 | 68,236 | |||||||||||||||||||||||
| Common Stock | 108,668 | 0 | 436,605 | 1 | 1,494 | 0 | 0 | 546,767 | 1,494 | |||||||||||||||||||||||
| Warrants | 740,070 | 0 | 65,250 | 1 | 72,946 | 43,367 | 0 | 921,633 | 72,946 | |||||||||||||||||||||||
| Rights to Milestone Payments | 3,491,600 | 0 | 629,670 | 1 | 5,834 | 0 | 0 | 4,127,104 | 5,834 | |||||||||||||||||||||||
| Participation Agreements | 757,797 | 0 | 0 | (40,708 | ) | 1,276 | (43,200 | ) | 675,165 | (40,708 | ) | |||||||||||||||||||||
| Senior Secured Debt | 1,466,451 | 0 | 0 | (92,510 | ) | 15,481 | (83,521 | ) | 1,305,901 | (92,510 | ) | |||||||||||||||||||||
| Funds Held in Escrow From Sales of Investments | 551,294 | 271,639 | 625,000 | 2 | 0 | 0 | 0 | 1,447,933 | 0 | |||||||||||||||||||||||
| Total | $ | 83,152,651 | $ | 4,535,059 | $ | 0 | $ | 5,736,289 | $ | 7,647,052 | $ | (6,613,182 | ) | $ | 94,457,869 | $ | (5,565,256 | ) | ||||||||||||||
| 1 | Transfers among asset classes are owing to conversions at financing events. These do not represent transfers in or out of Level 3. |
| 2 | There was a $625,000 transfer from "Preferred Stock" into "Funds Held in Escrow From Sales of Investments" owing to the sale of Molecular Imprints, Inc., to Canon, Inc. |
We elected to use the beginning of period values to recognize transfers in and out of Level 3 investments. For the three months ended June 30, 2014, there were no transfers out of Level 3.
| 48 |
The following chart shows the components of change in the financial assets categorized as Level 3 for the six months ended June 30, 2014.
| Beginning Balance 1/1/2014 | Total Realized Gains (Losses) Included in Changes in Net Assets | Transfers | Total
Unrealized (Depreciation) Appreciation Included in Changes in Net Assets | Investments in Portfolio Companies, Interest on Bridge Notes, and Amortization of Loan Fees, Net | Disposals | Ending Balance 6/30/2014 | Amount of Total (Depreciation) Appreciation for the Period Included in Changes in Net Assets Attributable to the Change in Unrealized Gains or Losses Relating to Assets Still Held at the Reporting Date | |||||||||||||||||||||||||
| Preferred Stock | $ | 71,577,059 | $ | (2,986,113 | ) | $ | 2,746,327 | 1,2 | $ | 10,226,545 | $ | 7,841,033 | $ | (6,486,461 | ) | $ | 82,918,390 | $ | 2,805,979 | |||||||||||||
| Bridge Notes | 6,044,114 | (50,000 | ) | (4,502,852 | )1 | (1,124,325 | ) | 2,148,039 | 0 | 2,514,976 | (1,174,325 | ) | ||||||||||||||||||||
| Common Stock | 108,668 | 0 | 436,605 | 1 | 1,494 | 0 | 0 | 546,767 | 1,494 | |||||||||||||||||||||||
| Warrants | 800,487 | 0 | 65,250 | 1 | (45,038 | ) | 100,934 | 0 | 921,633 | (45,038 | ) | |||||||||||||||||||||
| Rights to Milestone Payments | 3,489,433 | 0 | 629,670 | 1 | 8,001 | 0 | 0 | 4,127,104 | 8,001 | |||||||||||||||||||||||
| Participation Agreements | 777,195 | 0 | 0 | (18,231 | ) | 2,601 | (86,400 | ) | 675,165 | (18,231 | ) | |||||||||||||||||||||
| Senior Secured Debt | 1,511,828 | 0 | 0 | (97,276 | ) | 29,660 | (138,311 | ) | 1,305,901 | (97,276 | ) | |||||||||||||||||||||
| Funds Held in Escrow From Sales of Investments | 1,786,390 | 271,858 | 625,000 | 2 | 0 | 0 | (1,235,315 | ) | 1,447,933 | 0 | ||||||||||||||||||||||
| Total | $ | 86,095,174 | $ | (2,764,255 | ) | $ | 0 | $ | 8,951,170 | $ | 10,122,267 | $ | (7,946,487 | ) | $ | 94,457,869 | $ | 1,480,604 | ||||||||||||||
| 1 | Transfers among asset classes are owing to conversions at financing events. These do not represent transfers in or out of Level 3. |
| 2 | There was a $625,000 transfer from "Preferred Stock" into "Funds Held in Escrow From Sales of Investments" owing to the sale of Molecular Imprints, Inc., to Canon, Inc. |
For the six months ended June 30, 2014, there were no transfers out of Level 3.
| 49 |
At December 31, 2013, our financial assets were categorized as follows in the fair value hierarchy:
| Fair Value Measurement at Reporting Date Using: | ||||||||||||||||
| Description | December 31, 2013 | Unadjusted Quoted Prices in Active Markets for Identical Assets (Level 1) | Significant Other Observable Inputs (Level 2) | Significant Unobservable Inputs (Level 3) | ||||||||||||
| U.S. Government Securities: | $ | 18,999,810 | $ | 18,999,810 | $ | 0 | $ | 0 | ||||||||
| Privately Held Portfolio Companies: | ||||||||||||||||
| Preferred Stock | $ | 71,577,059 | $ | 0 | $ | 0 | $ | 71,577,059 | ||||||||
| Bridge Notes | 6,044,114 | 0 | 0 | 6,044,114 | ||||||||||||
| Warrants | 800,487 | 0 | 0 | 800,487 | ||||||||||||
| Rights to Milestone Payments | 3,489,433 | 0 | 0 | 3,489,433 | ||||||||||||
| Common Stock | 108,668 | 0 | 0 | 108,668 | ||||||||||||
| Senior Secured Debt | 1,511,828 | 0 | 0 | 1,511,828 | ||||||||||||
| Participation Agreement | 777,195 | 0 | 0 | 777,195 | ||||||||||||
| Non-Convertible Promissory Note | 4,043,381 | 0 | 4,043,381 | 0 | ||||||||||||
| Publicly Traded Portfolio Companies: | ||||||||||||||||
| Common Stock | $ | 5,547,294 | $ | 5,547,294 | $ | 0 | $ | 0 | ||||||||
| Total Investments: | $ | 112,899,269 | $ | 24,547,104 | $ | 4,043,381 | $ | 84,308,784 | ||||||||
| Funds Held in Escrow From | ||||||||||||||||
| Sales of Investments: | $ | 1,786,390 | $ | 0 | $ | 0 | $ | 1,786,390 | ||||||||
| Total Financial Assets: | $ | 114,685,659 | $ | 24,547,104 | $ | 4,043,381 | $ | 86,095,174 | ||||||||
| Liabilities: | ||||||||||||||||
| Written Call Options | $ | 103,500 | $ | 103,500 | $ | 0 | $ | 0 | ||||||||
| Total Liabilities: | $ | 103,500 | $ | 103,500 | $ | 0 | $ | 0 | ||||||||
| 50 |
The following chart shows the components of change in the financial assets categorized as Level 3 for the twelve months ended December 31, 2013.
| Beginning Balance 1/1/2013 | Total Realized Gains (Losses) Included in Changes in Net Assets | Transfers | Total
Unrealized (Depreciation) Appreciation Included in Changes in Net Assets | Investments in Portfolio Companies, Interest on Bridge Notes, and Amortization of Loan Fees, Net | Disposals | Ending Balance 12/31/2013 | Amount of Total (Depreciation) Appreciation for the Period Included in Changes in Net Assets Attributable to the Change in Unrealized Gains or Losses Relating to Assets Still Held at the Reporting Date | |||||||||||||||||||||||||
| Preferred Stock | $ | 78,615,582 | $ | 10,006,915 | $ | 1,817,476 | 1 | $ | (17,635,033 | ) | $ | 12,779,034 | $ | (14,006,915 | ) | $ | 71,577,059 | $ | (9,331,349 | ) | ||||||||||||
| Bridge Notes | 4,152,634 | 0 | (1,822,831 | )1 | (1,078,514 | ) | 4,792,825 | 0 | 6,044,114 | (1,078,514 | ) | |||||||||||||||||||||
| Common Stock | 108,667 | (4,384,762 | ) | 0 | 4,384,762 | 1 | 0 | 108,668 | 0 | |||||||||||||||||||||||
| Warrants | 586,320 | 0 | 5,355 | 1 | 188,412 | 20,400 | 0 | 800,487 | 188,412 | |||||||||||||||||||||||
| Rights to Milestone Payments | 3,400,734 | 0 | 0 | 88,699 | 0 | 0 | 3,489,433 | 88,699 | ||||||||||||||||||||||||
| Participation Agreements | 1,138,148 | 90,255 | 0 | (22,807 | ) | 5,966 | (434,367 | ) | 777,195 | 39,896 | ||||||||||||||||||||||
| Subordinated Secured Debt | 120,410 | 15,058 | 0 | (10,836 | ) | 368 | (125,000 | ) | 0 | 0 | ||||||||||||||||||||||
| Senior Secured Debt | 1,075,870 | 0 | 0 | 397,325 | 339,907 | (301,274 | ) | 1,511,828 | 397,325 | |||||||||||||||||||||||
| Non-Convertible Promissory Note | 3,033,338 | 0 | (3,033,338 | ) | 0 | 0 | 0 | 0 | 0 | |||||||||||||||||||||||
| Publicly Traded Common Stock | 1,348,227 | 0 | (1,547,827 | ) | 0 | 199,600 | 0 | 0 | 0 | |||||||||||||||||||||||
| Funds Held in Escrow From Sales of Investments | 1,052,345 | 766,448 | 0 | 0 | 1,168,671 | (1,201,074 | ) | 1,786,390 | 0 | |||||||||||||||||||||||
| Total | $ | 94,632,275 | $ | 6,493,914 | $ | (4,581,165 | ) | $ | (13,687,992 | ) | $ | 19,306,772 | $ | (16,068,630 | ) | $ | 86,095,174 | $ | (9,695,531 | ) | ||||||||||||
| 1 | Transfers among asset classes are owing to conversions at financing events. These do not represent transfers in or out of Level 3. |
We elected to use the beginning of period values to recognize transfers in and out of Level 2 and Level 3 investments. For the year ended December 31, 2013, there were transfers out of Level 3 totaling $4,581,165. Our shares of Champions Oncology, Inc., transferred from a Level 3 investment to a Level 1 investment owing to the market for the shares becoming active with increased and sustained trading volume and the lapse of restrictions on 626,523 shares that were previously restricted. Our non-convertible promissory note in Molecular Imprints, Inc., transferred from a Level 3 investment to a Level 2 investment owing to an acquisition offer.
| 51 |
The following chart shows the components of change in the financial assets categorized as Level 3 for the three months ended June 30, 2013.
| Beginning Balance 4/1/2013 | Total Realized Gains (Losses) Included in Changes in Net Assets | Transfers | Total Unrealized (Depreciation) Appreciation Included in Changes in Net Assets | Investments
in Portfolio Companies, Interest on Bridge Notes, and Amortization of Loan Fees, Net | Disposals | Ending Balance 6/30/2013 | Amount of Total (Depreciation) Appreciation for the Period Included in Changes in Net Assets Attributable to the Change in Unrealized Gains or Losses Relating to Assets Still Held at the Reporting Date | |||||||||||||||||||||||||
| Preferred Stock | $ | 79,279,756 | $ | 0 | $ | 352,838 | 1 | $ | (1,505,819 | ) | $ | 3,836,373 | $ | 0 | $ | 81,963,148 | $ | (1,505,819 | ) | |||||||||||||
| Bridge Notes | 5,213,314 | 0 | (352,838 | )1 | 1,129,927 | 815,430 | 0 | 6,805,833 | 1,129,927 | |||||||||||||||||||||||
| Common Stock | 108,667 | 0 | 0 | 0 | 0 | 0 | 108,667 | 0 | ||||||||||||||||||||||||
| Warrants | 544,844 | 0 | 0 | 213,699 | 20,000 | 0 | 778,543 | 213,699 | ||||||||||||||||||||||||
| Rights to Milestone Payments | 3,404,812 | 0 | 0 | (21,092 | ) | 0 | 0 | 3,383,720 | (21,092 | ) | ||||||||||||||||||||||
| Participation Agreements | 1,146,618 | 90,255 | 0 | (78,070 | ) | 1,427 | (352,117 | ) | 808,113 | 5,900 | ||||||||||||||||||||||
| Subordinated Secured Debt | 129,500 | 15,058 | 0 | (19,558 | ) | 0 | (125,000 | ) | 0 | 0 | ||||||||||||||||||||||
| Senior Secured Debt | 1,388,150 | 0 | 0 | 117,299 | 13,710 | (73,905 | ) | 1,445,254 | 117,299 | |||||||||||||||||||||||
| Non-Convertible Promissory Note | 3,033,338 | 0 | 0 | 0 | 0 | 0 | 3,033,338 | 0 | ||||||||||||||||||||||||
| Publicly Traded Common Stock | 1,551,880 | 0 | (1,348,227 | ) | 464,220 | 0 | 0 | 667,873 | 464,220 | |||||||||||||||||||||||
| Total | $ | 95,800,879 | $ | 105,313 | $ | (1,348,227 | ) | $ | 300,606 | $ | 4,686,940 | $ | (551,022 | ) | $ | 98,994,489 | $ | 404,134 | ||||||||||||||
| 1 | Transfers among asset classes are owing to conversions at financing events. These do not represent transfers in or out of Level 3. |
We elected to use the beginning of period values to recognize transfers in and out of Level 3 investments. For the three months ended June 30, 2013, there were transfers out of Level 3 totaling $1,348,227. Our unrestricted shares of Champions Oncology, Inc., transferred from a Level 3 investment to a Level 1 investment owing to the market for the shares becoming active with increased and sustained trading volume.
| 52 |
The following chart shows the components of change in the financial assets categorized as Level 3 for the six months ended June 30, 2013.
| Beginning Balance 1/1/2013 | Total Realized Gains (Losses) Included in Changes in Net Assets | Transfers | Total Unrealized (Depreciation) Appreciation Included in Changes in Net Assets | Investments in Portfolio Companies, Interest on Bridge Notes, and Amortization of Loan Fees, Net | Disposals | Ending Balance 6/30/2013 | Amount of Total (Depreciation) Appreciation for the Period Included in Changes in Net Assets Attributable to the Change in Unrealized Gains or Losses Relating to Assets Still Held at the Reporting Date | |||||||||||||||||||||||||
| Preferred Stock | $ | 78,615,582 | $ | 0 | $ | 425,448 | 1 | $ | (1,405,355 | ) | $ | 4,327,473 | $ | 0 | $ | 81,963,148 | $ | (1,405,355 | ) | |||||||||||||
| Bridge Notes | 4,152,634 | 0 | (430,803 | )1 | 734,086 | 2,349,916 | 0 | 6,805,833 | 734,086 | |||||||||||||||||||||||
| Common Stock | 108,667 | (4,384,762 | ) | 0 | 4,384,762 | 0 | 0 | 108,667 | 0 | |||||||||||||||||||||||
| Warrants | 586,320 | 0 | 5,355 | 1 | 166,468 | 20,400 | 0 | 778,543 | 166,468 | |||||||||||||||||||||||
| Rights to Milestone Payments | 3,400,734 | 0 | 0 | (17,014 | ) | 0 | 0 | 3,383,720 | (17,014 | ) | ||||||||||||||||||||||
| Participation Agreements | 1,138,148 | 90,255 | 0 | (40,347 | ) | 3,224 | (383,167 | ) | 808,113 | 22,356 | ||||||||||||||||||||||
| Subordinated Secured Debt | 120,410 | 15,058 | 0 | (10,836 | ) | 368 | (125,000 | ) | 0 | 0 | ||||||||||||||||||||||
| Senior Secured Debt | 1,075,870 | 0 | 0 | 115,117 | 373,873 | (119,606 | ) | 1,445,254 | 115,117 | |||||||||||||||||||||||
| Non-Convertible Promissory Note | 3,033,338 | 0 | 0 | 0 | 0 | 0 | 3,033,338 | 0 | ||||||||||||||||||||||||
| Publicly Traded Common Stock | 1,348,227 | 0 | (1,348,227 | ) | 468,273 | 199,600 | 0 | 667,873 | 468,273 | |||||||||||||||||||||||
| Total | $ | 93,579,930 | $ | (4,279,449 | ) | $ | (1,348,227 | ) | $ | 4,395,154 | $ | 7,274,854 | $ | (627,773 | ) | $ | 98,994,489 | $ | 83,931 | |||||||||||||
| 1 | Transfers among asset classes are owing to conversions at financing events. These do not represent transfers in or out of Level 3. |
For the six months ended June 30, 2013, there were transfers out of Level 3 totaling $1,348,227. Our unrestricted shares of Champions Oncology, Inc., transferred from a Level 3 investment to a Level 1 investment owing to the market for the shares becoming active with increased and sustained trading volume.
| 53 |
NOTE 7. DERIVATIVES
The Company has written covered call options on its holdings of one of its publicly traded portfolio companies in exchange for the receipt of a premium. The option provides the holder the right, but not the obligation, to purchase the shares on which the option is held at a specified price over a specified future period. The call options were sold at a strike price above the market price on the date of the sale allowing the Company to receive potential appreciation in addition to the premium.
Transactions in written call options during the six months ended June 30, 2014, were as follows:
| Number of Contracts | Premium | |||||||
| Call options outstanding at December 31, 2013 | 1,500 | $ | 112,382 | |||||
| Call options written | 1,500 | 342,735 | ||||||
| Call options expired | (1,000 | ) | (197,309 | ) | ||||
| Call options called in assignment transactions | 0 | 0 | ||||||
| Call options terminated in closing transactions | (1,500 | ) | (112,382 | ) | ||||
| Call options outstanding at June 30, 2014 | 500 | $ | 145,426 | |||||
At June 30, 2014, and December 31, 2013, we had rights to milestone payments from Amgen, Inc.’s acquisition of our former portfolio company, BioVex Group, Inc. These milestone payments were fair valued at $3,496,847 and $3,489,433, respectively, and are contingent upon certain milestones being achieved in the future. At June 30, 2014, and December 31, 2013, we had rights to milestone payments from Laird Technologies, Inc.'s acquisition of our former portfolio company, Nextreme Thermal Solutions, Inc. These milestone payments were fair valued at $0 as of June 30, 2014, and December 31, 2013. At June 30, 2014, we had rights to milestone payments from Canon, Inc.'s acquisition of our former portfolio company, Molecular Imprints, Inc. These milestone payments were fair valued at $630,257 as of June 30, 2014.
The following tables present the value of derivatives held at June 30, 2014, and the effect of derivatives held during the three months ended June 30, 2014, along with the respective location in the financial statements.
| 54 |
Statements of Assets and Liabilities:
| Assets | Liabilities | |||||||||||||||
| Derivatives | Location | Fair Value | Location | Fair Value | ||||||||||||
| Equity Contracts | — | — | Written call options payable | $ | 47,500 | |||||||||||
| Amgen, Inc. Rights to Milestone Payments from Acquisition of BioVex Group, Inc. |
Investments | $ | 3,496,847 | — | — | |||||||||||
| Laird Technologies, Inc. Rights to Milestone Payments from Acquisition of Nextreme Thermal Solutions, Inc. | Investments | $ | 0 | — | — | |||||||||||
| Canon, Inc. Rights to Milestone Payments from Acquisition of Molecular Imprints, Inc. |
Investments | $ | 630,257 | — | — | |||||||||||
Statements of Operations:
| Derivatives | Location | Realized (Loss)/Gain | Change in unrealized Appreciation/ (Depreciation) | |||||||
| Equity Contracts | Net Realized and Unrealized (Loss) Gain | $ | 86,653 | $ | 89,044 | |||||
| Amgen, Inc. Rights to Milestone Payments from Acquisition of BioVex Group, Inc. | Net Realized and Unrealized (Loss) Gain | $ | 0 | $ | 7,414 | |||||
| Laird Technologies, Inc. Rights to Milestone Payments from Acquisition of Nextreme Thermal Solutions, Inc. | Net Realized and Unrealized (Loss) Gain | $ | 0 | $ | 0 | |||||
| Canon, Inc. Rights to Milestone Payments from Acquisition of Molecular Imprints, Inc. | Net Realized and Unrealized (Loss) Gain | $ | 0 | $ | 587 | |||||
NOTE 8. EMPLOYEE BENEFITS
We administer a plan to provide medical and dental insurance for retirees and their spouses who, at the time of their retirement, have 10 years of service with us and have attained 50 years of age or have attained 45 years of age and have 15 years of service with us (the "Medical Benefit Retirement Plan"). On March 7, 2013, the Board of Directors amended this Medical Benefit Retirement Plan. The amendment limits the medical benefit to $10,000 per year for a period of ten years. The amendment does not affect benefits accrued by former employees or one current employee who is grandfathered under the former terms of the plan.
Our accumulated postretirement benefit obligation was remeasured as of the plan amendment date, which resulted in a $1,101,338 decrease in our liability. A deferred gain of $1,101,338 owing to this amendment was included in "Accumulated other comprehensive income" as of March 31, 2013. This amount is being amortized over a service period of 5.27 years. During the three months and six months ended June 30, 2014, a total of $52,246 and $104,492, respectively, was amortized and included as a reduction of "Salaries, benefits and stock-based compensation" on our Consolidated Statements of Operations.
| 55 |
NOTE 9. STOCK-BASED COMPENSATION
The Company maintains the Stock Plan, which provides for the grant of equity-based awards of stock options to our officers and employees and restricted stock to our officers, employees and non-employee directors subject to compliance with the 1940 Act and an exemptive order granted on April 3, 2012, by the SEC permitting us to award shares of restricted stock (the "Exemptive Order").
Stock Option Awards
During the six months ended June 30, 2014, and the year ended December 31, 2013, the Compensation Committee of the Board of Directors of the Company did not grant any stock options.
For the three months and six months ended June 30, 2014, the Company recognized $45,325 and $92,758, respectively, of compensation expense in the Consolidated Statements of Operations related to stock options. As of June 30, 2014, there was no unrecognized compensation cost related to unvested stock option awards. For the three months and six months ended June 30, 2013, the Company recognized $58,401 and $118,420, respectively, of compensation expense in the Consolidated Statements of Operations related to stock options.
For the six months ended June 30, 2014, and June 30, 2013, no options were exercised.
A summary of the changes in outstanding stock options for the six months ended June 30, 2014, is as follows:
| Weighted | Weighted Average | |||||||||||||||||||
| Weighted | Average | Remaining | Aggregate | |||||||||||||||||
| Average | Grant Date | Contractual | Intrinsic | |||||||||||||||||
| Shares | Exercise Price | Fair Value | Term (Years) | Value | ||||||||||||||||
| Options Outstanding at January 1, 2014 | 1,425,372 | $ | 9.77 | $ | 6.27 | 2.68 | $ | 0 | ||||||||||||
| Granted | 0 | 0 | 0 | 0 | ||||||||||||||||
| Exercised | 0 | 0 | 0 | 0 | ||||||||||||||||
| Forfeited or Expired | 0 | 0 | 0 | 0 | ||||||||||||||||
| Options Outstanding at June 30, 2014 | 1,425,372 | $ | 9.77 | $ | 6.27 | 2.18 | $ | 0 | ||||||||||||
| Options Exercisable at June 30, 2014 | 1,425,372 | $ | 9.77 | $ | 6.27 | 2.18 | $ | 0 | ||||||||||||
| Options Exercisable and Expected to be Exercisable at June 30, 2014 | 1,425,372 | $ | 9.77 | $ | 6.27 | 2.18 | $ | 0 | ||||||||||||
The aggregate intrinsic value in the table above with respect to options outstanding, exercisable and expected to be exercisable, is calculated as the difference between the Company's closing stock price of $3.18 on June 30, 2014, and the exercise price, multiplied by the number of in-the-money options. This amount represents the total pre-tax intrinsic value that would have been received by the option holders had all options been fully vested and all option holders exercised their awards on June 30, 2014.
| 56 |
Restricted Stock
On June 11, 2012, the Compensation Committee granted the employees a total of 1,780,000 shares of restricted stock. A total of 1,068,000 awards (60 percent) vest when the volume-weighted stock price is at or above pre-determined stock price targets over a 30-day period. These pre-determined stock price targets range from $5.00 per share to $9.00 per share. The remaining 712,000 of these shares (40 percent) have vesting dates ranging from December 31, 2012, through June 30, 2017, based on the employee's continued service to the Company. After this initial employee grant, the Compensation Committee does not plan to grant additional restricted stock to existing employees until at least June 11, 2015. On March 6, 2014, the Compensation Committee granted 26,360 shares of restricted stock to a new employee under service terms and volume weighted market price conditions matching those of the June 11, 2012, employee grant. Pursuant to the Exemptive Order, non-employee directors receive up to 2,000 shares of restricted stock annually, which vest pro rata over a three-year period from the date of the grant. On June 7, 2012, the non-employee directors received a grant of 14,000 shares of restricted stock. On May 2, 2013, an additional 12,000 shares of restricted stock were granted to the non-employee directors. On May 1, 2014, an additional 14,000 shares of restricted stock were granted to the non-employee directors.
The compensation expense for the service-based award is determined by the market price of our stock at the date of grant applied to the total number of shares we anticipate to fully vest. The market price for the March 6, 2014, employee service-based award was $3.05.
The compensation expense for the market-based award is determined by the fair value of the award applied to the number of shares granted, net of estimated forfeitures. The fair value of the market-based award granted on March 6, 2014, was determined using a lattice model. The fair value of this award ranges from $2.40 per share to $2.64 per share and will be expensed over derived service periods ranging from approximately 44 to 86 months.
On June 30, 2014, a total of 144,000 shares of restricted stock were forfeited in connection with the voluntary termination of one of our employees. As a result, compensation cost of $128,004 related to these awards was reversed, which reduced stock-based compensation cost for the period. For the three months and six months ended June 30, 2014, we recognized $143,162 and $404,876, respectively, of compensation expense related to restricted stock awards. As of June 30, 2014, there was unrecognized compensation cost of $2,524,687 related to restricted stock awards. This cost is expected to be recognized over a weighted average period of approximately 1.6 years.
Non-vested restricted stock awards as of June 30, 2014, and changes during the six months ended June 30, 2014, were as follows:
| Shares | Weighted-Average Grant Date Fair Value Per Share | |||||||
| Outstanding at January 1, 2014 | 1,504,518 | $ | 2.78 | |||||
| Granted | 40,360 | 3.01 | ||||||
| Vested based on service | (48,226 | ) | 3.32 | |||||
| Shares withheld related to net share settlement of restricted stock | (21,658 | ) | 3.37 | |||||
| Forfeited | (144,000 | ) | 2.75 | |||||
| Outstanding at June 30, 2014 | 1,330,994 | $ | 2.76 | |||||
| 57 |
Under net settlement procedures currently applicable to our outstanding restricted stock awards for current employees, upon each settlement date, restricted stock awards are withheld to cover the required withholding tax, which is based on the value of the restricted stock award on the settlement date as determined by the closing price of our common stock on the vesting date. The remaining amounts are delivered to the recipient as shares of our common stock. On June 30, 2014, 40,222 restricted stock awards were net settled by withholding 21,658 shares, which represented the employees' minimum statutory obligation for each such employee's applicable income and other employment taxes and remitted cash totaling of $68,872 to the appropriate tax authorities. The amount remitted to the tax authorities for the employees' tax obligation was reflected as a financing activity within our Consolidated Statements of Cash Flows. The shares withheld by us as a result of the net settlement of restricted stock awards are not considered issued and outstanding, thereby reducing our shares outstanding used to calculate net asset value per share.
NOTE 10. INCOME TAXES
We have elected to be treated as a RIC under the Code and operate in a manner so as to qualify for the tax treatment applicable to RICs.
In order to qualify as a RIC, we must, in general, (1) annually, derive at least 90 percent of our gross income from dividends, interest, gains from the sale of securities and similar sources; (2) quarterly, meet certain investment diversification requirements; and (3) annually, distribute at least 90 percent of our investment company taxable income as a dividend. We may either distribute or retain our net capital gain from investments, but any net capital gain not distributed will be subject to corporate income tax and the excise tax described below to the extent not offset by the capital loss carryforward. We currently intend to consider designating net capital gains for distribution as "cash dividends," "designated undistributed capital gains" or "deemed dividends" or some combination thereof. We will be subject to a four percent excise tax to the extent we fail to distribute at least 98 percent of our annual net ordinary income and 98.2 percent of our capital gain net income and would be subject to income tax to the extent we fail to distribute 100 percent of our investment company taxable income. As of January 1, 2014, we had capital loss carryforwards of $3,876,148, which we intend to use to offset current year capital gains, if any. During the six months ended June 30, 2014, we realized net capital losses of $1,344,075.
Because of the specialized nature of our investment portfolio, we generally can satisfy the diversification requirements under the Code if we receive a certification from the SEC pursuant to Section 851(e) of the Code that we are "principally engaged in the furnishing of capital to other corporations which are principally engaged in the development or exploitation of inventions, technological improvements, new processes, or products not previously generally available."
We have received SEC certification since 1999, including for 2012, pursuant to Section 851(e) of the Code. There can be no assurance that we will qualify for or receive certification for 2013 or subsequent years (to the extent we need additional certification) or that we will actually qualify for Subchapter M treatment in subsequent years. In addition, under certain circumstances, even if we qualified for Subchapter M treatment in a given year, we might take action in a subsequent year to ensure that we would be taxed in that subsequent year as a C Corporation, rather than as a RIC.
| 58 |
For the three months ended June 30, 2014, and 2013, we paid $0 and $161, respectively, in federal, state and local taxes. For the six months ended June 30, 2014, and 2013, we paid $15,986 and $22,171, respectively, in federal, state and local taxes. At June 30, 2014, and 2013, we had $0 accrued for federal, state and local taxes payable by the Company.
We pay federal, state and local taxes primarily related to sublease income generated by Ventures, which is taxed as a C Corporation. For the three months ended June 30, 2014, and 2013, our income tax expense for Ventures was $0 and $161, respectively. For the six months ended June 30, 2014, and 2013, our income tax expense for Ventures was $15,057 and $21,241, respectively.
NOTE 11. CHANGE IN NET ASSETS PER SHARE
The following table sets forth the computation of basic and diluted per share net increases (decreases) in net assets resulting from operations for the three months and six months ended June 30, 2014, and June 30, 2013.
| For the Three Months Ended June 30 | For the Six Months Ended June 30 | |||||||||||||||
| 2014 | 2013 | 2014 | 2013 | |||||||||||||
| Numerator for increase (decrease) in net assets per share | $ | 4,328,055 | $ | 4,104,761 | $ | (2,147,622 | ) | $ | 2,044,569 | |||||||
| Denominator for basic weighted average shares | 31,201,574 | 31,118,358 | 31,199,518 | 31,117,624 | ||||||||||||
| Basic net increase (decrease) in net assets per share resulting from operations | $ | 0.14 | $ | 0.13 | $ | (0.07 | ) | $ | 0.07 | |||||||
| Denominator for diluted weighted average shares | 31,202,697 | 31,118,358 | 31,199,518 | 31,117,624 | ||||||||||||
| Diluted net increase (decrease) in net assets per share resulting from operations1 | $ | 0.14 | $ | 0.13 | $ | (0.07 | ) | $ | 0.07 | |||||||
| Anti-dilutive shares by type: | ||||||||||||||||
| Stock Options | 1,425,372 | 1,425,372 | 1,425,372 | 1,425,372 | ||||||||||||
| Restricted Stock | 352,871 | 491,125 | 353,994 | 487,191 | ||||||||||||
| Total anti-dilutive shares | 1,778,243 | 1,916,497 | 1,779,366 | 1,912,563 | ||||||||||||
1A total of 977,000 and 1,068,000 market-based shares of restricted stock were outstanding at June 30, 2014, and June 30, 2013, respectively. These shares vest when the volume-weighted stock price is at or above pre-determined stock price targets over a 30-day period. These pre-determined stock price targets range from $5.00 per share to $9.00 per share. These shares were not included in the computation of diluted net asset value per share because as of the end of the reporting period none of the pre-determined stock price targets were met.
For the three months ended June 30, 2014, the calculation of net increase in net assets resulting from operations per diluted share includes 1,123 shares of restricted stock because such shares were dilutive. For the six months ended June 30, 2014, the calculation of net decrease in net assets resulting from operations per diluted share does not include any stock options or restricted stock awards because such awards were anti-dilutive. Stock options and restricted stock awards may be dilutive in future periods in which there are both a net increase in net assets resulting from operations and either significant increases in our average stock price or significant decreases in the amount of unrecognized compensation cost during the period.
| 59 |
NOTE 12. SUBSEQUENT EVENTS
On July 11, 2014, the Company made a $209,020 follow-on investment in OpGen, Inc., a privately held portfolio company.
On July 15, 2014, we received $1,139,515 upon the release of the remaining funds held in escrow from the acquisition of Xradia, Inc., by Carl Zeiss AG during 2013.
On July 21, 2014, the Company made a $216,012 new investment in Accelerator IV – New York Corporation, a privately held portfolio company.
On July 31, 2014, Enumeral Biomedical Corp. completed a reverse merger into a publicly traded shell company, Enumeral Biomedical Holdings, Inc. The operations of Enumeral Biomedical Corp. became those of the surviving entity. Simultaneously with the merger, the Company made a $1.5 million investment in Enumeral Biomedical Holdings. Enumeral Biomedical Holdings is traded publicly on the OTC market under the symbol ENUM. The Company's securities of Enumeral Biomedical Holdings will be subject to a lock-up agreement for up to 18 months from the date of the close of the merger. ENUM's stock closed trading on August 7, 2014, at $2.00 per share.
On August 1, 2014, the Company received $549,238 in payment of the outstanding principal, interest and warrants of OHSO Clean, Inc.
| 60 |
|
FINANCIAL HIGHLIGHTS (Unaudited) |
| Three Months Ended June 30 | Six Months Ended June 30 | |||||||||||||||
| 2014 | 2013 | 2014 | 2013 | |||||||||||||
| Per Share Operating Performance | ||||||||||||||||
| Net asset value per share, beginning | ||||||||||||||||
| of period | $ | 3.73 | $ | 4.11 | $ | 3.93 | $ | 4.13 | ||||||||
| Net operating loss* | (0.07 | ) | (0.06 | ) | (0.13 | ) | (0.12 | ) | ||||||||
| Net realized gain (loss) on investments* | 0.18 | 0.24 | (0.04 | ) | 0.13 | |||||||||||
| Net increase (decrease) in unrealized | ||||||||||||||||
| appreciation on investments and written call options (1) | 0.03 | (0.05 | ) | 0.10 | 0.06 | |||||||||||
| Total from investment operations* | 0.14 | 0.13 | (0.07 | ) | 0.07 | |||||||||||
| Net increase as a result of stock- | ||||||||||||||||
| based compensation expense* | 0.01 | 0.01 | 0.02 | 0.02 | ||||||||||||
| Net decrease as a result of acquisition | ||||||||||||||||
| of vested restricted stock awards related to employee withholding | (0.01 | ) | (0.01 | ) | (0.01 | ) | (0.01 | ) | ||||||||
| Total (decrease) increase from capital | ||||||||||||||||
| stock transactions | 0.00 | 0.00 | 0.01 | 0.01 | ||||||||||||
| Net increase as a result of other | ||||||||||||||||
| comprehensive income* | 0.00 | 0.00 | 0.00 | 0.03 | ||||||||||||
| Net increase (decrease) in net asset value | 0.14 | 0.13 | (0.06 | ) | 0.11 | |||||||||||
| Net asset value per share, end | ||||||||||||||||
| of period | $ | 3.87 | $ | 4.24 | $ | 3.87 | $ | 4.24 | ||||||||
| Stock price per share, end | ||||||||||||||||
| of period | $ | 3.18 | $ | 3.04 | $ | 3.18 | $ | 3.04 | ||||||||
| Total return based on stock price | (8.36 | )% | (15.56 | )% | 6.71 | % | (7.88 | )% | ||||||||
| Supplemental Data: | ||||||||||||||||
| Net assets, end of period | $ | 120,878,223 | $ | 132,063,889 | $ | 120,878,223 | $ | 132,063,889 | ||||||||
| Ratio of expenses to average | ||||||||||||||||
| net assets | 1.9 | % | 1.7 | % | 3.6 | % | 3.3 | % | ||||||||
| Ratio of net operating loss to | ||||||||||||||||
| average net assets | (1.8 | )% | (1.5 | )% | (3.4 | )% | (3.0 | )% | ||||||||
| Average debt outstanding | $ | 0.00 | $ | 0.00 | $ | 0.00 | $ | 0.00 | ||||||||
| Average debt per share | $ | 0.00 | $ | 0.00 | $ | 0.00 | $ | 0.00 | ||||||||
| Number of shares outstanding, | ||||||||||||||||
| end of period | 31,245,664 | 31,159,256 | 31,245,664 | 31,159,256 | ||||||||||||
* Based on Average Shares Outstanding
(1) Net unrealized gains (losses) includes rounding adjustments to reconcile change in net asset value per share. See "Item 2. Management's Discussion and Analysis of Financial Condition and Results of Operations" for a description of unrealized losses on investments.
The accompanying unaudited notes are an integral part of this schedule.
| 61 |
| Item 2. | Management's Discussion and Analysis of Financial Condition and Results of Operations |
The information contained in this section should be read in conjunction with the Company's unaudited June 30, 2014, Consolidated Financial Statements and the Company's audited 2013 Consolidated Financial Statements and notes thereto.
Cautionary Statement Regarding Forward-Looking Statements
This Quarterly Report on Form 10-Q contains forward-looking statements that involve substantial risks and uncertainties. These forward-looking statements are not historical facts, but rather are based on current expectations, estimates and projections about the Company, our current and prospective portfolio investments, our industry, our beliefs, and our assumptions. Words such as "anticipates," "expects," "intends," "plans," "will," "may," "continue," "believes," "seeks," "estimates," "would," "could," "should," "targets," "projects," and variations of these words and similar expressions are intended to identify forward-looking statements. The forward-looking statements contained in this Quarterly Report involve risks and uncertainties, including statements as to:
| • | our future operating results; |
| • | our business prospects and the prospects of our portfolio companies; |
| • | the impact of investments that we expect to make; |
| • | our contractual arrangements and relationships with third parties; |
| • | the dependence of our future success on the general economy and its impact on the industries in which we invest; |
| • | the ability of our portfolio companies to achieve their objectives; |
| • | our expected financings and investments; |
| • | the adequacy of our cash resources and working capital; and |
| • | the timing of cash flows, if any, from the operations and/or monetization of our positions in our portfolio companies. |
These statements are not guarantees of future performance and are subject to risks, uncertainties, and other factors, some of which are beyond our control and difficult to predict and could cause actual results to differ materially from those expressed or forecasted in the forward-looking statements, including without limitation:
| • | an economic downturn could impair our portfolio companies’ ability to continue to operate, which could lead to the loss of some or all of our investments in such portfolio companies; |
| 62 |
| • | a contraction of available credit and/or an inability to access the equity markets could impair our investment activities; |
| • | interest rate volatility could adversely affect our results, particularly if we elect to use leverage as material part of our venture debt investment strategy; |
| • | currency fluctuations could adversely affect the results of our investments in foreign companies, particularly to the extent that we receive payments denominated in foreign currency rather than U.S. dollars; and |
| • | the risks, uncertainties and other factors we identify in "Risk Factors" and elsewhere in this Quarterly Report on Form 10-Q and in our other filings with the SEC. |
Although we believe that the assumptions on which these forward-looking statements are based are reasonable, any of those assumptions could prove to be inaccurate, and, as a result, the forward-looking statements based on those assumptions also could be inaccurate. Important assumptions include our ability to originate new investments, certain margins and levels of profitability and the availability of additional capital. In light of these and other uncertainties, the inclusion of a projection or forward-looking statement in this Quarterly Report on Form 10-Q should not be regarded as a representation by us that our plans and objectives will be achieved. These risks and uncertainties include those described or identified in "Risk Factors" and elsewhere in this Quarterly Report on Form 10-Q. You should not place undue reliance on these forward-looking statements, which apply only as of the date of this Quarterly Report on Form 10-Q.
We incorporated under the laws of the state of New York in August 1981. In 1983, we completed an initial public offering ("IPO"). In 1984, we divested all of our assets except Otisville BioTech, Inc., and became a financial services company with the investment in Otisville as the initial focus of our business activity.
In 1992, we registered as an investment company under the 1940 Act, commencing operations as a closed-end, non-diversified investment company. In 1995, we elected to become a BDC subject to the provisions of Sections 55 through 65 of the 1940 Act.
We believe we provide five core benefits to our shareholders. First, we are an established firm with a positive track record of investing in venture capital-backed companies as further discussed in "Investments and Current Investment Pace" on page 70. Second, we provide shareholders with access to disruptive science-enabled companies, particularly ones that are enabled by BIOLOGY+ that would otherwise be difficult to access or inaccessible for most current and potential shareholders. Third, we have an existing portfolio of companies at varying stages of maturity that provide for a potential pipeline of investment returns over time. Fourth, we are able to invest opportunistically in a range of types of securities to take advantage of market inefficiencies. Fifth, we provide access to venture capital investments in a vehicle that, unlike private venture capital firms, has permanent capital, is transparent and is liquid.
| 63 |
We build transformative companies from disruptive science. We make venture capital investments in companies enabled by multidisciplinary, disruptive science. We define venture capital investments as the money and resources made available to privately held and publicly traded small businesses with exceptional growth potential.
As of June 30, 2014, we had 26 equity-focused companies in our portfolio that have yet to complete liquidity events (e.g., IPOs or M&A transactions). This does not include 1) our publicly traded shares of Solazyme, Inc., and Champions Oncology, Inc.; 2) our three venture debt deals, GEO Semiconductor Inc., Nano Terra, Inc., and OHSO Clean, Inc.; and 3) our rights to milestone payments from Amgen, Inc., Laird Technologies, Inc., and Canon, Inc. As of June 30, 2014, we valued our 26 privately held equity-focused companies at $87,501,325. Including the companies referenced above, we valued our total venture capital portfolio at $96,122,831 as of June 30, 2014. At June 30, 2014, from first dollar in, the average and median holding periods for the 26 privately held equity-focused investments were 5.7 years and 5.9 years, respectively. Historically, as measured from first dollar in to last dollar out, the average and median holding periods for the 71 investments we have exited were 4.5 years and 3.4 years, respectively.
Our execution strategy over the next five years has four parts: 1) Realize returns to increase shareholder value; 2) Invest for growth to increase shareholder value; 3) Partner to more effectively create value; and 4) Return value to our shareholders.
"Realize" refers to realizing value in our venture capital portfolio. Since our investment in Otisville in 1983 through June 30, 2014, we have made a total of 99 equity-focused venture capital investments. We have completely exited 71 of these 99 investments and partially exited through the sale of shares and/or the sale of call options covered by shares of two of these 99 investments, recognizing aggregate net realized gains of $87,516,147 on invested capital of $123,625,446, or 1.7 times invested capital. For the securities of the 26 companies in our equity-focused portfolio held at June 30, 2014, we have net unrealized depreciation of $20,535,785 on invested capital of $108,037,110. We have aggregate net realized gains on our exited companies offset by unrealized depreciation for our 26 currently held equity-focused investments of $66,980,362 on invested capital of $231,662,556.
The amount of net realized gains includes:
| · | Realized gains of $19,957,011 from the sale of BioVex Group, Inc., to Amgen, Inc., the sale of Innovalight, Inc., to DuPont, the sale of Crystal IS, Inc., to Asahi Kasei Group, the sale of Xradia, Inc., to Carl Zeiss AG, and the sale of the semiconductor lithography equipment business of Molecular Imprints, Inc., to Canon, Inc. We had invested a total of $18,231,340 in these five portfolio companies; |
| · | Realized gains of $17,801,322 from the sale of shares of Solazyme, Inc., on invested capital of $5,326,098. In addition, we generated $1,612,184 in realized gains on our sale and/or purchase of written call option and put option contracts covered by our shares of Solazyme, Inc.; |
| · | Realized gains of $296,972 from the sale of shares of Champions Oncology, Inc., on invested capital of $576,971; and |
| 64 |
| · | Realized loss of $4,839,811, including call options, on our investment in NeoPhotonics Corporation on invested capital of $7,299,590. |
| · | Realized loss of $7,299,533 on our investment in Kovio, Inc., on invested capital of $7,299,533. On January 21, 2014, substantially all of Kovio's assets were sold by Square 1 Bank, Kovio's secured creditor, to Thin Film Electronics ASA. Our shares were subsequently declared worthless on February 19, 2014. |
The aggregate net realized gains and the cumulative invested capital do not reflect the cost or value of our shares of Solazyme, Inc., and Champions Oncology, Inc., that we owned as of June 30, 2014, or the premiums received on open option contracts of Solazyme of $145,426. The aggregate net realized gains also do not include potential milestone payments that could occur as part of the acquisitions of BioVex Group, Inc., Nextreme Thermal Solutions, Inc., or Molecular Imprints, Inc., at points in time in the future. If these amounts were included as of June 30, 2014, our aggregate net realized gains and cumulative invested capital from 1983 through June 30, 2014, would be $96,374,295 and $129,287,595, respectively, or 1.8 times invested capital.
Recent and Potential Liquidity Events From Our Portfolio as of June 30, 2014
On July 15, 2014, we received the remaining escrow payment of $1,139,515 from Carl Zeiss AG's acquisition of Xradia, Inc., which was completed on July 19, 2013. As of June 30, 2014, we valued the funds held in escrow from the sale of Xradia at $1,139,515.
On April 18, 2014, Canon, Inc., completed its acquisition of Molecular Imprints, Inc.'s semiconductor lithography equipment business. We received $6,486,461 at the close of the transaction and could receive an additional $625,000 from amounts held in escrow as well as up to $1.7 million upon the achievement of certain milestones. We have not received any milestone payments as of June 30, 2014, and there can be no assurance as to the timing and how much of this amount we will ultimately realize in the future, if any. With the closing of the transaction, a new spin-out company, which retained the name "Molecular Imprints, Inc.," was formed. This new company will continue development and commercialization of nanoscale patterning in consumer and biomedical applications. We are a shareholder of this new company. As of June 30, 2014, we valued potential milestone payments from the sale of Molecular Imprints at $630,257.
As of June 30, 2014, we valued potential milestone payments from the sale of BioVex Group, Inc., at $3,496,847. If all the remaining milestone payments were to be paid by Amgen, Inc., we would receive $9,526,393. We have not received any milestone payments as of June 30, 2014, and there can be no assurance as to the timing and how much of this amount we will ultimately realize in the future, if any. As of June 30, 2014, we valued potential milestone payments from the sale of Nextreme Thermal Solutions, Inc., to Laird Technologies, Inc., at $0.
On February 27, 2014, the board of directors of Contour Energy Systems, Inc., adopted a plan of complete liquidation and dissolution. Following the sale of Contour Energy's assets and settlement of its liabilities, any remaining proceeds will be distributed to its shareholders. We do not expect to receive any proceeds from this distribution. At June 30, 2014, we valued our investment in Contour Energy at $0.
| 65 |
On July 31, 2014, Enumeral Biomedical Corp. completed a reverse merger into a publicly traded shell company, Enumeral Biomedical Holdings, Inc. The operations of Enumeral Biomedical Corp. became those of the surviving entity. Simultaneously with the merger, the Company made a $1.5 million investment in Enumeral Biomedical Holdings. Enumeral Biomedical Holdings is traded publicly on the OTC market under the symbol ENUM. The Company's securities of Enumeral Biomedical Holdings will be subject to a lock-up agreement for up to 18 months from the date of the close of the merger. ENUM's stock closed trading on August 7, 2014, at $2.00 per share.
On August 1, 2014, the Company received $549,238 in payment of the outstanding principal, interest and warrants of OHSO Clean, Inc.
Our companies often plan for and/or begin the process of pursuing potential sales and/or IPOs of those companies by hiring bankers and/or advisors to attempt to pursue such liquidity events. We consider these efforts to be in the ordinary course of business for those companies until the potential and timing of a transaction become tangible through events such as acceptance of letters of intent to acquire a company and/or the beginning of a road show to pursue an IPO.
Strategy for Managing Publicly Traded Positions
During the six months ended June 30, 2014, our strategy for managing our publicly traded positions has generated $119,697 in net cash proceeds from premiums on call options sold of Solazyme, Inc. We also sold 117,834 shares of Solazyme in open market transactions for proceeds, net of commission, of $1,407,520. The net increase in our primary liquidity from these transactions was $1,527,217. Through June 30, 2014, we have generated $2,469,676 in net cash premiums on call options sold and put options purchased of Solazyme since the company completed an IPO in May 2011. We have sold a total of 2,254,149 shares of Solazyme since its IPO for net proceeds, after commission, of $22,400,495 or an average sale price of $9.94 per share. Including premiums from call and put options, the average sale price for these shares was $11.03 per share. Our cost basis in Solazyme is $2.36 per share.
As of June 30, 2014, our remaining 50,000 shares of Solazyme are under the following option contracts:
| No. of Shares | Expiration Date | Strike Price | ||||
| 50,000 | September 20, 2014 | $ | 12.50 | |||
During the six months ended June 30, 2014, we sold 575,756 shares of our position in Champions Oncology, Inc., in open market transactions for net proceeds, after commission, of $636,259 or an average sale price of $1.11 per share. Our average cost basis in Champions is $0.67 per share.
These increases in primary liquidity are important for our efforts to continue to fund existing and new portfolio companies that could generate future investment returns.
| 66 |
Maturity of Current Equity-Focused Venture Capital Portfolio
There are three main drivers of our potential growth in value over the next five years. First, we have a larger portfolio of more mature companies than we have had historically. Second, we believe the quality of our existing portfolio is stronger than it has been historically. Third, we own larger percentages of the companies in the existing portfolio than we have owned historically.
Our current portfolio is comprised of BIOLOGY+ and other companies at varying stages of maturity in a diverse set of industries. As our portfolio companies mature, we seek to invest in new early- and mid-stage companies that may mature into mid- and late-stage companies. This continuous progression creates a pipeline of investment maturities that may lead to future sources of positive contributions to net asset value per share as these companies mature and potentially experience liquidity and exit events. Our pipeline of investment maturities for the 23 equity-focused companies in our portfolio that have yet to complete liquidity events (e.g., IPOs or M&A transactions) and are not in the process of being shut down are shown in the figure below.
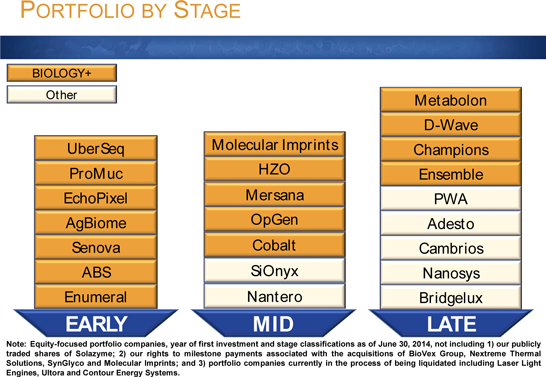
We expect some of our portfolio companies to transition between stages of maturity over time. This transition may be forward if the company is maturing and is successfully executing its business plan or may be backward if the company is not successfully executing its business plan or decides to change its business plan substantially from its original plan. Transitions backward may be accompanied by an increase in non-performance risk, which reduces valuation. We discuss non-performance risk and its implications on value below in the section titled "Valuation of Investments."
Molecular Imprints, Inc., which we previously categorized as a late-stage company, was acquired by Canon, Inc., in the second quarter of 2014, and we have retained ownership in a new company created from the non-semiconductor manufacturing business of Molecular Imprints. We categorized the new company, which retained the name "Molecular Imprints, Inc." as a mid-stage company. Additionally, we categorized our new portfolio company, UberSeq, Inc., as an early-stage company.
| 67 |
Ownership of Our Portfolio Companies
By studying our portfolio in greater detail, it is evident to us that potential returns from approximately half of the companies in our portfolio could be the real drivers of net asset value growth over the coming years. These companies include ones in which we have substantial ownership and ones where we believe the potential value at exit is substantial. The table below provides some additional detail on our ownership of the 23 equity-focused companies in our portfolio that have yet to complete liquidity events (e.g., IPOs or M&A transactions) and are not in the process of being shut down.
| Portfolio Company | Voting Ownership Range | |
|
EchoPixel, Inc. Enumeral Biomedical Corp. ProMuc, Inc. Senova Systems, Inc. Sionyx, Inc. UberSeq, Inc. |
>20% | |
|
ABSMaterials, Inc. HZO, Inc. Produced Water Absorbents, Inc. |
15-20% | |
|
Adesto Technologies Corporation Metabolon, Inc. OpGen, Inc. |
10-15% | |
|
AgBiome, L.L.C. Ensemble Therapeutics Corporation |
5-10% | |
|
Bridgelux, Inc. Cambrios Technologies Corporation Champions Oncology, Inc. D-Wave Systems, Inc. Mersana Therapeutics, Inc. Molecular Imprints, Inc. Nantero, Inc. |
2.5-5% | |
|
Cobalt Technologies, Inc. Nanosys, Inc. |
0-2.5% |
| 68 |
In previous communications with shareholders, we have discussed how we are managing our portfolio, feeding the "fat hogs" and starving the "lean hogs" to maximize our value at exit. Many of the leaner hogs have experienced write-downs in valuation, and we have de-emphasized them in terms of the time allocation of our team. These steps allow us to focus our time and capital on the companies we believe will be the drivers of our growth. This increases the risk and potential loss of invested capital in these portfolio companies, but it also may increase the potential returns if they are successful. We currently believe companies like D-Wave Systems, Inc., Metabolon, Inc., Adesto Technologies Corporation, HZO, Inc., Produced Water Absorbents, Inc., AgBiome, LLC, Senova Systems, Inc., Enumeral Biomedical Corp. and EchoPixel, Inc., have the potential to be real drivers of growth in our portfolio in the coming years.
Level of Involvement in Our Portfolio Companies
The 1940 Act requires that BDCs offer to "make available significant managerial assistance" to portfolio companies. We are actively involved with our portfolio companies through membership on boards of directors, as observers to the boards of directors and/or through frequent communication with management. As of June 30, 2014, we held at least one board seat or observer rights on 18 of our 23 equity-focused portfolio companies that have yet to complete a liquidity event or an uplisting to a national exchange and are not in the process of being shut down (78 percent).
We may be involved actively in the formation and development of business strategies of our earliest stage portfolio companies. This involvement may include hiring management, licensing intellectual property, securing space and raising additional capital. We also provide managerial assistance to late-stage companies looking for potential exit opportunities by leveraging our relationships with the banking and investment community and our knowledge and experience in running a micro-capitalization publicly traded business.
Growth in Ownership of Portfolio Companies
The chart below depicts the change in our ownership of our portfolio companies from 2001 through 2014 as our assets have increased. Our fully diluted, investment-weighted average ownership has increased from approximately five percent for initial investments made between 2001 and 2004 to approximately 16 percent for initial investments made between 2009 and 2014. This increasing ownership, which we have noted in previous shareholder communications, gives us more control over these companies to potentially affect outcomes beneficial to the Company. Over the coming five years, as companies where our initial investment was made between 2005 and the present continue to mature and exit, we believe our increased levels of ownership have the potential to provide greater returns than our historical investments.
| 69 |
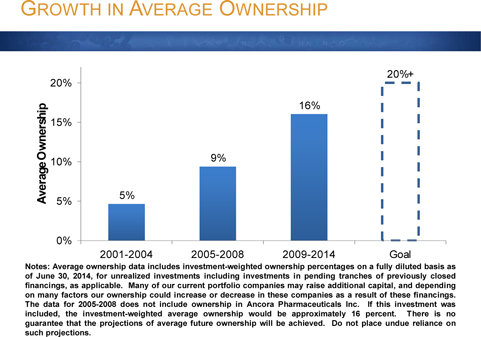
Our goal with our new investments is to have even greater ownership at the time of the realization of our return than we have had historically for all of the reasons discussed above.
Investments and Current Investment Pace
The following is a summary of our initial and follow-on equity-focused investments from January 1, 2010, to June 30, 2014. We consider a "round led" to be a round where we were the new investor or the leader of a group of investors in an investee company. Typically, but not always, the lead investor negotiates the price and terms of the deal with the investee company.
Investments in Our Equity-Focused Portfolio of Investments
in Privately Held and Publicly Traded Companies
| 2010 | 2011 | 2012 | 2013 | Six Months Ended June 30, 2014 | ||||||||||||||||
| Total Incremental Investments | $ | 9,560,721 | $ | 17,688,903 | $ | 15,141,941 | $ | 18,076,288 | $ | 9,954,799 | ||||||||||
| No. of New Investments | 3 | 4 | 2 | 2 | 1 | |||||||||||||||
| No. of Follow-On Investment Rounds | 27 | 31 | 26 | 37 | 22 | |||||||||||||||
| No. of Rounds Led | 5 | 4 | 3 | 9 | 4 | |||||||||||||||
| Average Dollar Amount – Initial | $ | 117,069 | $ | 1,339,744 | $ | 1,407,500 | $ | 550,001 | $ | 500,000 | ||||||||||
| Average Dollar Amount – Follow-On | $ | 341,093 | $ | 397,740 | $ | 474,113 | $ | 449,359 | $ | 429,764 | ||||||||||
| 70 |
Industry Sectors of Investment
We generally classify our investments in one of three industry sectors: Life Sciences, Energy and Electronics. The interdisciplinary nature of science-based inventions enables our portfolio companies to address needs in multiple sectors rather than being confined to addressing needs in one sector. As such, many of our companies can adjust their business foci to address needs in a secondary sector should opportunities in the company’s primary sector decrease in number or magnitude.
We classify companies in our life sciences portfolio as those that address problems in life sciences-related industries, including biotechnology, agriculture, advanced materials and chemicals, diagnostics, healthcare, bioprocessing, water, industrial biotechnology, food, nutrition and energy. We classify companies that address life science-related problems as a primary or secondary sector as BIOLOGY+. With our focus on investing in BIOLOGY+ companies, we expect that the number of companies addressing life science-related industries as a primary focus will grow, while those that address electronics and energy-related sectors as a primary focus will decline. That said, we expect these companies may address electronics and energy-related sectors as a secondary sector given the interdisciplinary nature of BIOLOGY+ companies.
We classify companies in our energy portfolio as those that seek to improve performance, productivity or efficiency, and to reduce environmental impact, waste, cost, energy consumption or raw materials. Energy is a term used commonly to describe products and processes that solve global problems related to resource constraints. The term "cleantech" is also used commonly in a similar manner.
We classify companies in our electronics portfolio as those that address problems in electronics-related industries, including semiconductors, telecommunications and data communications, metrology and test and measurement.
Our Sources of Liquid Capital
The sources of liquidity that we use to make our investments are classified as primary and secondary liquidity. As of June 30, 2014, and December 31, 2013, our total primary and secondary liquidity was $27,874,282 and $33,620,478, respectively. We do not include funds available from our credit facility as primary or secondary liquidity. We believe it is important to examine both our primary and secondary liquidity when assessing the strength of our balance sheet and our future investment capabilities.
Primary liquidity is comprised of cash, U.S. government securities and certain receivables. As of June 30, 2014, we held $24,676,324 in cash and $85,063 in certain receivables. As of December 31, 2013, we held $8,538,548 in cash, $18,999,810 in U.S. government securities and $534,826 in certain receivables.
| 71 |
During the six months ended June 30, 2014, we sold 117,834 shares of our investment in Solazyme, Inc., in open market sales. We received $1,407,520 in net proceeds from these transactions. During the six months ended June 30, 2014, we sold 575,756 shares of our investment in Champions Oncology, Inc., in open market sales. We received $636,259 in net proceeds from these transactions. The proceeds received from these transactions added to our primary liquidity. On April 18, 2014, we received proceeds of $6,486,461 from the sale of Molecular Imprints, Inc.'s semiconductor lithography equipment business to Canon, Inc., which also added to our primary liquidity in the second quarter of 2014. On July 15, 2014, the remaining funds totaling $1,139,515 from the sale of Xradia, Inc., were released from escrow, which will add to our primary liquidity in the third quarter. Payments upon achieving milestones of the BioVex Group, Inc., and Molecular Imprints, Inc., sales would also add to our primary liquidity in future quarters if these milestones are achieved successfully. The probability-adjusted values of the future milestone payments for the sales of BioVex and Molecular Imprints, as determined at the end of each fiscal quarter, are included as an asset on our Consolidated Statements of Assets and Liabilities and will be included in primary liquidity only if and when payment is received for achievement of the milestones.
Our secondary liquidity is comprised of the stock of publicly traded companies. Although these companies are publicly traded, their stock may not trade at high volumes and prices may be volatile, which may restrict our ability to sell our positions at any given time. As of June 30, 2014, our secondary liquidity was $3,112,895. Solazyme, Inc., accounts for $589,000 of this amount based on its closing price as of June 30, 2014. If our option contracts are called at their strike prices, we would receive proceeds of $625,000. The common stock of Champions Oncology, Inc., accounts for $2,523,895 of the total amount of secondary liquidity based on its closing price as of June 30, 2014. As of December 31, 2013, our secondary liquidity was $5,547,294. Solazyme, Inc., accounted for $1,827,712 of this amount based on its closing price as of December 31, 2013. The common stock of Champions Oncology, Inc., accounted for $3,719,582 of the total amount of secondary liquidity based on its closing price as of December 31, 2013. All of our public securities were freely tradable as of June 30, 2014. A decision to sell our shares would result in the cash received from the sale of these assets being included in primary liquidity. Until that time, we will continue to include the value of our shares of our publicly traded portfolio companies in secondary liquidity unless the average trading volume of each company reaches sufficient levels for us to monetize our stock in such companies over a short period of time.
We also have the $20,000,000 Loan Facility, which we can draw on to increase liquidity. As of June 30, 2014, we had no outstanding debt relating to this Loan Facility.
As the structure of the public markets has changed over the last decade, the time and dollars required to build transformative companies has increased. Scale and manufacturing expertise is now critical to get to a successful outcome. We believe this expertise is best accomplished by partnering with corporations at earlier stages in the development of the enterprise. Proper partnering can lead to more capital efficient businesses that provide better returns for investors.
Our plan for returning value to shareholders has three steps. Step one of our return plan was implemented over the past five years. It includes investing in early-stage companies where we believe we can own greater than 10 percent of the company at exit with invested capital of between $5 million and $10 million in each company.
| 72 |
Step two is our focus on BIOLOGY+. Our best investment returns over the past 10 years have come from companies that have businesses intersecting with the life sciences. We are now focusing our efforts on BIOLOGY+, as we believe the future returns for companies commercializing technologies that sell into the life science markets will be greater than those focused on other markets we have invested in historically. Since 2008, approximately 79 percent of our new initial investments have been in companies that fit our BIOLOGY+ investment thesis. This percentage will increase over the coming years. That said, we note that past performance may not be indicative of future performance.
Step three is our partnering efforts. We continue to pursue strategies to increase the return profile of early-stage investing, and to reduce the cost profile so that it shifts to a profile more representative of the venture capital industry of 15 to 20 years ago. We believe this will require an environment for doing early-stage investing that includes working with corporate partners earlier in the development of these companies to 1) ascertain if there is demand for the company’s technology/products and 2) to help these start-ups prepare for scale and manufacturing in a way that permits seamless adoption by industry and the consumer. This is the basis of our partnership strategy.
We believe that execution of these three steps will generate returns for shareholders over the coming years. We are focused on increasing value for shareholders through growing net asset value per share, and we believe we may have an opportunity to reduce the number of shares outstanding and provide deemed dividends as well as cash dividends as we execute on this strategy.
The second quarter of 2014 ended with increases in value in the public market indices. These increases coincided with continued strength in IPO's but a decrease in M&A transactions according to the National Venture Capital Association. Fundraising by venture capital firms was robust, but the five largest venture funds raised continued to account for a significant amount of the total capital raised by new and follow-on funds. These dynamics continue to lead to a difficult fundraising environment for venture-backed companies, particularly those in the middle stages of development and those focused on sectors in which we invest.
Our overall goal remains unchanged. We want to maintain our leadership position in investing in science-enabled and BIOLOGY+ companies and increase our net asset value per share outstanding. The current environment for venture capital financings continues to favor those firms that have capital to invest regardless of the stage of the investee company. We continue to finance our new and follow-on equity and convertible debt investments from our cash reserves held in bank accounts. We may in the future invest borrowed capital to take advantage of opportunities that we believe will return greater than the cost of such borrowed capital. We have historically held, and may in the future again hold, our cash in U.S. Treasury securities. We believe the current status of the venture capital industry and the current economic climate provide opportunities to invest this capital at historically low valuations and under favorable terms in equity and convertible debt of new and existing privately held and publicly traded companies.
| 73 |
We value our privately held venture capital investments each quarter as determined in good faith by our Valuation Committee, a committee of all the independent directors, within guidelines established by our Board of Directors in accordance with the 1940 Act. See "Footnote to Consolidated Schedule of Investments" contained in "Consolidated Financial Statements" for additional information.
The values of privately held, venture capital-backed companies are inherently more difficult to determine than those of publicly traded companies at any single point in time because securities of these types of companies are not actively traded. We believe, perhaps even more than in the past, that illiquidity, and the perception of illiquidity, can affect value. Management believes further that the long-term effects of the difficult venture capital market and difficult exit environments will continue to affect negatively the fundraising ability of weak companies regardless of near-term improvements in the overall global economy and public markets and that these factors can also affect value.
We note that while the valuations of our privately held, venture capital-backed companies may decrease, sometimes substantially, such decrease may facilitate an increase in our ownership of the overall company in conjunction with a follow-on investment in such company. In these cases, the ultimate return on our overall invested capital could be greater than it would have been without such interim decrease in valuation.
In each of the years in the period of 2010 through 2013 and for the six months ended June 30, 2014, excluding our rights to milestone payments, we recorded the following gross write-ups in privately held securities as a percentage of net assets at the beginning of the year ("BOY"), gross write-downs in privately held securities as a percentage of net assets at the beginning of the year, and change in value of private portfolio securities as a percentage of net assets at the beginning of the year.
| Gross Write-Ups and Write-Downs of the Privately Held Portfolio | ||||||||||||||||||||
| 2010 | 2011 | 2012 | 2013 | Six Months Ended June 30, 2014 | ||||||||||||||||
| Net Asset Value, BOY | $ | 134,158,258 | $ | 146,853,912 | $ | 145,698,407 | $ | 128,436,774 | $ | 122,701,575 | ||||||||||
| Gross Write-Downs During Year | $ | (11,391,367 | ) | $ | (11,375,661 | ) | $ | (19,604,046 | ) | $ | (19,089,816 | ) | $ | (7,199,274 | ) | |||||
| Gross Write-Ups During Year | $ | 30,051,847 | $ | 11,997,991 | $ | 14,099,904 | $ | 10,218,994 | $ | 8,672,224 | ||||||||||
| Gross Write-Downs as a Percentage of Net Asset Value, BOY | (8.5 | )% | (7.8 | )% | (13.5 | )% | (14.9 | )% | (5.9 | )% | ||||||||||
| Gross Write-Ups as a Percentage of Net Asset Value, BOY | 22.4 | % | 8.2 | % | 9.7 | % | 8.0 | % | 7.1 | % | ||||||||||
| Net Change as a Percentage of Net Asset Value, BOY | 13.9 | % | 0.4 | % | (3.8 | )% | (6.9 | )% | 1.2 | % | ||||||||||
From March 31, 2014, to June 30, 2014, the value of our equity-focused venture capital portfolio, including our rights to potential future milestone payments from the sales of BioVex Group, Inc., Nextreme Thermal Solutions, Inc., and Molecular Imprints, Inc., increased by $5,384,980, from $89,379,494 to $94,764,474.
| 74 |
Not including our rights to potential future milestone payments from the sale of BioVex Group, Inc., Nextreme Thermal Solutions, Inc., and Molecular Imprints, Inc., our equity-focused portfolio companies increased in value by $4,749,476. This increase was primarily owing to 1) follow-on investments of $7,567,819 and 2) a net increase in value owing to the terms and pricing of new rounds of financing of $7,342,060, offset by 1) a net decrease of $7,354,679 owing to the sale of Molecular Imprints, offset by cash proceeds to us of $6,486,461, 2) net decreases in the valuations of Solazyme, Inc., and Champions Oncology, Inc., and sales of a portion of our shares of these companies of $1,143,101, offset by net cash proceeds to us of $1,209,201 that are not included in the valuations of Solazyme and Champions Oncology as of June 30, 2014, and 3) a net decrease in value owing to a net increase in discounts for non-performance risk of $1,466,344. The remaining component of the change in the value of our equity-focused portfolio companies of $196,279 was primarily owing to net decreases in public company comparables, the value of warrants, currency fluctuations and net interest on convertible bridge notes.
We note that our Valuation Committee and ultimately our Board of Directors take into account multiple sources of quantitative and qualitative inputs to determine the value of our privately held portfolio companies.
We note that our Valuation Committee does not set the value of Solazyme, Inc., our freely tradable publicly traded portfolio company, or the value of our shares of Champions Oncology, Inc., which trades on an OTC exchange.
We define non-performance as the risk that the price per share (or implied valuation of a portfolio company) or the effective yield of a debt security of a portfolio company, as applicable, does not appropriately represent the risk that a portfolio company that requires or seeks to raise additional capital will be (a) unable to raise capital, will need to be shut down and will not return our invested capital; or (b) able to raise capital, but at a valuation significantly lower than the implied post-money valuation. Our best estimates of non-performance risk of our portfolio companies are included in the valuation of the companies as of June 30, 2014. In the future, as these companies receive terms for additional financings or if they are unable to receive additional financing and, therefore, proceed with sales or shutdowns of the business, we expect the contribution of the discount for non-performance risk to vary in importance in determining the fair values of our securities of these companies. Changes in discounts for non-performance risk could positively or negatively affect the value of our portfolio companies in future quarters. As of June 30, 2014, non-performance risk was a significant factor in determining the values of six of our 26 equity-focused portfolio companies and warrants of Champions Oncology, Inc., that are fair valued by our Board of Directors. These six companies accounted for approximately $8.3 million, or nine percent, of the total value of our equity-focused venture capital portfolio, not including our rights to milestone payments from the sale of BioVex Group, Inc., to Amgen, Inc. As of December 31, 2013, non-performance risk was a significant factor in determining the values of six of our 26 equity-focused portfolio companies and warrants of Champions Oncology, Inc., that are fair valued by our Board of Directors. These six companies accounted for approximately $17.8 million, or 20 percent, of the total value of our equity-focused venture capital portfolio, not including our rights to milestone payments from the sale of BioVex Group, Inc., to Amgen, Inc.
As of June 30, 2014, our top ten investments by value accounted for approximately 79 percent of the value of our equity-focused venture capital portfolio.
| 75 |
| Top Ten Equity-Focused Investments by Value | ||||||||
| Portfolio Company | Value as of 06/30/2014 | Cumulative % of Equity Focused Venture Capital Portfolio | ||||||
| Adesto Technologies Corp. | $ | 14,701,448 | 16 | % | ||||
| HZO, Inc. | $ | 10,836,938 | 28 | % | ||||
| Metabolon, Inc. | $ | 10,655,029 | 40 | % | ||||
| D-Wave Systems, Inc. | $ | 10,503,617 | 52 | % | ||||
| Produced Water Absorbents, Inc. | $ | 6,783,100 | 59 | % | ||||
| Enumeral Biomedical Corp. | $ | 3,969,050 | 63 | % | ||||
| Nanosys, Inc. | $ | 3,776,158 | 68 | % | ||||
| Ensemble Therapeutics Corp. | $ | 3,749,795 | 72 | % | ||||
| Bridgelux, Inc. | $ | 3,262,016 | 75 | % | ||||
| Nantero, Inc. | $ | 3,034,180 | 79 | % | ||||
We present the financial results of our operations utilizing accounting principles generally accepted in the United States of America ("GAAP") for investment companies. On this basis, the principal measure of our financial performance during any period is the net increase (decrease) in our net assets resulting from our operating activities, which is the sum of the following three elements:
Net Operating Income (Loss) - the difference between our income from interest, dividends, and fees and our operating expenses.
Net Realized Gain (Loss) on Investments - the difference between the net proceeds of sales of portfolio securities and their stated cost.
Net Increase (Decrease) in Unrealized Appreciation or Depreciation on Investments - the net unrealized change in the value of our investment portfolio.
Owing to the structure and objectives of our business, we generally expect to experience net operating losses and seek to generate increases in our net assets from operations through the long-term appreciation and monetization of our venture capital investments. We have relied, and continue to rely, primarily on proceeds from sales of investments, rather than on investment income, to defray a significant portion of our operating expenses. Because such sales are unpredictable, we attempt to maintain adequate working capital to provide for fiscal periods when there are no such sales.
| 76 |
The potential for, or occurrence of, inflation could result in rising interest rates for government-backed debt. We may also invest in both short- and long-term U.S. government and agency securities. To the extent that we invest in short- and long-term U.S. government and agency securities, changes in interest rates result in changes in the value of these obligations that result in an increase or decrease of our net asset value. The level of interest rate risk exposure at any given point in time depends on the market environment, the expectations of future price and market movements, and the quantity and duration of long-term U.S. government and agency securities held by the Company, and it will vary from period to period. During the three months and six months ended June 30, 2014, our average holdings of U.S. government securities were $4,999,900 and $5,571,344, respectively. During the three months and six months ended June 30, 2013, our average holdings of U.S. government securities were $13,999,790 and $13,999,480, respectively.
Three months ended June 30, 2014, as compared with the three months ended June 30, 2013
In the three months ended June 30, 2014, and June 30, 2013, we had net increases in net assets resulting from operations of $4,328,055 and $4,104,761, respectively.
Investment Income and Expenses:
We had net operating losses of $2,084,855 and $1,989,938 for the three months ended June 30, 2014, and June 30, 2013, respectively. The variation in these results is primarily owing to the changes in investment income and operating expenses, including non-cash expense included in salaries, benefits and stock-based compensation of $188,487 in 2014 primarily associated with the compensation cost for restricted stock as compared with $315,480 for the same period in 2013. During the three months ended June 30, 2014, and 2013, total investment income was $133,835 and $189,963, respectively. During the three months ended June 30, 2014, and 2013, total operating expenses were $2,218,690 and $2,179,901, respectively.
During the three months ended June 30, 2014, as compared with the same period in 2013, investment income decreased, reflecting a decrease in interest income from subordinated and senior secured debt and senior secured debt through a participation agreement, rental income from the sublet of our office space at 420 Florence Street, Palo Alto, CA, owing to the expiration of the lease in 2013, a decrease in our average holdings of U.S. government securities, and a decrease in interest income from a non-convertible promissory note and convertible bridge notes. During the three months ended June 30, 2014, our average holdings of U.S. government securities were $4,999,900 as compared with $13,999,790 during the three months ended June 30, 2013, primarily owing to the decrease in yield available over the durations of maturities in which we were willing to invest.
Operating expenses, including non-cash, stock-based compensation expenses, were $2,218,690 and $2,179,901 for the three months ended June 30, 2014, and June 30, 2013, respectively. The increase in operating expenses for the three months ended June 30, 2014, as compared with the three months ended June 30, 2013, was primarily owing to increases in administration and operations expense, professional fees, interest and other debt expenses, directors' fees and expenses and custody fees, offset by decreases in salaries, benefits and stock-based compensation expense, rent expense and insurance expense.
| 77 |
Administration and operations expense increased by $37,010, or 21.8 percent, for the three months ended June 30, 2014, as compared with June 30, 2013, primarily as a result of net increases in general office and administration expenses, including costs of $28,135 associated with a Meet the Portfolio Day event. We did not hold a Meet the Portfolio Day during the comparable period in 2013. Professional fees increased by $108,214, or 39.1 percent, for the three months ended June 30, 2014, as compared with June 30, 2013, primarily as a result of an increase in consulting fees associated with investor outreach and marketing efforts and certain accounting fees, offset by a decrease in certain legal fees. Interest and other debt expense increased by $88,402, or 1,505 percent, for the three months ended June 30, 2014, as compared with June 30, 2013, primarily as a result of non-utilization fees and amortization of closing fees associated with our Loan Facility. Directors' fees and expenses increased by $34,725, or 59.5 percent, for the three months ended June 30, 2014, as compared with June 30, 2013, primarily owing to an increase in overall fees and the addition of a new member to our Board of Directors in 2014. Custody fees increased by $247, or 1.8 percent, for the three months ended June 30, 2014, as compared with June 30, 2013.
Salaries, benefits and stock-based compensation expense decreased by $195,288, or 13.5 percent, for the three months ended June 30, 2014, as compared with June 30, 2013, primarily as a result of decreases in compensation cost for restricted stock awards associated with the Stock Plan owing to a reversal of compensation expense of $128,004 for stock awards that were forfeited as a result of the voluntary termination of one of our employees on June 30, 2014, a decrease of $22,344 in the projected benefit obligation expense accrual for medical and pension retirement benefits and a decrease in employee bonus accruals, offset by increases in costs associated with the increase in salary and benefits for one of our employees whose status changed from a part-time employee in 2013 to a full-time employee in 2014. While the non-cash, stock-based compensation expense for the Stock Plan increased our operating expenses by $188,487, this increase was offset by a corresponding increase to our additional paid-in capital, resulting in no net impact to our net asset value. Rent expense decreased by $21,421, or 21.1 percent, for the three months ended June 30, 2014, as compared with June 30, 2013, owing primarily to the expiration of the lease for our office space at 420 Florence Street, Palo Alto, CA, on August 30, 2013. Our rent expense of $80,065 for the three months ended June 30, 2014, includes $91,391 of rent paid in cash, net of $11,326 non-cash rent expense, credits and abatements that we recognize on a straight-line basis over the lease term. Our rent paid in cash of $91,391 includes $12,682 of real estate tax escalation charges on our corporate headquarters located at 1450 Broadway in New York City. Insurance expense decreased by $12,173, or 12.7 percent, for the three months ended June 30, 2014, as compared with June 30, 2013, primarily as a result of a decrease in overall annual renewal premiums.
Realized Gains and Losses from Investments:
During the three months ended June 30, 2014, and June 30, 2013, we realized net gains on investments of $5,693,250 and $7,590,533, respectively.
During the three months ended June 30, 2014, we realized net gains of $5,693,250 consisting of a realized gain on the sale of our investment in Molecular Imprints, Inc., of $3,946,838, a realized gain of $4,570 on the sale of 16,000 shares of Champions Oncology, Inc., a realized gain of $956,312 on the sale of 100,000 shares of Solazyme, and a realized gain of $197,309 on the repurchase and expiration of certain Solazyme, Inc., written call option contracts. At June 30, 2014, we still owned 2,523,895 and 50,000 shares of Champions Oncology and Solazyme, respectively. We also had a realized gain of $588,221 on our escrow payment from the sale of Xradia, Inc.
| 78 |
During the three months ended June 30, 2013, we realized net gains of $7,590,533, consisting primarily of a realized gain of $7,651,058 on the sale of 966,490 shares of Solazyme, Inc., of which 303,500 shares were called subject to the terms of written call option contracts and a realized gain of $105,313 on the early repayments of the senior secured and subordinated secured debt by GEO Semiconductor, Inc., offset by a realized loss of $150,711 on the repurchase and expiration of certain Solazyme written call option contracts and a realized loss of $15,127 on the expiration of certain Solazyme purchased put option contracts. At June 30, 2013, we still owned 580,000 shares of Solazyme.
Net Unrealized Appreciation and Depreciation of Portfolio Securities:
During the three months ended June 30, 2014, net unrealized depreciation on total investments decreased by $719,660, or 3.7 percent, from accumulated net unrealized depreciation of $19,468,401 at March 31, 2014, to accumulated net unrealized depreciation of $18,748,741 at June 30, 2014. During the three months ended June 30, 2013, net unrealized depreciation on total investments increased by $1,495,673, or 321.8 percent, from accumulated net unrealized depreciation of $464,833 at March 31, 2013, to accumulated net unrealized depreciation of $1,960,506 at June 30, 2013.
During the three months ended June 30, 2014, net unrealized depreciation on our venture capital investments decreased by $797,090, from net unrealized depreciation of $19,643,757 at March 31, 2014, to net unrealized depreciation of $18,846,667 at June 30, 2014, owing primarily to write-ups in the valuations of the following portfolio company investments:
| Investment | Amount of Write-Up | |||
| D-Wave Systems, Inc. | $ | 3,840,927 | ||
| Produced Water Absorbents, Inc. | 1,976,649 | |||
| HZO, Inc. | 1,391,005 | |||
| SynGlyco, Inc. | 371,649 | |||
| Enumeral Biomedical Corp. | 183,577 | |||
| Champions Oncology, Inc. | 30,095 | |||
| GEO Semiconductor, Inc. | 7,774 | |||
| OpGen, Inc. | 1,494 | |||
| NanoTerra, Inc. | 1,321 | |||
The write-ups for the three months ended June 30, 2014, were offset by write-downs in the valuations of the following portfolio company investments:
| 79 |
| Investment | Amount of Write-Down | |||
| Cambrios Technologies Corporation | $ | 854,586 | ||
| SiOnyx, Inc. | 747,795 | |||
| Ultora, Inc. | 251,094 | |||
| Nanosys, Inc. | 219,526 | |||
| Bridgelux, Inc. | 154,145 | |||
| Ensemble Therapeutics Corporation | 130,717 | |||
| OHSO Clean, Inc. | 47,567 | |||
| Contour Energy Systems, Inc. | 21,418 | |||
| Cobalt Technologies, Inc. | 43 | |||
| Metabolon, Inc. | 7 | |||
We had an increase in unrealized depreciation of $3,876,968 on our investment in Molecular Imprints, Inc., owing to a realized gain on the sale of its securities.
We had a decrease in unrealized depreciation of $587 on the rights to milestone payments from Canon, Inc.’s acquisition of Molecular Imprints, Inc.
We had a decrease in unrealized depreciation of $5,247 on the rights to milestone payments from Amgen, Inc.’s acquisition of BioVex Group, Inc.
We had a decrease in unrealized depreciation owing to foreign currency translation of $206,811 on our investment in D-Wave Systems, Inc.
We had an increase in unrealized depreciation of $916,180 on our investment in Solazyme, Inc., primarily owing to realized gains on the partial sale of the securities.
Unrealized appreciation on our U.S. government securities portfolio decreased from unrealized appreciation of $121 at March 31, 2014, to $0 at June 30, 2014. We did not hold any U.S. government securities at June 30, 2014.
During the three months ended June 30, 2013, net unrealized depreciation on our venture capital investments increased by $1,095,295, from net unrealized depreciation of $597,882 at March 31, 2013, to net unrealized depreciation of $1,693,177 at June 30, 2013, owing primarily to write-downs in the valuations of the following investments held:
| Investment | Amount of Write-Down | |||
| OpGen, Inc. | $ | 2,037,500 | ||
| Contour Energy Systems, Inc. | 1,918,598 | |||
| Kovio, Inc. | 1,336,165 | |||
| Laser Light Engines, Inc. | 1,288,502 | |||
| GEO Semiconductor, Inc. | 106,022 | |||
| Cobalt Technologies, Inc. | 20 | |||
| 80 |
The write-downs for the three months ended June 30, 2013, were offset by write-ups in the valuations of the following investments held:
| Investment | Amount of Write-Up | |||
| Bridgelux, Inc. | $ | 2,759,246 | ||
| Solazyme, Inc. | 2,331,589 | |||
| Champions Oncology, Inc. | 2,066,982 | |||
| Ancora Pharmaceuticals Inc. | 1,834,999 | |||
| Xradia, Inc. | 865,108 | |||
| Ensemble Therapeutics Corporation | 811,352 | |||
| Senova Systems, Inc. | 312,882 | |||
| Adesto Technologies Corporation | 75,114 | |||
| SiOnyx, Inc. | 23,406 | |||
| Metabolon, Inc. | 16,345 | |||
| D-Wave Systems, Inc. | 12,326 | |||
| OHSO Clean, Inc. | 8,804 | |||
| Nano Terra, Inc. | 3,103 | |||
| Nanosys, Inc. | 726 | |||
| HZO, Inc. | 265 | |||
We had a decrease in unrealized appreciation of $21,092 on the rights to milestone payments from Amgen, Inc.’s acquisition of BioVex Group, Inc.
We had a decrease in unrealized appreciation of $197,041 on our investment in D-Wave Systems, Inc., owing to foreign currency translation.
We had a decrease in unrealized appreciation of $5,312,602 on our investment in Solazyme, Inc., owing to realized gains on the sale of its securities.
Unrealized appreciation on our U.S. government securities portfolio decreased from unrealized appreciation of $189 at March 31, 2013, to unrealized depreciation of $5 at June 30, 2013.
Six months ended June 30, 2014, as compared with the six months ended June 30, 2013
In the six months ended June 30, 2014, we had a net decrease in net assets resulting from operations of $2,147,622. In the six months ended June 30, 2013, we had a net increase in net assets resulting from operations of $2,044,569.
Investment Income and Expenses:
We had net operating losses of $4,060,227 and $3,925,511 for the six months ended June 30, 2014, and June 30, 2013, respectively. The variation in these results is primarily owing to the changes in investment income and operating expenses, including non-cash expense included in salaries, benefits and stock-based compensation of $497,634 in 2014 primarily associated with the compensation cost for restricted stock as compared with $630,201 for the same period in 2013. During the six months ended June 30, 2014, and 2013, total investment income was $280,126 and $375,053, respectively. During the six months ended June 30, 2014, and 2013, total operating expenses were $4,340,353 and $4,300,564, respectively.
| 81 |
During the six months ended June 30, 2014, as compared with the same period in 2013, investment income decreased, reflecting a decrease in interest income from subordinated and senior secured debt and senior secured debt through a participation agreement, rental income from the sublet of our office space at 420 Florence Street, Palo Alto, CA, owing to the expiration of the lease in 2013, a decrease in our average holdings of U.S. government securities and a decrease in interest income from a non-convertible promissory note and convertible bridge notes. During the six months ended June 30, 2014, our average holdings of U.S. government securities were $5,571,344 as compared with $13,999,480 during the six months ended June 30, 2013, primarily owing to the decrease in yield available over the durations of maturities in which we were willing to invest.
Operating expenses, including non-cash, stock-based compensation expenses, were $4,340,353 and $4,300,564 for the six months ended June 30, 2014, and June 30, 2013, respectively. The increase in operating expenses for the six months ended June 30, 2014, as compared with the six months ended June 30, 2013, was primarily owing to increases in administration and operations expense, interest and other debt expense, directors' fees and expenses and custody fees, offset by decreases in salaries, benefits and stock-based compensation expense, professional fees, rent expense and insurance expense.
Administration and operations expense increased by $33,398, or 11.0 percent, for the six months ended June 30, 2014, as compared with June 30, 2013, primarily as a result of net increases in general office and administration expenses, including costs of $31,235 associated with a Meet the Portfolio Day event, offset by timing differences related to certain accrued expenses. We did not hold a Meet the Portfolio Day during the comparable period in 2013. Interest and other debt expense increased by $176,291, or 1,506 percent, for the six months ended June 30, 2014, as compared with June 30, 2013, primarily as a result of non-utilization fees and amortization of closing fees associated with our Loan Facility. Directors' fees and expenses increased by $55,532, or 42.4 percent, for the six months ended June 30, 2014, as compared with June 30, 2013, primarily owing to an increase in overall fees and the addition of a new member to our Board of Directors in 2014. Custody fees increased by $1,245, or 4.5 percent, for the six months ended June 30, 2014, as compared with June 30, 2013.
Salaries, benefits and stock-based compensation expense decreased by $100,613, or 3.6 percent, for the six months ended June 30, 2014, as compared with June 30, 2013, primarily as a result of decreases in compensation cost for restricted stock awards associated with the Stock Plan owing to a reversal of compensation expense of $128,004 for stock awards that were forfeited as a result of the voluntary termination of one of our employees on June 30, 2014, a decrease of $34,480 in the projected benefit obligation expense accrual for medical and pension retirement benefits and a decrease in employee bonus accruals, offset by increases in costs associated with the increase in salary and benefits for one of our employees whose status changed from a part-time employee in 2013 to a full-time employee in 2014. While the non-cash, stock-based compensation expense for the Stock Plan increased our operating expenses by $497,634, this increase was offset by a corresponding increase to our additional paid-in capital, resulting in no net impact to our net asset value. Professional fees decreased by $65,645, or 9.9 percent, for the six months ended June 30, 2014, as compared with June 30, 2013, primarily as a result of a decrease in certain legal fees, offset by an increase in consulting fees associated with investor outreach and marketing efforts. Rent expense decreased by $54,610, or 26.9 percent, for the six months ended June 30, 2014, as compared with June 30, 2013, owing primarily to the expiration of the lease for our office space at 420 Florence Street, Palo Alto, CA, on August 30, 2013. Our rent expense of $148,091 for the six months ended June 30, 2014, includes $170,384 of rent paid in cash, net of $22,293 non-cash rent expense, credits and abatements that we recognize on a straight-line basis over the lease term. Our rent paid in cash of $170,384 includes $12,682 of real estate tax escalation charges on our corporate headquarters located at 1450 Broadway in New York City. Insurance expense decreased by $4,363, or 2.5 percent, for the six months ended June 30, 2014, as compared with June 30, 2013, primarily as a result of a decrease in overall annual renewal premiums.
| 82 |
Realized Gains and Losses from Investments:
During the six months ended June 30, 2014, and June 30, 2013, we realized net (losses) gains on investments of $(1,344,075) and $4,214,370, respectively.
During the six months ended June 30, 2014, we realized net losses of $1,344,075, consisting primarily of a realized loss on the value of our investment in Kovio, Inc., of $7,299,533, offset by a realized gain of $3,946,838 on the sale of our investment in Molecular Imprints, Inc., a realized gain of $204,442 on the sale of 575,756 shares of Champions Oncology, Inc., a realized gain of $1,129,054 on the sale of 117,834 shares of Solazyme, and a realized gain of $86,653 on the repurchase and expiration of certain Solazyme, Inc., written call option contracts. At June 30, 2014, we still owned 2,523,895 and 50,000 shares of Champions Oncology and Solazyme, respectively. We also had a realized gain of $588,440 on our escrow payment from the sale of Xradia, Inc.
During the six months ended June 30, 2013, we realized net gains of $4,214,370, consisting primarily of a realized gain of $9,084,167 on the sale of 1,217,790 shares of Solazyme, Inc., of which 554,800 shares were called subject to the terms of written call option contracts, a realized gain of $148,729 on our escrow payment from the sale of Crystal IS, Inc., and a realized gain of $105,313 on the early repayments of the senior secured and subordinated secured debt by GEO Semiconductor, Inc., offset by a realized loss on our investment in Nextreme Thermal Solutions, Inc., of $4,384,762, a realized loss of $540,106 on the sale of 50,807 shares of NeoPhotonics Corporation, of which 50,800 shares were called subject to the terms of written call option contracts, a realized loss of $126,762 on the repurchase and expiration of certain Solazyme and NeoPhotonics written call option contracts, and a realized loss of $72,209 on the expiration of certain Solazyme purchased put option contracts. At June 30, 2013, we still owned 580,000 shares of Solazyme. At June 30, 2013, we did not hold any shares of NeoPhotonics.
Net Unrealized Appreciation and Depreciation of Portfolio Securities:
During the six months ended June 30, 2014, net unrealized depreciation on total investments decreased by $3,272,666, or 14.9 percent, from accumulated net unrealized depreciation of $22,021,407 at December 31, 2013, to accumulated net unrealized depreciation of $18,748,741 at June 30, 2014. During the six months ended June 30, 2013, net unrealized depreciation on total investments decreased by $1,777,881, or 47.6 percent, from accumulated net unrealized depreciation of $3,738,387 at December 31, 2012, to accumulated net unrealized depreciation of $1,960,506 at June 30, 2013.
During the six months ended June 30, 2014, net unrealized depreciation on our venture capital investments decreased by $3,183,667, from net unrealized depreciation of $22,030,334 at December 31, 2013, to net unrealized depreciation of $18,846,667 at June 30, 2014, owing primarily to a net decrease in unrealized depreciation on our investment in Kovio, Inc., of $7,299,533 resulting in a realized loss on this investment when such securities were deemed worthless. We also had the following write-ups in the valuations of the following portfolio company investments:
| 83 |
| Investment | Amount of Write-Up | |||
| D-Wave Systems, Inc. | $ | 3,836,607 | ||
| Produced Water Absorbents, Inc. | 1,976,649 | |||
| HZO, Inc. | 1,403,984 | |||
| Enumeral Biomedical Corp. | 1,024,212 | |||
| SynGlyco, Inc. | 343,460 | |||
| Bridgelux, Inc. | 61,374 | |||
| GEO Semiconductor, Inc. | 23,126 | |||
| NanoTerra, Inc. | 10,480 | |||
| OpGen, Inc. | 1,494 | |||
The write-ups for the six months ended June 30, 2014, were offset by write-downs in the valuations of the following portfolio company investments:
| Investment | Amount of Write-Down | |||
| SiOnyx, Inc. | $ | 4,721,194 | ||
| Cambrios Technologies Corporation | 854,586 | |||
| Champions Oncology, Inc. | 764,222 | |||
| Ensemble Therapeutics Corporation | 362,534 | |||
| Nanosys, Inc. | 353,099 | |||
| Cobalt Technologies, Inc. | 300,533 | |||
| Ultora, Inc. | 251,094 | |||
| Laser Light Engines, Inc. | 182,061 | |||
| Contour Energy Systems, Inc. | 90,844 | |||
| Metabolon, Inc. | 44,175 | |||
| OHSO Clean, Inc. | 39,154 | |||
We had an increase in unrealized depreciation of $3,872,348 on our investment in Molecular Imprints, Inc., primarily owing to a realized gain on the sale of its securities.
We had a decrease in unrealized depreciation of $7,414 on the rights to milestone payments from Amgen, Inc.’s acquisition of BioVex Group, Inc.
We had a decrease in unrealized depreciation of $587 on the rights to milestone payments from Canon, Inc.’s acquisition of Molecular Imprints, Inc.
We had an increase in unrealized depreciation owing to foreign currency translation of $9,162 on our investment in D-Wave Systems, Inc.
We had an increase in unrealized depreciation of $960,247 on our investment in Solazyme, Inc., primarily owing to realized gains on the partial sale of the securities.
| 84 |
Unrealized appreciation on our U.S. government securities portfolio decreased from unrealized appreciation of $45 at December 31, 2013, to $0 at June 30, 2014. We did not hold any U.S. government securities at June 30, 2014.
During the six months ended June 30, 2013, net unrealized depreciation on our venture capital investments decreased by $2,055,454, from net unrealized depreciation of $3,748,631 at December 31, 2012, to net unrealized depreciation of $1,693,177 at June 30, 2013, resulting primarily from an increase in unrealized appreciation of $4,384,762 on our investment in Nextreme Thermal Solutions, Inc., owing to a realized loss on the sale of its securities and increases in the valuations of the following investments held:
| Investment | Amount of Write-Up | |||
| Bridgelux, Inc. | $ | 3,836,471 | ||
| Solazyme, Inc. | 2,238,800 | |||
| Champions Oncology, Inc. | 2,070,806 | |||
| Xradia, Inc. | 1,702,187 | |||
| Ancora Pharmaceuticals Inc. | 988,110 | |||
| Ensemble Therapeutics Corporation | 718,169 | |||
| HZO, Inc. | 569,325 | |||
| AgBiome, LLC | 500,000 | |||
| Enumeral Biomedical Corp. | 239,481 | |||
| ABSMaterials, Inc. | 40,949 | |||
| OHSO Clean, Inc. | 14,928 | |||
| Nano Terra, Inc. | 7,692 | |||
| D-Wave Systems, Inc. | 7,041 | |||
| Cobalt Technologies, Inc. | 6,031 | |||
| Nanosys, Inc. | 986 | |||
| Metabolon, Inc. | 53 | |||
The write-ups for the six months ended June 30, 2013, were offset by write-downs in the valuations of the following investments held:
| Investment | Amount of Write-Down | |||
| Contour Energy Systems, Inc. | $ | 3,197,662 | ||
| OpGen, Inc. | 2,852,500 | |||
| Kovio, Inc. | 1,336,165 | |||
| Laser Light Engines, Inc. | 1,008,222 | |||
| Senova Systems, Inc. | 292,887 | |||
| GEO Semiconductor, Inc. | 64,651 | |||
| Produced Water Absorbents, Inc. | 28,170 | |||
| SiOnyx, Inc. | 5 | |||
We had a decrease in unrealized appreciation of $17,014 on the rights to milestone payments from Amgen, Inc.’s acquisition of BioVex Group, Inc.
| 85 |
We had a decrease in unrealized appreciation of $310,047 on our investment in D-Wave Systems, Inc., owing to foreign currency translation.
We had an increase in unrealized appreciation of $530,934 on our investment in NeoPhotonics Corporation owing to realized losses on the sale of its securities.
We had a decrease in unrealized appreciation of $6,693,948 on our investment in Solazyme, Inc., owing to realized gains on the sale of its securities.
Unrealized appreciation on our U.S. government securities portfolio decreased from unrealized appreciation of $2,744 at December 31, 2012, to unrealized depreciation of $5 at June 30, 2013.
June 30, 2014
At June 30, 2014, our total assets and net assets were $123,373,855 and $120,878,223, respectively. At December 31, 2013, they were $125,063,946 and $122,701,575, respectively.
At June 30, 2014, our net asset value per share was $3.87 as compared with $3.93 at December 31, 2013. At June 30, 2014, and December 31, 2013, our shares outstanding were 31,245,664 and 31,197,438, respectively.
Significant developments in the six months ended June 30, 2014, included an increase in the holdings of our venture capital investments of $2,223,372 and a decrease in our cash and treasury holdings of $2,862,034. The increase in the value of our venture capital investments from $93,899,459 at December 31, 2013, to $96,122,831 at June 30, 2014, resulted primarily from new and follow-on investments of $9,954,799, offset by a decrease in the net value of our venture capital investments of $5,687,647 and a net decrease of $2,043,780 owing to the sale of certain of our shares of Solazyme, Inc., and Champions Oncology, Inc. The decrease in our cash and treasury holdings from $27,538,358 at December 31, 2013, to $24,676,324 at June 30, 2014, is primarily owing to follow-on venture capital investments totaling $9,954,799 and to the payment of cash for operating expenses of $3,887,383, offset by net proceeds of $2,043,780 received from the sale of certain of our shares of Solazyme and Champions Oncology, net premium proceeds of $119,697 received from certain Solazyme written call options, $1,235,312 received from the portion of our payment held in escrow from the sale of Xradia, Inc., and $6,486,461 received from the sale of Molecular Imprints, Inc.
The following table is a summary of additions to our portfolio of venture capital investments made during the six months ended June 30, 2014:
| New Investments | Amount of Investment | |||
| UberSeq, Inc. | $ | 500,000 | ||
| 86 |
| Follow-On Investments | Amount of Investment | |||
| HZO, Inc. | $ | 2,000,003 | ||
| Produced Water Absorbents, Inc. | 1,000,268 | |||
| Enumeral Biomedical Corp. | 935,000 | |||
| D-Wave Systems, Inc. | 762,568 | |||
| Produced Water Absorbents, Inc. | 750,000 | |||
| ABSMaterials, Inc. | 500,000 | |||
| Senova Systems, Inc. | 500,000 | |||
| EchoPixel,Inc. | 500,000 | |||
| SiOnyx, Inc. | 415,635 | |||
| Produced Water Absorbents, Inc. | 330,677 | |||
| Enumeral Biomedical Corp. | 250,000 | |||
| Senova Systems, Inc. | 250,000 | |||
| OpGen, Inc. | 245,017 | |||
| Mersana Therapeutics, Inc. | 240,500 | |||
| HZO, Inc. | 206,997 | |||
| D-Wave Systems, Inc. | 170,043 | |||
| OpGen, Inc. | 120,000 | |||
| SiOnyx, Inc. | 93,976 | |||
| Ultora, Inc. | 86,039 | |||
| Enumeral Biomedical Corp. | 65,000 | |||
| Laser Light Engines, Inc. | 19,331 | |||
| Laser Light Engines, Inc. | 13,745 | |||
| Total | $ | 9,954,799 | ||
The following tables summarize the values of our portfolios of venture capital investments and U.S. government securities, as compared with their cost, at June 30, 2014, and December 31, 2013:
| June 30, 2014 | December 31, 2013 | |||||||
| Venture capital investments, at cost | $ | 114,969,498 | $ | 115,929,793 | ||||
| Net unrealized (depreciation) (1) | (18,846,667 | ) | (22,030,334 | ) | ||||
| Venture capital investments, at value | $ | 96,122,831 | $ | 93,899,459 | ||||
| June 30, 2014 | December 31, 2013 | |||||||
| U.S. government securities, at cost | $ | 0 | $ | 18,999,765 | ||||
| Net unrealized appreciation(1) | 0 | 45 | ||||||
| U.S. government obligations, at value | $ | 0 | $ | 18,999,810 | ||||
(1)At June 30, 2014, and December 31, 2013, the net accumulated unrealized depreciation on investments, including written call options, was $18,748,741 and $22,021,407, respectively.
| 87 |
Net cash provided by operating activities for the six months ended June 30, 2014, was $16,207,714, primarily reflecting the net sale of U.S. government securities of $18,999,008 and proceeds from the sale of investments of $9,766,197, offset by the purchase of venture capital investments of $9,954,799 and the payment of operating expenses.
Net cash used in investing activities for the six months ended June 30, 2014, was $1,066, primarily reflecting the purchase of fixed assets.
Net cash used in operating activities for the six months ended June 30, 2013, was $118,366, primarily reflecting the purchase of venture capital investments of $7,108,150 and the payment of operating expenses, partially offset by proceeds from the sale of investments of $13,161,839 and net proceeds from call options of $534,920.
Net cash used in investing activities for the six months ended June 30, 2013, was $3,909, primarily reflecting the purchase of fixed assets.
Liquidity and Capital Resources
Our liquidity and capital resources are generated and are generally available through our cash holdings, interest earned on our investments on U.S. government securities, cash flows from the sales of U.S. government securities and payments received on our venture debt investments, proceeds from periodic follow-on equity offerings and realized capital gains retained for reinvestment.
We fund our day-to-day operations using interest earned and proceeds from our cash holdings, the sales of our investments in U.S. government securities, when applicable, and interest earned from our venture debt securities. We believe the increase or decrease in the value of our venture capital investments does not materially affect the day-to-day operations of the Company or our daily liquidity. As of June 30, 2014, and December 31, 2013, we had no investments in money market mutual funds.
Our Loan Facility may be used to fund our investments and not for the payment of day-to-day operating expenses. As of June 30, 2014, we had no debt outstanding. We have not issued any debt securities, and, therefore, are not subject to credit agency downgrades.
As a venture capital company, it is critical that we have capital available to support our best companies until we have an opportunity for liquidity in our investments. As such, we will continue to maintain a substantial amount of liquid capital on our balance sheet.
Although we cannot predict future market conditions, we continue to believe that our current cash and U.S. government security holdings and our ability to adjust our investment pace will provide us with adequate liquidity to execute our current business strategy.
At June 30, 2014, and December 31, 2013, our total net primary liquidity was $24,761,387 and $28,073,184, respectively. Our primary liquidity is principally comprised of our cash, U.S. government securities, when applicable, and certain receivables. The decrease in our primary liquidity from December 31, 2013, to June 30, 2014, is primarily owing to the use of funds for investments totaling $9,954,799 and payment of net operating expenses, offset by the receipt of $1,235,312 from the portion of our upfront payment held in escrow from the sale of Xradia, Inc., the receipt of $6,486,461 from the sale of Molecular Imprints, Inc., and net proceeds of $2,043,780 received from the sales of certain of our shares of Solazyme, Inc., and Champions Oncology, Inc. During the six months ended June 30, 2014, we also purchased and sold call option contracts on our publicly traded positions generating net proceeds of $119,697.
| 88 |
At June 30, 2014, and December 31, 2013, our secondary liquidity was $3,112,895 and $5,547,294, respectively. Our secondary liquidity consists of our publicly traded securities. Although these companies are publicly traded, their stock may not trade at high volumes and prices can be volatile, which may restrict our ability to sell our positions at any given time. We may also be restricted for a period of time in selling our positions in these companies due to our shares being unregistered. As of June 30, 2014, none of our publicly traded securities were restricted from sale.
We do not include funds held in escrow from the sale of investments in primary or secondary liquidity. These funds become primary liquidity if and when they are received at the expiration of the escrow period.
We believe that the current and future venture capital environment may adversely affect the valuation of investment portfolios, lead to tighter lending standards and result in reduced access to capital. These conditions may lead to a decline in net asset value and/or decline in valuations of our portfolio companies in future quarters. Although we cannot predict future market conditions, we continue to believe that our current cash and U.S. government security holdings and our ability to adjust our investment pace will provide us with adequate liquidity to execute our current business strategy.
Except for a rights offering, we are generally not able to issue and sell our common stock at a price below our net asset value per share, exclusive of any distributing commission or discount, without shareholder approval. As of June 30, 2014, our net asset value per share was $3.87 per share and our closing market price was $3.18 per share. We do not currently have shareholder approval to issue or sell shares below our net asset value per share.
On September 30, 2013, the Company entered into the Loan Facility that may be used by the Company to fund investments in portfolio companies. The Loan Facility, among other things, matures on September 30, 2017, and bears interest at 10 percent per annum in cash. The Company has the option to have interest accrue at a rate of 13.5 percent per annum if the Company decides not to pay interest in cash monthly. The Company currently plans to pay interest in cash if and when any borrowings are outstanding. The Loan Facility also requires payment of a draw fee on each borrowing equal to 1.0 percent of such borrowing and an unused commitment fee of 1.0 percent per annum. Interest and fee payments under the Loan Facility are made quarterly in arrears. The Company may prepay the loans or reduce the aggregate commitments under the Loan Facility at any time prior to the maturity date, as long as certain conditions are met, including payment of required prepayment or termination fees. The Loan Facility is secured by all of the assets of the Company and its wholly owned subsidiaries, subject to certain customary exclusions. The Loan Facility contains certain affirmative and negative covenants, including without limitation: (a) maintenance of certain minimum liquidity requirements; (b) maintenance of an eligible asset leverage ratio of not less than 4.0:1.0; (c) limitations on liens; (d) limitations on the incurrence of additional indebtedness; and (e) limitations on structural changes, mergers and disposition of assets (other than in the normal course of our business activities). There were no borrowings at closing, and at June 30, 2014, the Company had no outstanding debt.
| 89 |
At June 30, 2014, and December 31, 2013, the Company had no outstanding debt. The remaining capacity under the Loan Facility was $20,000,000 at June 30, 2014.
A summary of our significant contractual payment obligations is as follows:
Payments Due by Period
| Total | Less than 1 Year | 1-3 Years | 3-5 Years | More Than 5 Years | ||||||||||||||||
| Multi-Draw Loan Facility(1) | $ | 0 | $ | 0 | $ | 0 | $ | 0 | $ | 0 | ||||||||||
| Operating leases | $ | 1,632,676 | $ | 297,517 | $ | 575,459 | $ | 604,591 | $ | 155,109 | ||||||||||
(1)As of June 30, 2014, we had $20,000,000 of unused borrowing capacity under our Loan Facility.
The Company's significant accounting policies are described in Note 3 to the Consolidated Financial Statements and in the Footnote to the Consolidated Schedule of Investments. Critical accounting policies are those that are both important to the presentation of our financial condition and results of operations and those that require management’s most difficult, complex or subjective judgments. The Company considers the following accounting policies and related estimates to be critical:
Valuation of Portfolio Investments
The most significant estimate inherent in the preparation of our consolidated financial statements is the valuation of investments and the related amounts of unrealized appreciation and depreciation of investments recorded. As a BDC, we invest in primarily illiquid securities that generally have no established trading market.
Investments are stated at "value" as defined in the 1940 Act and in the applicable regulations of the SEC and U.S. GAAP. ASC 820 defines fair value, establishes a framework for measuring fair value and expands disclosures about assets and liabilities measured at fair value. ASC 820 provides a consistent definition of fair value that focuses on exit price in the principal, or most advantageous, market and prioritizes, within a measurement of fair value, the use of market-based inputs over entity-specific inputs. ASC 820 also establishes the following three-level hierarchy for fair value measurements based upon the transparency of inputs to the valuation of an asset or liability as of the measurement date.
• Level 1 - inputs to the valuation methodology are quoted prices (unadjusted) for identical assets or liabilities in active markets;
| 90 |
• Level 2 - inputs to the valuation methodology include quoted prices for similar assets and liabilities in active markets, and inputs that are observable for the asset or liability, either directly or indirectly, for substantially the full term of the financial instrument. Level 2 inputs are in those markets for which there are few transactions, the prices are not current, little public information exists or instances where prices vary substantially over time or among brokered market makers; and
• Level 3 - inputs to the valuation methodology are unobservable and significant to the fair value measurement. Unobservable inputs are those inputs that reflect our own assumptions that market participants would use to price the asset or liability based upon the best available information.
Financial assets and liabilities are classified in their entirety based on the lowest level of input that is significant to the fair value measurement and are not necessarily an indication of risks associated with the investment. See "Note 6. Fair Value of Investments" in the accompanying notes to our consolidated financial statements for additional information regarding fair value measurements.
Value, as defined in Section 2(a)(41) of the 1940 Act, is (i) the market price for those securities for which a market quotation is readily available and (ii) the fair value as determined in good faith by, or under the direction of, the Board of Directors for all other assets. See "Valuation Procedures" in the "Footnote to Consolidated Schedule of Investments" for additional information. As of June 30, 2014, our financial statements include venture capital investments valued at $93,009,936, the fair values of which were determined in good faith by, or under the direction of, the Board of Directors. As of June 30, 2014, approximately 77 percent of our net assets represent investments in portfolio companies at fair value by the Board of Directors.
Determining fair value requires that judgment be applied to the specific facts and circumstances of each portfolio investment, although our valuation policy is intended to provide a consistent basis for determining fair value of the portfolio investments. Factors that may be considered include, but are not limited to, the cost of the Company’s investment; transactions in the portfolio company’s securities or unconditional firm offers by responsible parties; the financial condition and operating results of the company; the long-term potential of the business and technology of the company; the values of similar securities issued by companies in similar businesses; multiples to revenues, net income or EBITDA that similar securities issued by companies in similar businesses receive; the proportion of the company’s securities we own and the nature of any rights to require the company to register restricted securities under the applicable securities laws; management's assessment of non-performance risk; the achievement of milestones; discounts for restrictions on transfers of publicly traded securities; and the rights and preferences of the class of securities we own as compared with other classes of securities the portfolio has issued.
In addition, with respect to our debt investments for which no readily available market quotations are available, we will generally consider the financial condition and current and expected future cash flows of the portfolio company; the creditworthiness of the portfolio company and its ability to meet its current debt obligations; the relative seniority of our debt investment within the portfolio company’s capital structure; the availability and value of any available collateral; and changes in market interest rates and credit spreads for similar debt investments.
| 91 |
Historically, difficult venture capital environments have resulted in companies not receiving financing and being subsequently closed down with a loss of investment to venture investors, and other companies receiving financing but at significantly lower valuations than the preceding rounds, leading to very deep dilution for those who do not participate in the new rounds of investment. Our best estimate of this non-performance risk has been quantified and included in the valuation of our portfolio companies as of June 30, 2014.
All investments recorded at fair value are categorized based upon the level of judgment associated with the inputs used to measure their fair value. Hierarchical levels related to the amount of subjectivity associated with the inputs to fair valuation of these assets are as discussed above.
As of June 30, 2014, approximately 97 percent of our portfolio company investments were classified as Level 3 in the hierarchy, indicating a high level of judgment required in their valuation.
The values assigned to our assets are based on available information and do not necessarily represent amounts that might ultimately be realized, as these amounts depend on future circumstances and cannot be reasonably determined until the individual investments are actually liquidated or become readily marketable. Upon sale of investments, the values that are ultimately realized may be materially different from what is presently estimated.
Stock-Based Compensation
Determining the appropriate fair-value model and calculating the fair value of share-based awards on the date of grant requires judgment. Historically, we have used the Black-Scholes-Merton option pricing model to estimate the fair value of employee stock options.
Management uses the Black-Scholes-Merton option pricing model in instances where we lack historical data necessary for more complex models and when the share award terms can be valued within the model. Other models may yield fair values that are significantly different from those calculated by the Black-Scholes-Merton option pricing model.
Management uses a binomial lattice option pricing model in instances where it is necessary to include a broader array of assumptions. We used the binomial lattice model for the 10-year NQSOs granted on March 18, 2009, and for performance-based restricted stock awards. These awards included accelerated vesting provisions or target stock prices that were based on market conditions.
Option pricing models require the use of subjective input assumptions, including expected volatility, expected life, expected dividend rate, and expected risk-free rate of return. Variations in the expected volatility or expected term assumptions have a significant impact on fair value. As the volatility or expected term assumptions increase, the fair value of the stock option increases. The expected dividend rate and expected risk-free rate of return are not as significant to the calculation of fair value. A higher assumed dividend rate yields a lower fair value, whereas higher assumed interest rates yield higher fair values for stock options.
| 92 |
In the Black-Scholes-Merton model, we use the simplified calculation of expected term as described in the SEC’s Staff Accounting Bulletin 107 because of the lack of historical information about option exercise patterns. In the binomial lattice model, we use an expected term that assumes the options will be exercised at two times the strike price because of the lack of option exercise patterns. Future exercise behavior could be materially different than that which is assumed by the model.
Expected volatility is based on the historical fluctuations in the Company's stock. The Company's stock has historically been volatile, which increases the fair value of the underlying share-based awards.
GAAP requires us to develop an estimate of the number of share-based awards that will be forfeited owing to employee turnover. Quarterly changes in the estimated forfeiture rate can have a significant effect on reported share-based compensation, as the effect of adjusting the rate for all expense amortization after the grant date is recognized in the period the forfeiture estimate is changed. If the actual forfeiture rate proves to be higher than the estimated forfeiture rate, then an adjustment will be made to increase the estimated forfeiture rate, which would result in a decrease to the expense recognized in the financial statements. If the actual forfeiture rate proves to be lower than the estimated forfeiture rate, then an adjustment will be made to decrease the estimated forfeiture rate, which would result in an increase to the expense recognized in the financial statements. Such adjustments would affect our operating expenses and additional paid-in capital, but would have no effect on our net asset value.
Pension and Post-Retirement Benefit Plan Assumptions
The Company provides a Retiree Medical Benefit Plan for employees who meet certain eligibility requirements. Until it was terminated on May 5, 2011, the Company also provided an Executive Mandatory Retirement Benefit Plan for certain individuals employed by us in a bona fide executive or high policy-making position. Our former President accrued benefits under this plan prior to his retirement, and the termination of the plan has no impact on his accrued benefits. Several statistical and other factors that attempt to anticipate future events are used in calculating the expense and liability values related to our post-retirement benefit plans. These factors include assumptions we make about the discount rate, the rate of increase in healthcare costs, and mortality, among others.
The discount rate reflects the current rate at which the post-retirement medical benefit and pension liabilities could be effectively settled considering the timing of expected payments for plan participants. In estimating this rate, we consider the Citigroup Pension Liability Index in the determination of the appropriate discount rate assumptions. The weighted average rate we utilized to measure our post retirement medical benefit obligation as of December 31, 2013, and to calculate our 2014 expense was 4.79 percent. We used a discount rate of 2.75 percent to calculate our pension obligation for the Executive Mandatory Retirement Benefit Plan.
Recent Developments - Portfolio Companies
On July 11, 2014, the Company made a $209,020 follow-on investment in OpGen, Inc., a privately held portfolio company.
| 93 |
On July 15, 2014, we received $1,139,515 upon the release of the remaining funds held in escrow from the acquisition of Xradia, Inc., by Carl Zeiss AG during 2013.
On July 21, 2014, the Company made a $216,012 new investment in Accelerator IV – New York Corporation, a privately held portfolio company.
On July 31, 2014, Enumeral Biomedical Corp. completed a reverse merger into a publicly traded shell company, Enumeral Biomedical Holdings, Inc. The operations of Enumeral Biomedical Corp. became those of the surviving entity. Simultaneously with the merger, the Company made a $1.5 million investment in Enumeral Biomedical Holdings. Enumeral Biomedical Holdings is traded publicly on the OTC market under the symbol ENUM. The Company's securities of Enumeral Biomedical Holdings will be subject to a lock-up agreement for up to 18 months from the date of the close of the merger. ENUM's stock closed trading on August 7, 2014, at $2.00 per share.
On August 1, 2014, the Company received $549,238 in payment of the outstanding principal, interest and warrants of OHSO Clean, Inc.
Item 3. Quantitative and Qualitative Disclosures About Market Risk
Our business activities contain elements of risk. We consider the principal types of market risk to be valuation risk, interest rate risk and foreign currency risk. Although we are risk-seeking rather than risk-averse in our investments, we consider the management of risk to be essential to our business.
Valuation Risk
Value, as defined in Section 2(a)(41) of the 1940 Act, is (i) the market price for those securities for which market quotations are readily available and (ii) fair value as determined in good faith by, or under the direction of, the Board of Directors for all other assets. (See the "Valuation Procedures" in the "Footnote to Consolidated Schedule of Investments" contained in "Item 1. Consolidated Financial Statements.")
Because there is typically no public market for our interests in the privately held small businesses in which we invest, the valuation of the equity interests in that portion of our portfolio is determined in good faith by our Board of Directors with the assistance of our Valuation Committee, comprised of the independent members of our Board of Directors, in accordance with our Valuation Procedures. In the absence of a readily ascertainable market value, the determined value of our portfolio of equity interests may differ significantly from the values that would be placed on the portfolio if a ready market for the equity interests existed. Determining fair value requires that judgment be applied to the specific facts and circumstances of each portfolio investment, although our valuation policy is intended to provide a consistent basis for determining fair value of the portfolio investments. Factors that may be considered include, but are not limited to, readily available public market quotations; the cost of the Company’s investment; transactions in the portfolio company’s securities or unconditional firm offers by responsible parties; the financial condition and operating results of the company; the long-term potential of the business and technology of the company; the values of similar securities issued by companies in similar businesses; multiples to revenues, net income or EBITDA that similar securities issued by companies in similar businesses receive; the proportion of the company’s securities we own and the nature of any rights to require the company to register restricted securities under the applicable securities laws; management's assessment of non-performance risk; the achievement of milestones; and the rights and preferences of the class of securities we own as compared with other classes of securities the portfolio has issued.
| 94 |
In addition, with respect to our debt investments for which no readily available market quotations are available, we will generally consider the financial condition and current and expected future cash flows of the portfolio company; the creditworthiness of the portfolio company and its ability to meet its current debt obligations; the relative seniority of our debt investment within the portfolio company’s capital structure; the availability and value of any available collateral; and changes in market interest rates and credit spreads for similar debt investments. Any changes in valuation are recorded in our Consolidated Statements of Operations as "Net increase (decrease) in unrealized appreciation on investments." Changes in valuation of any of our investments in privately held companies from one period to another may be volatile.
Investments in privately held, immature companies are inherently more volatile than investments in more mature businesses. Such immature businesses are inherently fragile and easily affected by both internal and external forces. Our investee companies can lose much or all of their value suddenly in response to an internal or external adverse event. Conversely, these immature businesses can gain suddenly in value in response to an internal or external positive development.
The values assigned to our assets are based on available information and do not necessarily represent amounts that might ultimately be realized, as these amounts depend on future circumstances and cannot be reasonably determined until the individual investments are actually liquidated or become readily marketable. Upon sale of investments, the values that are ultimately realized may be materially different from what is presently estimated.
Interest Rate Risk
Interest rate sensitivity refers to the change in earnings that may result from changes in the level of interest rates. Our borrowings under our Loan Facility bear interest at a fixed rate of 10 percent per annum, and, therefore, changes in interest rate benchmarks, such as LIBOR, will not affect our earnings on such investments if we decide to fund them through draws from our Loan Facility.
We may also invest in both short- and long-term U.S. government and agency securities. To the extent that we invest in short- and long-term U.S. government and agency securities, changes in interest rates result in changes in the value of these obligations that result in an increase or decrease of our net asset value. The level of interest rate risk exposure at any given point in time depends on the market environment, the expectations of future price and market movements, and the quantity and duration of long-term U.S. government and agency securities held by the Company, and it will vary from period to period.
| 95 |
In addition, market interest rates for high-yield corporate debt are an input in determining value of our investments in debt securities of privately held and publicly traded companies. Significant changes in these market rates could affect the value of our debt securities as of the date of measurement of value. Our investment income could be adversely affected should such debt securities include floating interest rates. We do not currently have any investments in debt securities with floating interest rates.
Foreign Currency Risk
Most of our investments are denominated in U.S. dollars. We currently have one investment denominated in Canadian dollars. We are exposed to foreign currency risk related to potential changes in foreign currency exchange rates. The potential loss in fair value on this investment resulting from a 10 percent adverse change in quoted foreign currency exchange rates is $575,972 at June 30, 2014.
Item 4. Controls and Procedures
(a) Disclosure Controls and Procedures. As of the end of the period covered by this report, the Company’s management, under the supervision and with the participation of our chief executive officer and chief financial officer, conducted an evaluation of the effectiveness of the design and operation of our disclosure controls and procedures (as required by Rules 13a-15 of the 1934 Act). Disclosure controls and procedures means controls and other procedures of an issuer that are designed to ensure that information required to be disclosed by the issuer in the reports that it files or submits under the 1934 Act is recorded, processed, summarized and reported, within time periods specified in the SEC's rules and forms, and that such information is accumulated and communicated to the issuer's management, as appropriate, to allow timely decisions regarding required disclosures. As of June 30, 2014, based upon this evaluation of our disclosure controls and procedures, our chief executive officer and chief financial officer concluded that our disclosure controls and procedures were effective.
(b) Changes in Internal Control Over Financial Reporting. There have not been any changes in the Company's internal control over financial reporting (as such term is defined in Rules 13a-15(f) and 15d-15(f) under the 1934 Act) during the second quarter of 2014 to which this report relates that have materially affected, or are reasonably likely to materially affect, the Company’s internal control over financial reporting.
| 96 |
Investing in our common stock involves significant risks relating to our business and investment objective. You should carefully consider the risks and uncertainties described in our Annual Report on Form 10-K for the year ended December 31, 2013, before you purchase any of our common stock.
The risks described in our Annual Report on Form 10-K are not the only risks facing our Company. Unknown additional risks and uncertainties, or ones that we currently consider immaterial, may also impair our business. If any of these risks or uncertainties materialize, our business, financial condition or results of operations could be materially adversely affected. In this event, the trading price of our common stock could decline, and you could lose all or part of your investment.
| 31.01* | Certification of CEO pursuant to Section 302 of the Sarbanes-Oxley Act of 2002. |
| 31.02* | Certification of CFO pursuant to Section 302 of the Sarbanes-Oxley Act of 2002. |
| 32* | Certification of CEO and CFO pursuant to 18 U.S.C. Section 1350, as adopted pursuant to Section 906 of the Sarbanes-Oxley Act of 2002. |
*filed herewith
| 97 |
Pursuant to the requirements of the Securities Exchange Act of 1934, the Registrant has caused this report to be signed on its behalf by the undersigned thereunto duly authorized.
| Harris & Harris Group, Inc. | ||
| /s/ | Douglas W. Jamison | |
| By: | Douglas W. Jamison | |
| Chief Executive Officer | ||
| /s/ | Patricia N. Egan | |
| By: | Patricia N. Egan | |
| Chief Financial Officer | ||
Date: August 8, 2014
| 98 |
| Exhibit No. | Description | |
| 31.01 | Certification of CEO pursuant to Section 302 of the Sarbanes-Oxley Act of 2002. | |
| 31.02 | Certification of CFO pursuant to Section 302 of the Sarbanes-Oxley Act of 2002. | |
| 32 | Certification of CEO and CFO pursuant to 18 U.S.C. Section 1350, as adopted pursuant to Section 906 of the Sarbanes-Oxley Act of 2002. |
| 99 |