Attached files
| file | filename |
|---|---|
| EXCEL - IDEA: XBRL DOCUMENT - Diversified Restaurant Holdings, Inc. | Financial_Report.xls |
| EX-31 - EXHIBIT 31.1 - Diversified Restaurant Holdings, Inc. | ex31-1.htm |
| EX-32 - EXHIBIT 32.1 - Diversified Restaurant Holdings, Inc. | ex32-1.htm |
| EX-32 - EXHIBIT 32.2 - Diversified Restaurant Holdings, Inc. | ex32-2.htm |
| EX-31 - EXHIBIT 31.2 - Diversified Restaurant Holdings, Inc. | ex31-2.htm |
U.S. SECURITIES AND EXCHANGE COMMISSION
Washington, D.C. 20549
FORM 10-Q
[X] QUARTERLY REPORT PURSUANT TO SECTION 13 OR 15(d) OF THE SECURITIES
EXCHANGE ACT OF 1934
For the quarterly period ended June 29, 2014
[_] TRANSITION REPORT PURSUANT TO SECTION 13 OR 15(d) OF THE SECURITIES
EXCHANGE ACT OF 1934
For the transition period from
Commission File No. 000-53577
DIVERSIFIED RESTAURANT HOLDINGS, INC.
(Exact name of registrant as specified in its charter)
|
Nevada |
|
03-0606420 |
|
(State or other jurisdiction of incorporation or organization) |
|
(I.R.S. Employer Identification Number) |
|
|
|
|
27680 Franklin Road
Southfield, Michigan 48034
(Address of principal executive offices)
Registrant’s telephone number: (248) 223-9160
No change
(Former name, former address and former
fiscal year, if changed since last report)
Indicate by check mark whether the registrant (1) has filed all reports required to be filed by Section 13 or 15(d) of the Securities Exchange Act of 1934 during the preceding 12 months (or for such shorter period that the registrant was required to file such reports), and (2) has been subject to such filing requirements for the past 90 days. Yes [X] No [ ]
Indicate by check mark whether the registrant has submitted electronically and posted on its corporate Web site, if any, every Interactive Data File required to be submitted and posted pursuant to Rule 405 of Regulation S-T (§ 232.405 of this chapter) during the preceding 12 months (or for such shorter period that the registrant was required to submit and post such files). Yes [X] No [ ]
APPLICABLE ONLY TO CORPORATE ISSUERS:
Indicate the number of shares outstanding of each of the issuer's classes of common stock, as of the latest practicable date: 26,139,120 shares of $.0001 par value common stock outstanding as of August 7, 2014.
Indicate by check mark whether the registrant is a large accelerated filer, an accelerated filer, a non-accelerated filer, or a smaller reporting company. See the definitions of "large accelerated filer," "accelerated filer" and "smaller reporting company" in Rule 12b-2 of the Exchange Act.
|
Large accelerated filer |
[ ] |
|
Accelerated filer |
[ X ] |
|
|
|
|
|
|
|
Non-accelerated filer |
[ ] |
|
Smaller reporting company |
[ ] |
(Do not check if a smaller reporting company)
Indicate by check mark whether the registrant is a shell company (as defined in Rule 12b-2 of the Exchange Act). Yes [ ] No [X]
APPLICABLE ONLY TO ISSUERS INVOLVED IN BANKRUPTCY
PROCEEDINGS DURING THE PRECEDING FIVE YEARS
Indicate by check mark whether the registrant has filed all documents and reports required to be filed by Sections 12, 13 or 15(d) of the Securities Exchange Act of 1934 subsequent to the distribution of securities under a plan confirmed by a court. Yes [ ] No [ ]
INDEX
|
PART I. FINANCIAL INFORMATION |
1 |
|
Item 1. Financial Statements |
1 |
|
Consolidated Balance Sheets |
1 |
|
Consolidated Statements of Operations |
2 |
|
Consolidated Statements of Comprehensive Income (loss) |
3 |
|
Consolidated Statements of Stockholders' Equity |
4 |
|
Consolidated Statements of Cash Flows |
5 |
|
Notes to Interim Consolidated Financial Statements |
6 |
|
Item 2. Management's Discussion and Analysis of Financial Condition and Results of Operations |
18 |
|
Item 3. Quantitative and Qualitative Disclosure About Market Risks |
25 |
|
Item 4. Controls and Procedures |
26 |
|
PART II. OTHER INFORMATION |
27 |
|
Item 1. Legal Proceedings |
27 |
|
Item 1A. Risk Factors |
27 |
|
Item 2. Unregistered Sales of Equity Securities and Use of Proceeds |
27 |
|
Item 3. Defaults Upon Senior Securities |
27 |
|
Item 5. Other Information |
27 |
|
Item 6. Exhibits |
27 |
PART I. FINANCIAL INFORMATION
Item 1. Financial Statements
DIVERSIFIED RESTAURANT HOLDINGS, INC. AND SUBSIDIARIES
CONSOLIDATED BALANCE SHEETS
|
June 29 2014 (UNAUDITED) |
December 29 2013 |
|||||||
| ASSETS | ||||||||
|
Current assets |
||||||||
|
Cash and cash equivalents |
$ | 9,302,130 | $ | 9,562,473 | ||||
|
Investments |
7,988,342 | 8,561,598 | ||||||
|
Accounts receivable |
287,239 | 1,248,940 | ||||||
|
Inventory |
1,122,679 | 1,017,626 | ||||||
|
Prepaid assets |
457,663 | 555,144 | ||||||
|
Total current assets |
19,158,053 | 20,945,781 | ||||||
|
Deferred income taxes |
1,371,023 | 1,162,761 | ||||||
|
Property and equipment, net |
67,916,250 | 58,576,734 | ||||||
|
Intangible assets, net |
3,182,243 | 2,948,013 | ||||||
|
Goodwill |
8,578,776 | 8,578,776 | ||||||
|
Other long-term assets |
190,908 | 121,668 | ||||||
|
Total assets |
$ | 100,397,253 | $ | 92,333,733 | ||||
|
LIABILITIES AND STOCKHOLDERS' EQUITY |
||||||||
|
Current liabilities |
||||||||
|
Accounts payable |
$ | 5,204,002 | $ | 4,416,092 | ||||
|
Accrued compensation |
1,939,610 | 2,060,082 | ||||||
|
Other accrued liabilities |
1,190,959 | 809,104 | ||||||
|
Current portion of long-term debt |
10,337,974 | 8,225,732 | ||||||
|
Current portion of deferred rent |
386,997 | 306,371 | ||||||
|
Total current liabilities |
19,059,542 | 15,817,381 | ||||||
|
Deferred rent, less current portion |
2,961,013 | 3,420,574 | ||||||
|
Unfavorable operating leases |
730,749 | 759,065 | ||||||
|
Other liabilities |
543,276 | 327,561 | ||||||
|
Long-term debt, less current portion |
42,708,675 | 38,047,589 | ||||||
|
Total liabilities |
66,003,255 | 58,372,170 | ||||||
|
Commitments and contingencies (Notes 10 and 11) |
||||||||
|
Stockholders' equity |
||||||||
|
Common stock - $0.0001 par value; 100,000,000 shares authorized; 26,074,063 and 26,049,578, respectively, issued and outstanding |
2,581 | 2,580 | ||||||
|
Additional paid-in capital |
35,455,649 | 35,275,255 | ||||||
|
Accumulated other comprehensive loss |
(260,685 | ) | (245,364 | ) | ||||
|
Accumulated deficit |
(803,547 | ) | (1,070,908 | ) | ||||
|
Total stockholders' equity |
34,393,998 | 33,961,563 | ||||||
|
Total liabilities and stockholders' equity |
$ | 100,397,253 | $ | 92,333,733 | ||||
The accompanying notes are an integral part of these interim consolidated financial statements.
DIVERSIFIED RESTAURANT HOLDINGS, INC. AND SUBSIDIARIES
CONSOLIDATED STATEMENTS OF OPERATIONS (UNAUDITED)
|
Three Months Ended |
Six Months Ended |
|||||||||||||||
|
June 29 |
June 30 |
June 29 |
June 30 |
|||||||||||||
|
2014 |
2013 |
2014 |
2013 |
|||||||||||||
|
Revenue |
$ | 30,009,621 | $ | 26,962,970 | $ | 60,482,635 | $ | 54,042,084 | ||||||||
|
Operating expenses |
||||||||||||||||
|
Restaurant operating costs (exclusive of depreciation and amortization shown separately below): |
||||||||||||||||
|
Food, beverage, and packaging |
8,622,748 | 8,001,240 | 17,328,171 | 16,577,287 | ||||||||||||
|
Compensation costs |
7,771,429 | 6,882,597 | 15,765,096 | 13,931,499 | ||||||||||||
|
Occupancy |
1,523,399 | 1,571,097 | 3,178,950 | 3,104,102 | ||||||||||||
|
Other operating costs |
6,127,461 | 5,357,337 | 12,407,556 | 10,663,971 | ||||||||||||
|
General and administrative expenses |
2,099,684 | 1,975,825 | 4,212,246 | 3,499,955 | ||||||||||||
|
Pre-opening costs |
910,115 | 803,798 | 1,454,136 | 1,396,524 | ||||||||||||
|
Depreciation and amortization |
2,498,871 | 1,813,549 | 4,746,331 | 3,469,033 | ||||||||||||
|
Loss on disposal of property and equipment |
164,255 | 25,667 | 320,320 | 60,741 | ||||||||||||
|
Total operating expenses |
29,717,962 | 26,431,110 | 59,412,806 | 52,703,112 | ||||||||||||
|
Operating profit |
291,659 | 531,860 | 1,069,829 | 1,338,972 | ||||||||||||
|
Interest expense |
(476,634 | ) | (585,637 | ) | (953,035 | ) | (1,054,848 | ) | ||||||||
|
Other income, net |
5,607 | 22,224 | 18,637 | 24,543 | ||||||||||||
|
Income (loss) before income taxes |
(179,368 | ) | (31,553 | ) | 135,431 | 308,667 | ||||||||||
|
Income tax provision (benefit) |
(78,872 | ) | (35,190 | ) | (131,930 | ) | 66,630 | |||||||||
|
Net income (loss) |
$ | (100,496 | ) | $ | 3,637 | $ | 267,361 | $ | 242,037 | |||||||
|
Basic earnings per share |
$ | 0.00 | $ | 0.00 | $ | 0.01 | $ | 0.01 | ||||||||
|
Fully diluted earnings per share |
$ | 0.00 | $ | 0.00 | $ | 0.01 | $ | 0.01 | ||||||||
|
Weighted average number of common shares outstanding |
||||||||||||||||
|
Basic |
26,067,958 | 24,680,247 | 26,058,381 | 21,820,046 | ||||||||||||
|
Diluted |
26,067,958 | 24,810,611 | 26,159,406 | 21,931,879 | ||||||||||||
The accompanying notes are an integral part of these interim consolidated financial statements.
DIVERSIFIED RESTAURANT HOLDINGS, INC. AND SUBSIDIARIES
CONSOLIDATED STATEMENTS OF COMPREHENSIVE INCOME (LOSS)
|
Three Months Ended |
Six Months Ended |
|||||||||||||||
|
June 29 |
June 30 |
June 29 |
June 30 |
|||||||||||||
|
2014 |
2013 |
2014 |
2013 |
|||||||||||||
|
Net income (loss) |
$ | (100,496 | ) | $ | 3,637 | $ | 267,361 | $ | 242,037 | |||||||
|
Other comprehensive income (loss) |
||||||||||||||||
|
Unrealized changes in fair value of interest rate swaps, net of tax of $32,726, $74,433, $17,093 and $95,327, respectively |
(63,527 | ) | 144,488 | (33,180 | ) | 185,043 | ||||||||||
|
Unrealized changes in fair value of invesments, net of tax of $2,677, $25,301, $9,200 and $25,301, respectively |
(5,197 | ) | (49,111 | ) | 17,859 | (49,111 | ) | |||||||||
|
Total other comprehensive income (loss) |
(68,724 | ) | 95,377 | (15,321 | ) | 135,932 | ||||||||||
|
Comprehensive income (loss) |
$ | (169,220 | ) | $ | 99,014 | $ | 252,040 | $ | 377,969 | |||||||
The accompanying notes are an integral part of these interim consolidated financial statements.
DIVERSIFIED RESTAURANT HOLDINGS, INC. AND SUBSIDIARIES
CONSOLIDATED STATEMENTS OF STOCKHOLDERS' EQUITY
|
Accumulated |
Retained |
|||||||||||||||||||||||
|
Additional |
Other |
Earnings |
Total |
|||||||||||||||||||||
|
Common Stock |
Paid-in |
Comprehensive |
(Accumulated |
Stockholders' |
||||||||||||||||||||
|
Shares |
Amount |
Capital |
Income (Loss) |
Deficit) |
Equity |
|||||||||||||||||||
|
Balances - December 30, 2012 |
18,951,700 | $ | 1,888 | $ | 2,991,526 | $ | (284,294 | ) | $ | (1,205,216 | ) | $ | 1,503,904 | |||||||||||
|
Issuance of restricted shares |
145,375 | - | - | - | - | - | ||||||||||||||||||
|
Forfeitures of restricted shares |
(47,899 | ) | - | - | - | - | - | |||||||||||||||||
|
Sale of common stock from follow-on offering, net of fees and expenses |
6,900,000 | 690 | 31,924,192 | - | - | 31,924,882 | ||||||||||||||||||
|
Stock options exercised |
144,000 | 2 | 74,997 | - | - | 74,999 | ||||||||||||||||||
|
Share-based compensation |
- | - | 135,105 | - | - | 135,105 | ||||||||||||||||||
|
Other comprehensive income |
- | - | - | 135,932 | - | 135,932 | ||||||||||||||||||
|
Net income |
- | - | - | - | 242,037 | 242,037 | ||||||||||||||||||
|
Balances - June 30, 2013 (unaudited) |
26,093,176 | $ | 2,580 | $ | 35,125,820 | $ | (148,362 | ) | $ | (963,179 | ) | $ | 34,016,859 | |||||||||||
|
Balances - December 29, 2013 |
26,049,578 | $ | 2,580 | $ | 35,275,255 | $ | (245,364 | ) | $ | (1,070,908 | ) | $ | 33,961,563 | |||||||||||
|
Issuance of restricted shares |
20,876 | - | - | - | - | |||||||||||||||||||
|
Forfeitures of restricted shares |
(1,900 | ) | - | - | - | - | - | |||||||||||||||||
|
Share-based compensation |
- | - | 153,007 | - | - | 153,007 | ||||||||||||||||||
|
Employee stock purchase plan |
5,509 | 1 | 27,387 | - | - | 27,388 | ||||||||||||||||||
|
Other comprehensive loss |
- | - | - | (15,321 | ) | - | (15,321 | ) | ||||||||||||||||
|
Net income |
- | - | - | - | 267,361 | 267,361 | ||||||||||||||||||
|
Balances - June 29, 2014 (unaudited) |
26,074,063 | $ | 2,581 | $ | 35,455,649 | $ | (260,685 | ) | $ | (803,547 | ) | $ | 34,393,998 | |||||||||||
The accompanying notes are an integral part of these interim consolidated financial statements.
DIVERSIFIED RESTAURANT HOLDINGS, INC. AND SUBSIDIARIES
CONSOLIDATED STATEMENTS OF CASH FLOWS (UNAUDITED)
|
Six Months Ended |
||||||||
|
June 29 |
June 30 |
|||||||
|
2014 |
2013 |
|||||||
|
Cash flows from operating activities |
||||||||
|
Net income |
$ | 267,361 | $ | 242,037 | ||||
|
Adjustments to reconcile net income to net cash provided by operating activities |
||||||||
|
Depreciation and amortization |
4,766,434 | 3,469,033 | ||||||
|
Realized loss on sales of investments |
19,175 | - | ||||||
| Write off of loan fees | - | 76,408 | ||||||
|
Loss on disposal of property and equipment |
320,320 | 60,741 | ||||||
|
Share-based compensation |
153,007 | 135,105 | ||||||
|
Deferred income taxes |
(200,367 | ) | 34,764 | |||||
|
Changes in operating assets and liabilities that provided (used) cash |
||||||||
|
Accounts receivable |
961,701 | (59,008 | ) | |||||
|
Inventory |
(105,053 | ) | (274,428 | ) | ||||
|
Prepaid assets |
97,481 | (70,687 | ) | |||||
|
Intangible assets |
(193,119 | ) | (557,933 | ) | ||||
|
Other long-term assets |
(69,240 | ) | (294,650 | ) | ||||
|
Accounts payable |
772,281 | (1,380,012 | ) | |||||
|
Accrued liabilities |
426,825 | 21,598 | ||||||
|
Deferred rent |
(378,935 | ) | 686,958 | |||||
|
Net cash provided by operating activities |
6,837,871 | 2,089,926 | ||||||
|
Cash flows from investing activities |
||||||||
|
Purchases of investments |
(7,469,555 | ) | (12,740,132 | ) | ||||
|
Proceeds from sale of investments |
8,050,693 | - | ||||||
|
Purchases of property and equipment |
(14,361,329 | ) | (9,878,354 | ) | ||||
|
Net cash used in investing activities |
(13,780,191 | ) | (22,618,486 | ) | ||||
|
Cash flows from financing activities |
||||||||
|
Proceeds from issuance of long-term debt |
10,445,616 | 52,402,101 | ||||||
|
Repayments of long-term debt |
(3,672,288 | ) | (56,803,584 | ) | ||||
|
Payment of loan fees |
(118,739 | ) | - | |||||
|
Proceeds from employee stock purchase plan |
27,388 | - | ||||||
|
Proceeds from sale of common stock, net of underwriter fees |
- | 31,999,881 | ||||||
|
Net cash provided by financing activities |
6,681,977 | 27,598,398 | ||||||
|
Net increase (decrease) in cash and cash equivalents |
(260,343 | ) | 7,069,838 | |||||
|
Cash and cash equivalents, beginning of period |
9,562,473 | 2,700,328 | ||||||
|
Cash and cash equivalents, end of period |
$ | 9,302,130 | $ | 9,770,166 | ||||
The accompanying notes are an integral part of these interim consolidated financial statements.
DIVERSIFIED RESTAURANT HOLDINGS, INC. AND SUBSIDIARIES
NOTES TO INTERIM CONSOLIDATED FINANCIAL STATEMENTS
1. BUSINESS AND SUMMARY OF SIGNIFICANT ACCOUNTING POLICIES
Nature of Business
Diversified Restaurant Holdings, Inc. (“DRH”) is a fast-growing restaurant company operating two complementary concepts: Bagger Dave’s Burger Tavern® (“Bagger Dave’s”) and Buffalo Wild Wings® Grill & Bar (“BWW”). As the creator, developer, and operator of Bagger Dave’s and as one of the largest franchisees of BWW, we provide a unique guest experience in a casual and inviting environment. We were incorporated in 2006 and are headquartered in the Detroit metropolitan area. As of June 29, 2014, we had 56 locations in Florida, Illinois, Indiana, and Michigan.
DRH and its wholly-owned subsidiaries (collectively, the “Company”), AMC Group, Inc. (“AMC”), AMC Wings, Inc. (“WINGS”), AMC Burgers, Inc. (“BURGERS”), and AMC Real Estate, Inc. (“REAL ESTATE”) own, operate, and manage Bagger Dave's and DRH-owned BWW restaurants located throughout Florida, Illinois, Indiana, and Michigan.
DRH originated the Bagger Dave’s concept with our first restaurant opening in January 2008 in Berkley, Michigan. Currently, there are 20 Bagger Dave’s, 14 in Michigan and six in Indiana. The Company expects to operate between 55 and 65 Bagger Dave’s locations by the end of 2017.
DRH is also one of the largest BWW franchisees and currently operates 40 DRH-owned BWW restaurants (18 in Michigan, 14 in Florida, four in Illinois, and four in Indiana), including the nation’s largest BWW, based on square footage, in downtown Detroit, Michigan. We remain on track to fulfill our area development agreement (“ADA”) with Buffalo Wild Wings International, Inc. (“BWLD”) and expect to operate 49 DRH-owned BWW restaurants by the end of 2017, exclusive of potential additional BWW restaurant acquisitions.
The following organizational chart outlines the current corporate structure of DRH. A brief textual description of the entities follows the organizational chart. DRH is incorporated in Nevada.
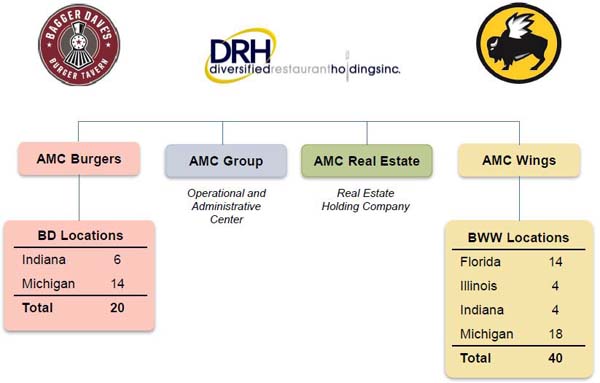
AMC was formed on March 28, 2007 and serves as our operational and administrative center. AMC renders management, operational support, and advertising services to WINGS, BURGERS, REAL ESTATE and their subsidiaries. Services rendered by AMC include marketing, restaurant operations, restaurant management consultation, hiring and training of management and staff, and other management services reasonably required in the ordinary course of restaurant operations.
BURGERS was formed on March 12, 2007 and serves as a holding company for our Bagger Dave’s restaurants. Bagger Dave’s Franchising Corporation, a subsidiary of BURGERS, was formed to act as the franchisor for the Bagger Dave’s concept and has rights to franchise in Illinois, Indiana, Kentucky, Michigan, Missouri, Ohio, and Wisconsin. We do not intend to pursue franchise development at this time.
WINGS was formed on March 12, 2007 and serves as a holding company for our DRH-owned BWW restaurants. We are economically dependent on retaining our franchise rights with BWLD. The franchise agreements have specific initial term expiration dates ranging from March 2020 through May 2034, depending on the date each was executed and the duration of its initial term. The franchise agreements are renewable at the option of the franchisor and are generally renewable if the franchisee has complied with the franchise agreement. When factoring in any applicable renewals, the franchise agreements have specific expiration dates ranging from March 2035 through May 2049. We believe we are in compliance with the terms of these agreements.
REAL ESTATE was formed on March 18, 2013 and serves as the holding company for the real estate properties owned by DRH. REAL ESTATE’s portfolio currently includes eight properties, four of which are Bagger Dave’s restaurants and four of which are DRH-owned BWW restaurants. The restaurants at these locations are all owned and operated by DRH.
Basis of Presentation
The consolidated financial statements as of June 29, 2014 and December 29, 2013, and for the three-month and six-month periods ended June 29, 2014 and June 30, 2013, have been prepared by the Company pursuant to accounting principles generally accepted in the United States of America (“GAAP”) and the rules and regulations of the Securities and Exchange Commission. The financial information as of June 29, 2014 and for the three-month and six-month periods ended June 29, 2014 and June 30, 2013 is unaudited, but, in the opinion of management, reflects all adjustments and accruals necessary for a fair presentation of the financial position, results of operations, and cash flows for the interim periods.
The consolidated financial information as of December 29, 2013 is derived from our audited consolidated financial statements and notes thereto for the fiscal year ended December 29, 2013, which is included in Item 8 in the Fiscal 2013 Annual Report on Form 10-K, and should be read in conjunction with such consolidated financial statements.
The results of operations for the three-month and six-month periods ended June 29, 2014 are not necessarily indicative of the results of operations that may be achieved for the entire year ending December 28, 2014.
Segment Reporting
The Company has two operating segments, Bagger Dave’s and BWW. The brands operate within the ultra-casual, full-service dining industry, providing similar products to similar customers. The brands also possess similar economic characteristics, resulting in similar long-term expected financial performance. Sales from external customers are derived principally from food and beverage sales. We do not rely on any major customers as a source of sales. We believe we meet the criteria for aggregating our operating segments into a single reporting segment.
Concentration Risks
Approximately 81.8% and 80.5% of the Company's revenues are generated from food and beverage sales of restaurants located in the Midwest region during the six-month periods ended June 29, 2014 and June 30, 2013, respectively.
Investments
The Company’s investment securities are classified as available-for-sale. Investments classified as available-for-sale are available to be sold in the future in response to the Company’s liquidity needs, changes in market interest rates, tax strategies, and asset-liability management strategies, among other reasons. Available-for-sale securities are reported at fair value, with unrealized gains and losses, net of taxes, reported in the accumulated other comprehensive income (loss) component of stockholders’ equity, and accordingly, have no effect on net income. Realized gains or losses on sale of investments are determined on the basis of specific costs of the investments. Dividend income is recognized when declared and interest income is recognized when earned. Discount or premium on debt securities purchased at other than par value are amortized using the effective yield method. See Note 3 for details.
Goodwill
Goodwill is not amortized and represents the excess of cost over the fair value of identified net assets of businesses acquired. Goodwill is subject to an annual impairment analysis or more frequently if indicators of impairment exist. At June 29, 2014 and December 29, 2013, we had goodwill of $8.6 million that was assigned to our BWW operating segments.
The impairment analysis, if necessary, consists of a two-step process. The first step is to compare the fair value of the reporting unit to its carrying value, including goodwill. We estimate fair value using market information (market approach) and discounted cash flow projections (income approach). The income approach uses the reporting unit’s projection of estimated operating results and cash flows that is discounted using a weighted-average cost of capital that reflects market conditions. The projection uses management’s best estimates of projected revenue, costs and cash expenditures, including an estimate of new restaurant openings and related capital expenditures. Other significant estimates also include terminal growth rates and working capital requirements. We supplement our estimate of fair value under the income approach by using a market approach which estimates fair value by applying multiples to the reporting unit’s projected operating performance. The multiples are derived from comparable publicly traded companies with similar characteristics to the reporting unit. If the fair value of the reporting unit is less than its carrying value, the second step of the impairment analysis must be performed in order to determine the amount of impairment loss, if any. The second step compares the implied fair value of goodwill with the carrying amount of that goodwill. If the carrying amount of the goodwill exceeds its implied fair value, an impairment charge is recognized in an amount equal to that excess. As of December 29, 2013, based on our quantitative analysis, goodwill was considered recoverable. At June 29, 2014, there were no impairment indicators warranting an analysis.
Use of Estimates
The preparation of consolidated financial statements in conformity with GAAP requires management to make estimates and assumptions that affect the reported amounts of assets and liabilities and disclosure of contingent assets and liabilities at the date of the consolidated financial statements and the reported amounts of income and expenses during the reporting period. Actual results could differ from those estimates
Interest Rate Swap Agreements
The Company utilizes interest rate swap agreements with RBS Citizens, N.A. (“RBS”) to fix interest rates on a portion of the Company’s portfolio of variable rate debt, which reduces exposure to interest rate fluctuations. The Company does not use any other types of derivative financial instruments to hedge such exposures, nor does it use derivatives for speculative purposes. The Company’s interest rate swap agreements qualify for hedge accounting. As such, the Company records the change in the fair value of its swap agreements as a component of accumulated other comprehensive income (loss), net of tax. The Company records the fair value of its interest swaps on the Consolidated Balance Sheet in other long-term assets or other long-term liabilities depending on the fair value of the swaps. See Note 7 and Note 14 for additional information on the interest rate swap agreements.
Recent Accounting Pronouncements
In May 2014, the Financial Accounting Standards Board ("FASB") issued Accounting Standards Update No. 2014-09, Revenue from Contracts with Customers ("ASU 2014-09"), which supersedes nearly all existing revenue recognition guidance under U.S. GAAP. The core principle of ASU 2014-09 is to recognize revenues when promised goods or services are transferred to customers in an amount that reflects the consideration to which an entity expects to be entitled for those goods or services. ASU 2014-09 defines a five step process to achieve this core principle and, in doing so, more judgment and estimates may be required within the revenue recognition process than are required under existing U.S. GAAP. The standard is effective for annual periods beginning after December 15, 2016, and interim periods therein. We are currently evaluating the impact of our pending adoption of ASU 2014-09, although based on the nature of our business we do not expect the standard will have a significant impact on our consolidated financial statements.
2. SIGNIFICANT BUSINESS TRANSACTIONS
On April 23, 2013, the Company completed an underwritten, follow-on equity offering of 6.9 million shares of common stock at a price of $5.00 per share to the public. After deducting underwriting discounts, commissions, and other offering expenses the net proceeds to DRH were $31.9 million. The Company invested a portion of the proceeds from the follow-on offering in highly liquid short-term investments with maturities of less than one year. At June 29, 2014, the Company held available-for-sale securities with an estimated fair value of $8.0 million. See Note 3 for additional information.
3. INVESTMENTS
Investments consist of available-for-sale securities that are carried at fair value. Available-for-sale securities are classified as current assets based upon our intent and ability to use any and all of the securities as necessary to satisfy the operational requirements of our business. Based on the call date of the investments, all securities have maturities of one year or less. Unrealized losses are charged against net earnings when a decline in fair value is determined to be other than temporary.
The amortized cost, gross unrealized holding gains, gross unrealized holding loss, and fair value of available-for-sale securities by type are as follows:
|
June 29, 2014 |
||||||||||||||||
|
Amortized Cost |
Unrealized Gains |
Unrealized Loss |
Estimated Fair Value |
|||||||||||||
|
Debt securities: |
||||||||||||||||
|
U.S. government and agencies |
$ | 1,998,572 | $ | 1,288 | $ | - | $ | 1,999,860 | ||||||||
|
Obligations of states/municipals |
2,613,309 | - | (282 |
) |
2,613,027 | |||||||||||
|
Corporate securities |
3,393.607 | 6 | (18,158 |
) |
3,375,455 | |||||||||||
|
Total debt securities |
$ | 8,005,488 | $ | 1,294 | $ | (18,440 |
) |
$ | 7,988,342 | |||||||
|
December 29, 2013 |
||||||||||||||||
|
Amortized Cost |
Unrealized Gains |
Unrealized Loss |
Estimated Fair Value |
|||||||||||||
|
Debt securities: |
||||||||||||||||
|
U.S. government and agencies |
$ | 3,497,951 | $ | 236 | $ | (52 |
) |
$ | 3,498,135 | |||||||
|
Corporate securities |
5,107,853 | - | (44,390 |
) |
5,063,463 | |||||||||||
|
Total debt securities |
$ | 8,605,804 | $ | 236 | $ | (44,442 |
) |
$ | 8,561,598 | |||||||
As of June 29, 2014 and December 29, 2013, $5.7 million and $7.0 million of investments were in a loss position with a cumulative unrealized loss of $18,440 and $44,442, respectively. The Company may incur future impairment charges if decline in market values continue and/or worsen and the impairments are no longer considered temporary. All investments with unrealized losses have been in such position for less than 12 months.
Gross unrealized gains and losses on available-for-sale securities, recorded in accumulated other comprehensive income (loss), as of June 29, 2014 and December 29, 2013, were as follows:
|
June 29 2014 |
December 29 2013 |
|||||||
|
Unrealized gains |
$ | 1,294 | $ | 236 | ||||
|
Unrealized loss |
(18,440 |
) |
(44,442 |
) | ||||
|
Net unrealized loss |
(17,146 |
) |
(44,206 |
) | ||||
|
Deferred federal income tax benefit |
5,829 | 15,030 | ||||||
|
Net unrealized loss on investments, net of deferred income tax |
$ | (11,317 |
) |
$ | (29,176 |
) | ||
4. PROPERTY AND EQUIPMENT
Property and equipment are comprised of the following assets:
|
June 29 2014 |
December 29 2013 |
|||||||
|
Land |
$ | 4,794,694 | $ | 3,610,453 | ||||
|
Building |
4,316,263 | 4,316,263 | ||||||
|
Equipment |
24,574,885 | 22,212,594 | ||||||
|
Furniture and fixtures |
6,297,528 | 5,822,813 | ||||||
|
Leasehold improvements |
53,000,619 | 46,469,088 | ||||||
|
Restaurant construction in progress |
3,282,056 | 2,434,332 | ||||||
|
Total |
96,266,045 | 84,865,543 | ||||||
|
Less accumulated depreciation |
(28,349,795 |
) |
(26,288,809 |
) | ||||
|
Property and equipment, net |
$ | 67,916,250 | $ | 58,576,734 | ||||
5. INTANGIBLE ASSETS
Intangible assets are comprised of the following:
|
June 29 2014 |
December 29 2013 |
|||||||
|
Amortized intangibles: |
||||||||
|
Franchise fees |
$ | 604,613 | $ | 568,363 | ||||
|
Trademark |
62,514 | 59,199 | ||||||
|
Non-compete agreement |
76,560 | 76,560 | ||||||
|
Favorable lease |
239,000 | 239,000 | ||||||
|
Loan fees |
465,497 | 346,758 | ||||||
|
Total |
1,448,184 | 1,289,880 | ||||||
|
Less accumulated amortization |
(438,637 |
) |
(361,009 |
) | ||||
|
Amortized intangibles, net |
1,009,547 | 928,871 | ||||||
|
Unamortized intangibles: |
||||||||
|
Liquor licenses |
2,172,696 | 2,019,142 | ||||||
|
Total intangibles, net |
$ | 3,182,243 | $ | 2,948,013 | ||||
Amortization expense for the three-month periods ended June 29, 2014 and June 30, 2013, was $14,831 and $13,745, respectively. Amortization expense for the six-month periods ended June 29, 2014 and June 30, 2013, was $29,209 and $27,448, respectively. Amortization of favorable leases and loan fees are reflected as part of occupancy and interest expense, respectively.
Based on the current intangible assets and their estimated useful lives, future intangible-related expense for the next five years is projected as follows:
|
Year |
Amount |
|||
|
Remainder of 2014 |
$ | 83,797 | ||
|
2015 |
162,050 | |||
|
2016 |
143,870 | |||
|
2017 |
142,335 | |||
|
2018 |
67,773 | |||
|
2019 and thereafter |
409,722 | |||
|
Total |
$ | 1,009,547 | ||
The aggregate weighted-average amortization period for intangible assets is 7.9 years.
6. RELATED PARTY TRANSACTIONS
Fees for monthly accounting and financial statement services are paid to an entity owned by a member of the DRH Board of Directors and a stockholder of the Company. Fees paid during the three-month periods ended June 29, 2014 and June 30, 2013, were $121,950, $100,045, respectively, and fees paid during the six-month periods ended June 29, 2014 and June 30, 2013, were $247,938 and $194,202, respectively.
See Note 10 for related party operating lease transactions.
7. LONG-TERM DEBT
Long-term debt consists of the following obligations:
|
June 29 2014 |
December 29 2013 |
|||||||
|
Note payable - $46.0 million term loan; payable to RBS with a senior lien on all the Company’s personal property and fixtures. Scheduled monthly principal payments are approximately $547,619 plus accrued interest through maturity in April 2018. Interest is charged based on one-month LIBOR plus an applicable margin, which ranges from 2.25% to 3.15%, depending on the lease adjusted leverage ratio defined in the terms of the agreement. The rate at June 29, 2014 was approximately 2.7%. |
$ | 28,333,333 | 31,619,048 | |||||
|
Note payable - $15.0 million development line of credit; payable to RBS with a senior lien on all the Company’s personal property and fixtures. Scheduled monthly principal payments are $178,571 plus accrued interest through maturity in April 2018. Interest is charged based on one-month LIBOR plus an applicable margin, which ranges from 2.25% to 3.15%, depending on the lease adjusted leverage ratio defined in the terms of the agreement. The rate at June 29, 2014 was approximately 2.7%. |
14,642,857 | 12,759,420 | ||||||
|
Note payable - $20.0 million development line of credit II; payable to RBS with a senior lien on all the Company’s personal property and fixtures. Interest is charged based on one-month LIBOR plus an applicable margin, which ranges from 2.25% to 3.15%, depending on the lease adjusted leverage ratio defined in the terms of the agreement. The rate at June 29, 2014 was approximately 2.7%. Once fully drawn, payments will be due monthly; the note matures in April 2018. |
8,205,037 | - | ||||||
|
Note payable to a bank secured by a senior mortgage on the Brandon Property. Scheduled monthly principal and interest payments are approximately $8,000 through maturity in June 2030, at which point a balloon payment of $413,550 is due. Interest is charged based on a fixed rate of 6.7%, per annum, through June 2017, at which point the rate will adjust to the U.S. Treasury Securities Rate plus 4.0% (and every seven years thereafter). |
1,069,641 | 1,081,047 | ||||||
|
Note payable to a bank secured by a junior mortgage on the Brandon Property. The note matures in 2030 and requires monthly principal and interest installments of approximately $6,300 until maturity. Interest is charged at a rate of 3.6% per annum. |
795,781 | 813,806 | ||||||
|
Total long-term debt |
53,046,649 | 46,273,321 | ||||||
|
Less current portion |
(10,337,974 | ) | (8,225,732 |
) | ||||
|
Long-term debt, net of current portion |
$ | 42,708,675 | $ | 38,047,589 | ||||
On April 15, 2013, the Company entered into a $63.0 million senior secured credit facility with RBS (the “April 2013 Senior Secured Credit Facility”). The April 2013 Senior Secured Credit Facility consists of a $46.0 million term loan (the “April 2013 Term Loan”), a $15.0 million development line of credit (the “April 2013 DLOC”), and a $2.0 million revolving line of credit (the “April 2013 RLOC”). The April 2013 Term Loan is for a period of five years. Payments of principal are based upon an 84-month straight-line amortization schedule, with monthly principal payments of $547,619 plus accrued interest through maturity on April 15, 2018, at which time the entire unpaid principal and interest is due. The April 2013 DLOC converted to a term loan on March 11, 2014, with monthly principal payments of $178,571 plus accrued interest beginning May 2014 through maturity on April 15, 2018, at which time the entire unpaid principal and interest is due. The April 2013 RLOC is for a term of two years. As of June 29, 2014 no amounts were outstanding under the April 2013 RLOC. Amounts borrowed under the April 2013 Senior Secured Credit Facility bear interest at a rate of one-month LIBOR plus an applicable margin.
On March 20, 2014, the Company amended the April 2013 Senior Secured Credit Facility to include a $20.0 million development line of credit II (the “March 2014 DLOC II”). The March 2014 DLOC II is for a term of two years and is convertible upon maturity into a term note. The amendment also provided a 25 basis point reduction to the April 2013 Senior Secured Credit Facility’s applicable margin rate, which reduced the range from 2.5%/3.4% to 2.25%/3.15%, which commenced April 2014.
Based on the long-term debt terms that existed at June 29, 2014, the scheduled principal maturities for the next five years and thereafter are summarized as follows:
|
Year |
Amount |
|||
|
Remainder of 2014 |
$ | 4,774,724 | ||
|
2015 |
11,120,898 | |||
|
2016 |
11,123,797 | |||
|
2017 |
11,127,258 | |||
|
2018 |
13,329,753 | |||
|
2019 and thereafter |
1,570,219 | |||
|
Total |
$ | 53,046,649 | ||
For the three-month periods ended and six-month periods ended June 29, 2014 and June 30, 2013, interest expense was $476,634, $585,637, $1.0 million and $1.1 million, respectively.
The current debt agreement contains various customary financial covenants generally based on the performance of the specific borrowing entity and other related entities. The more significant covenants consist of a minimum debt service coverage ratio and a maximum lease adjusted leverage ratio, both of which we are in compliance with as of June 29, 2014.
At June 29, 2014, the Company has four interest rate swap agreements to fix a portion of the interest rates on its variable rate debt. The swap agreements all qualify for hedge accounting. The swap agreements have a combined notional amount of $28.8 million at June 29, 2014. Under the swap agreements, the Company receives interest at the one-month LIBOR and pays a fixed rate. The April 2012 swap has a rate of 1.4% (notional amount of $11.0 million) and expires April 2019, the October 2012 swap has a rate of 0.9% (notional amount of $4.5 million) and expires October 2017, the December 2013 swap has a rate of 1.4% (notional amount of $13.3 million) and expires April 2018, and the April 2015 forward swap has a rate of 1.54%. The fair value of these swap agreements was $377,834 and $327,561 at June 29, 2014 and December 29, 2013, respectively. Since these swap agreements qualify for hedge accounting, the changes in fair value are recorded in other comprehensive income (loss), net of tax. See Note 1 and Note 14 for additional information pertaining to interest rate swaps.
8. STOCK-BASED COMPENSATION
The Company established a Stock Incentive Plan in 2011 (“Stock Incentive Plan”) to attract and retain directors, consultants, and team members and to align their interests with the interests of the Company’s shareholders through the opportunity for increased stock ownership. The plan permits the grant and award of 750,000 shares of common stock by way of stock options and/or restricted stock. Stock options must be awarded at exercise prices at least equal to or greater than 100.0% of the fair market value of the shares on the date of grant. The options will expire no later than 10 years from the date of grant, with vesting terms to be defined at grant date, ranging from a vesting schedule based on performance to a vesting schedule that extends over a period of time as selected by the Compensation Committee of the Board of Directors (the “Committee”) or another committee as determined by the Board of Directors. The Committee also determines the grant, issuance, retention, and vesting timing and conditions of awards of restricted stock. The Committee may place limitations, such as continued employment, passage of time, and/or performance measures, on restricted stock. Awards of restricted stock may not provide for vesting or settlement in full of restricted stock over a period of less than one year from the date the award is made.
During 2014, restricted shares were granted to certain team members at a weight-average fair value of $4.79. In fiscal 2013, restricted shares were issued to certain team members at a weighted-average grant date fair value of $5.37. Restricted shares are granted with a per share purchase price at 100.0% of the fair market value on the date of grant. Based on the Stock Award Agreement, shares vest ratably over a three year period or upon the three year anniversary of the granted shares, the vesting terms are determined by the Committee. Unrecognized stock-based compensation expense of $442,185 at June 29, 2014 will be recognized over the remaining weighted-average vesting period of 2.1 years. The total fair value of shares vested during the six months ended June 29, 2014 and June 30, 2013 was $46,167 and $67,817, respectively. Under the Stock Incentive Plan, there are 614,357 shares available for future awards at June 29, 2014.
The Company also reserved 250,000 shares of common stock for issuance under the Employee Stock Purchase Plan (“ESPP”). The ESPP is available to team members subject to employment eligibility requirements. Participants may purchase common stock at 85.0% of the lesser of the start or end price for the offering period. The plan has four offering periods, each start/end dates coincide with the fiscal quarter and are awarded on the last day of the offering period. During 2014 and 2013, we issued 5,509 and 405 shares, respectively. Under the ESPP, there are 239,718 shares available for future awards at June 29, 2014.
The following table presents the restricted shares transactions as of June 29, 2014:
|
Number of Restricted Stock Shares |
||||
|
Unvested, December 29, 2013 |
116,667 | |||
|
Granted |
20,876 | |||
|
Vested |
(32,558 |
) | ||
|
Expired/Forfeited |
(1,900 |
) | ||
|
Unvested, June 29, 2014 |
103,085 | |||
The following table presents the restricted shares transactions as of June 30, 2013:
|
Number of Restricted Stock Shares |
||||
|
Unvested, December 30, 2012 |
54,900 | |||
|
Granted |
145,375 | |||
|
Vested |
(13,167 |
) | ||
|
Expired/Forfeited |
(47,899 |
) | ||
|
Unvested, June 30, 2013 |
139,209 | |||
On July 30, 2007, DRH granted options for the purchase of 150,000 shares of common stock to the directors of the Company at an exercise price of $2.50 per share. These options vested ratably over a three-year period and were set to expire six years from issuance, July 30, 2013. All 150,000 options were fully vested as of July 30, 2013 and were exercised either through cash or cashless exercise at a price of $2.50 per share. The intrinsic value of options exercised in 2013 was $679,680.
On July 30, 2010, DRH granted options for the purchase of 210,000 shares of common stock to the directors of the Company. These options are fully vested and expire six years from issuance, July 30, 2016. Once vested, the options can be exercised at a price of $2.50 per share. At June 29, 2014, 210,000 shares of authorized common stock are reserved for issuance to provide for the exercise of these options. The intrinsic value of outstanding options is $630,000 and $1.1 million as of June 29, 2014 and June 30, 2013, respectively.
Stock-based compensation of $67,687 and $56,053 was recognized, during the three-month periods ended June 29, 2014 and June 30, 2013, respectively, and $153,007, and $135,105 for the six-month periods ended June 29, 2014 and June 30, 2013, respectively, as compensation cost in the consolidated statements of operations and as additional paid-in capital on the consolidated statement of stockholders' equity to reflect the fair value of shares vested.
The Company has authorized 10,000,000 shares of preferred stock at a par value of $0.0001. No preferred shares are issued or outstanding as of June 29, 2014. Any preferences, rights, voting powers, restrictions, dividend limitations, qualifications, and terms and conditions of redemption shall be set forth and adopted by a Board of Directors' resolution prior to issuance of any series of preferred stock.
9. INCOME TAXES
The (benefit) provision for income taxes consists of the following components for the three-month and six-month periods ended June 29, 2014 and June 30, 2013, respectively:
|
Three Months Ended |
Six Months Ended |
|||||||||||||||
|
June 29 2014 |
June 30 2013 |
June 29 2014 |
June 30 2013 |
|||||||||||||
|
Federal: |
||||||||||||||||
|
Current |
$ | - | $ | - | $ | - | $ | - | ||||||||
|
Deferred |
(107,605 |
) |
(40,407 | ) | (169,308 | ) | 38,154 | |||||||||
|
State: |
||||||||||||||||
|
Current |
29,158 | 6,652 | 68,437 | 31,866 | ||||||||||||
|
Deferred |
(425 | ) | (1,435 | ) | (31,059 | ) | (3,390 | ) | ||||||||
|
Income tax provision (benefit) |
$ | (78,872 |
) |
$ | (35,190 | ) | $ | (131,930 | ) | $ | 66,630 | |||||
The (benefit) provision for income taxes is different from that which would be obtained by applying the statutory federal income tax rate to income before income taxes before income taxes. The items causing this difference are as follows:
|
June 29 2014 |
June 30 2013 |
|||||||
|
Income tax provision at federal statutory rate |
$ | 46,047 | $ | 104,947 | ||||
|
State income tax provision |
24,669 | 28,476 | ||||||
|
Permanent differences |
97,648 | 29,137 | ||||||
|
Tax credits |
(300,294 |
) |
(95,930 |
) | ||||
|
Income tax provision (benefit) |
$ | (131,930 | ) | $ | 66,630 | |||
Deferred income taxes reflect the net tax effects of temporary differences between the carrying amounts of assets and liabilities for financial reporting purposes and the amounts used for income tax purposes. The Company expects the deferred tax assets to be fully realizable within the next several years. Significant components of the Company's deferred income tax assets and liabilities are summarized as follows:
|
June 29 2014 |
December 29 2013 |
|||||||
|
Deferred tax assets: |
||||||||
|
Net operating loss carry forwards |
$ | 662,145 | $ | 983,682 | ||||
|
Deferred rent expense |
- | 131,249 | ||||||
|
Start-up costs |
128,812 | 130,136 | ||||||
|
Tax credit carry forwards |
2,692,186 | 2,427,861 | ||||||
|
Interest rate swaps |
128,462 | 111,218 | ||||||
|
Investments |
5,829 | 15,030 | ||||||
|
Stock-based compensation |
182,771 | 129,514 | ||||||
|
Other |
214,463 | 186,814 | ||||||
|
Total deferred tax assets |
4,014,668 | 4,115,504 | ||||||
|
Deferred tax liabilities: |
||||||||
|
Tax depreciation in excess of book |
2,328,493 | 2,708,544 | ||||||
|
Other |
315,152 | 244,199 | ||||||
|
Total deferred tax liabilities |
2,643,645 | 2,952,743 | ||||||
|
Net deferred income tax asset |
$ | 1,371,023 | $ | 1,162,761 | ||||
If deemed necessary by management, the Company establishes valuation allowances in accordance with the provisions of Accounting Standards Codification (“ASC”) 740, Income Taxes ("ASC 740") issued by FASB. Management continually reviews the likelihood that deferred tax assets will be realized and the Company recognizes these benefits only as reassessment indicates that it is more likely than not that such tax benefits will be realized.
The Company expects to use net operating loss and general business tax credit carryforwards before their 20-year expiration. As of June 29, 2014, the Company has available federal net operating loss carryforwards of approximately $2.5 million. Of that amount, approximately $600,000 relates to stock-based compensation tax deductions in excess of book compensation expense that will be credited to additional paid in capital in future periods when such deductions reduce taxes payable as determined based on a "with-and-without" approach. Net operating losses relating to such benefits are not included in the table above. General business tax credits of $2.7 million will expire between 2028 and 2035.
The Company applies the provisions of ASC 740 regarding the accounting for uncertainty in income taxes. There are no amounts recorded on the Company's consolidated financial statements for uncertain positions. The Company classifies all interest and penalties as income tax expense. There are no accrued interest amounts or penalties related to uncertain tax positions as of June 29, 2014.
The Company is a member of a unitary group with other parties related by common ownership according to the provisions of the Michigan Business Tax Act. This group files a single tax return for all members. An allocation of the current and deferred Michigan business tax incurred by the unitary group has been made based on an estimate of Michigan business tax attributable to the Company and has been reflected as state income tax expense in the accompanying consolidated financial statements consistent with the provisions of ASC 740.
The Company files income tax returns in the United States federal jurisdiction and various state jurisdictions.
10. OPERATING LEASES (INCLUDING RELATED PARTY)
Lease terms range from four to 20 years, generally include renewal options, and frequently require us to pay a proportionate share of real estate taxes, insurance, common area maintenance, and other operating costs. Some restaurant leases provide for contingent rental payments based on sales thresholds.
Total rent expense was $1.1 million and $1.3 million for the three-month periods ended June 29, 2014 and June 30, 2013, respectively (of which $34,571 and $18,755, respectively, were paid to a related party). Total rent expense was $2.4 million and $2.5 million for the six-month periods ended June 29, 2014 and June 30, 2013, respectively (of which $69,392 and $37,574, respectively, were paid to a related party).
11. COMMITMENTS AND CONTINGENCIES
The Company’s ADA requires DRH to open 32 restaurants by March 1, 2017. Failure to develop restaurants in accordance with the schedule detailed in the agreement could lead to potential penalties of up to $50,000 for each undeveloped restaurant, payment of the initial franchise fees for each undeveloped restaurant, and loss of rights to development territory. As of June 29, 2014, we have opened 21 of the 32 restaurants required by the ADA. With the remaining 11 restaurants, along with two additional franchise agreements, we expect the Company will operate 49 BWW restaurants by 2017, exclusive of potential additional BWW restaurant acquisitions.
The Company is required to pay BWLD royalties (5.0% of net sales) and advertising fund contributions (3.0% of net sales globally and 0.5% of net sales for certain cities) for the term of the individual franchise agreements. The Company incurred $1.2 million for the three-month periods ended June 29, 2014 and June 30, 2013 and $2.5 million and $2.4 million for six-month periods ended June 29, 2014 and June 30, 2013, respectively. Advertising fund contribution expenses were $1.6 million and $780,659 for the three-month periods ended June 29, 2014 and June 30, 2013 and $2.4 million and $1.6 million for six-month periods ended June 29, 2014 and June 30, 2013, respectively.
The Company is required by its various BWLD franchise agreements to modernize the restaurants during the term of the agreements. The individual agreements generally require improvements between the fifth and tenth year to meet the most current design model that BWLD has approved. The modernization costs for a restaurant can range from approximately $50,000 to approximately $700,000 depending on an individual restaurant's needs.
The Company is subject to ordinary and routine legal proceedings, as well as demands, claims and threatened litigation, which arise in the ordinary course of its business. The ultimate outcome of any litigation is uncertain. While unfavorable outcomes could have adverse effects on the Company's business, results of operations, and financial condition, management believes that the Company is adequately insured and does not believe an unfavorable outcome of any pending or threatened proceedings is probable or reasonably possible. Therefore, no separate reserve or disclosure has been established for these types of legal proceedings.
12. EARNINGS PER COMMON SHARE
The following is a reconciliation of basic and fully diluted earnings per common share for the three-month and six-month periods ended June 29, 2014 and June 30, 2013:
|
Three months ended |
||||||||
|
June 29 2014 |
June 30 2013 |
|||||||
|
Income (loss) available to common stockholders |
$ | (100,496 | ) | $ | 3,637 | |||
|
Weighted-average shares outstanding |
26,067,958 | 24,680,247 | ||||||
|
Effect of dilutive securities |
- | 130,364 | ||||||
|
Weighted-average shares outstanding - assuming dilution |
26,067,958 | 24,810,611 | ||||||
|
Earnings per common share |
$ | 0.00 | $ | 0.00 | ||||
|
Earnings per common share - assuming dilution |
$ | 0.00 | $ | 0.00 | ||||
|
Six months ended |
||||||||
|
June 29 2014 |
June 30 2013 |
|||||||
|
Income available to common stockholders |
$ | 267,361 | $ | 242,037 | ||||
|
Weighted-average shares outstanding |
26,058,381 | 21,820,046 | ||||||
|
Effect of dilutive securities |
101,025 | 111,833 | ||||||
|
Weighted-average shares outstanding - assuming dilution |
26,159,406 | 21,931,879 | ||||||
|
Earnings per common share |
$ | 0.01 | $ | 0.01 | ||||
|
Earnings per common share - assuming dilution |
$ | 0.01 | $ | 0.01 | ||||
13. SUPPLEMENTAL CASH FLOWS INFORMATION
Other Cash Flows Information
Cash paid for interest was $432,094 and $575,254 during the three-month periods ended June 29, 2014 and June 30, 2013, and $896,209 and $1.1 million for the six-month periods ended June 29, 2014 and June 30, 2013, respectively.
Cash paid for income taxes was $0 during the three-month periods ended June 29, 2014 and June 30, 2013, respectively, and $0 and $65,500 for the six-month periods ended June 29, 2014 and June 30, 2013, respectively.
Supplemental Schedule of Non-Cash Operating, Investing, and Financing Activities
Noncash investing activities for property and equipment not yet paid as of June 29, 2014 and June 30, 2013, is $1.9 million and $0.2 million, respectively.
14. FAIR VALUE OF FINANCIAL INSTRUMENTS
The guidance for fair value measurements, FASB ASC 820, Fair Value Measurements and Disclosures, establishes the authoritative definition of fair value, sets out a framework for measuring fair value, and outlines the required disclosures regarding fair value measurements. Fair value is the price that would be received to sell an asset or paid to transfer a liability (an exit price) in the principal or most advantageous market for the asset or liability in an orderly transaction between market participants at the measurement date. We use a three-tier fair value hierarchy based upon observable and non-observable inputs as follows:
|
● |
Level 1 |
Quoted market prices in active markets for identical assets and liabilities; |
|
● |
Level 2 |
Inputs, other than level 1 inputs, either directly or indirectly observable; and |
|
● |
Level 3 |
Unobservable inputs developed using internal estimates and assumptions (there is little or no market data) which reflect those that market participants would use. |
As of June 29, 2014 and December 29, 2013, respectively, our financial instruments consisted of cash and cash equivalents, accounts receivable, available-for-sale investments, accounts payable, and debt. The fair value of cash and cash equivalents, accounts receivable, and accounts payable approximate carrying value, due to their short-term nature.
The fair value of our interest rate swaps is determined based on valuation models, which utilize quoted interest rate curves to calculate the forward value and then discount the forward values to the present period. The Company measures the fair value using broker quotes which are generally based on market observable inputs including yield curves and the value associated with counterparty credit risk. Our interest rate swaps are classified as a Level 2 measurement as these securities are not actively traded in the market, but are observable based on transactions associated with bank loans with similar terms and maturities. See Note 1 and Note 7 for additional information pertaining to interest rates swaps.
The estimated fair values of the Company’s investment portfolio are based on prices provided by a third party pricing service and a third party investment manager. The prices provided by these services are based on quoted market prices, when available, non-binding broker quotes, or matrix pricing. The third party pricing service and the third party investment manager provide a single price or quote per security and the Company has not historically adjusted security prices. The Company obtains an understanding of the methods, models and inputs used by the third party pricing service and the third party investment manager, and has controls in place to validate that amounts provided represent fair values. Our investments are classified as a Level 2 measurement as these securities are not actively traded in the market, but are observable based on the quoted prices provided by our Portfolio managers.
As of June 29, 2014 and December 29, 2013, our total debt was approximately $53.0 million and $46.3 million, respectively, which approximated fair value. The Company estimates the fair value of its fixed-rate debt using discounted cash flow analysis based on the Company’s incremental borrowing rate (Level 2).
There were no transfers between levels of the fair value hierarchy during the three and six months ended June 29, 2014 and the fiscal year ended December 29, 2013.
The following table presents the fair values for those assets and liabilities measured on a recurring basis as of June 29, 2014:
|
FAIR VALUE MEASUREMENTS |
||||||||||||||||
|
Description |
Level 1 |
Level 2 |
Level 3 |
Asset/(Liability) Total |
||||||||||||
|
Interest rate swaps |
$ | - | $ | (377,834 |
) |
$ | - | $ | (377,834 |
) | ||||||
|
Debt securities |
||||||||||||||||
|
U.S. government and agencies |
- | 1,999,860 | - | 1,999,860 | ||||||||||||
|
Obligations of states/municipals |
- | 2,613,027 | - | 2,613,027 | ||||||||||||
|
Corporate securities |
- | 3,375,455 | - | 3,375,455 | ||||||||||||
|
Total debt securities |
- | 7,988,342 | - | 7,988,342 | ||||||||||||
|
Total debt securities and derivatives |
$ | - | $ | 7,610,508 | $ | - | $ | 7,610,508 | ||||||||
The following table presents the fair values for those assets and liabilities measured on a recurring basis as of December 29, 2013:
|
FAIR VALUE MEASUREMENTS |
||||||||||||||||
|
Description |
Level 1 |
Level 2 |
Level 3 |
Asset/(Liability) Total |
||||||||||||
|
Interest rate swaps |
$ | - | $ | (327,561 |
) |
$ | - | $ | (327,561 |
) | ||||||
|
Debt securities |
||||||||||||||||
|
U.S. government and agencies |
- | 3,498,135 | - | 3,498,135 | ||||||||||||
|
Corporate securities |
- | 5,063,463 | - | 5,063,463 | ||||||||||||
|
Total debt securities |
- | 8,561,598 | - | 8,561,598 | ||||||||||||
|
Total debt securities and swaps |
$ | - | $ | 8,234,037 | $ | - | $ | 8,234,037 | ||||||||
15. ACCUMULATED OTHER COMPREHENSIVE INCOME (LOSS)
The following table summarizes each component of Accumulated Other Comprehensive Income (loss):
|
June 29 2014 |
December 29 2013 |
|||||||
|
Fair value of interest rate swaps (net of tax of $128,462 and $111,218) |
$ | (249,368 |
) |
$ | (216,188 |
) | ||
|
Fair value of investments (net of tax of $5,829 and $15,030) |
(11,317 |
) |
(29,176 |
) | ||||
|
Total Accumulated other comprehensive loss ending balance |
$ | (260,685 |
) |
$ | (245,364 |
) | ||
16. SUBSEQUENT EVENTS
On June 30, 2014, the Company completed the acquisition of substantially all of the assets of Screamin’ Hot Florida, LLC and Screamin’ Hot Trinity, LLC, each a Florida limited liability company. The assets consist of three BWW restaurants in Clearwater, Port Richey and Oldsmar, Florida (the “Restaurants”). The purchase price was $3.2 million in cash, subject to working capital adjustment, and one-half of the transfer fees imposed by BWLD under its franchise agreements for these Restaurants.
Item 2. Management's Discussion and Analysis of Financial Condition and Results of Operations
(The following discussion and analysis of our financial condition and results of operations should be read in conjunction with our consolidated interim financial statements and related notes included in Item 1 of Part 1 of this Quarterly Report and the audited consolidated financial statements and related notes and Management’s Discussion and Analysis of Financial Condition and Results from Operations contained in our Form 10-K, for the fiscal year ended December 29, 2013.)
INFORMATION REGARDING FORWARD-LOOKING STATEMENTS
Statements contained in this “Quarterly Report on Form 10-Q” may contain information that includes or is based upon certain “forward-looking statements” relating to our business. These forward-looking statements represent management’s current judgment and assumptions, and can be identified by the fact that they do not relate strictly to historical or current facts. Forward-looking statements are frequently accompanied by the use of such words as “anticipates,” “plans,” “believes,” “expects,” “projects,” “intends,” and similar expressions. Such forward-looking statements involve known and unknown risks, uncertainties, and other factors, including, while it is not possible to predict or identify all such risks, uncertainties, and other factors, those relating to our ability to secure the additional financing adequate to execute our business plan; our ability to locate and start up new restaurants; acceptance of our restaurant concepts in new market places; and the cost of food and other raw materials. Any one of these or other risks, uncertainties, other factors, or any inaccurate assumptions may cause actual results to be materially different from those described herein or elsewhere by us. We caution readers not to place undue reliance on any such forward-looking statements, which speak only as of the date they were made. Certain of these risks, uncertainties, and other factors may be described in greater detail in our filings from time to time with the Securities and Exchange Commission, which we strongly urge you to read and consider. Subsequent written and oral forward-looking statements attributable to us or to persons acting on our behalf are expressly qualified in their entirety by the cautionary statements set forth above and elsewhere in our reports filed with the Securities and Exchange Commission. We expressly disclaim any intent or obligation to update any forward-looking statements.
OVERVIEW
Diversified Restaurant Holdings, Inc. (“DRH”) is a fast-growing restaurant company operating two complementary concepts: Bagger Dave’s Burger Tavern ® (“Bagger Dave’s”) and Buffalo Wild Wings ® Grill & Bar (“BWW”). As the creator, developer, and operator of Bagger Dave’s and as one of the largest franchisees of BWW, we provide a unique guest experience in a casual and inviting environment. We were incorporated in 2006 and are headquartered in the Detroit metropolitan area. As of June 29, 2014, we had 56 locations in Florida, Illinois, Indiana, and Michigan.
DRH and its wholly-owned subsidiaries (collectively, the “Company”), AMC Group, Inc. (“AMC”), AMC Wings, Inc. (“WINGS”), AMC Burgers, Inc. (“BURGERS”), and AMC Real Estate, Inc. (“REAL ESTATE”) own, operate, and manage Bagger Dave's and DRH-owned BWW restaurants located throughout Florida, Illinois, Indiana, and Michigan.
DRH originated the Bagger Dave’s concept with our first restaurant opening in January 2008 in Berkley, Michigan. Currently, there are 20 Bagger Dave’s, 14 in Michigan and six in Indiana. The Company expects to operate between 55 and 65 Bagger Dave’s locations by the end of 2017.
DRH is also one of the largest BWW franchisees and currently operates 40 DRH-owned BWW restaurants (18 in Michigan, 14 in Florida, four in Illinois, and four in Indiana), including the nation’s largest BWW, based on square footage, in downtown Detroit, Michigan. We remain on track to fulfill our area development agreement (“ADA”) with Buffalo Wild Wings International, Inc. (“BWLD”) and expect to operate 49 DRH-owned BWW restaurants by the end of 2017, exclusive of potential additional BWW restaurant acquisitions.
RESTAURANT OPENINGS
The following table outlines the restaurant unit information for each fiscal year from 2010 through 2014. From our inception in 2006, we managed, but did not own, nine BWW restaurants, which we acquired in February 2010.
|
2014 (estimate) |
2013 |
2012 |
2011 |
2010 |
||||||||||||||||
|
Summary of restaurants open at the beginning of year |
||||||||||||||||||||
|
DRH-owned BWW |
36 | 33 | 22 | 19 | 7 | |||||||||||||||
|
Bagger Dave’s |
18 | 11 | 6 | 3 | 2 | |||||||||||||||
|
BWW Acquisitions / affiliate restaurants under common control |
- | - | - | - | 9 | |||||||||||||||
|
Total |
54 | 44 | 28 | 22 | 18 | |||||||||||||||
|
Openings: |
||||||||||||||||||||
|
DRH-owned BWW |
3 | 3 | 3 | 3 | 3 | |||||||||||||||
|
Bagger Dave’s |
8 | 7 | 5 | 3 | 1 | |||||||||||||||
|
BWW Acquisitions |
3 | - | 8 | - | - | |||||||||||||||
|
Closures |
- | - | - | - | - | |||||||||||||||
|
Total restaurants |
68 | 54 | 44 | 28 | 22 | |||||||||||||||
RESULTS OF OPERATIONS
For the three-month period ended June 29, 2014 ("Second Quarter 2014") and six-month period ended June 29, 2014 (“Year to Date 2014”), revenue was generated from the operations of 36 BWW restaurants and 18 Bagger Dave’s restaurants. For the three-month period ended June 30, 2013 ("Second Quarter 2013") and the six-month period ended June 30, 2013 (“Year to Date 2013”), revenue was generated from the operations of 35 BWW restaurants and 12 Bagger Dave’s restaurants. Quarterly and annual operating results may fluctuate significantly as a result of a variety of factors, including the timing and number of new restaurant openings and related expenses, increases or decreases in same store sales, changes in commodity prices, general economic conditions, and seasonal fluctuations. As a result, our quarterly results of operations are not necessarily indicative of the results that may be achieved for any future period.
Results of Operations for the Three Months Ended June 29, 2014 and June 30, 2013
|
Three Months Ended |
||||||||
|
June 29 2014 |
June 30 2013 |
|||||||
|
Total revenue |
100.0 |
% |
100.0 |
% | ||||
|
Operating expenses |
||||||||
|
Restaurant operating costs: |
||||||||
|
Food, beverage, and packaging costs |
28.7 |
% |
29.7 |
% | ||||
|
Compensation costs |
25.9 |
% |
25.5 |
% | ||||
|
Occupancy costs |
5.1 |
% |
5.8 |
% | ||||
| Other operating costs | 20.4 | % | 19.9 | % | ||||
|
General and administrative expenses |
7.0 |
% |
7.3 |
% | ||||
|
Pre-opening costs |
3.0 |
% |
3.0 |
% | ||||
|
Depreciation and amortization |
8.3 |
% |
6.7 |
% | ||||
|
Loss on disposal of property and equipment |
0.5 |
% |
0.1 |
% | ||||
|
Total operating expenses |
98.9 |
% |
98.0 |
% | ||||
|
Operating profit |
1.1 |
% |
2.0 |
% | ||||
Revenue for Second Quarter 2014 was $30.0 million, an increase of $3.0 million, or 11.3%, over the $27.0 million of revenue generated during Second Quarter 2013. The increase was primarily attributable to two factors. First, approximately $2.7 million of the increase was attributable to revenues generated from the opening of nine new DRH-owned restaurants (eight Bagger Dave’s restaurants and one BWW restaurant). Second, the remaining $0.3 million increase was related to a 1.2% increase in same store sales for 30 BWW and 10 Bagger Dave’s restaurants.
Our same-store-sales performance was heavily impacted by low traffic in April, which was primarily driven by the restaurants being closed for Easter Sunday. In 2014, the Easter holiday fell in the second quarter whereas in 2013, the Easter holiday fell in the first quarter. May 2014 and June 2014 both yielded positive traffic resulting in an upward trend throughout the quarter despite the Detroit Red Wings and Chicago Blackhawks, key local sports teams in our markets, failing to advance as far in the Stanley Cup playoffs in 2014 as they did in 2013.
Food, beverage, and packaging costs increased by $0.6 million, or 7.8%, to $8.6 million in Second Quarter 2014 from $8.0 million in Second Quarter 2013. The increase was primarily due to an increased number of restaurants operating in 2014. Food, beverage, and packaging costs as a percentage of revenue decreased to 28.7% in Second Quarter 2014 from 29.7% in Second Quarter 2013 primarily due to lower chicken wing prices. Average cost per pound for bone-in chicken wings was $1.40 in Second Quarter 2014 compared to $1.61 in Second Quarter 2013.
Compensation costs increased by $0.9 million, or 12.9%, to $7.8 million in Second Quarter 2014 from $6.9 million in Second Quarter 2013. The increase was primarily due to an increased number of restaurants operating in 2014. Compensation costs as a percentage of sales increased to 25.9% in Second Quarter 2014 from 25.5% in Second Quarter 2013.
Occupancy costs decreased by $48,000, or 3.0%, to $1.5 million in Second Quarter 2014 from $1.6 million in Second Quarter 2013. This decrease is due to a true-up of tenant improvement allowance for one of the relocated restaurants. Occupancy as a percentage of sales decreased to 5.1% in Second Quarter 2014 from 5.8% in Second Quarter 2013.
Other operating costs increased by $0.7 million, or 14.4%, to $6.1 million in Second Quarter 2014 from $5.4 million in Second Quarter 2013. This increase was primarily due to more restaurants being operated in 2014. Other operating costs as a percentage of sales increased to 20.4% in Second Quarter 2014 from 19.9% in Second Quarter 2013.
General and administrative expenses increased by $0.1 million, or 6.3%, to $2.1 million in Second Quarter 2014 from $2.0 million in Second Quarter 2013. This increase was primarily due to the increase of corporate activities associated with the substantial growth in operations. General and administrative expenses as a percentage of sales decreased to 7.0% in Second Quarter 2014 from 7.3% in Second Quarter 2013.
Pre-opening costs increased by $0.1 million, or 13.2%, to $0.9 million in Second Quarter 2014 from $0.8 million in Second Quarter 2013. The increase was due to the timing and overall cost to build and open new restaurants. The Company opened two new restaurants and relocated two restaurants in Second Quarter 2014 compared to three openings in Second Quarter 2013. Pre-opening costs as a percentage of sales was 3.0% in Second Quarter 2014 and Second Quarter 2013.
Depreciation and amortization increased by $0.7 million, or 37.8%, to $2.5 million in Second Quarter 2014 from $1.8 in Second Quarter 2013. This increase was primarily due to an increased number of restaurants operating in 2014. Depreciation and amortization as a percentage of sales increased to 8.3% in Second Quarter 2014 from 6.7% in Second Quarter 2013 primarily due to the increased investment in real estate purchases.
Loss on disposal of property and equipment increased by $0.13 million, or 539.9%, to $0.16 million in Second Quarter 2013 from $0.03 million in Second Quarter 2013. This increase was primarily due to non-recurring property and equipment disposals driven by the relocation of two restaurants. Loss on disposal of property and equipment as a percentage of sales increased to 0.5% in Second Quarter 2014 from 0.1% in Second Quarter 2013.
Results of Operations for the Six Months Ended June 29, 2014 and June 30, 2013
|
Six Months Ended |
||||||||
|
June 29 2014 |
June 30 2013 |
|||||||
|
Total revenue |
100.0 |
% |
100.0 |
% | ||||
|
Operating expenses |
||||||||
|
Restaurant operating costs: |
||||||||
|
Food, beverage, and packaging costs |
28.6 |
% |
30.7 |
% | ||||
|
Compensation costs |
26.1 |
% |
25.8 |
% | ||||
|
Occupancy |
5.3 |
% |
5.7 |
% | ||||
| Other operating costs | 20.5 | % | 19.7 | % | ||||
|
General and administrative expenses |
7.0 |
% |
6.5 |
% | ||||
|
Pre-opening costs |
2.4 |
% |
2.6 |
% | ||||
|
Depreciation and amortization |
7.8 |
% |
6.4 |
% | ||||
|
Loss on disposal of property and equipment |
0.5 |
% |
0.1 |
% | ||||
|
Total operating expenses |
98.2 |
% |
97.5 |
% | ||||
|
Operating profit |
1.8 |
% |
2.5 |
% | ||||
Revenue for Year to Date 2014 was $60.5 million, an increase of $6.4 million or 11.9% over the $54.0 million of revenue generated during Year to Date 2013. The increase was primarily attributable to two factors. First, approximately $5.9 million of the increase was attributable to revenues generated from the opening of nine DRH-owned restaurants (eight Bagger Dave’s restaurants and one BWW restaurant). Second, the remaining $0.5 million increase was related to a 1.2% increase in same store sales for 30 BWW and 10 Bagger Dave’s restaurants.
Food, beverage, and packaging costs increased by $0.7 million or 4.5% to $17.3 million in Year to Date 2014 from $16.6 million in Year to Date 2013. The increase was primarily due to the increased number of restaurants operating in 2014. Food, beverage, and packaging costs as a percentage of sales decreased to 28.6% in Year to Date 2014 from 30.7% in Year to Date 2013 due to lower chicken wing prices. Average cost per pound for bone-in chicken wings was $1.36 in Year to Date 2014 compared to $1.88 in Year to Date 2013.
Compensation costs increased by $1.8 million or 13.2% to $15.8 million in Year to Date 2014 from $13.9 million in Year to Date 2013. This increase was primarily due to the increased number of restaurants operating in 2014. Compensation as a percentage of sales increased to 26.1% in Year to Date 2014 from 25.8% in Year to Date 2013.
Occupancy costs increased by $0.1 million or 2.4% to $3.2 million in Year to Date 2014 from $3.1 million in Year to Date 2013. This increase was primarily due to the increased number of restaurants operating in 2014. Occupancy cost as a percentage of sales decreased to 5.3% in Year to Date 2014 from 5.7% in Year to Date 2014 and in Year to Date 2013.
Other operating costs increased by $1.7 million or 16.4% to $12.4 million in Year to Date 2014 from $10.7 million in Year to Date 2013. This increase was primarily the increased number of restaurants operating in 2014. Other operating costs as a percentage of sales increased to 20.5% in Year to Date 2014 from 19.7% in Year to Date 2013.
General and administrative cost increased by $0.7 million or 20.4% to $4.2 million in Year to Date 2014 from $3.5 million in Year to Date 2013. This increase was primarily due to the increase of corporate activities associated with the substantial growth in operations. General and administrative cost as a percentage of sales increased to 7.0% in Year to Date 2014 from 6.5% in Year to Date 2013.
Pre-opening cost increased by $0.1 million or 4.1% to $1.5 million in Year to Date 2014 from $1.4 million in Year to Date 2013. The increase in pre-opening costs was due to the timing and overall cost to build and open new restaurants during the period. The Company opened two new restaurants and relocated two restaurants in Year to Date 2014 compared to three openings in Year to Date 2013. Pre-opening cost as a percentage of sales decreased to 2.4% in Year to Date 2014 from 2.6% in Year to Date 2013.
Depreciation and amortization cost increased by $1.3 million or 36.8% to $4.8 million in Year to Date 2014 from $3.5 million in Year to Date 2013. This increase was primarily due to the increased number of restaurants operating in 2014. Depreciation and amortization cost as a percentage of sales increased to 7.8% in Year to Date 2014 from 6.4% in Year to Date 2013 primarily due to the increased investment in real estate purchases.
Loss on disposal of property and equipment increased by $0.2 million or 427.4% to $0.3 million in Year to Date 2014 from $0.1 million in Year to Date 2013. This increase was primarily due to non-recurring property and equipment disposals in the current year driven by the relocation of two restaurants. Loss on disposal of property and equipment as a percentage of sales increased to 0.5% in Year to Date 2014 from 0.1% in Year to Date 2013.
INTEREST AND TAXES
Interest expense was $476,634 and $585,637 during Second Quarter 2014 and Second Quarter 2013, respectively. Interest expense was $953,035 and $1.1 million during Year to Date 2014 and Year to Date 2013, respectively. The decrease is associated with the $63.0 million senior secured credit facility with RBS Citizens, N.A. (“RBS”) (the “April 2013 Senior Secured Credit Facility”), which was effective on April 15, 2013 and includes a write-off of loan fees for $76,408.
For Second Quarter 2014, DRH had an income tax benefit of $78,872 compared to Second Quarter 2013 income tax benefit of $35,190. The Second Quarter 2014 income tax benefit primarily relates to the increase in tip credits for the period. For Year to Date 2014, we booked an income tax benefit of $131,930 compared to Year to Date 2013 of an income tax provision of $66,630.
LIQUIDITY AND CAPITAL RESOURCES; EXPANSION PLANS
On April 15, 2013, the Company entered into a $63.0 million senior secured credit facility with RBS (the “April 2013 Senior Secured Credit Facility”). The April 2013 Senior Secured Credit Facility consists of a $46.0 million term loan (the “April 2013 Term Loan”), a $15.0 million development line of credit (the “April 2013 DLOC”), and a $2.0 million revolving line of credit (the “April 2013 RLOC”). The April 2013 Term Loan is for a period of five years. Payments of principal are based upon an 84-month straight-line amortization schedule, with monthly principal payments of $547,619 plus accrued interest through maturity on April 15, 2018, at which time the entire unpaid principal and interest is due. The April 2013 DLOC converted to a term loan on March 11, 2014, with monthly principal payments of $178,571 plus accrued interest beginning May 2014 through maturity on April 15, 2018, at which time the entire unpaid principal and interest is due. The April 2013 RLOC is for a term of two years. As of June 29, 2014 no amounts were outstanding under the April 2013 RLOC. Amounts borrowed under the April 2013 Senior Secured Credit Facility bear interest at a rate of one-month LIBOR plus an applicable margin. On March 20, 2014, the Company amended the April 2013 Senior Secured Credit Facility to include a $20.0 million development line of credit II (the “March 2014 DLOC II”). The March 2014 DLOC II is for a term of two years and is convertible upon maturity into a term note. The amendment also provided a 25 basis point reduction to the April 2013 Senior Secured Credit Facility’s applicable margin rate, which reduced the range from 2.5%/3.4% to 2.25%/3.15%, which commences April 2014.
On April 23, 2013, the Company completed an underwritten, follow-on equity offering of 6.9 million shares of common stock at a price of $5.00 per share to the public. After deducting underwriting discounts, commissions, and other offering expenses the net proceeds to DRH were $31.9 million. At June 29, 2014, the Company held available-for-sale securities with an estimated fair value of $8.0 million. The investments were funded by a portion of the proceeds from the follow-on offering. See Note 3 for additional information.
We believe the cash flow from operations, the remaining proceeds from the registered offering, proceeds from a proposed sale-lease-back of existing properties and availability of credit will be sufficient to meet our operational funding, development, and obligations for at least the next 12 months.
Our capital requirements are primarily dependent upon the pace of our new restaurant growth plan. The new restaurant growth plan is primarily dependent upon economic conditions, the real estate market, and resources to both develop and operate new restaurants. In addition to new restaurants, our capital expenditure outlays are also dependent on costs for maintenance, facility upgrades, capacity enhancements, information technology, and other general corporate capital expenditures.
The amount of capital required to open a new restaurant is largely dependent on whether we build-out an existing leased space or build from the ground up. Our preference is to find leased space for new restaurant locations but depending on the availability of real estate in specific markets, we will take advantage of alternative strategies which may include land purchases, land leases, and ground up construction of a building to house our restaurant operation. Excluding land and building, we expect the build-out of a new Bagger Dave’s restaurant will, on average, require a total cash investment of $1.0 million to $1.3 million (excluding potential tenant incentives). Similarly, we expect the build-out of a new DRH-owned BWW restaurant will require an estimated cash investment of $1.8 million to $2.0 million (excluding potential tenant incentives). We expect to spend approximately $200,000 to $250,000 per restaurant for pre-opening expenses. Depending on individual lease negotiations, we may receive cash tenant incentives of up to $400,000. The projected cash investment per restaurant is based on recent opening costs and future projections and may fluctuate based on construction costs specific to new restaurant locations.
We target a cash on cash return on our initial total capital investment, excluding real estate investment (which includes land and building), of less than four years. Our current expected return on investment ranges between two and a half to four years for our Bagger Dave’s and DRH-owned BWW restaurants, respectively. The expected payback is subject to how quickly we reach our target sales volume and the cost of construction. Real estate purchases and building costs are excluded from our expected return since the majority of our restaurants are leased and purchased real estate is not a part of our core operations. We separate the analysis and decisions on real estate projects from new restaurant development, although we have no plans for independent real estate projects without an associated new restaurant opening.
Cash flow from operations for Year to Date 2014 was $6.8 million compared with $2.1 million for Year to Date 2013. Net cash provided by operating activities consisted primarily of net earnings adjusted for non-cash expenses.
Opening new restaurants, including real estate investments, is our primary use of capital and is estimated to be over 80.0% of our capital expenditures in 2014. For 2014, we estimate capital expenditures to be between $33.0 million and $36.0 million. Of this amount, $3.2 million was used for the aquisition of three new BWW restaurants in the north Tampa area. The aquisition was funded with a combination of bank funded DLOC and cash on hand. We plan to use the remaining capital as follows: one half for new restaurant openings, currently six Bagger Dave's and two DRH-owned BWW are under construction; one third for real estate (including the purchase of land and construction of buildings) associated with new restaurant openings; and the remaining for restaurant remodels, upgrades, relocations and other general corporate purposes.
Although investments in new restaurants are an integral part of our strategic and capital expenditures plan, we also believe that reinvesting in existing restaurants is an important factor and necessary to maintain the overall positive dining experience for our guests. Depending on the age of the existing restaurants, upgrades range from $50,000 (for minor interior refreshes) to $700,000 (for a full remodel of the restaurant). Restaurants are typically upgraded after approximately five to seven years of operation and fully remodeled after approximately 10 years of operation.
Contractual Obligations
The following table presents a summary of our contractual obligations as of June 29, 2014:
|
Less than |
||||||||||||||||||||
|
Total |
one year |
1 - 3 years |
3 - 5 years |
After 5 years |
||||||||||||||||
|
Long-term debt1 |
$ | 53,046,649 | $ | 10,337,974 | $ | 22,247,827 | $ | 18,931,217 | $ | 1,529,631 | ||||||||||
|
Operating lease obligations |
44,378,718 | 5,487,303 | 10,431,243 | 13,777,740 | 14,682,432 | |||||||||||||||
|
Commitments for restaurants under development 2 |
24,004,465 | 18,147,439 | 1,305,895 | 1,313,966 | 3,237,165 | |||||||||||||||
| $ | 121,429,832 | $ | 33,972,716 | $ | 33,984,965 | $ | 34,022,923 | $ | 19,449,228 | |||||||||||
|
1 |
Amount represents the expected principal cash payments relating to our long-term debt and do not include any fair value adjustments or discounts/premiums or interest rate payments due to the variable of the rates. See Note 7 for additional details. |
|
|
|
|
2 |
Amount represents capital expenditures DRH is obligated to pay for restaurants under development in addition to noncancelable operating leases for these restaurants. |
Mandatory Upgrades
During fiscal year 2014, we plan to complete two mandatory remodels of existing DRH-owned BWW restaurant, which will be funded with cash from operations.
Discretionary Upgrades and Relocations
In fiscal year 2014, the Company will invest additional capital to provide minor upgrades to a number of its existing locations, all of which will be funded by cash from operations. These improvements will primarily consist of new carpentry, audio/visual equipment upgrades, patio upgrades, and point-of-sale system upgrades. In fiscal year 2014, we relocated two DRH-owned BWW locations in lieu of remodels. The decision to relocate is typically driven by timing of our current lease agreements and the availability of real estate that we deem to be a better long-term investment. Relocations are funded by a combination of cash from operations and borrowing from our credit facility.
Inflation
Our profitability is dependent, among other things, on our ability to anticipate and react to changes in the costs of key operating resources, including food and other raw materials, labor, energy, and other supplies and services. Substantial increases in costs and expenses could impact our results of operations to the extent that such increases cannot be passed along to our restaurant guests. The impact of inflation on food, labor, energy, and occupancy costs can significantly affect the profitability of our restaurant operations.
While we have been able to partially offset inflation and other changes in the costs of key operating resources by gradually increasing prices for our menu items, more efficient purchasing practices, productivity improvements, and greater economies of scale, there can be no assurance that we will be able to continue to do so in the future. From time to time, competitive conditions could limit our menu pricing flexibility. There can be no assurance that all future cost increases can be offset by increased menu prices or that increased menu prices will be fully absorbed by our restaurant guests without any resulting changes in their visit frequencies or purchasing patterns. A majority of the leases for our restaurants provide for contingent rent obligations based on a percentage of revenue. As a result, rent expense will absorb a proportionate share of any menu price increases in our restaurants. However, there can be no assurance that we will continue to generate increases in comparable restaurant sales in amounts sufficient to offset inflationary or other cost pressures.
OFF-BALANCE SHEET ARRANGEMENTS
The Company assumed, from a related entity, an ADA in which the Company was to open 23 BWW restaurants within its designated "development territory”. On December 12, 2008, this agreement was amended, adding nine additional restaurants and extending the date of fulfillment to March 1, 2017. Failure to develop restaurants in accordance with the schedule detailed in the agreement could lead to potential penalties of up to $50,000 for each undeveloped restaurant, payment of the initial franchise fees for each undeveloped restaurant, and loss of rights to development territory. Failure to develop restaurants in accordance with the schedule detailed in the agreement could lead to potential penalties of $50,000 for each undeveloped restaurant and loss of rights to the development territory. As of June 29, 2014, 21 of the required 32 ADA restaurants had been opened for business. We remain on track to fulfill our obligation under the amended ADA, and we expect to operate a total of 49 BWW by the end of 2017, exclusive of potential acquisitions of additional BWW restaurants.
CRITICAL ACCOUNTING ESTIMATES
We prepare our consolidated financial statements in conformity with accounting principles generally accepted in the United States of America. The preparation of these financial statements requires us to make estimates and assumptions that affect the reported amounts of assets and liabilities and disclosure of contingent assets and liabilities at the date of the financial statements and the reported amounts of income and expenses during the reporting period. Actual results could differ from those estimates. Our critical accounting policies have not changed materially from those previously reported in our Annual Report on Form 10-K for the fiscal year ended December 29, 2013.
Item 3. Quantitative and Qualitative Disclosure About Market Risks
Debt Securities
We are exposed to market risk related to our debt securities. To manage our exposure, we have invested our excess cash in highly liquid short-term investments with maturities of less than one year. The investments are not held for trading or other speculative purposes. See Notes 1, 3, and 14 of our unaudited consolidated financial statements part I Item 1 of this report for additional information.
Interest Rate Risk
As a result of our normal borrowing activities, our operating results are exposed to fluctuations in interest rates. DRH has short-term and long-term debt with both fixed and variable interest rates. The short-term debt comprises the current portion of long-term debt maturing within twelve months from the balance sheet date. Long-term debt includes secured notes payable, two lines of credit and a revolving line of credit which is used to finance working capital requirements. To manage our exposure, we have entered into interest rate swap agreements. The derivative instruments are not held for trading or other speculative purposes.
As of June 29, 2014, DRH had $53.0 million of variable-rate debt with a weighted average interest rate of 2.7%, respectively, which approximates fair value. Interest based on the debt agreement is based on one-month LIBOR plus an applicable margin, which ranges from 2.25% to 3.15%, depending on the lease adjusted leverage ratio defined in the terms of the agreement. DRH currently estimates that a 100 basis point fluctuation in LIBOR would result in an approximate $0.5 million fluctuation in pretax income. See Notes 1, 7 and 14 of our unaudited consolidated financial statements part I Item 1 of this report for additional information.
Inflation
The primary inflationary factors affecting our operations are food, labor, and restaurant operating costs. Substantial increases in these costs could impact operating results to the extent that such increases cannot be passed along through higher menu prices. A large number of our restaurant personnel are paid at rates based on the applicable federal and state minimum wages, and increases in the minimum wage rates and tip-credit wage rates could directly affect our labor costs. Many of our leases require us to pay taxes, maintenance, repairs, insurance, and utilities, all of which are generally subject to inflationary increases.
Commodity Price Risk
Many of the food products purchased by us are affected by weather, production, availability, and other factors outside our control. We believe almost all of our food and supplies are available from several sources, which helps to control food product risks. Our purchasing department for Bagger Dave’s negotiates directly with our independent suppliers for our supply of food and paper products. As negotiated by BWLD, our DRH-owned BWW restaurants have a distribution contract with a BWLD selected vendor for our supply of food, paper, and non-food products. We have minimum purchase requirements with some of our vendors, but the terms of the contracts and our historical use of the products are such that we believe these minimum purchase requirements do not create a material market risk. One of the primary food products used by our BWW restaurants is chicken wings. We work to counteract the effect of the volatility of chicken wing prices, which can significantly change our cost of sales and cash flow, with the introduction of new menu items, effective marketing promotions, focused efforts on food costs and waste, and menu price increases. We also explore purchasing strategies to reduce the severity of cost increases and fluctuations. Chicken wings accounted for approximately 28.4% and 35.1% of our cost of sales for Year to Date 2014 and Year to Date 2013, respectively, with an average price per pound of $1.36 and $1.88, respectively.
Item 4. Controls and Procedures
(a) Evaluation of disclosure controls and procedures.
We are required to maintain disclosure controls and procedures designed to ensure that material information related to us, including our consolidated subsidiaries, is recorded, processed, summarized, and reported within the time periods specified in the SEC rules and forms. Management does not expect that our disclosure controls and procedures or our internal control over financial reporting will prevent or detect all error and fraud. Any control system, no matter how well designed and operated, is based upon certain assumptions and can provide only reasonable, not absolute, assurance that its objectives will be met. Further, no evaluation of controls can provide absolute assurance that misstatements due to error or fraud will not occur or that all control issues and instances of fraud, if any, within the Company have been detected.
Conclusion regarding the effectiveness of disclosure controls and procedures
As of June 29, 2014, an evaluation was performed under the supervision of and with the participation of our management, including our principal executive and principal financial officers, of the effectiveness of the design and operation of our disclosure controls and procedures. Based on that evaluation, our management, including our principal executive and principal financial officers, concluded that our disclosure controls and procedures were effective as of June 29, 2014.
(b) Changes in internal controls over financial reporting.
There were no changes in the Company’s internal control over financial reporting during the quarter ended June 29, 2014 that have materially affected, or are reasonably likely to materially affect the Company’s internal control over financial reporting.
Our process for evaluating controls and procedures is continuous and encompasses constant improvement of the design and effectiveness of established controls and procedures and the remediation of any deficiencies that may be identified during this process.
PART II. OTHER INFORMATION
Item 1. Legal Proceedings
Occasionally, we are a defendant in litigation arising in the ordinary course of our business, including claims arising from personal injuries, contract claims, dram shop claims, employment-related claims, and claims from guests or team members alleging injury, illness, or other food quality, health, or operational concerns. To date, none of these types of litigation, most of which are entirely or predominantly covered by insurance, has had a material effect on our financial condition or results of operations. We have insured and continue to insure against most of these types of claims. A judgment on any claim not covered by or in excess of our insurance coverage could materially adversely affect our financial condition or results of operations. As of the date of this Quarterly Report, we are not a party to any material pending legal proceedings and are not aware of any claims that could have a materially adverse effect on our financial position, results of operations or cash flows.
Item 1A. Risk Factors
There have been no material changes in our risk factors from those previously disclosed in our annual report on Form 10-K for the year ended December 29, 2013.
Item 2. Unregistered Sales of Equity Securities and Use of Proceeds
Not Applicable.
Item 3. Defaults Upon Senior Securities
None.
Item 5. Other Information
None.
Item 6. Exhibits
(a) Exhibits:
|
2.1 |
Asset Purchase Agreement between the Company and Screamin’ Hot Florida, LLC and Screamin’ Hot Trinity, LLC, dated April 1, 2014 (filed as Exhibit 10.2 to the Company's Form 10-Q filed with the Securities and Exchange Commission on May 9, 2014, and incorporated herein by this reference). |
|
2.2 |
First Amendment to Asset Purchase Agreement, dated May 27, 2014 (filed as an exhibit to the Company's Form 8-K, as filed with the Securities and Exchange Commission on July 7, 2014, and incorporated herein by this reference). |
|
3.1 |
Certificate of Incorporation (filed as an exhibit to the Company's Registration Statement on Form S-1, as filed with the Securities and Exchange Commission on August 10, 2007, and incorporated herein by this reference). |
|
3.2 |
Amended and Restated Bylaws (filed as an exhibit to the Company's Form 8-K, as filed with the Securities and Exchange Commission on August 29, 2012, and incorporated herein by this reference). |
|
3.3 |
First Amendment to the Amended and Restated Bylaws (filed as an exhibit to the Company's Form 8-K, as filed with the Securities and Exchange Commission on October 31, 2012, and incorporated herein by this reference). |
|
31.1 |
Certification of Chief Executive Officer pursuant to Rule 13a-14(a). |
|
31.2 |
Certification Chief Financial Officer pursuant to Rule 13a-14(a). |
|
32.1 |
Certification Chief Executive Officer pursuant to 18 U.S.C. Section 1350. |
|
32.2 |
Certification Chief Financial Officer pursuant to 18 U.S.C. Section 1350. |
|
101.INS |
XBRL Instance Document |
|
101.SCH |
XBRL Taxonomy Extension Schema Document |
|
101.CAL |
XBRL Taxonomy Extension Calculation Document |
|
101.DEF |
XBRL Taxonomy Extension Definition Document |
|
101.LAB |
XBRL Taxonomy Extension Label Document |
|
101.PRE |
XBRL Taxonomy Extension Presentation Document |
SIGNATURES
In accordance with Section 13 or 15(d) of the Exchange Act, the registrant caused this report to be signed on its behalf by the undersigned, there unto duly authorized.
|
DIVERSIFIED RESTAURANT HOLDINGS, INC. |
|||
|
Dated: August 8, 2014 |
By: |
/s/ T. Michael Ansley |
|
|
T. Michael Ansley |
|||
|
President and Chief Executive | |||
| Officer (Principal Executive Officer) | |||
|
By: |
/s/ David G. Burke |
||
|
David G. Burke |
|||
|
Chief Financial Officer and Treasurer | |||
| (Principal Financial and Accounting Officer) | |||
EXHIBIT INDEX
|
Exhibit No. |
Exhibit Description |
|
2.1 |
Asset Purchase Agreement between the Company and Screamin’ Hot Florida, LLC and Screamin’ Hot Trinity, LLC, dated April 1, 2014 (filed as Exhibit 10.2 to the Company's Form 10-Q filed with the Securities and Exchange Commission on May 9, 2014, and incorporated herein by this reference). |
|
2.2 |
First Amendment to Asset Purchase Agreement, dated May 27, 2014 (filed as an exhibit to the Company's Form 8-K, as filed with the Securities and Exchange Commission on July 7, 2014, and incorporated herein by this reference). |
|
3.1 |
Certificate of Incorporation (filed as an exhibit to the Company's Registration Statement on Form S-1, as filed with the Securities and Exchange Commission on August 10, 2007, and incorporated herein by this reference). |
|
3.2 |
Amended and Restated Bylaws (filed as an exhibit to the Company's Form 8-K, as filed with the Securities and Exchange Commission on August 29, 2012, and incorporated herein by this reference). |
|
3.3 |
First Amendment to the Amended and Restated Bylaws (filed as an exhibit to the Company's Form 8-K, as filed with the Securities and Exchange Commission on October 31, 2012, and incorporated herein by this reference). |
|
31.1 |
Certification of Chief Executive Officer pursuant to Rule 13a-14(a). |
|
31.2 |
Certification Chief Financial Officer pursuant to Rule 13a-14(a). |
|
32.1 |
Certification Chief Executive Officer pursuant to 18 U.S.C. Section 1350. |
|
32.2 |
Certification Chief Financial Officer pursuant to 18 U.S.C. Section 1350. |
|
101.INS |
XBRL Instance Document |
|
101.SCH |
XBRL Taxonomy Extension Schema Document |
|
101.CAL |
XBRL Taxonomy Extension Calculation Document |
|
101.DEF |
XBRL Taxonomy Extension Definition Document |
|
101.LAB |
XBRL Taxonomy Extension Label Document |
|
101.PRE |
XBRL Taxonomy Extension Presentation Document |
29