Attached files
| file | filename |
|---|---|
| 8-K - FORM 8-K - WALGREEN CO | d771941d8k.htm |
| EX-2.1 - EX-2.1 - WALGREEN CO | d771941dex21.htm |
| EX-99.2 - EX-99.2 - WALGREEN CO | d771941dex992.htm |
| EX-99.3 - EX-99.3 - WALGREEN CO | d771941dex993.htm |
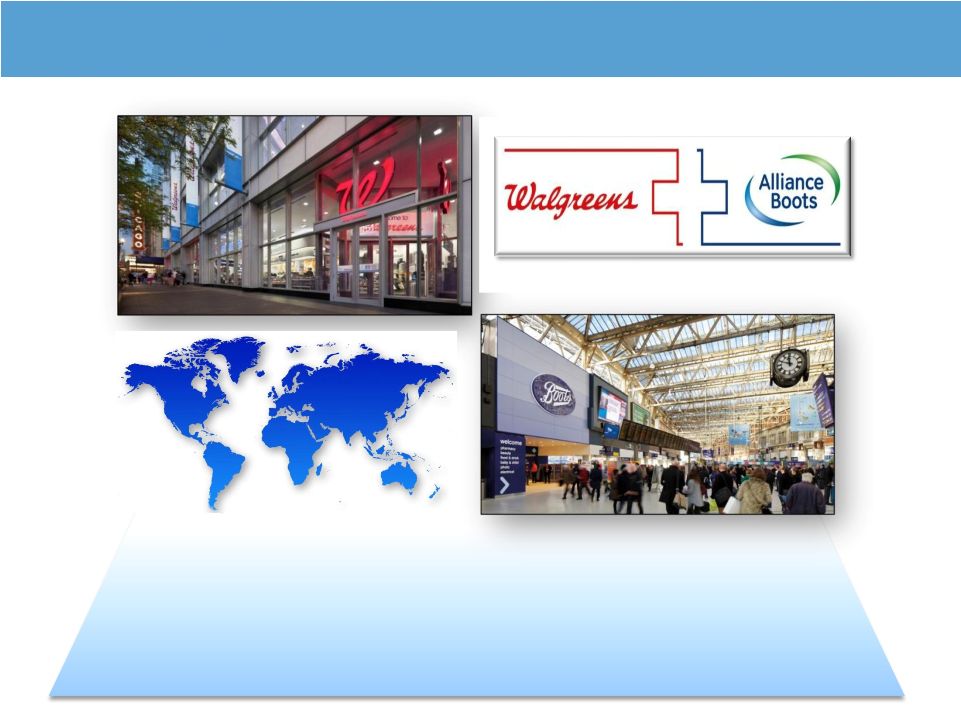
 Walgreens-Alliance Boots
Investor Call
August 6, 2014
Exhibit 99.1 |
 Rick
Hans, CFA Divisional Vice President, Investor Relations & Finance,
Walgreens Questions & Answers
Greg Wasson
President & Chief Executive Officer, Walgreens
Alliance Boots Step 2 Update
Global Management Structure
Corporate Structure
Fiscal Year 2016 Goals
Cost Reduction Program
Capital Structure
Near Term Outlook
Long Term Opportunities
Introduction & Safe Harbor
Greg Wasson
Stefano Pessina
2
Investor Call Agenda
Stefano Pessina
Executive Chairman, Alliance Boots
Introducing:
Tim McLevish
EVP & Chief Financial Officer, Walgreens
Global Outlook and
Opportunities |
 Certain
statements
and
projections
of
future
results
made
in
these
presentations
constitute
forward-looking
statements
that
are
based
on
current
market,
competitive
and
regulatory
expectations
that
involve
risk
and
uncertainty
that
could
cause
results
to
vary
materially.
Except
to
the
extent
required
by
the
law,
we
undertake
no
obligation
to
update
publicly
any
forward-looking
statement
after
these
presentations,
whether
as
a
result
of
new
information,
future
events,
changes
in
assumptions
or
otherwise.
Please see our latest Form 10-K &10-Q filings for a discussion of risk
factors as they relate to forward-looking statements.
Today’s presentation includes certain non-GAAP financial measures,
and we refer you to the Appendix to the presentation materials
available on our investor relations website for reconciliations to the
most directly comparable GAAP financial measures and related
information.
Safe Harbor and Non-GAAP
3 |
 Walgreens-Alliance Boots
Investor Call
Greg Wasson
President & CEO, Walgreens
August 6, 2014 |
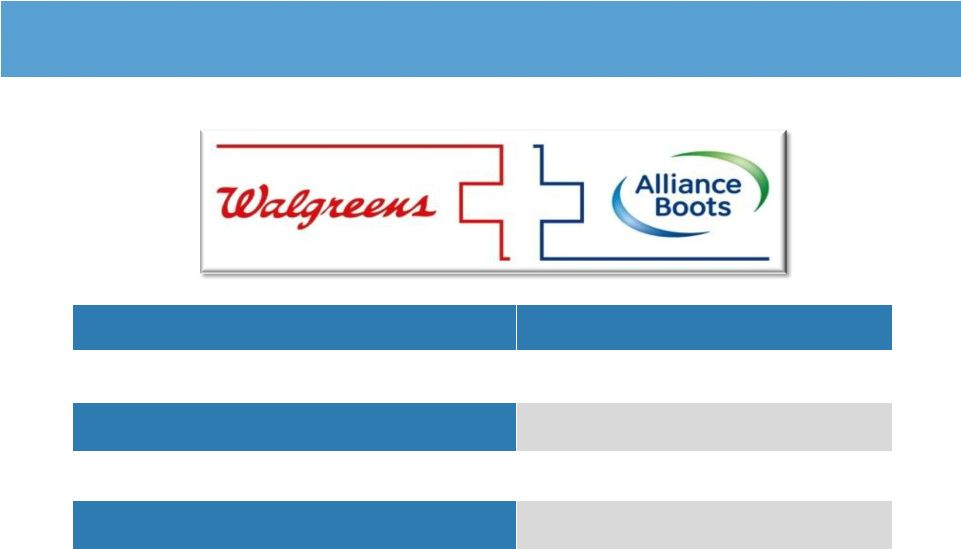
 Walgreens to Combine with Alliance Boots
Walgreens exercises option to acquire remaining 55% of Alliance Boots
Transaction expected to close in 1
quarter of calendar year 2015
5
New holding company name to be Walgreens Boots Alliance, Inc.
st
†
†
Forward-Looking Statements – See Cautionary Note in attached Appendix |
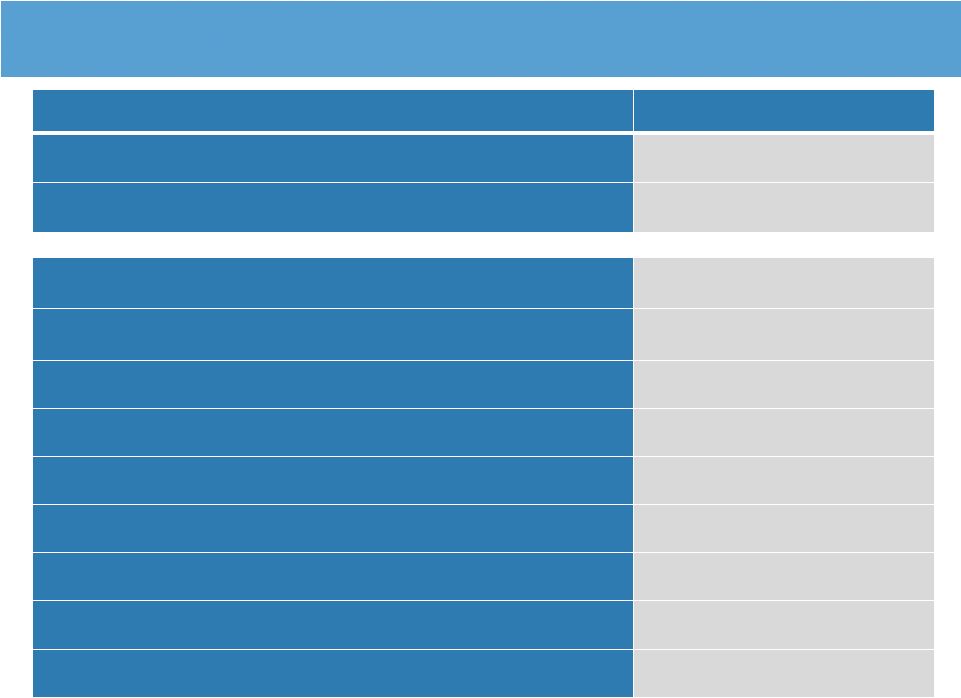
 Procurement
Prescription drugs
Branded goods
Private brands
Indirect spend
Revenue Enhancing
Beauty
Own brands
Wellness solutions
Best & Next Practices
Store formats
Loyalty
E-commerce
Pharmacy
Walgreens Today
Combined Vision
US Pharmacy:
Health & Daily Living
Global Pharmacy:
Health & Wellbeing
Global Wholesale &
Distribution
Compelling Strategic and Financial Rationale
6
COMPLEMENTARY CAPABILITIES & ASSETS
REVENUE & PROFIT POOL DIVERSIFICATION
SUBSTANTIAL SYNERGY POTENTIAL
PLATFORM FOR FUTURE GROWTH |
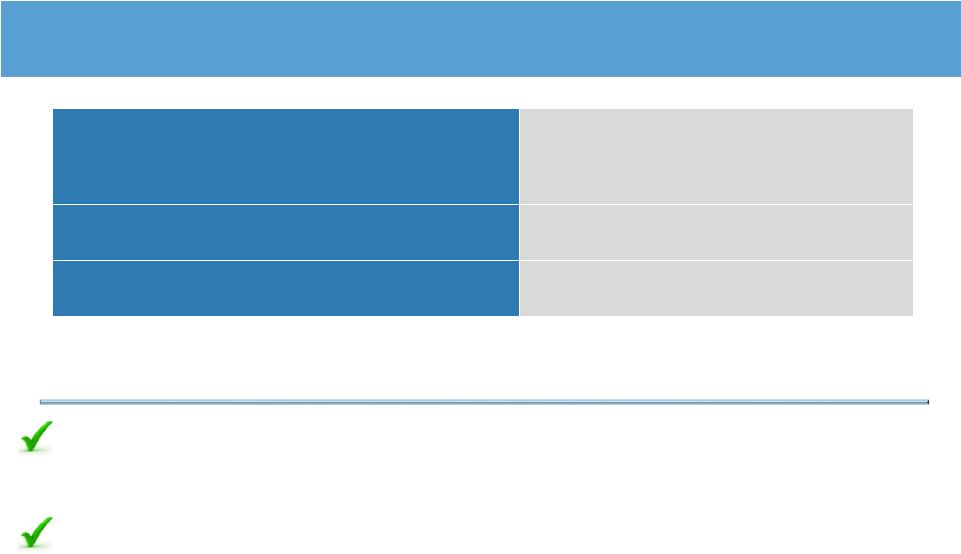
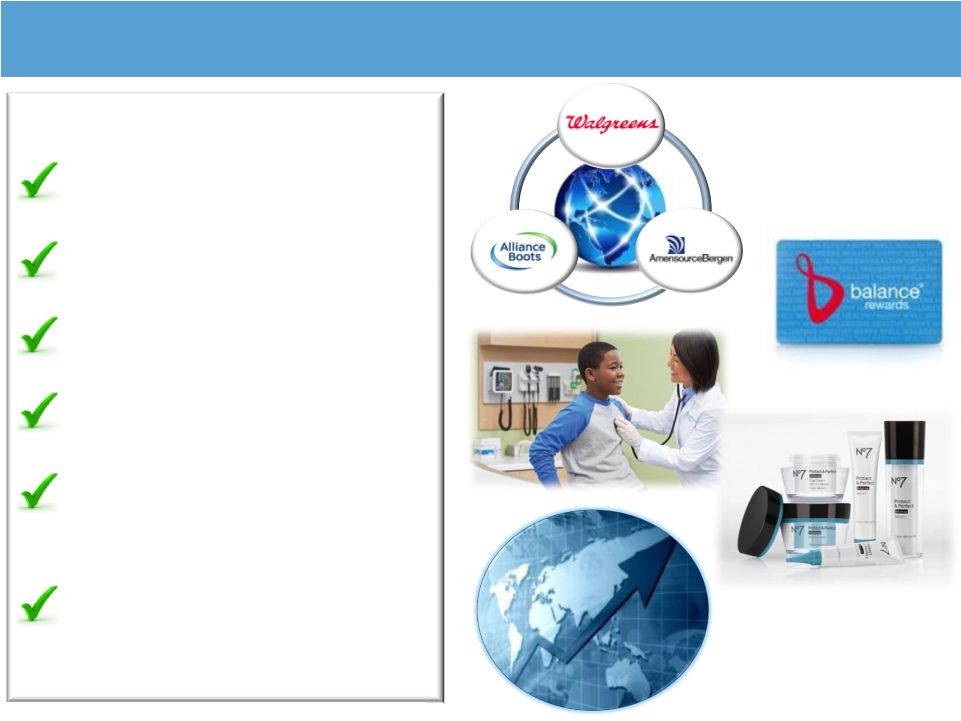
 Employees
350,000
Stores
~11,000*
Distribution Centers
370
Global Pharmacy Distribution Points
~180,000
Global Healthcare Service Providers
~92,000
Active Loyalty Members
~100,000,000
Leader on a Global Scale
Our Combined Assets
*Excludes the pending 1,400 store FASA acquisition by Alliance Boots
7 |
 Step
1 Step 2
†
Total
†
Cash
$4.0 B
$5.3 B*
$9.3 B*
Walgreens Shares Issued
83.4 M
144.3 M
227.7M
TERMS
STEP
TWO
(Option
Exercise)
†
Structure
•
Purchase of remaining 55% equity interest in Alliance Boots
Consideration
•
3.1 B Pounds Sterling ($5.3 B*)
•
Shares fixed at 144.3 M
•
WAG assumes outstanding Alliance Boots net debt
Timing
•
Option exercised on August 5, 2014
•
Expect to close in 1
quarter of calendar year 2015
Conditions
•
Subject to Walgreens shareholder approval
•
Subject to regulatory approvals
Step 2 -
Transaction Terms
Forward-Looking
Statements
–
See
Cautionary
Note
in
attached
Appendix
Based
on
current
$1.69
=
£
1
exchange
rate
8
st
†
* |
 Title
Name
President & CEO, Walgreens Boots Alliance, Inc.
Greg Wasson
Executive Vice Chairman, Strategy & New Market Development
Stefano Pessina
EVP, Walgreens Boots Alliance,
President & Chief Executive, Global Wholesale & International Retail
Ornella Barra
EVP, Walgreens Boots Alliance,
President of Pharma & Global Market Access
Jeff Berkowitz
EVP, Walgreens Boots Alliance, President, Walgreens
Alex Gourlay
EVP and Chief Financial Officer, Walgreens Boots Alliance
Tim McLevish
EVP, Walgreens Boots Alliance, President, Global Brands
Ken Murphy
EVP, Walgreens Boots Alliance, President, Boots
Simon Roberts
EVP, Global Chief Legal & Administrative Officer, Walgreens Boots
Alliance Tom Sabatino
EVP & Global Chief Information Officer, Walgreens Boots Alliance
Tim Theriault
EVP & Global Chief Human Resource Officer, Walgreens Boots Alliance
Kathleen Wilson-Thompson
Blended Management Team
9 |
 Domicile of Combined Enterprise
Rationale of U.S. Domicile
Walgreens Boots Alliance, Inc.
U.S. Domicile
Global Headquarters in Chicago area
Walgreens Operational Headquarters
Deerfield, IL
Boots Operational Headquarters
Nottingham, U.K.
The Company and Board undertook a balanced, rigorous, and extensive
analysis of the inversion question.
The Company and Board looked at the full range of issues, including the
potential opportunities and benefits, as well as the risks associated with
an inversion, and determined that an inversion was not in the long term
best interests of our company and its shareholders.
10 |
 11
Next Chapter Plan
Differentiated
Retail Experience
Global Pharmaceutical
Services
Integrated Pharmacy
and Health Care
3 Focus Areas to Accelerate Core Business Performance |
 FY
2016 Goals †
Revenue*
$126 -
$130 Billion
Adjusted EPS**
$4.25 -
$4.60
†Forward-Looking
Statements – See cautionary note in
attached Appendix. All figures assume constant currency and current
management assumptions regarding future interest rates. Also assumes closing
of Step 2 in the first calendar quarter of 2015. All
financial
goals
assume
no
major
mergers
and
acquisitions
or
strategic
transactions.
*Revenue excludes Alliance Boots share of associates and joint venture sales
**Non-GAAP Financial Measures –
see Appendix.
12
Establishing New Fiscal 2016 Goals |
 Accelerating a broad $1B cost savings plan for Walgreens by
FY 2017
Additional cost savings opportunities beyond 2016 will come
from combined entity post integration
Cost Savings Plan
13
Key Areas of Cost Focus
Store
Field
Distribution
Corporate |
 Invest in Core
Business
Pursue Strategic
Opportunities
Return Cash To
Shareholders
Maintain Strong
Balance Sheet and
Financial Flexibility
Investing across core businesses at suitable returns to drive organic growth
Balanced and disciplined approach to capital allocation
Returning cash to shareholders through dividends and share repurchases
Pursuing strategic opportunities, including mergers and acquisitions, that
are consistent with our strategy, meet return requirements, and are
accretive and drive long-term growth
Commitment to 30%-35% long-term dividend payout ratio
Increased quarterly dividend per share by 7.1% to $0.3375 per share
Pursue share repurchases with excess capacity
Capital Allocation Priorities
Capital Allocation Priorities
Commitment to solid investment grade credit ratings
14
Capital Structure
$3 billion repurchase program effective immediately through end of
Fiscal Year 2016 |
 Metrics
Expectations
†
Operating Income (GAAP)
Adjusted Gross Profit Margin*
Expected to be down Year over
Year similar to 3Q14
Synergies
Adjusted SG&A $ Growth*
Last Year’s 4Q included net gains
from certain litigation matters that
reduced adjusted SG&A $ growth
by 90bps
Net Debt**
~$X Billion
†Forward-Looking
Statements – See cautionary note in
attached Appendix. *
Non-GAAP
Financial
Measures
–
See
Appendix.
15
Near Term Outlook –
4Q14 |
 Longer Term Opportunities
†
Additional Synergies
Aging Population
Owned Brand Expansion
Bigger in Beauty
Growth in Pharmacy,
Health and Wellness
International Expansion
†
Forward-Looking
Statements
–
See
Cautionary
Note
in
attached
Appendix
16 |
 Global Outlook
Stefano Pessina
Executive Chairman, Alliance Boots
August 6, 2014 |
 Global Outlook
Two Iconic Retail Pharmacy Brands
Focused on Creating Shareholder Value
18 |
 Appendix
The following information provides reconciliations of the supplemental non-GAAP
financial measures, as defined under SEC rules, presented in this
presentation to the most directly comparable financial measures calculated
and presented in accordance with generally accepted accounting principles in
the United States (GAAP). The company has provided these non-GAAP financial
measures in the presentation, which are not calculated or presented in
accordance with GAAP, as supplemental information in addition to the
financial measures that are calculated and presented in accordance with
GAAP. These supplemental non-GAAP financial measures are presented
because management has evaluated the company’s financial results both
including and excluding the adjusted items and believes that the
non-GAAP financial measures presented provide additional perspective and
insights when analyzing the core operating performance of the Company’s
business from period to period and trends in the company’s historical
operating results. The company does not provide a non-GAAP
reconciliation for non-GAAP estimates on a forward-looking basis where it
is unable to provide a meaningful or accurate calculation or estimation of
reconciling items and the information is not available without unreasonable
effort. The supplemental non-GAAP financial measures presented should
not be considered superior to, as a substitute for or as an alternative to, and should be
considered in conjunction with, the GAAP financial measures presented in the
presentation. 19 |
 4Q08
1Q09
2Q09
3Q09
4Q09
Net sales (GAAP)
$ 14,597
$ 14,947
$ 16,475
$ 16,210
$ 15,703
Gross profit (GAAP)
$ 4,035
$ 4,151
$ 4,657
$ 4,459
$ 4,346
LIFO provision
24
43
49
32
48
Adjusted gross profit (Non-GAAP)
$ 4,059
$ 4,194
$ 4,706
$ 4,491
$ 4,394
YOY Change
Gross profit $ (GAAP)
$ 311
Gross profit % (GAAP)
Gross profit % 2-year stack (GAAP)
Adjusted gross profit $ (Non-GAAP)
$ 335
Adjusted gross profit % (Non-GAAP)
Adjusted gross profit % 2-year stack
(Non-GAAP)
Gross profit margin (GAAP)
Year over year basis point impact
(GAAP)
Adjusted gross profit margin
(Non-GAAP)
Adjusted year over year basis point
impact (Non-GAAP)
Reconciliation of Adjusted Gross Profit & Margin
20
$ in Millions |
 1Q10
2Q10
3Q10
4Q10
1Q11
2Q11
3Q11
4Q11
Net sales (GAAP)
$ 16,364
$ 16,987
$ 17,199
$ 16,870
$ 17,344
$ 18,502
$ 18,371
$ 17,967
Gross profit (GAAP)
$ 4,538
$ 4,897
$ 4,749
$ 4,792
$ 4,945
$ 5,324
$ 5,154
$ 5,069
LIFO provision
34
27
18
61
42
56
50
60
Adjusted gross profit (Non-GAAP)
$ 4,572
$ 4,924
$ 4,767
$ 4,853
$ 4,987
$ 5,380
$ 5,204
$ 5,129
YOY Change
Gross profit $ (GAAP)
$ 387
$ 240
$ 290
$ 446
$ 407
$ 427
$ 405
$ 277
Gross profit % (GAAP)
9.0%
8.7%
8.5%
5.8%
Gross profit % 2-year stack (GAAP)
Adjusted gross profit $ (Non-GAAP)
$ 378
$ 218
$ 276
$ 459
$ 415
$ 456
$ 437
$ 276
Adjusted gross profit % (Non-GAAP)
9.1%
9.3%
9.2%
5.7%
Adjusted gross profit % 2-year stack
(Non-GAAP)
Gross profit margin (GAAP)
28.4%
28.5%
28.8%
28.1%
28.2%
Year over year basis point impact
(GAAP)
-0.2%
Adjusted gross profit margin
(Non-GAAP)
28.8%
28.8%
29.1%
28.3%
28.5%
Adjusted year over year basis point
impact (Non-GAAP)
-0.3%
Reconciliation of Adjusted Gross Profit & Margin
21
$ in Millions |
 1Q12
2Q12
3Q12
4Q12
1Q13
2Q13
3Q13
4Q13
Net sales (GAAP)
$ 18,157
$ 18,651
$ 17,752
$ 17,073
$ 17,316
$ 18,647
$ 18,313
$ 17,941
Gross profit (GAAP)
$ 5,104
$ 5,389
$ 5,014
$ 4,835
$ 5,099
$ 5,607
$ 5,222
$ 5,191
LIFO provision
45
72
60
132
55
72
120
(8)
Adjusted gross profit (Non-GAAP)
$ 5,149
$ 5,461
$ 5,074
$ 4,967
$ 5,154
$ 5,679
$ 5,342
$ 5,183
YOY Change
Gross profit $ (GAAP)
$ 159
$ 65
$ (140)
$ (234)
$ (5)
$ 218
$ 208
$ 356
Gross profit % (GAAP)
3.2%
1.2%
-2.7%
-4.6%
-0.1%
4.0%
4.1%
7.4%
Gross profit % 2-year stack (GAAP)
12.2%
9.9%
5.8%
1.2%
3.1%
5.2%
1.4%
2.8%
Adjusted gross profit $ (Non-GAAP)
$ 162
$ 81
$ (130)
$ (162)
$ 5
$ 218
$ 268
$ 216
Adjusted gross profit % (Non-
GAAP)
3.2%
1.5%
-2.5%
-3.2%
0.1%
4.0%
5.3%
4.3%
Adjusted gross profit % 2-year stack
(Non-GAAP)
12.3%
10.8%
6.7%
2.5%
3.3%
5.5%
2.8%
1.1%
Gross profit margin (GAAP)
28.1%
28.9%
28.2%
28.3%
29.4%
30.1%
28.5%
28.9%
Year over year basis point impact
(GAAP)
-0.4%
0.1%
0.1%
0.1%
1.30%
1.2%
0.3%
0.6%
Adjusted gross profit margin
(Non-GAAP)
28.4%
29.3%
28.6%
29.1%
29.8%
30.5%
29.2%
28.9%
Adjusted year over year basis point
impact (Non-GAAP)
-0.4%
0.2%
0.3%
0.6%
1.40%
1.2%
0.6%
-0.2%
Reconciliation of Adjusted Gross Profit & Margin
22
$ in Millions |
 1Q14
2Q14
3Q14
Net sales (GAAP)
$ 18,329
$ 19,605
$ 19,401
Gross profit (GAAP)
$ 5,152
$ 5,650
$ 5,440
LIFO provision
58
51
41
Organizational Efficiency Costs
5
-
-
Adjusted gross profit (Non-GAAP)
$ 5,215
$ 5,701
$ 5,481
YOY Change
Gross profit $ (GAAP)
$ 53
$ 43
$ 218
Gross profit % (GAAP)
1.0%
0.8%
4.2%
Gross profit % 2-year stack (GAAP)
0.9%
4.8%
8.3%
Adjusted gross profit $ (Non-GAAP)
$ 61
$ 22
$ 139
Adjusted gross profit % (Non-
GAAP)
1.2%
0.4%
2.6%
Adjusted gross profit % 2-year stack
(Non-GAAP)
1.3%
4.4%
7.9%
Gross profit margin (GAAP)
28.1%
28.8%
28.1%
Year over year basis point impact
(GAAP)
-1.3%
-1.3%
-0.4%
Adjusted gross profit margin
(Non-GAAP)
28.5%
29.1%
28.3%
Adjusted year over year basis point
impact (Non-GAAP)
-1.3%
-1.4%
-0.9%
Reconciliation of Adjusted Gross Profit & Margin
23
$ in Millions |
 4Q08
1Q09
2Q09
3Q09
4Q09
Selling general and administrative
expenses (GAAP)
$ 3,324
$ 3,482
$ 3,627
$ 3,613
$ 3,644
Acquisition-related amortization
26
35
35
38
40
Alliance Boots transaction costs
-
-
-
-
-
Adjusted selling general and
administrative expenses
(Non-GAAP)
$ 3,298
$ 3,447
$ 3,592
$ 3,575
$ 3,604
YOY Change
Selling
general
and
administrative
expenses $ (GAAP)
$ 320
Selling
general
and
administrative
expenses % (GAAP)
9.6%
Selling general and administrative
expenses % 2-year stack (GAAP)
Adjusted selling general and
administrative expenses $
(Non-GAAP)
$ 306
Adjusted selling general and
administrative expenses %
(Non-GAAP)
9.3%
Adjusted selling general and
administrative expenses % 2-year
stack (Non-GAAP)
Reconciliation of Adjusted SG&A
24
$ in Millions |
 1Q10
2Q10
3Q10
4Q10
1Q11
2Q11
3Q11
4Q11
Selling general and administrative
expenses (GAAP)
$ 3,741
$ 3,811
$ 3,920
$ 4,046
$ 4,004
$ 4,117
$ 4,203
$ 4,237
Acquisition-related amortization
39
38
52
53
52
46
54
67
Alliance Boots transaction costs
-
-
-
-
-
-
-
-
Adjusted selling general and
administrative expenses
(Non-GAAP)
$ 3,702
$ 3,773
$ 3,868
$ 3,993
$ 3,952
$ 4,071
$ 4,149
$ 4,170
YOY Change
Selling general and administrative
expenses $ (GAAP)
$ 259
$ 184
$ 307
$ 402
$ 263
$ 306
$ 283
$ 191
Selling general and administrative
expenses % (GAAP)
7.4%
5.1%
8.6%
11.0%
7.0%
8.0%
7.2%
4.8%
Selling general and administrative
expenses % 2-year stack (GAAP)
20.6%
14.4%
13.1%
15.8%
15.8%
Adjusted selling general and
administrative expenses $
(Non-GAAP)
$ 255
$ 181
$ 293
$ 389
$ 250
$ 298
$ 281
$ 177
Adjusted selling general and
administrative expenses %
(Non-GAAP)
7.4%
5.0%
8.2%
10.8%
6.8%
7.9%
7.3%
4.4%
Adjusted selling general and
administrative expenses % 2-year
stack (Non-GAAP)
20.1%
14.2%
12.9%
15.5%
15.2%
Reconciliation of Adjusted SG&A
25
$ in Millions |
 1Q12
2Q12
3Q12
4Q12
1Q13
2Q13
3Q13
4Q13
Selling general and administrative
expenses (GAAP)
$ 4,204
$ 4,284
$ 4,141
$ 4,249
$ 4,398
$ 4,497
$ 4,362
$ 4,286
Acquisition-related amortization
60
61
64
70
74
75
67
73
Acquisition-related costs
-
-
19
50
37
21
27
11
Hurricane Sandy
-
-
-
-
39
-
-
-
DEA Settlement Costs
-
-
-
-
-
-
28
-
Organizational Efficiency costs
-
-
-
-
-
-
-
13
Adjusted selling general and
administrative expenses (Non-GAAP)
$ 4,144
$ 4,223
$ 4,058
$ 4,129
$ 4,248
$ 4,401
$ 4,240
$ 4,189
YOY Change
Selling general and administrative
expenses $ (GAAP)
$ 200
$ 167
$ (62)
$ 12
$ 194
$ 213
$ 221
$ 37
Selling general and administrative
expenses % (GAAP)
5.0%
4.0%
-1.6%
0.2%
4.6%
5.0%
5.3%
0.9%
Selling general and administrative
expenses % 2-year stack (GAAP)
12.0%
12.0%
5.6%
5.0%
9.6%
9.0%
3.7%
1.1%
Adjusted selling general and
administrative expenses $ (Non-GAAP)
$ 192
$ 152
$ (91)
$ (41)
$ 104
$ 178
$ 182
$ 60
Adjusted selling general and
administrative expenses %(Non-GAAP)
4.9%
3.7%
-2.2%
-1.0%
2.5%
4.2%
4.5%
1.5%
Adjusted selling general and
administrative expenses % 2-year stack
(Non-GAAP)
11.7%
11.6%
5.1%
3.4%
7.4%
7.9%
2.3%
0.5%
Reconciliation of Adjusted SG&A
26
$ in Millions |
 1Q14
2Q14
3Q14
Selling general and administrative
expenses (GAAP)
$ 4,379
$ 4,569
$ 4,551
Acquisition-related amortization
70
73
71
Acquisition-related costs
25
17
20
Hurricane Sandy
-
-
-
DEA Settlement Costs
-
-
-
Store Closures and other optimization
costs
19
2
99
Adjusted selling general and
administrative expenses (Non-GAAP)
$ 4,265
$ 4,477
$ 4,361
YOY Change
Selling general and administrative
expenses $ (GAAP)
$ (19)
$ 72
$ 189
Selling general and administrative
expenses % (GAAP)
(0.4%)
1.6%
4.3%
Selling general and administrative
expenses % 2-year stack (GAAP)
4.2%
6.6%
9.6%
Adjusted selling general and
administrative expenses $ (Non-GAAP)
$ 17
$ 76
$ 121
Adjusted selling general and
administrative expenses %(Non-GAAP)
0.4%
1.7%
2.9%
Adjusted selling general and
administrative expenses % 2-year stack
(Non-GAAP)
2.9%
5.9%
7.4%
Reconciliation of Adjusted SG&A
27
$ in Millions |
 Operating
Income
(GAAP)
Acquisition
Related
Costs
Hurricane
Sandy
Acquisition
Related
Amortization
LIFO
Provision
DEA
Settlement
Costs
Alliance
Boots Fair
Value of
Warrant
Adjustment
Gain on WHI
Sale
Organizational
Efficiency Costs
Adjusted
Operating
Income (Non-
GAAP)
Fiscal 2010
Q1
797
-
-
39
34
-
-
-
-
870
Q2
1,086
-
-
38
27
-
-
-
-
1,151
Q3
829
-
-
52
18
-
-
-
-
899
Q4
746
-
-
53
61
-
-
-
-
860
Full Year
3,458
-
-
182
140
-
-
-
-
3,780
Fiscal 2011
Q1
941
-
-
52
42
-
-
-
-
1,035
Q2
1,207
-
-
46
56
-
-
-
-
1,309
Q3
951
-
-
54
50
-
-
-
-
1,055
Q4
1,266
-
-
67
60
-
-
(434)
-
959
Full Year
4,365
-
-
219
208
-
-
(434)
-
4,358
Fiscal 2012
Q1
900
-
-
60
45
-
-
-
-
1,005
Q2
1,105
-
-
61
72
-
-
-
-
1,238
Q3
873
19
-
64
60
-
-
-
-
1,016
Q4
586
50
-
70
132
-
-
-
-
838
Full Year
3,464
69
-
255
309
-
-
-
-
4,097
Fiscal 2013
Q1
705
37
39
88
55
-
-
-
-
924
Q2
1,215
21
-
110
72
-
-
(20)
-
1,398
Q3
991
27
-
83
120
28
-
-
-
1,249
Q4
1,029
11
-
92
(8)
-
(34)
-
13
1,103
Full Year
3,940
96
39
373
239
28
(34)
(20)
13
4,674
28
Reconciliation of Adjusted Operating Income
$ in Millions |
 Operating
Income
(GAAP)
Acquisition
Related
Costs
Hurricane
Sandy
Acquisition
Related
Amortization
LIFO
Provision
DEA
Settlement
Costs
Alliance
Boots Fair
Value of
Warrant
Adjustment
Gain on WHI
Sale
Store Closure and
Other
Optimization
Costs
Adjusted
Operating Income
(Non-GAAP)
Fiscal 2014
Q1
924
25
-
91
58
-
(19)
-
24
1,103
Q2
1,275
17
-
92
51
-
(99)
-
2
1,338
Q3
1,026
20
-
92
41
-
27
-
99
1,305
29
Reconciliation of Adjusted Operating Income
$ in Millions |
 Net
Earnings
(GAAP)
Acquisition
Related
Costs
Hurricane
Sandy
Acquisition
Related
Amortization
LIFO
Provision
Gain on
WHI
Sale
Fair Market
Value of
warrants
Adjustment
DEA
Settlement
Costs
Medicare
Part D
Organizational
Efficiency
Costs
Alliance
Boots Related
Tax
Adjusted Net
Earnings
(Non-GAAP)
Fiscal 2010
Q1
489
-
-
25
20
-
-
-
-
-
-
534
Q2
669
-
-
24
17
-
-
-
-
-
-
710
Q3
463
-
-
33
11
-
-
-
43
-
-
550
Q4
470
-
-
34
39
-
-
-
-
-
-
543
Full Year
2,091
-
-
116
87
-
-
-
43
-
-
2,337
Fiscal 2011
Q1
580
-
-
33
26
-
-
-
-
-
-
639
Q2
739
-
-
28
35
-
-
-
-
-
-
802
Q3
603
-
-
35
32
-
-
-
-
-
-
670
Q4
792
-
-
42
38
(273)
-
-
-
-
-
599
Full Year
2,714
-
-
138
131
(273)
-
-
-
-
-
2,710
Fiscal 2012
Q1
554
-
-
37
28
-
-
-
-
-
-
619
Q2
683
-
-
39
45
-
-
-
-
-
-
767
Q3
537
12
-
41
38
-
-
-
-
-
-
628
Q4
353
70
-
45
85
-
-
-
-
-
-
553
Full Year
2,127
82
-
161
195
-
-
-
-
-
-
2,565
Fiscal 2013
Q1
413
23
24
59
34
-
-
-
-
-
-
553
Q2
756
13
-
71
46
(13)
-
-
-
-
42
915
Q3
624
17
-
52
76
-
(48)
47
-
-
44
812
Q4
657
7
-
59
(5)
-
(62)
-
-
8
38
702
Full Year
2,450
60
24
241
151
(13)
(110)
47
-
8
124
2,982
Reconciliation of Adjusted Net Earnings
$ in Millions
30 |
 Net
Earnings
(GAAP)
Acquisition
Related
Costs
Acquisition
Related
Amortization
LIFO
Provision
Gain on
WHI
Sale
Fair Market
Value of
warrants
Adjustment
DEA
Settlement
Costs
Medicare
Part D
Store
Closures and
other
Optimization
Costs
Alliance
Boots Related
Tax
Adjusted Net
Earnings
(Non-GAAP)
Fiscal 2014
Q1
695
16
-
58
37
-
(161)
-
-
15
28
688
Q2
754
11
-
60
33
-
(26)
-
-
1
47
880
Q3
722
14
-
63
28
-
(67)
-
-
68
55
883
Reconciliation of Adjusted Net Earnings
$ in Millions
31
Hurricane
Sandy |
 Diluted
EPS
(GAAP)
Acquisition
Related
Costs
Alliance
Boots Share
Issuance
Effect
Hurricane
Sandy
Acquisition
Related
Amortization
LIFO
Provision
Fair Market
Value of
warrants
Adjustment
Gain
on WHI
Sale
DEA
Settlement
Costs
Medicare
Part D
Efficiency
Costs
Alliance
Boots
Related
Tax
Adjusted
Diluted
EPS (Non-
GAAP)
Fiscal 2010
Q1
0.49
-
-
-
0.03
0.02
-
-
-
-
-
-
0.54
Q2
0.68
-
-
-
0.02
0.02
-
-
-
-
-
-
0.72
Q3
0.47
-
-
-
0.03
0.02
-
-
-
0.04
-
-
0.56
Q4
0.49
-
-
-
0.03
0.04
-
-
-
-
-
-
0.56
Full Year
2.12
-
-
-
0.12
0.09
-
-
-
0.04
-
-
2.37
Fiscal 2011
Q1
0.62
-
-
-
0.03
0.03
-
-
-
-
-
-
0.68
Q2
0.80
-
-
-
0.03
0.04
-
-
-
-
-
-
0.87
Q3
0.65
-
-
-
0.04
0.03
-
-
-
-
-
-
0.72
Q4
0.87
-
-
-
0.05
0.04
-
(0.30)
-
-
-
-
0.66
Full Year
2.94
-
-
-
0.15
0.14
-
(0.30)
-
-
-
-
2.93
Fiscal 2012
Q1
0.63
-
-
-
0.05
0.03
-
-
-
-
-
-
0.71
Q2
0.78
-
-
-
0.05
0.05
-
-
-
-
-
-
0.88
Q3
0.62
0.01
-
-
0.05
0.04
-
-
-
-
-
-
0.72
Q4
0.39
0.08
0.01
-
0.05
0.10
-
-
-
-
-
-
0.63
Full Year
2.42
0.09
0.02
-
0.18
0.22
-
-
-
-
-
-
2.93
Fiscal 2013
Q1
0.43
0.02
-
0.03
0.06
0.04
-
-
-
-
-
-
0.58
Q2
0.79
0.01
-
-
0.08
0.05
-
(0.01)
-
-
-
0.04
0.96
Q3
0.65
0.02
-
-
0.05
0.08
(0.05)
-
0.05
-
-
0.05
0.85
Q4
0.69
0.01
-
-
0.05
(0.01)
(0.06)
-
-
-
0.01
0.04
0.73
Full Year
2.56
0.06
-
0.03
0.25
0.16
(0.12)
(0.01)
0.05
-
0.01
0.13
3.12
32
Reconciliation of Adjusted Diluted EPS
Organiza-
tional |
 Diluted EPS
(GAAP)
Acquisition
Related Costs
Alliance Boots
Share Issuance
Effect
Hurricane
Sandy
Acquisition
Related
Amortization
LIFO
Provision
Fair Market
Value of
warrants
Adjustment
Gain on
WHI Sale
DEA
Settlement
Costs
Medicare
Part D
Organizational
Efficiency
Costs
Alliance
Boots
Related Tax
Adjusted Diluted
EPS (Non-GAAP)
Fiscal 2014
Q1
0.72
0.02
-
-
0.06
0.04
(0.17)
-
-
-
0.02
0.03
0.72
Q2
0.78
0.01
-
-
0.06
0.04
(0.03)
-
-
-
-
0.05
0.91
Q3
0.75
0.01
-
-
0.06
0.03
(0.07)
-
-
-
0.07
0.06
0.91
33
Reconciliation of Adjusted Diluted EPS |
 1Q09
2Q09
3Q09
4Q09
1Q10
2Q10
3Q10
4Q10
Cash Flow from
Operations (GAAP)
$312
$1,428
$1,519
$852
$1,168
$595
$1,056
$925
Capital
Expenditures
(GAAP)
(638)
(454)
(442)
(393)
(304)
(220)
(262)
(228)
Free Cash Flow
(Non-GAAP)*
($326)
$974
$1,077
$459
$864
$375
$794
$697
Reconciliation of Free Cash Flow
$ in Millions
34
*Free cash flow is defined as net cash provided by operating activities in a period
minus additions to property and equipment (capital expenditures) made in
that
period.
This
measure
does
not
represent
residual
cash
flows
available
for
discretionary
expenditures
as
the
measure
does
not
deduct
the
payments
required for debt service and other contractual obligations or payments for future
business acquisitions. Therefore, we believe it is important to view free
cash
flow
as
a
measure
that
provides
supplemental
information
to
our
entire
statements
of
cash
flows. |
 1Q11
2Q11
3Q11
4Q11
1Q12
2Q12
3Q12
4Q12
1Q13
2Q13
3Q13
4Q13
Cash Flow
from
Operations
(GAAP)
$1,165
$886
$1,230
$362
$809
$1,007
$1,847
$768
$601
$1,198
$1,379
$1,123
Capital
Expenditures
(GAAP)
(273)
(196)
(230)
(514)
(419)
(304)
(379)
(448)
(336)
(245)
(293)
(338)
Free Cash
Flow (Non-
GAAP)*
$892
$690
$1,000
($152)
$390
$703
$1,468
$320
$265
$953
$1,086
$785
$ in Millions
35
Reconciliation of Free Cash Flow
*Free cash flow is defined as net cash provided by operating activities in a period
minus additions to property and equipment (capital expenditures) made in
that
period.
This
measure
does
not
represent
residual
cash
flows
available
for
discretionary
expenditures
as
the
measure
does
not
deduct
the
payments
required for debt service and other contractual obligations or payments for future
business acquisitions. Therefore, we believe it is important to view free
cash
flow
as
a
measure
that
provides
supplemental
information
to
our
entire
statements
of
cash
flows. |
 1Q14
2Q14
3Q14
Cash Flow
from
Operations
(GAAP)
$133
1,104
1,272
Capital
Expenditures
(GAAP)
(364)
(227)
(230)
Free Cash
Flow (Non-
GAAP)*
(231)
877
1,042
$ in Millions
36
Reconciliation of Free Cash Flow
*Free cash flow is defined as net cash provided by operating activities in a period
minus additions to property and equipment (capital expenditures) made in
that
period.
This
measure
does
not
represent
residual
cash
flows
available
for
discretionary
expenditures
as
the
measure
does
not
deduct
the
payments
required for debt service and other contractual obligations or payments for future
business acquisitions. Therefore, we believe it is important to view free
cash
flow
as
a
measure
that
provides
supplemental
information
to
our
entire
statements
of
cash
flows. |
 1Q12
2Q12
3Q12
4Q12
1Q13
2Q13
3Q13
4Q13
1Q14
2Q14
3Q14
Total LIFO Inventory
$8,231
$7,347
$7,004
$7,036
$7,821
$7,253
$6,881
$6,852
$7,729
$7,213
$6,439
YOY % Change
4.1%
(3.4%)
(7.3%)
(12.5%)
(5.0%)
(1.3%)
(1.8%)
(2.6%)
(1.2%)
(0.6%)
(6.4%)
LIFO Reserve
1,633
1,704
1,764
1,897
1,952
2,024
2,144
2,136
2,194
2,246
2,286
Total FIFO Inventory
$9,864
$9,051
$8,768
$8,933
$9,773
$9,277
$9,025
$8,988
$9,923
9,459
8,725
YOY % Change
5.7%
(0.4%)
(3.4%)
(7.3%)
(0.9%)
2.5%
2.9%
0.6%
1.5%
2.0%
(3.3%)
# of Drugstores
7,812
7,841
7,890
7,930
8,058
8,072
8,097
8,116
8,200
8,210
8,217
LIFO Inventory per
Drugstore (000’s)
1,054
937
888
887
971
899
850
844
943
879
784
YOY % Change
1.9%
(5.3%)
(9.3%)
(14.4%)
(7.9%)
(4.1%)
(4.3%)
(4.8%)
(2.9%)
(2.2%)
(7.8%)
FIFO Inventory per
Drugstore (000’s)
1,263
1,154
1,111
1,126
1,213
1,149
1,115
1,107
1,210
1,152
1,062
YOY % Change
3.6%
(2.3%)
(5.6%)
(9.3%)
(4.0%)
(0.4%)
0.4%
(1.7%)
(0.2%)
0.3%
(4.8%)
37
$ in Millions except as indicated
Reconciliation of FIFO Inventory |
 Certain Definitions & Assumptions
38
CERTAIN
ASSUMPTIONS:
Unless
the
context
otherwise
indicates
or
requires:
•
All figures assume constant currency and current management assumptions regarding
future interest rates. •
References to the combined company and pro forma combined financial and other
information assume closing of Step 2 in
the first calendar quarter of 2015;
•
Walgreens transaction with Alliance Boots does not include the benefit of Alliance
Boots minority interest in Galenica Ltd., a Swiss healthcare group, so
Walgreens shareholders will not benefit from the financial performance of Galenica Ltd. even
though Alliance Boots proportionate interest in their profits is
reflected in Alliance Boots financial statements for periods prior
to May 10, 2013; and
•
All financial goals assume no major mergers and acquisitions or
other strategic transactions.
Trading
Profit
-
Profit
from
operations
before
amortization
of
customer
relationships
and
brands,
exceptional
items
and
share of post-tax earnings of associates and joint ventures
Historical
Alliance
Boots
Financial
Information
–
Alliance
Boots’
audited
consolidated
financial
statements,
comprised
of
the Group statements of financial position at March 31, 2014 and
2013, and the related Group income statements, Group
statements of comprehensive income, Group statements of changes in equity and Group
statements of cash flows for each of the years in the three-year period
ended March 31, 2014, were filed as Exhibit 99.1 to the Walgreen Co. Form 8-K filed on
May 15, 2014. Such financial statements of Alliance Boots were prepared in
accordance with International Financial Reporting Standards as issued by the
International Accounting Standards Board (IFRS) and audited in accordance with
auditing standards generally accepted in the United States.
All descriptions of the company’s agreements relating to
Alliance Boots and the arrangements and transactions contemplated thereby in this
presentation are qualified in their entirety by
reference
to
the
full
text
of
the
agreements,
copies
of
which
have
been
filed
with
the
SEC.
See
the
Company’s
Form
8-K
filings on June 19, 2012, August 6, 2012, September 10, 2012 , September 13, 2012,
May 15, 2013 May 15, 2014, and August 6, 2014.
All descriptions in this presentation of the agreements relating
to the strategic long-term relationship with AmerisourceBergen
announced by the Company and Alliance Boots on March 18, 2013 and the arrangements
and transactions contemplated thereby are qualified in their entirety by
reference to the description and the full text of the agreements in the Company’s
Form 8-K filing on March 20, 2013 and Schedule 13D filing on April 15,
2014. |
 Cautionary Note Regarding Forward-Looking Statements
39
Cautionary Note Regarding Forward-Looking Statements. Statements in these materials and the
accompanying presentation and remarks that are not historical are forward-looking
statements for purposes of applicable securities laws. Words such as “expect,” “likely,”
“outlook,” “forecast,” “would,” “could,” “should,”
“can,” “will,” “project,” “intend,” “plan,” “goal,” “target,” “continue,” “sustain,” “synergy,” “on
track,” “believe,” “seek,” “estimate,” “anticipate,”
“may,” “possible,” “assume,” variations of such words and similar expressions are
intended to identify such forward-looking statements. These forward-looking statements are not
guarantees of future performance and involve risks, assumptions and uncertainties, including:
the risks that one or more closing conditions to the transactions may not be satisfied or
waived, on a timely basis or otherwise, including that a governmental entity may prohibit, delay or refuse to grant approval for
the consummation of the transactions or that the required approvals by the Company’s shareholders
may not be obtained; the risk of a material adverse change that the Company or Alliance
Boots or either of their respective businesses may suffer as a result of disruption or
uncertainty relating to the transactions; risks associated with changes in economic and business conditions generally or in the markets
in which we or Alliance Boots participate; risks associated with new business areas and activities;
risks associated with acquisitions, joint ventures, strategic investments and
divestitures, including those associated with cross-border transactions; risks associated with
governance and control matters; risks associated with the Company’s ability to timely arrange for
and consummate financing for the contemplated transactions on acceptable terms; risks
relating to the Company and Alliance Boots’ ability to successfully integrate our
operations, systems and employees, realize anticipated synergies and achieve anticipated financial
results, tax and operating results in the amounts and at the times anticipated; the potential
impact of announcement of the transactions or consummation of the transactions on relationships
and terms, including with employees, vendors, payers, customers and competitors; the amounts and timing of costs and
charges associated with our optimization initiatives; our ability to realize expected savings and
benefits in the amounts and at the times anticipated; changes in management’s
assumptions; the risks associated with transitions in supply arrangements; risks that legal
proceedings may be initiated related to the transactions; the amount of costs, fees, expenses and
charges incurred by Walgreens and Alliance Boots related to the transactions; the ability to
retain key personnel; changes in financial markets, interest rates and foreign currency
exchange rates; the risks associated with international business operations; the risk of unexpected costs, liabilities or delays;
changes in network participation and reimbursement and other terms; risks associated with the
operation and growth of our customer loyalty program; risks associated with outcomes of legal
and regulatory matters, and changes in legislation, regulations or interpretations
thereof; and other factors described in Item 1A (Risk Factors) of our most recent Form 10-K and
Form 10-Q, each of which is incorporated herein by reference, and in other documents
that we file or furnish with the SEC. Should one or more of these risks or uncertainties
materialize, or should underlying assumptions prove incorrect, actual results may vary materially from those indicated or
anticipated by such forward-looking statements. Accordingly, you are cautioned not to place undue
reliance on these forward-looking statements, which speak only as of the date they
are made. Except to the extent required by law, Walgreens does not undertake, and
expressly disclaims, any duty or obligation to update publicly any forward-looking statement after
the date of this presentation, whether as a result of new information, future events,
changes in assumptions or otherwise. |
 Cautionary Note Regarding Forward-Looking Statements
40
Important Information for Investors and Shareholders
This communication does not constitute an offer to sell or the solicitation of an
offer to buy any securities or a solicitation of any vote or approval, nor
shall there be any sale of securities in any jurisdiction in which such offer, solicitation or sale
would be unlawful prior to registration or qualification under the securities laws
of any such jurisdiction. No offer of securities
shall
be
made
except
by
means
of
a
prospectus
meeting
the
requirements
of
Section
10
of
the
Securities
Act
of
1933, as amended. In connection with the proposed transaction between Walgreens and
Alliance Boots, Walgreens Boots Alliance will file with the Securities and
Exchange Commission (SEC) a registration statement on Form S-4 that will include
a proxy statement of Walgreens that also constitutes a prospectus of Walgreens
Boots Alliance. After the registration statement
has
been
declared
effective
by
the
SEC,
the
definitive
proxy
statement/prospectus
will
be
delivered
to
shareholders of Walgreens. INVESTORS AND SECURITY HOLDERS OF WALGREENS ARE URGED TO READ THE
DEFINITIVE PROXY STATEMENT/PROSPECTUS (INCLUDING ALL AMENDMENTS AND
SUPPLEMENTS THERETO) AND OTHER DOCUMENTS RELATING TO THE TRANSACTION THAT WILL
BE FILED WITH THE SEC CAREFULLY AND
IN
THEIR
ENTIRETY
WHEN
THEY
BECOME
AVAILABLE
BECAUSE
THEY
WILL
CONTAIN
IMPORTANT
INFORMATION
ABOUT
THE
PROPOSED
TRANSACTION.
Investors
and
security
holders
will
be
able
to
obtain
free
copies of the registration statement and the definitive proxy statement/prospectus
(when available) and other documents filed
with
the
SEC
by
Walgreens
or
Walgreens
Boots
Alliance
through
the
website
maintained
by
the
SEC
at
www.sec.gov.
Copies of the documents filed with the SEC by Walgreens or Walgreens Boots Alliance
will be available free of charge on Walgreens’
internet
website
at
www.walgreens.com
under
the
heading
“Investor
Relations”
and
then
under
the
heading
“SEC Filings”
or by contacting Walgreen’s Investor Relations Department at (847)
315-2500. Participants in the Solicitation
Walgreens, Alliance Boots and their respective directors, executive officers and
certain other members of management and employees may be deemed to be
participants in the solicitation of proxies from the holders of Walgreens common
stock in respect of the proposed transaction. Information regarding the persons who
are, under the rules of the SEC, participants in the solicitation of proxies
in favor of the proposed transaction will be set forth in the proxy
statement/prospectus
when
it
is
filed
with
the
SEC.
You
can
find
information
about
Walgreens’
directors
and
executive
officers in Walgreens’
Annual Report on Form 10-K for the year ended August 31, 2013 and definitive
proxy statement filed with
the
SEC
on
November
25,
2013.
You
can
obtain
free
copies
of
these
documents,
which
are
filed
with
the
SEC,
from
Walgreens using the contact information above. |