Attached files
| file | filename |
|---|---|
| 8-K - 8-K - People's United Financial, Inc. | d772193d8k.htm |
 Investor Presentation
August 2014
Investor Contact:
Peter Goulding, CFA
203-338-6799
peter.goulding@peoples.com
XXXXXXXXXXXXX
XXXXXXXXXXXXX
Exhibit 99.1 |
 1
Certain statements contained in this release are forward-looking in nature.
These include all statements about People's United Financial's plans,
objectives, expectations and other statements that are not historical facts,
and usually use words such as "expect," "anticipate," "believe," "should" and similar
expressions. Such statements represent management's current beliefs, based upon
information available at the time the statements are made, with regard to
the matters addressed. All forward-looking statements are
subject
to
risks
and
uncertainties
that
could
cause
People's
United
Financial's
actual
results
or
financial
condition
to
differ
materially
from
those
expressed
in
or
implied
by
such
statements.
Factors
of
particular importance to People’s United Financial include, but are not
limited to: (1) changes in general, national or regional economic
conditions; (2) changes in interest rates; (3) changes in loan default and
charge-off rates; (4) changes in deposit levels; (5) changes in levels of
income and expense in non- interest income and expense related
activities; (6) residential mortgage and secondary market activity; (7)
changes in accounting and regulatory guidance applicable to banks; (8) price levels
and conditions in the public securities markets generally; (9) competition
and its effect on pricing, spending, third-party relationships and
revenues; (10) the successful integration of acquisitions; and (11) changes in regulation
resulting from or relating to financial reform legislation. People's United
Financial does not undertake any obligation to update or revise any
forward-looking statements, whether as a result of new information,
future events or otherwise.
Forward-Looking Statement |
 2
Table of Contents
1.
Strategic Position
2.
Financial Performance
3.
Summary
4.
Appendix |
 Strategic Position
XXXXXXXXXXXXX |
 4
Corporate Overview
Snapshot as of June 30, 2014
People’s United Financial, Inc.
NASDAQ (PBCT)
Headquarters:
Bridgeport, CT
Chief Executive Officer:
Jack Barnes
Chief Financial Officer:
(1)
Kirk Walters
Market Capitalization (8/4/14):
$4.4 billion
Assets:
$33.9 billion
Loans:
$25.5 billion
Deposits:
$24.1 billion
Branches:
407
In-store Branches:
(2)
142
ATMs:
616
Standalone ATMs:
(3)
113
Founded:
1842
Notes:
1.
On
April
16,
2014
People’s
United
announced
the
transition
of
CFO
Kirk
Walters’
role
with
the
company.
Walters
will
continue
as
CFO of People’s United Financial, Inc., the bank’s holding company, and
former Treasurer David Rosato was appointed CFO of People’s
United Bank. Walters will continue to serve as CFO of People’s United Financial, Inc. through December 31, 2014,
when Rosato is expected to assume that position
2.
Exclusive relationship with Stop & Shop, a subsidiary of Ahold
(ENXTAM:AH) 3.
Includes 21 ATMs in Stop & Shop locations where a branch is not present
|
 5
Compelling Investment Opportunity
Leading
market
position
in
the
best
commercial
banking
market
in
the
US
Significant
growth
runway
within
existing
markets
–
expanding
in
two
of
the
largest MSAs in the US (New York City, #1, Boston, #10)
Dividend yield of ~4.5%
Ability
to
maintain
pristine
credit
quality
–
no
credit
“events”
Improving profitability
Strong liquidity
Continued capital deployment via organic growth and dividends
|
 6
th
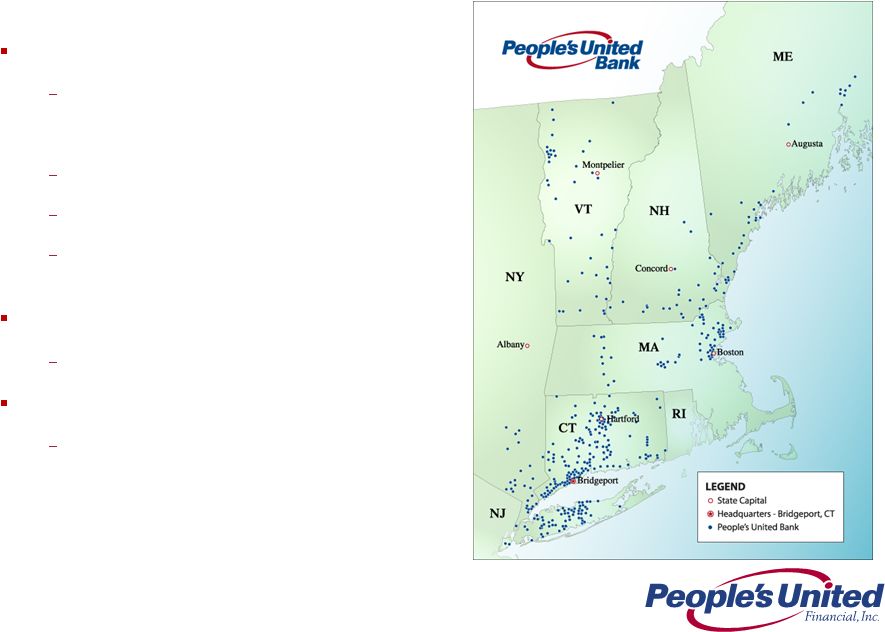
Retail & Business Banking Franchise
Distribution
400+ branches over 6 states
•
~35% of branches are in-store
600+ ATMs
Online & mobile banking
Call center operations located in Bridgeport,
CT and Burlington, VT
Scale
5
in deposit market share in New England *
Customer base
Approximately 850,000 commercial, business
banking, consumer and wealth management
relationships
* Source: SNL Financial |
 7
Strategic Focus of Deposit Franchise
Growth
Core customers and deposits
Multiple product households
Leverage employee expertise to drive sales
Brand execution
Employee expertise
Superior customer experience
In-store supermarket strategy
Leveraging the Citizen’s branch acquisition
Navigating a low rate environment
Balancing growth, retention and cost of funds
Constant evaluation of branch-level profitability
•
Consolidated 35 branches since the beginning of 2011, or ~9% of our
franchise |
 8
Branches
$BN
%
1
TD Bank
51
3.6
15.8
2
KeyCorp
53
2.5
10.8
3
Bangor Bancorp
60
2.2
9.4
4
Camden National
44
1.8
8.0
5
B of A
18
1.4
6.0
6
First Bancorp
16
1.0
4.5
7
Machias
18
0.9
3.8
8
People's United
26
0.9
3.7
9
Bar Harbor
16
0.9
3.7
10
Norway
22
0.8
3.3
Branches
$BN
%
1
B of A
242
57.4
19.9
2
RBS
252
29.0
10.1
3
Santander
225
18.1
6.3
4
TD Bank
152
11.5
4.0
5
Eastern Bank
95
6.9
2.4
6
Independent Bank
83
4.9
1.7
7
Middlesex
30
3.5
1.2
8
People's United
54
3.1
1.1
9
Boston Private
11
3.0
1.0
10
First Republic
4
3.0
1.0
Strong Deposit Market Positions
Connecticut
Massachusetts
Vermont
New York
New Hampshire
Maine
#1 in Fairfield County, CT, 65 branches, $6.3BN deposits, 18.7% market share
Source: SNL Financial; FDIC data as of June 30, 2013; excludes trust
institutions Notes: PBCT branch count updated as of June 30, 2014
Branches
$BN
%
1
B of A
147
25.9
24.5
2
Webster
124
12.7
12.1
3
People's United
162
11.3
10.7
4
Wells Fargo
75
7.8
7.4
5
TD Bank
76
6.1
5.8
6
JPM Chase
54
4.8
4.5
7
First Niagara
85
4.3
4.1
8
Citi
21
3.0
2.9
9
Liberty
49
2.9
2.7
10
RBS
46
2.5
2.4
Branches
$BN
%
1
People's United
42
2.6
22.6
2
TD Bank
35
2.6
22.0
3
Merchants
32
1.3
10.8
4
RBS
21
0.8
7.0
5
KeyCorp
13
0.7
6.1
6
Northfield
13
0.5
4.4
7
Community
14
0.4
3.8
8
Union
12
0.4
3.5
9
Passumpsic
6
0.3
2.8
10
NH Thrift
17
0.3
2.5
Branches
$BN
%
1
RBS
74
6.7
23.9
2
TD Bank
73
5.8
20.5
3
B of A
27
4.6
16.3
4
People's United
28
1.3
4.6
5
NH Mutual
18
1.0
3.7
6
BNH
22
0.9
3.2
7
Santander
20
0.9
3.0
8
NH Thrift
21
0.8
2.8
9
Mascoma
19
0.7
2.6
10
Eastern Bank
7
0.7
2.6
Branches
$BN
%
1
JPM Chase
803
424.5
37.5
2
Citi
269
76.1
6.7
3
B of A
315
60.5
5.4
4
HSBC
155
58.9
5.2
5
Capital One
267
40.8
3.6
6
M&T
288
35.2
3.1
7
TD Bank
238
24.2
2.1
8
KeyCorp
250
19.4
1.7
9
First Niagara
201
17.2
1.5
10
Signature
28
15.3
1.4
28
People's United
95
2.7
0.2 |
 9
Large and Attractive Markets
NYC-Northern NJ-PA
Population: 20.0MM
Median HH Income: $64,538
Businesses: 810,883
Population Density (#/sq miles): 2,411
Unemployment Rate (%): 6.6
$100K+ Households (%): 31.5
Boston, MA
Population: 4.7MM
Median HH Income: $71,190
Businesses: 203,770
Population Density (#/sq miles): 1,347
Unemployment Rate (%): 5.2
$100K+ Households (%): 34.8
Hartford, CT
Population: 1.2MM
Median HH Income: $67,457
Businesses: 52,315
Population Density (#/sq miles): 802
Unemployment Rate (%): 6.4
$100K+ Households (%): 31.0
Bridgeport-Stamford, CT
Population: 944,000
Median HH Income: $78,095
Businesses: 49,392
Population Density (#/sq miles): 1,511
Unemployment Rate (%): 5.8
$100K+ Households (%): 39.6
New Haven, CT
Population: 862,000
Median HH Income: $61,762
Businesses: 36,800
Population Density (#/sq miles): 1,428
Unemployment Rate (%): 7.1
$100K+ Households (%): 28.0
Burlington, VT
Population: 215,000
Median HH Income: $65,440
Businesses: 10,846
Population Density (#/sq miles): 172
Unemployment Rate (%): 3.6
$100K+ Households (%): 27.4
Notes: The current national unemployment rate is 6.2%
The current national population density is 90 (#/sq miles)
Source: SNL Financial, US Census data
The population densities of NYC, Boston, Bridgeport and New Haven MSAs are each
over ten times the national average |
 10
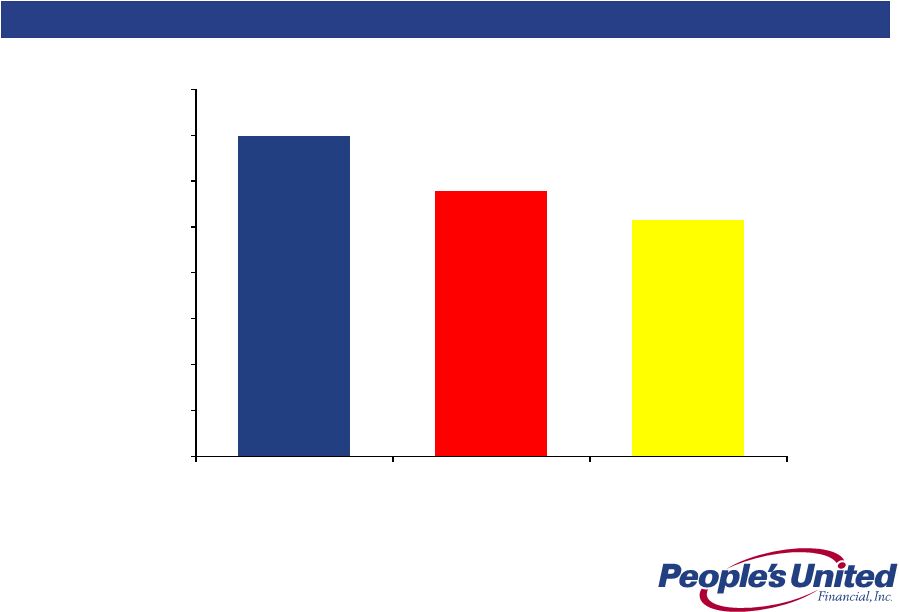
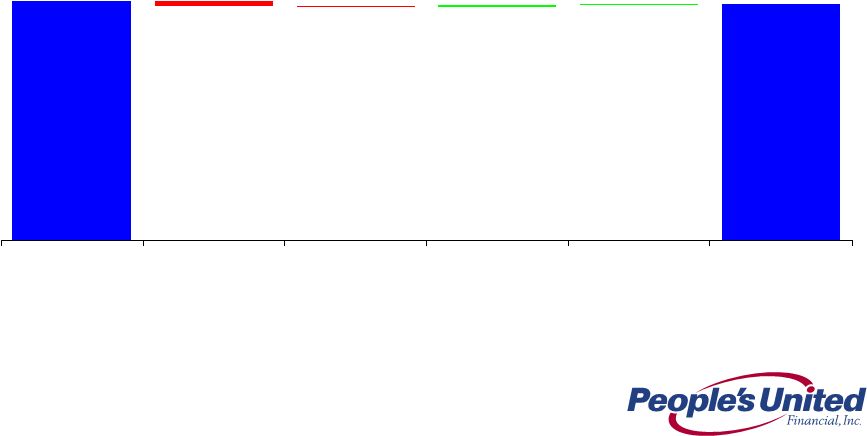
Strong Market Demographic Profile
Source: SNL Financial, US Census data
Weighted Average Median Household Income
$69,806
$57,693
$51,314
$0
$10,000
$20,000
$30,000
$40,000
$50,000
$60,000
$70,000
$80,000
PBCT
Peer Median
US |
 11
Attractive Market Demographics
Source: SNL Financial; Nielsen; FDIC data as of June 30, 2013
1.
Excludes deposits from trust institutions and branches with over
$750MM deposits;
excludes branches and deposits located outside each MSA
2.
Rank weighted by percentage of franchise deposits
75% of People’s United’s franchise deposits are in its top 5 MSAs, which
are some of the most densely populated and wealthy markets in the US
People's Franchise Metrics
1
MSA Rank out of 917 Nationwide MSAs
Market Size
Population
Median
% Households
Total Deposits
Market
% Deposit
Number of
Deposits
% of
Density
Household
with $200k+
People's United Top 5 MSAs
($MM)
Rank
Market Share
Branches
($MM)
Franchise
(# / sq. mile)
Income
Income
Bridgeport-Stamford-Norwalk, CT
$33,816
1
18.5%
65
$6,241
29.7
6
7
2
Boston-Cambridge-Newton, MA-NH
124,503
10
2.2
52
2,772
13.2
8
18
9
New York-Newark-Jersey City, NY-NJ-PA
592,790
30
0.4
95
2,657
12.6
2
34
12
Hartford-West Hartford-East Hartford, CT
26,118
4
8.1
45
2,119
10.1
20
26
21
New Haven-Milford, CT
17,801
4
11.2
32
1,987
9.5
7
49
34
Top 5 MSAs
$795,028
–
2.0%
289
$15,776
75.1
–
–
–
Weighted Average Rank ²
–
–
–
–
–
8
21
11
Rank / Nationwide MSAs (917 MSAs)
–
–
–
–
–
0.8%
2.3%
1.3% |
 12
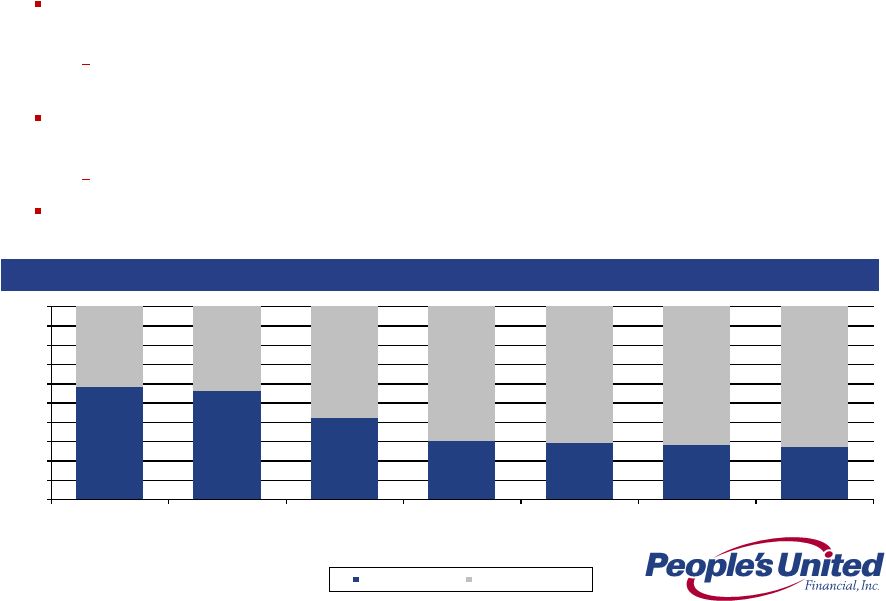
Connecticut In-store Versus Traditional Branch Business (Last Twelve Months
Through 6/30/14) In-store Versus Traditional Branches
Connecticut
On average, in-store locations are open 37% more hours per week than traditional
branches (56 hours vs. 41 hours) but are 30% less expensive to operate
Partnership allows us to leverage our brand with the ~1.8 million shoppers who
visit Connecticut Stop & Shop stores every week
In-store locations operate under the same business model as traditional branches
and sell all the Bank’s products and services
Mortgages, Home Equity Loans, Business Loans and Investments*
Connecticut in-store branches accounted for a significant portion of the new
branch business booked in the market
* Sold by employees who are also licensed representatives of our
brokerage affiliate
58%
56%
42%
30%
29%
28%
27%
42%
44%
58%
70%
71%
72%
73%
0%
10%
20%
30%
40%
50%
60%
70%
80%
90%
100%
Consumer
Checking Accounts
Opened
Savings Accounts
Opened
Business Checking
Accounts Opened
Mortgage Loan
Originations
Home Equity Loan
Originations
Investment Sales
Business Banking
Loan Originations
In-store Branches
Traditional Branches |
 Financial Performance
XXXXXXXXXXXXXXX |
 14
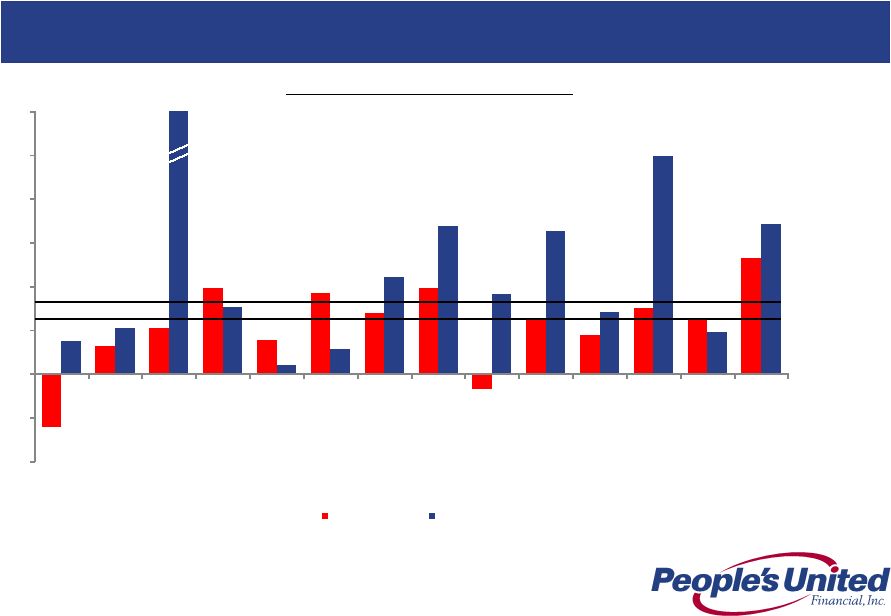
Consistent Loan Growth
Since the end of 2010, People’s United is one of only six banks within the top 50
by assets that have grown loans in each quarter
¹ Source:
SNL Financial. Excludes trust banks. Statements based on Total Gross Loans and
Finance Leases, as reported, net of unearned
discounts
and
gross
of
loss
reserves.
Does
not
include
accrued
interest
on
loans
Notes:
1
Top 50 banks by assets as of most recent year end; includes People’s United,
First Niagara, First Republic, Signature, UMB and Investors
2
Reflects completion of Danvers Bancorp acquisition in 2Q 2011
3
Based on 45 of the top 50 banks reporting
Quarterly Loan Growth Since 1Q 2011
PBCT Median = 1.67%
Top 50 Median = 1.27%
-1.23%
0.64%
1.04%
1.97%
0.78%
1.86%
1.38%
1.97%
-0.35%
1.28%
0.90%
1.51%
1.27%
2.65%
0.75%
1.04%
1.52%
0.21%
0.57%
2.20%
3.38%
1.82%
3.25%
1.40%
4.98%
0.95%
3.42%
-2%
-1%
0%
1%
2%
3%
4%
5%
6%
1Q11
2Q11
3Q11
4Q11
1Q12
2Q12
3Q12
4Q12
1Q13
2Q13
3Q13
4Q13
1Q14
2Q14
Top 50 Median
PBCT
13.86%
2
3 |
 15
Revenue Opportunities
Continue to deepen our presence in heritage markets such as Connecticut and
Vermont
Substantial growth prospects in larger markets such as New York metro and
greater Boston
New York:¹
•
19 commercial relationship managers up from zero in 1Q 2010
•
95 branches up from 5 in 1Q 2010; 59 branches, or ~60%, are in-store
locations •
Total deposit growth of $2.8BN, or 72% compound annual growth, since 1Q 2010
Massachusetts:¹
•
33 commercial relationship managers up from 14 since 2010
•
54 branches up from 19 in 1Q 2010
•
Total deposit growth of $2.3BN, or 35% compound annual growth, since 1Q 2010
Notes:
1
Data as of June 30, 2014 |
 16
Under-represented asset classes ramping up
Bolstered
commercial
banking
presence
in
greater
Boston
and
Long
Island
Building mid-corporate and government banking productivity
New
York
Commercial
Real
Estate
gaining
traction
as
evidenced
by
strong
growth
Increased Private Banking activity with initial focus on CT, metro New York and
greater Boston Steady asset-based lending and mortgage warehouse lending
progress Enhancing wealth management offering
Added seasoned wealth management team in Hartford area
Proprietary asset allocation and risk management strategies are implemented both
internally and with a suite of external managers who represent our "best
in class" recommendations •
Unified Managed Account technology allows us to “rent”
intellectual capital –
no customer funds leave the bank
Increasing momentum in other fee income businesses with a focus on
cross-sell Delivering interest rate swaps and foreign exchange products
to corporate customers Expanding international trade finance with the recent
hire of a senior executive Merchant services joint venture highlights
commitment to better serve customers and drive growth Growing commercial
banking lending fees Revenue Opportunities
Multiple Levers for Growth |
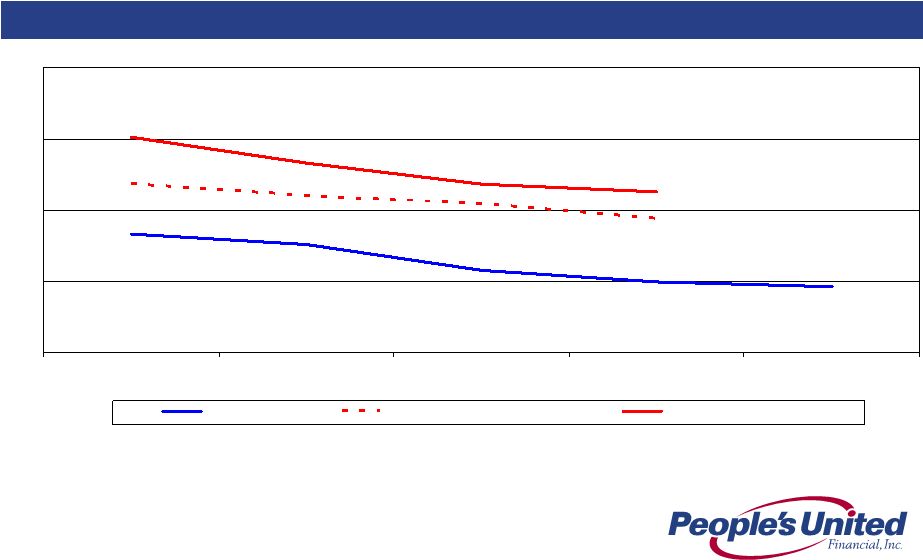
 17
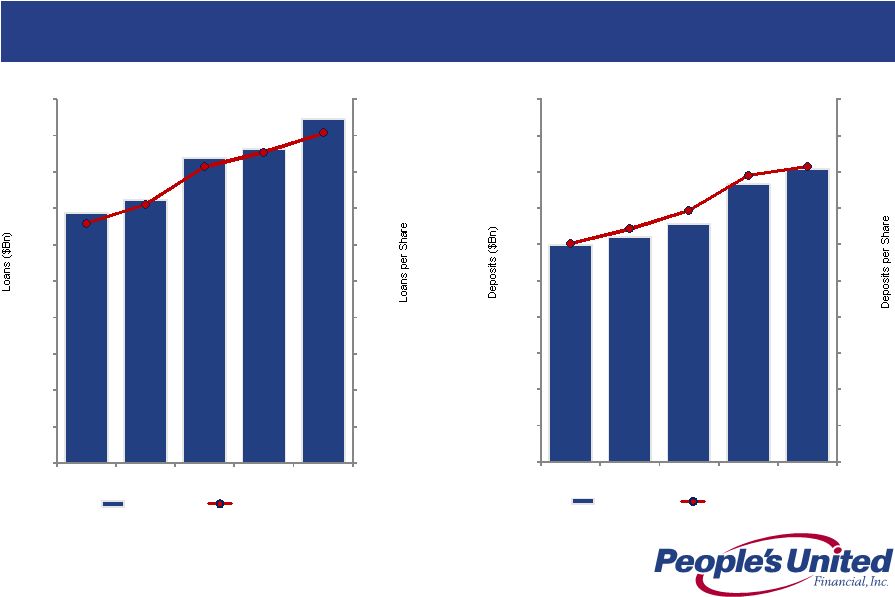
Growing Future Earnings Per Share
Loans and Deposits per Share
We have made substantial progress over the past year, growing loans and deposits
per share at compound annual growth rates of 17% and 15%, respectively
$85.35
$40
$45
$50
$55
$60
$65
$70
$75
$80
$85
$90
$16
$17
$18
$19
$20
$21
$22
$23
$24
$25
$26
2Q13
3Q13
4Q13
1Q14
2Q14
Loans ($BN)
Loans per Share
$80.77
$40
$45
$50
$55
$60
$65
$70
$75
$80
$85
$90
$16
$17
$18
$19
$20
$21
$22
$23
$24
$25
$26
2Q13
3Q13
4Q13
1Q14
2Q14
Deposits ($BN)
Deposits per Share |
 18
EMOC has been fully operational since November 2011
Three person committee comprised of the CFO of the Bank, Chief Administrative
Officer and Chief HR Officer
EMOC oversees PBCT’s non-interest expense management, implements strategies
to ensure attainment of expense management targets and oversees revenue
initiatives that require expenditures
Provides a horizontal view of the organization
Expense Management Units (EMUs) established to facilitate EMOC functions
Defined EMUs include:
•
Technology
•
Operations
•
Real Estate Services
Spending requests above $25,000 are submitted by EMU owners for approval
Staffing models, staffing replacements and additions for mid-level positions and
above require approval by the Committee
Introduction to EMOC
Expense Management Oversight Committee (EMOC)
•
Employment/Benefits
•
Marketing
•
Regulatory/Institutional
•
Depreciation/Equipment
•
Decentralized
•
Intangible Amortization |
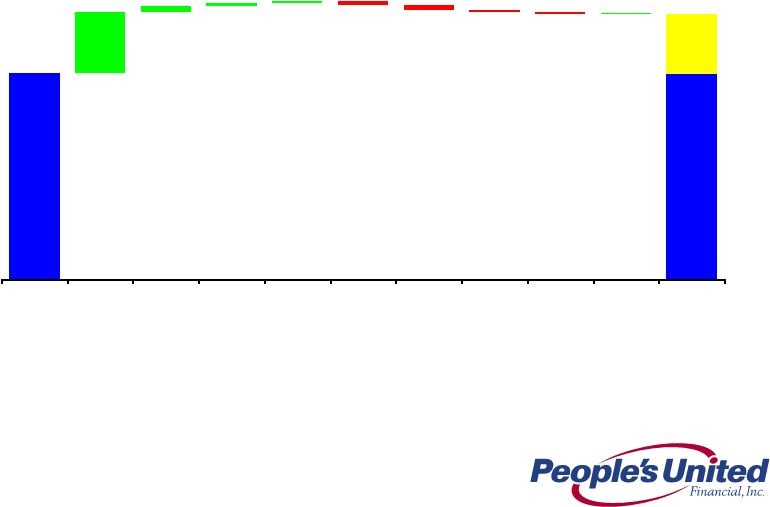
 19
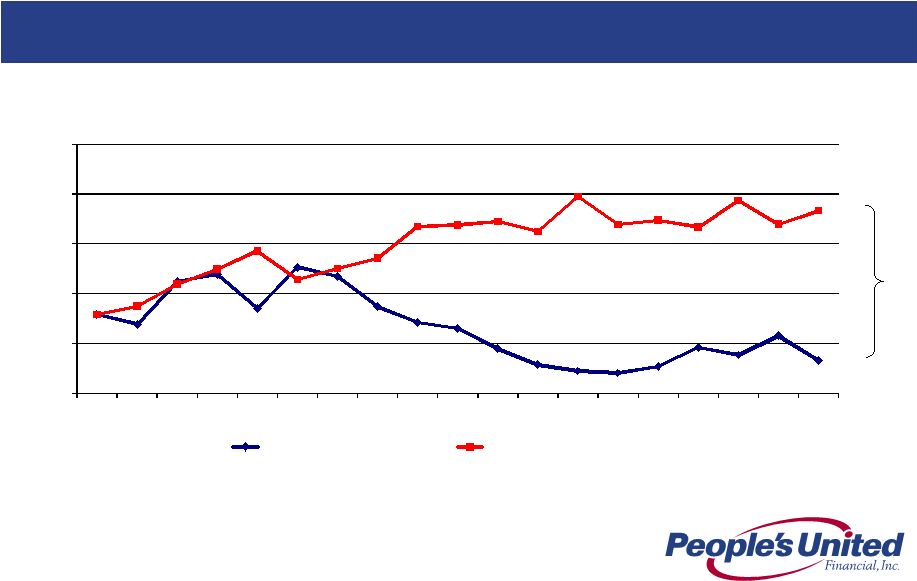
Expense Progress
Estimated Cost Savings Analysis
Source:
SNL Financial
Notes:
“Pro Forma / Actual”
represents PBCT operating non-interest expense and the actual expenses at the
acquired institutions Acquisition target costs fall away as the
acquisitions are completed “Without Expense Initiatives”
represents PBCT operating non-interest expense and the actual expenses at the
acquired institutions in 4Q09, and then applies the peer median expense
growth rate in each subsequent quarter Our 2Q 2014 operating expense base of
$207MM reflects $30MM (~$120MM annualized) savings from
successfully-executed expense initiatives 207
237
200
210
220
230
240
250
4Q09
1Q10
2Q10
3Q10
4Q10
1Q11
2Q11
3Q11
4Q11
1Q12
2Q12
3Q12
4Q12
1Q13
2Q13
3Q13
4Q13
1Q14
2Q14
Operating Noninterest Expense ($MM)
Pro Forma / Actual
Without Expense Initiatives
$30MM
Cost
Savings |
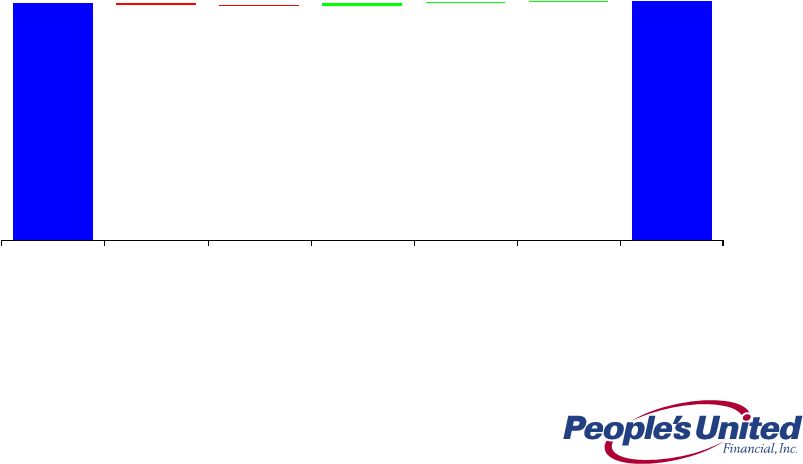
 20
237
207
7
23
$0
$50
$100
$150
$200
$250
Without Expense
Initiatives
Announced Acquisition
Savings
Other Initiatives
Pro Forma / Actual
Operating Noninterest Expense ($MM)
Expense Progress
Estimated Cost Savings Analysis
The $30MM in quarterly cost reductions is attributable to efforts related to
acquisition cost savings and other initiatives
Source:
SNL Financial
Notes:
“Pro Forma / Actual”
represents PBCT operating non-interest expense and the actual expenses at the
acquired institutions Acquisition target costs fall away as the
acquisitions are completed “Without Expense Initiatives”
represents PBCT operating non-interest expense and the actual expenses at the
acquired institutions in 4Q09, and then applies the peer median expense
growth rate in each subsequent quarter |
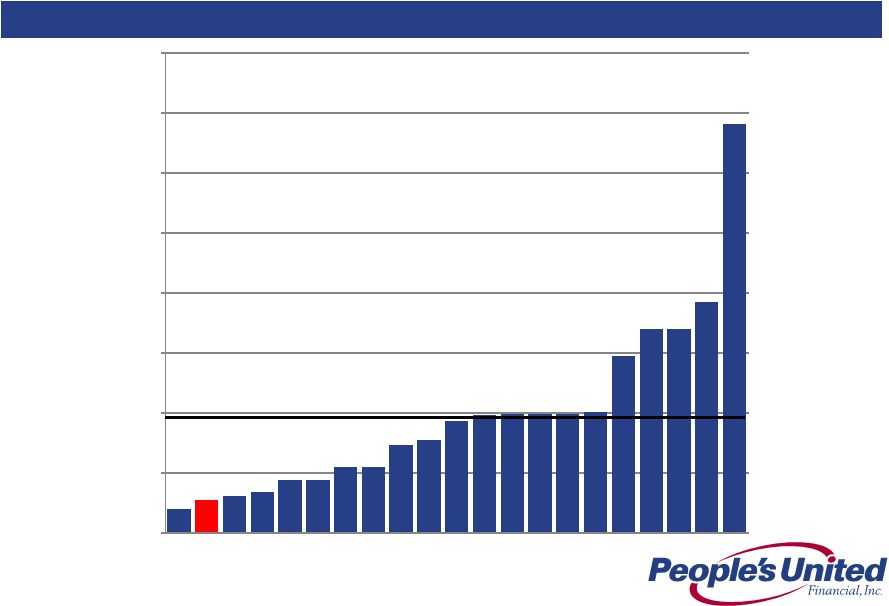 21
Average Annual Net Charge Offs / Average Loans (%)
Peer Group Comparison, 2009-2013
Conservative underwriting is a hallmark of this institution
Median, excluding PBCT = 0.95%
Source: SNL Financial
0.28
0.00
0.50
1.00
1.50
2.00
2.50
3.00
3.50
4.00
PBCT |
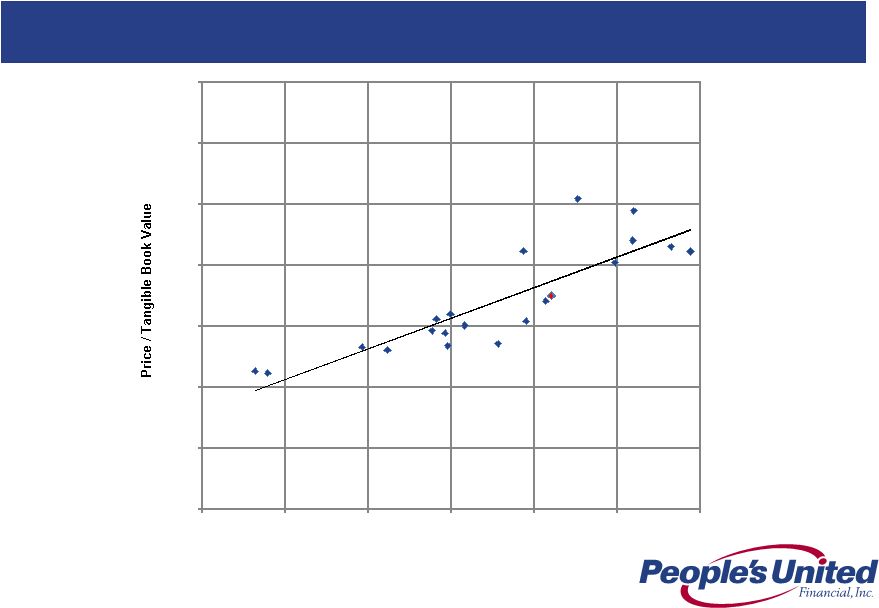 22
P/TBV vs. ROATE
Peer Group Regression Analysis
Improved profitability, predictability of earnings and a strong dividend will create
additional shareholder value
PBCT
Source: SNL Financial
Note: Analysis utilizes SNL 3 Year Betas, as of August 4, 2014
R²
= 0.73
0
50
100
150
200
250
300
350
-5.0%
-3.0%
-1.0%
1.0%
3.0%
5.0%
7.0%
2015E Return on Average Tangible Equity Less Cost of Equity
|
 Summary
XXXXXXXXXXXXXXXXXXXXXXX |
 24
Summary
Sustainable Competitive Advantage
Premium brand built over 170 years
High quality Northeast footprint characterized by wealth, density and
commercial activity
Strong leadership team
Solid net interest margin
Superior asset quality
Focus on relationship-based banking
Growing
loans
and
deposits
within
footprint
–
in
two
of
the
largest
MSAs
in
the country (New York City, #1 and Boston, #10)
Improving profitability
Returning capital to shareholders
Strong capital base |
 Appendix
XXXXXXXXXXXXXXXXXXXXXX
X |
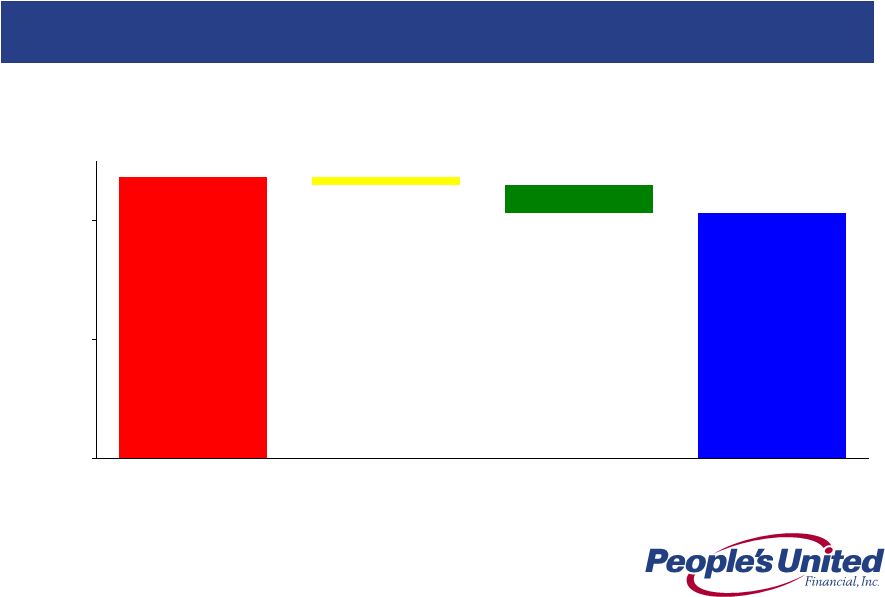
 26
Net Interest Income (Fully Taxable Equivalent)
Linked Quarter Change
(in $ millions)
231.8
232.8
(1.6)
(1.0)
1.8
0.1
1.7
1Q 2014
Acquired
Loans
Investments
Originated
Loans
Calendar
Day
Borrowings
2Q 2014 |
 27
Net Interest Margin (%)
Linked Quarter Change
3.17%
3.13%
(0.07%)
(0.01%)
0.03%
0.01%
1Q 2014
New Loan
Volume
Investments
Calendar
Day
Loan
Mix
2Q 2014 |
 28
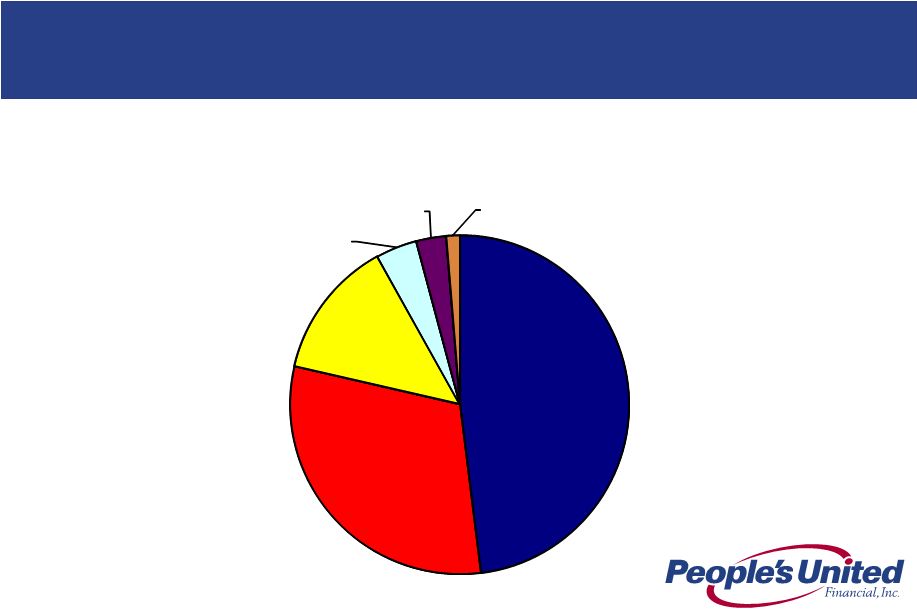
Agency MBS and Agency CMOs comprised of 10 year and 15 year collateral
constitute ~80% of the portfolio. $600MM municipal bond portfolio has an
underlying weighted average credit rating above AA
Securities Portfolio Detail
2Q14 Total Securities Portfolio
$4.6 BN
($ in billions)
Note:
Duration of the securities portfolio is ~4 years
Securities portfolio does not contain CLOs, CDOs, trust preferred, or
private-label mortgage-backed securities Held to maturity (HTM)
securities reported on an amortized cost basis (book value). Available for sale (AFS) securities
reported at fair value
Agency CMO's, $2.2,
48%
Agency MBS, $1.4, 31%
Municipal
-
HTM, $0.6,
13%
FHLB Stock, $0.2, 4%
Bonds, Notes and
Debentures
-
AFS, $0.1,
3%
Corporate
-
HTM, $0.1,
1% |
 29
Loans
Linked Quarter Change
(in $ millions)
13.4%
24,629
881
78
(133)
25,455
March 31, 2014
Commercial
Retail
Acquired
June 30, 2014
Annualized linked quarter change |
 30
Commercial
$9.5
37%
CRE
$9.2
36%
Residential
Mortgage
$4.6
18%
Consumer
$2.2
9%
Loans by Business Line
Note:
Commercial represents Commercial & Industrial and Equipment Finance
2Q14 Total Loan Portfolio
$25.5 BN |
 31
Loans by Geography
Excluding equipment
finance loans, ~95%
of our 2Q14 loan
portfolio is within the
Northeast
2Q14 Total Loan Portfolio
$25.5 BN
Connecticut
$7.0
28%
New York
$4.7
18%
Massachusetts
$4.4
17%
Vermont
$1.8
7%
New Hampshire
$1.4
5%
Maine
$1.0
4%
New Jersey
$0.9
3%
Other
$4.3
18% |
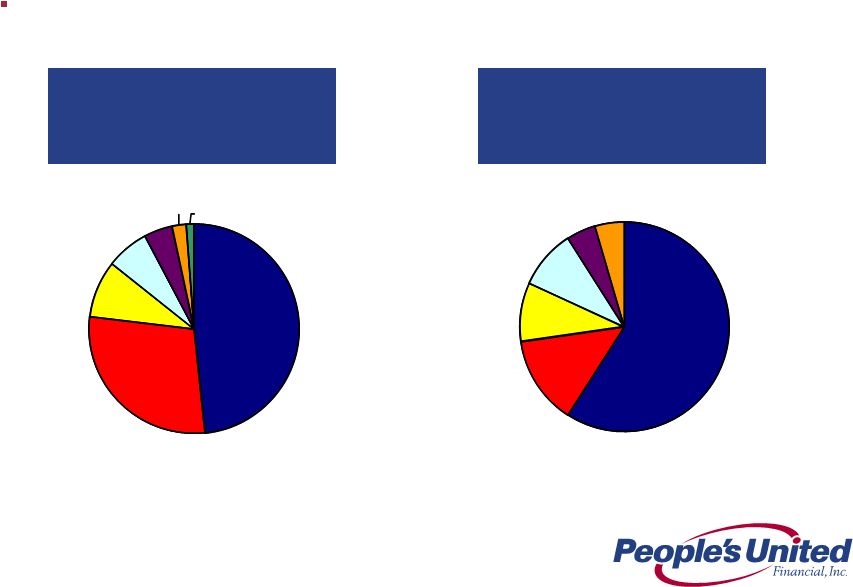
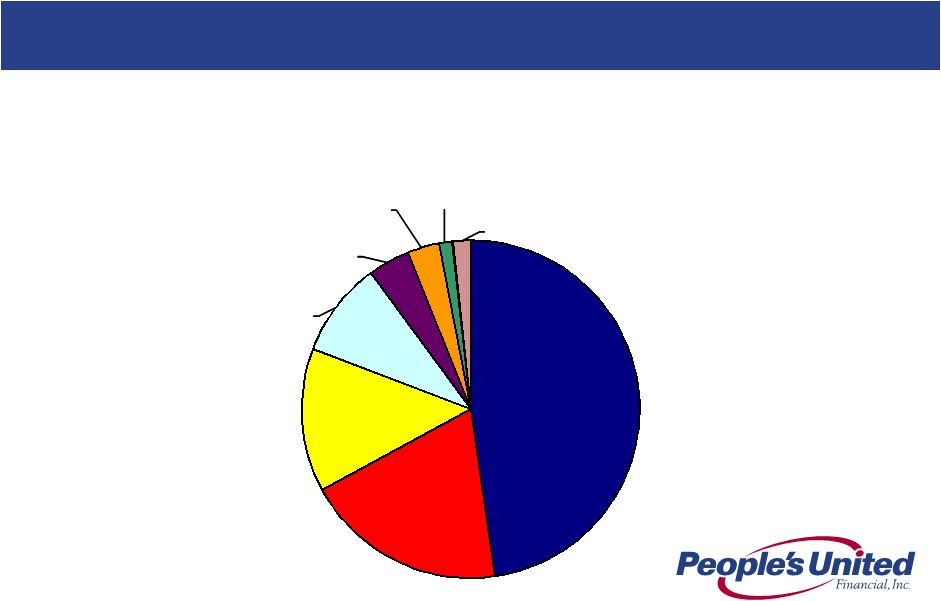
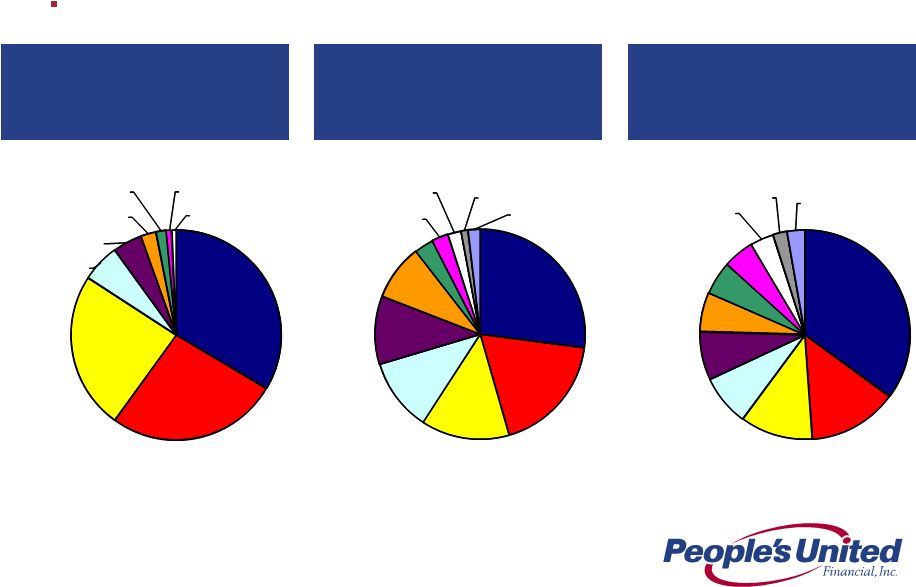 32
Commercial Real Estate,
$9.2BN, 36% of Total
Equipment Financing,
$2.7BN, 10% of Total
Commercial & Industrial,
$6.8BN, 27% of Total
($ in billions)
($ in billions)
($ in billions)
Commercial Loan Portfolio Detail
2Q 2014
73% of total loan portfolio
Residential, $3.1, 33%
Retail, $2.4, 26%
Office Buildings,
$2.2, 24%
Industrial/Manufact.,
$0.5, 6%
Hosp. &
Entertainment, $0.4,
5%
Mixed/Special
Use, $0.2, 2%
Self Storage, $0.2, 2%
Land, $0.1, 1%
Other Properties, $0.1,
1%
Finance, Ins. & RE,
$1.8, 27%
Service, $1.3, 18%
Manufacturing,
$0.9, 14%
Health, $0.8,
11%
Wholesale Dist.,
$0.7, 10%
Retail
Sales,
$0.6, 9%
Construction, $0.2, 3%
Transp/Utility, $0.2,
3%
Arts/Ent./Recr., $0.1,
2%
Public Admin, $0.1,
1%
Other, $0.1, 2%
Transp/Utility, $0.9,
34%
Construction,
$0.4, 14%
Finance, Ins. & RE,
$0.3, 11%
Printing,
$0.2, 8%
Waste, $0.2, 7%
Manufacturing, $0.2,
6%
Packaging, $0.1 5%
Wholesale Dist., $0.1,
5%
Mining, Oil & Gas,
$0.1, 4%
Service, $0.1, 2%
Other, $0.1, 4% |
 33
Residential Mortgage,
$4.6BN, 18% of Total
2Q 2014 originated weighted average LTV of 71%
2Q 2014 originated weighted average FICO score of 756
Hybrid ARMs represent ~90% of the portfolio
($ in billions)
Retail Loan Portfolio Detail
2Q 2014
Consumer,
$2.2BN, 9% of Total
2Q 2014 originated weighted average CLTV of 58%
2Q 2014 originated weighted average FICO score of 769
~60% of originations during last 3 years are in a first lien position
($ in billions)
27% of total loan portfolio
CT, $2.2, 49%
MA, $1.3, 27%
NY, $0.4, 9%
VT,
$0.3,
7%
NH, $0.2, 4%
ME, $0.1, 3%
Other, $0.1, 1%
CT, $1.3, 60%
VT, $0.3, 11%
NY, $0.2, 9%
MA, $0.2,
8%
NH, $0.1, 6%
ME, $0.1, 6% |
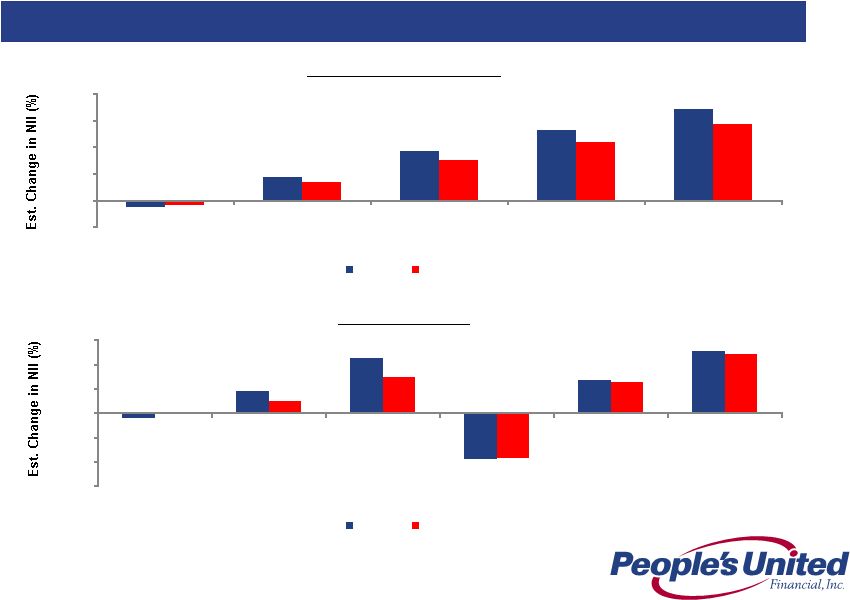 34
Net Interest Income (NII) Sensitivity
Interest Rate Risk Profile
Notes:
(1)
Yield
curve
twist
pivot
point
is
18
month
point
on
yield
curve.
Short
End
defined
as
overnight
to
18
months.
Long
End
defined
as terms greater than 18 months
(1)
-1.4%
4.3%
9.2%
13.2%
17.2%
-1.0%
3.4%
7.5%
10.9%
14.3%
-5.0%
0.0%
5.0%
10.0%
15.0%
20.0%
Dn25
Up100
Up200
Up300
Up400
Immediate Parallel Shock
6/30/14
3/31/14
-0.4%
1.8%
4.5%
-3.8%
2.7%
5.1%
-0.1%
1.0%
2.9%
-3.7%
2.5%
4.8%
-6.0%
-4.0%
-2.0%
0.0%
2.0%
4.0%
6.0%
Short End -25
Short End +100
Short End +200
Long End -100
Long End +100
Long End +200
Yield Curve Twist
6/30/14
3/31/14 |
 35
c
Acquired Loan Portfolio
Acquired loans initially recorded at fair value (inclusive of related credit mark)
without carryover of historical ALLL
Accounting model is cash-flow based:
Contractual
cash
flows
(principal
&
interest)
less
expected
cash
flows
(principal
&
interest)
=
non-accretable
difference (effectively utilized to absorb actual portfolio losses)
Expected cash flows (principal & interest) less fair value = accretable
yield Expected cash flows are regularly reassessed and compared to actual cash
collections As of 6/30/14
(in $ millions)
Carrying
Amount
a, b
Carrying Amount Component
b
NPLs
Non-Accretable
Difference/NPLs
Charge-offs
Incurred Since
Acquisition
d
Accretable
Yield
Non-Accretable
Difference
Danvers (7/1/11)
$651.5
$182.2
$10.1
$38.5
26%
$26.8
Smithtown (11/30/10)
400.5
195.8
94.6
62.0
153%
128.5
Others (various dates)
225.5
69.7
20.7
17.8
116%
33.2
Total
$1,277.5
$447.7
$125.4
$118.3
(a)
Initial carrying amounts of acquired portfolios are as follows: FinFed, $1.2BN;
Butler, $141MM; RiverBank, $518MM; Smithtown, $1.6BN; and Danvers, $1.9BN.
(b)
Carrying amount and related components reflect loan sale, settlement and payoff
activity which have occurred since acquisition. (c)
Represent contractual amounts; loans meet People’s United Financial’s
definition of a non-performing loan but are not subject to classification as non-accrual in the same manner as
originated loans. Rather, these loans are considered to be accruing loans because
their interest income relates to the accretable yield recognized at the pool level and not to
contractual interest payments at the loan level.
(d)
Includes approximately $9.5MM of charge-offs applied against reserves
established subsequent to acquisition. |
 36
Acquired Loan Portfolio
Amortization of Original Discount on Acquired Loan Portfolio
Notes:
1.
Excluding FinFed, the weighted average coupon on the acquired loan portfolio is
4.33% 2.
Adjusted to include the discount on acquired loans (the difference between the
outstanding balance of the acquired loan portfolio and the carrying amount
of the acquired loan portfolio) $ in millions, except per share data
Impact on Net Interest Margin
Impact on Earnings Per Share
2Q14 Total Accretion (All interest income on acquired loans)
22
Interest Income from Amortization of Original Discount on Acq. Loan
Portfolio 6.4
2Q14 Average Acquired Loan Portfolio
1,355
2Q14 Effective Tax Rate
35.0%
Effective Yield on Acquired Loan Portfolio
6.40%
2Q14 Earnings from Amortiz. of Original Discount on Acq. Loan Portfolio
4.2
Weighted Average Coupon on Acquired Loan Portfolio
1
4.51%
2Q14 Weighted Average Shares Outstanding
298.2
Incremental Yield Attributable to Amortiz. of Discount on Acq. Loan Portfolio
1.89%
2Q14 EPS Impact from Amortiz. of Discount on Acq. Loan Portfolio
$0.01
Incremental Interest Income from Amortiz. of Discount on Acq. Loan Portfolio
6.4
2Q14 Average Earning Assets
29,736
Add: Average unamortized loan discount
2
152
Adjusted 2Q14 Average Earning Assets 2
29,888
Impact on Overall Net Interest Margin (bps)
9
Operating Net Interest Margin
3.13%
Adjusted Net Interest Margin
3.04%
Amortization of Original Discount on Acquired Loan Portfolio
Amortization of Original Discount on Acquired Loan Portfolio
|
 37
Summary of Acquired Loan Accounting Events
(in $ millions)
Period
Cost Recovery Income
Gain (Loss) on Sale of
Acquired Loans
Acquired Loan Impairment
Net Impact
2011
Q1
0.0
5.5
0.0
5.5
Q2
0.0
7.2
0.0
7.2
Q3
0.0
(4.8)
0.0
(4.8)
Q4
5.0
(0.4)
(7.4)
(2.8)
2012
Q1
0.0
0.0
(0.3)
(0.3)
Q2
4.7
0.7
0.2
5.6
Q3
4.1
0.0
(5.7)
(1.6)
Q4
0.0
0.3
0.0
0.3
2013
Q1
0.0
0.0
(2.6)
(2.6)
Q2
0.0
5.8
0.9
6.7
Q3
3.0
0.0
(2.6)
0.4
Q4
0.2
(0.1)
0.1
0.2
2014
Q1
0.0
0.0
(1.5)
(1.5)
Q2
0.1
(0.4)
(0.8)
(1.1)
Total
$17.1
$13.8
($19.7)
$11.2
Since 2010, we have acquired $5.4BN of loans, approximately 24% of which remain in our
portfolio. We did not recognize cost recovery income, gains (losses) on
sale or impairment in 2010. Since 1Q 2011, the net impact of such
activity is +$11.2MM |
 38
Balance Sheet Funding Detail
2Q14 Balance Sheet Funding
$33.9 BN
($ in billions)
82% funded by organic deposits, customer repurchase agreements and
common equity
Retail Deposits, $16.2,
48%
Commercial Deposits,
$6.6, 19%
Stockholders' Equity,
$4.6, 14%
Fed Funds & FHLB
Borrowings, $3.1, 9%
Brokered Deposits, $1.3,
4%
Subordinated
Borrowings & Sr Notes,
$1.0, 3%
Customer Repurchase
Agreements, $0.4, 1%
Other Liabilities, $0.7,
2% |
 39
Deposits
Linked Quarter Change
(in $ millions)
Notes:
(1)
Commercial includes municipal deposits of $1,330MM at 03/2014 and $1,150MM at
06/2014 (2)
Retail includes brokered deposits of $663MM at 03/2014 and $1,328MM at
06/2014 Annualized
linked
quarter
change
Total
24,089
Commercial
(1)
Retail
(2)
7.2%
23,666
17,029
17,526
6,637
6,563
(74)
497
March 31, 2014
Retail
Commercial
June 30, 2014 |
 40
Non-Interest Income
Linked Quarter Change
(in $ millions)
Note:
(1)
Non-operating income represents the gain on the merchant services joint
venture, net of related expenses Total
Non-Operating
Operating
79.9
100.1
79.9
20.6
2.3
0.8
0.8
(1.4)
(1.4)
(0.9)
(0.8)
0.2
79.5
-
20.6
1Q 2014
Non-
Operating
Bank
Service
Charges
Investment
Mgmt.
Fees
Customer
Int. Rate
Swap
Income
Operating
Leases
Commercial
Banking
Lending
Fees
Insurance
Gain on
Resi. Mtg
Loan
Sales
Other
2Q 2014
(1) |
 41
Non-Interest Income by Category
(in $ millions)
Note:
(1)
Excludes $20.6MM gain on formation of the merchant services joint venture, net of
related expenses 2Q14 Non-Interest Income
(1)
$79.5MM
Bank Service
Charges
$32.8
41%
Investment
Management Fees
$10.6
13%
Operating Lease
Income
$9.9
12%
Commercial
Banking Lending
Fees
$7.4
9%
Insurance
Revenue
$6.8
9%
Brokerage
Commissions
$3.6
5%
Customer Interest
Rate Swap
Income, Net
$2.2
3%
Other
$6.2
8% |
   42
Total
Non-Operating
Operating
Non-Interest Expense
Linked Quarter Change
(in $ millions)
Note:
(1)
Non-operating expense change primarily reflects the 1Q 2014 write-down on
certain branch assets 216.7
208.3
211.5
(3.6)
(2.4)
(1.8)
(1.4)
0.8
206.7
5.2
1.6
1Q 2014
Non-
Operating
Operating
Leases
Comp. &
Benefits
Occ. &
Equip.
Other
2Q 2014
(1) |
 43
Non-Interest Expense by Category
(in $ millions)
2Q14 Non-Interest Expense
Total: $208.3MM; Operating: $206.7MM
Comp. & Benefits
$109.3
53%
Occupancy &
Equipment
$36.6
18%
Professional &
Outside Services
$14.9
7%
Regulatory
Assessments
$9.0
4%
Operating Lease
Expense
$8.7
4%
Amort. Of Acq.-
related Intangible
Assets
$6.2
3%
Other
$23.6
11% |
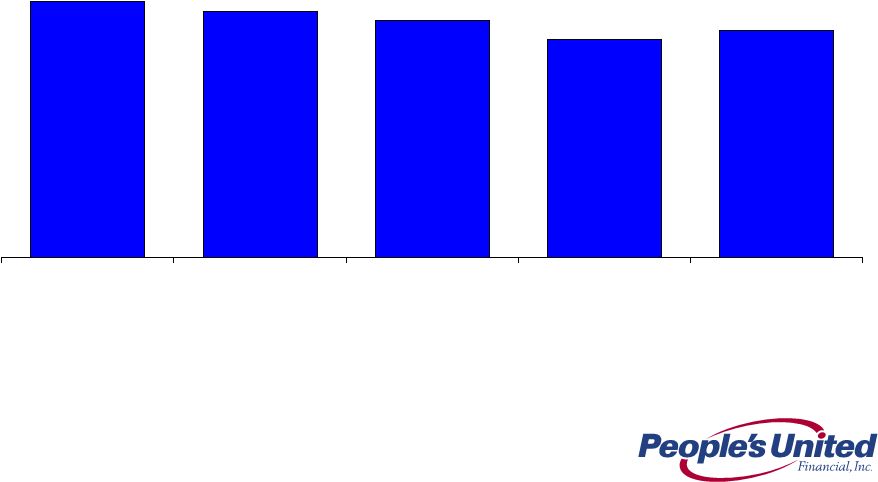
 44
Efficiency Ratio (%)
Last Five Quarters
61.4%
62.2%
62.8%
63.9%
61.8%
2Q 2013
3Q 2013
4Q 2013
1Q 2014
2Q 2014 |
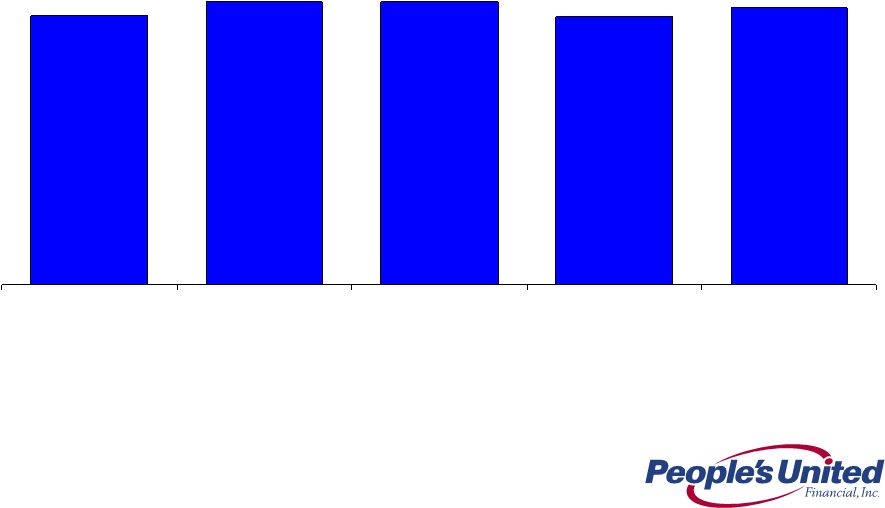
 45
Operating ROAA (%)
Last Five Quarters
0.81%
0.78%
0.75%
0.69%
0.72%
2Q 2013
3Q 2013
4Q 2013
1Q 2014
2Q 2014 |
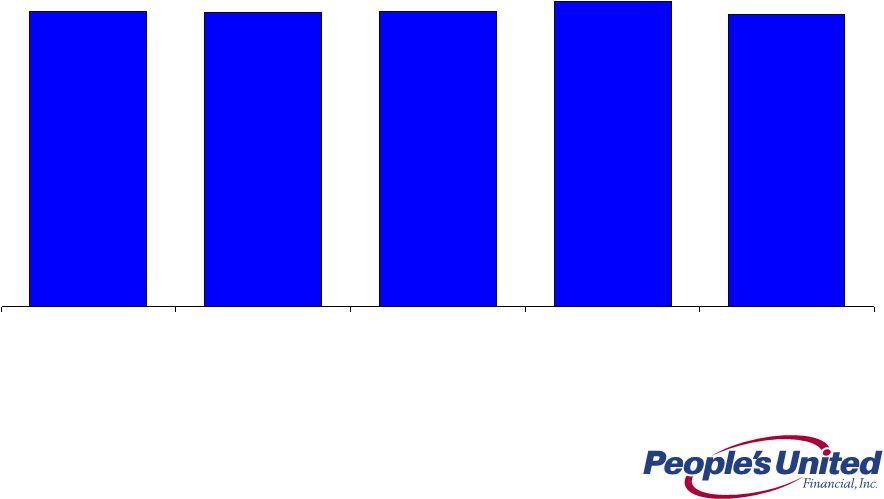
 46
Operating ROATE (%)
Last Five Quarters
9.3%
9.8%
9.8%
9.3%
9.6%
2Q 2013
3Q 2013
4Q 2013
1Q 2014
2Q 2014 |
 47
Operating Dividend Payout Ratio (%)
Last Five Quarters
83%
83%
83%
86%
82%
2Q 2013
3Q 2013
4Q 2013
1Q 2014
2Q 2014 |
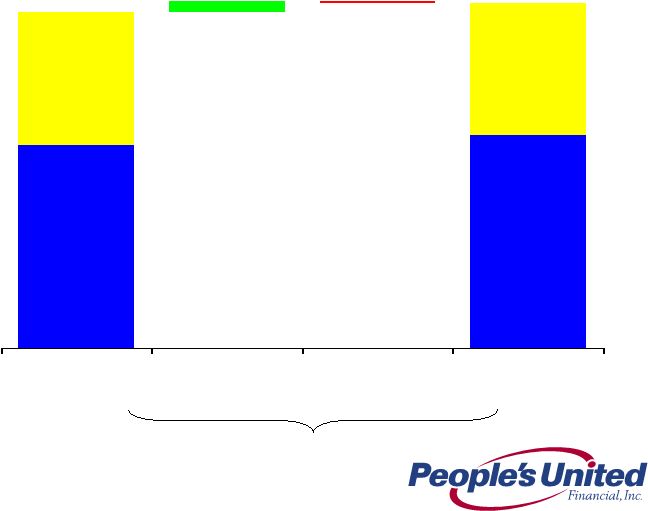
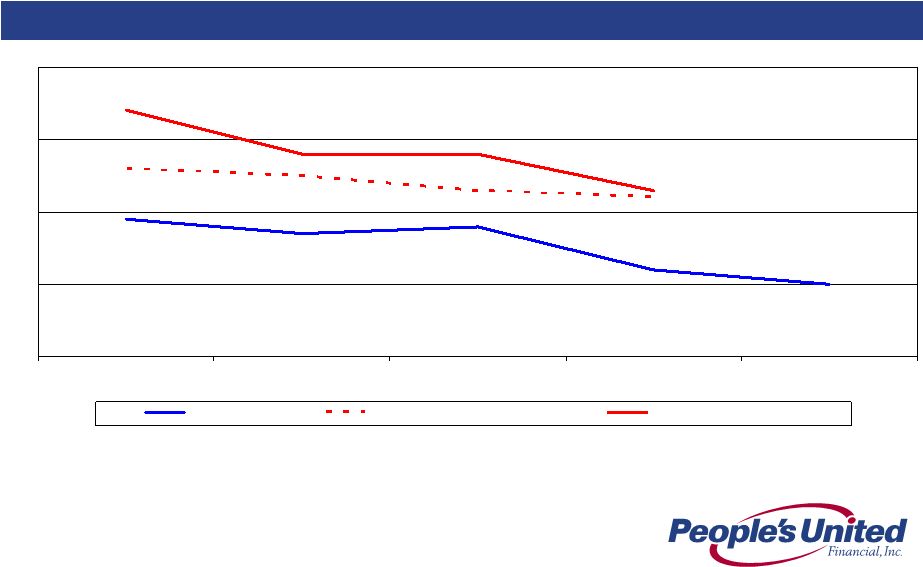
 48
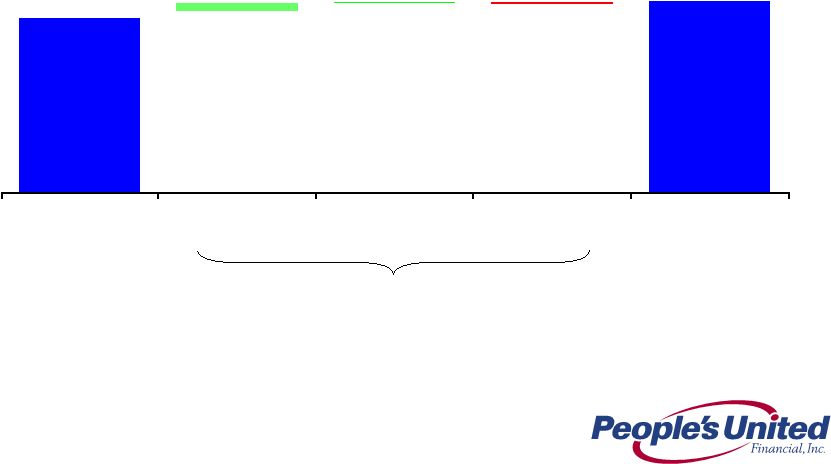
Substantial Progress Over the Last Five Years
Growing Loans, Deposits and Returning Capital to Shareholders
Growth has outpaced peers on the key metrics of loans per share and
deposits per share
This has occurred while we have returned $2.2BN to shareholders
during this period. Returns of capital were in the form of both
dividends ($1.1BN) and share repurchases ($1.1BN) which represents
approximately 50% of our current market capitalization
Line Item
PBCT
Peer
Median
PBCT Vs.
Peers
5-Year Loans Per Share CAGR
15.5%
0.1%
+15.4%
5-Year Deposits Per Share CAGR
13.3%
1.1%
+12.2%
Notes:
5-Year CAGR figures based on 2Q 2009 to 2Q 2014 data
|
 49
Attractive Risk Profile
Ability to maintain strong credit quality
Conservative credit culture marked by absence of credit “events”
Median net charge-offs / average loans since 2007 have been 19 bps
Well-diversified commercial and retail banking portfolios
Low operating risk profile
Consistently profitable throughout the credit cycle
Straightforward portfolio of products –
no complex financial exposures
Credit ratings of Baa1 / BBB+ / A-
/ A (low) as rated by Moody’s, S&P, Fitch and DBRS, respectively
Robust liquidity
Strong deposit market share in most core markets
Unused FHLB of Boston borrowing capacity of $4.5BN at 2Q 2014
2Q 2014 net loan-to-deposit ratio of 104.9% |
 50
Commercial Credit Culture and Approval Process
Well-defined credit culture and underwriting standards
Cash flow –
deal specific and global
Collateral / limited unsecured exposure with equity investment requirements and
guarantees No speculative real estate projects
Credit
structure
includes
meaningful
covenants,
appropriate
LTVs
and
monitored
advance
rates
Industry knowledge and expertise (i.e. basic industries and property types)
Seasoned relationship managers with considerable local market knowledge
Experienced senior credit officers (SCO) average 25+ years of commercial banking
experience Approval authority
Local, regional and corporate credit committee structure
>$25MM also requires Executive Risk Oversight Committee (EROC) approval
Due diligence begins prior to the issuance of a proposal (market
manager & SCO) and
independent credit associates in Risk Management are utilized
Credit analyst / relationship manager complete detailed loan submission
Stress test cash flow for interest rate sensitivities, vacancy and rental rates
Independent field exams and appraisal review |
 51
0.96
1.44
1.63
0.50
1.00
1.50
2.00
2.50
2Q 2013
3Q 2013
4Q 2013
1Q 2014
2Q 2014
PBCT
Peer Group - Median
Top 50 Banks - Median
Last Five Quarters
Asset Quality
NPAs / Loans & REO (%)
(1)
(1)
Non-performing
assets
(excluding
acquired
non-performing
loans)
as
a
percentage
of
originated
loans
plus
all
REO
and
repossessed
assets;
acquired
non-performing
loans
excluded
as
risk
of
loss
has
been
considered
by
virtue
of
(i)
our
estimate
of
acquisition-date
fair
value,
(ii)
the
existence
of
an
FDIC
loss
sharing
agreement,
and/or
(iii)
allowance
for
loan
losses
established
subsequent
to
acquisition
Source: SNL Financial and Company filings
Notes: Top 50 Banks represents the largest 50 banks by total assets in each
respective quarter |
 52
0.10
0.22
0.23
0.00
0.10
0.20
0.30
0.40
2Q 2013
3Q 2013
4Q 2013
1Q 2014
2Q 2014
PBCT
Peer Group - Median
Top 50 Banks - Median
Asset Quality
Net Charge-Offs / Avg. Loans (%)
(1)
(1)
Excluding acquired loan charge-offs, PBCT’s charge-off ratio was
0.09%, 0.09%, 0.17%, 0.16% and 0.18% in 2Q 2014, 1Q 2014, 4Q 2013, 3Q 2013
and 2Q 2013, respectively Last Five Quarters
Source: SNL Financial and Company filings
Notes: Top 50 Banks represents the largest 50 banks by total assets in each
respective quarter |
 53
Notes:
1.
Leverage
(core)
Capital
represents
Tier
1
Capital
(total
stockholder’s
equity,
excluding:
(i)
after-tax
net
unrealized
gains
(losses)
on
certain
securities
classified
as
available
for
sale;
(ii)
goodwill
and
other
acquisition-related
intangibles;
and
(iii)
the
amount
recorded
in
accumulated
other
comprehensive
income
(loss)
relating
to
pension
and
other
postretirement benefits), divided by Adjusted Total Assets (period end total assets
less goodwill and other acquisition-related intangibles) 2.
Tier
1
Common
represents
Common
Equity
Tier
1
Capital
(calculated
in
accordancewith
the
Basel
III
Final
Rule
issued
in
July
2013)
divided
by
Total
Risk-Weighted
Assets
3.
Tier 1 Risk-Based Capital represents Tier 1 Capital divided by Total
Risk-Weighted Assets 4.
Total
Risk-Based
Capital
represents
Tier
1
Capital
plus
subordinated
notes
and
debentures,
up
to
certain
limits,
and
the
allowance
for
loan
losses,
up
to
1.25%
of
total
risk
weighted assets, divided by Total Risk-Weighted Assets
5.
Well
capitalized
limits
under
current
capital
rules
for
the
Bank
are:
Leverage
Ratio,
5%;
Tier
1
Risk-Based
Capital,
6%;
and
Total
Risk-Based
Capital,
10%
Capital Ratios
Last Five Quarters
2Q 2013
3Q 2013
4Q 2013
1Q 2014
2Q 2014
People’s United Financial
Tang. Com. Equity/Tang. Assets
8.7%
8.5%
7.9%
8.0%
7.9%
Leverage Ratio
1, 5
9.3%
9.2%
8.3%
8.4%
8.3%
Tier 1 Common ²
11.6%
11.4%
10.2%
10.1%
10.0%
Tier 1 Risk-Based Capital
3, 5
11.6%
11.4%
10.2%
10.1%
10.0%
Total Risk-Based Capital
4, 5
12.8%
12.6%
11.3%
11.2%
12.5%
People’s United Bank
Leverage Ratio
1, 5
9.5%
9.5%
9.1%
9.1%
9.0%
Tier 1 Risk-Based Capital
3, 5
11.9%
11.8%
11.1%
11.0%
10.8%
Total Risk-Based Capital
4, 5
13.2%
13.2%
12.4%
12.2%
13.5% |
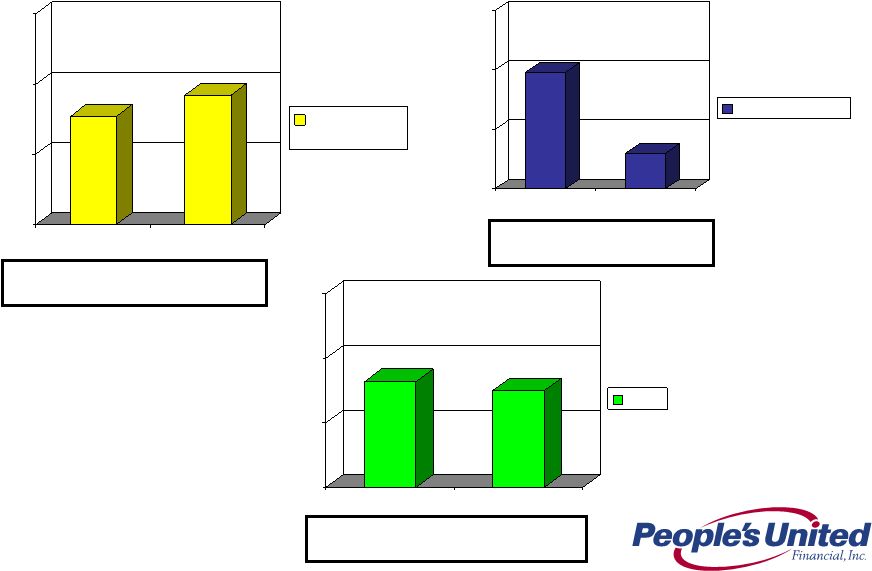 54
Allowance for Loan Losses
Originated Portfolio Coverage Detail as of June 30, 2014
(in $ millions)
0.77%
0.92%
0.00%
0.50%
1.00%
1.50%
NPLs:Loans
ALLL:Loans
Commercial
Banking
0.98%
0.30%
0.00%
0.50%
1.00%
1.50%
NPLs:Loans
ALLL:Loans
Retail Banking
Commercial ALLL -
$163.5 million
120% of Commercial NPLs
Retail ALLL -
$19.0 million
30% of Retail NPLs
Total ALLL -
$182.5 million
92% of Total NPLs
0.82%
0.75%
0.00%
0.50%
1.00%
1.50%
NPLs:Loans
ALLL:Loans
Total |
 55
Name
Position
Years in
Banking
Professional
Experience
Jack Barnes
President & CEO, Director
30+
People’s United Bank (SEVP, CAO),
Chittenden, FDIC
Kirk Walters
SEVP & CFO (People’s United
Financial, Inc.), Director
25+
People’s United Bank, Santander, Sovereign,
Chittenden, Northeast Financial
Galan Daukas
SEVP Wealth Management
25+
Washington Trust, The Managers Funds,
Harbor Capital Mgmt
Sara Longobardi
SEVP Retail Banking
20+
People’s United Bank
Dave Norton
SEVP & Chief HR Officer
3+
People’s United Bank, New York Times,
Starwood, PepsiCo
Lee Powlus
SEVP & Chief Administrative Officer
25+
People’s United Bank, Chittenden, Alltel
David Rosato
SEVP & CFO (People’s United Bank)
25+
People’s United Bank, Webster, Allfirst
Chantal Simon
SEVP & Chief Risk Officer
25+
People’s United Bank, Merrill Lynch US Bank,
Lazard Freres & Co.
Jeff Tengel
SEVP Commercial Banking
30+
People’s United Bank, PNC, National City
Bob Trautmann
SEVP & General Counsel
20+
People’s United Bank, Tyler Cooper & Alcorn
Management Committee |
 56
Solid Governance Structure
Board of Directors
People’s United
Financial, Inc.
Board of Directors
People’s United Bank
The Management
Committee
Management
Committees
Enterprise
Risk
Committee
Compensation,
Nominating &
Governance Committee
Audit
Committee
Treasury &
Finance
Committee
Regulatory
Steering
Committee
Executive Risk
Oversight Committee
Asset and Liability
Committee
Capital Management
Committee
Credit Policy
Committee
Asset
Quality
Committee
Expense Management
Oversight
Committee
Model Risk
Management
Committee
Disclosure
Committee
New Product
Approval
Committee
Senior Trust
Management
Committee
Transactions with
Affiliates Committee
HR
Administrative
Committee
CRA and Community
Development
Committee
Executive Technology
Committee
Real Estate
Committee
Marketing
Committee
Loan Review
Committee
Trust
Committee
Fraud Risk
Management
Committee |
 57
Peer Group
Firm
Ticker
City
State
1
Associated
ASBC
Green Bay
WI
2
BancorpSouth
BXS
Tupelo
MS
3
City National
CYN
Los Angeles
CA
4
Comerica
CMA
Dallas
TX
5
Commerce
CBSH
Kansas City
MO
6
Cullen/Frost
CFR
San Antonio
TX
7
East West
EWBC
Pasadena
CA
8
First Niagara
FNFG
Buffalo
NY
9
FirstMerit
FMER
Akron
OH
10
Fulton
FULT
Lancaster
PA
11
Huntington
HBAN
Columbus
OH
12
M&T
MTB
Buffalo
NY
13
New York Community
NYCB
Westbury
NY
14
Signature
SBNY
New York
NY
15
Susquehanna
SUSQ
Lititz
PA
16
Synovus
SNV
Columbus
GA
17
Valley National
VLY
Wayne
NJ
18
Webster
WBS
Waterbury
CT
19
Wintrust
WTFC
Lake Forest
IL
20
Zions
ZION
Salt Lake City
UT |
 58
In addition to evaluating People’s United Financial’s results of
operations in accordance with U.S. generally accepted accounting principles
(“GAAP”), management routinely supplements this evaluation with an analysis of certain non-
GAAP financial measures, such as the efficiency and tangible equity ratios,
tangible book value per share and operating earnings metrics. Management
believes these non-GAAP financial measures provide information useful to
investors in understanding People’s United Financial’s underlying
operating performance and trends, and facilitates comparisons with the
performance of other banks and thrifts. Further, the efficiency ratio and operating earnings
metrics are used by management in its assessment of financial performance,
including non-interest expense control, while the tangible equity ratio
and tangible book value per share are used to analyze the relative strength of People’s
United Financial’s capital position.
The efficiency ratio, which represents an approximate measure of
the cost required by People’s United Financial to
generate a dollar of revenue, is the ratio of (i)
total non-interest expense (excluding goodwill impairment charges,
amortization of other acquisition-related intangible assets, losses on real
estate assets and non-recurring expenses) (the numerator) to (ii)
net interest income on a fully taxable equivalent ("FTE") basis plus total
non-interest income (including the FTE adjustment on bank-owned life
insurance ("BOLI") income, and excluding gains and losses on sales
of assets other than residential mortgage loans and acquired loans, and non-recurring income) (the
denominator). In addition, operating lease expense is excluded from total
non-interest expense and netted against operating lease income within
non-interest income to conform with the reporting approach applied to our other fee-
based businesses that are already presented on a net basis. People’s United
Financial generally considers an item of income or expense to be
non-recurring if it is not similar to an item of income or expense of a type incurred within the
last two years and is not similar to an item of income or expense of a type
reasonably expected to be incurred within the following two years.
Non-GAAP Financial Measures and Reconciliation to GAAP
|
 59
Operating earnings exclude from net income those items that management considers to
be of such a non-recurring or infrequent nature that, by excluding such
items (net of income taxes), People’s United Financial’s results can be
measured and assessed on a more consistent basis from period to period. Items
excluded from operating earnings, which include, but are not limited to,
non-recurring gains/losses, merger-related expenses (including acquisition
integration and other costs), charges related to executive-level management
separation costs, severance-related costs and writedowns of banking
house assets, are generally also excluded when calculating the efficiency
ratio. Operating earnings per share is derived by determining the per share
impact of the respective adjustments to arrive at operating earnings and
adding (subtracting) such amounts to (from) GAAP earnings per share. Operating return on
average assets is calculated by dividing operating earnings (annualized) by average
assets. Operating return on average tangible stockholders' equity is
calculated by dividing operating earnings (annualized) by average tangible
stockholders' equity. The operating dividend payout ratio is calculated by dividing
dividends paid by operating earnings for the respective period.
The tangible equity ratio is the ratio of (i)
tangible stockholders’
equity (total stockholders’
equity less goodwill and
other acquisition-related intangible assets) (the numerator) to (ii)
tangible assets (total assets less goodwill and other
acquisition-related intangible assets) (the denominator). Tangible book value
per share is calculated by dividing tangible stockholders’
equity by common shares (total common shares issued, less common shares classified
as treasury shares and unallocated Employee Stock Ownership Plan
("ESOP") common shares). In light of diversity in presentation among
financial institutions, the methodologies used by People’s United Financial
for determining the non-GAAP financial measures discussed above may differ from
those used by other financial institutions. Please refer to People’s
United Financial’s latest Form 10-Q regulatory filing for detailed reconciliations to
GAAP figures.
Non-GAAP Financial Measures and Reconciliation to GAAP
|
 For
more information, investors may contact: Peter Goulding, CFA
203-338-6799
peter.goulding@peoples.com
XXXXXX
XXXXXX
X |