Attached files
| file | filename |
|---|---|
| 8-K - 8-K - American Residential Properties, Inc. | augustpresentation2014_8k.htm |
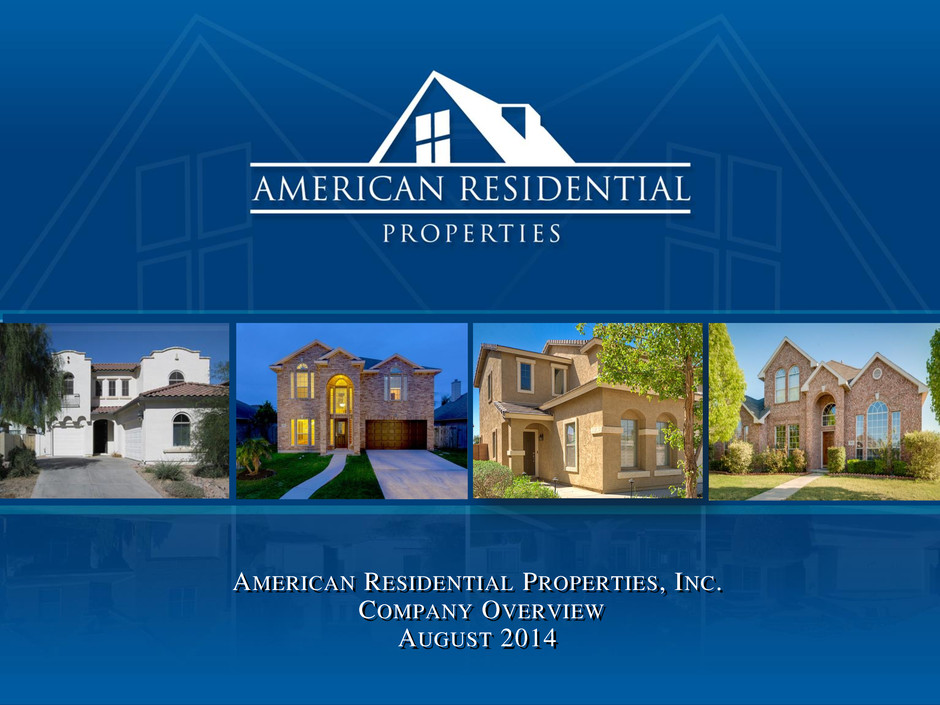
AMERICAN RESIDENTIAL PROPERTIES, INC. COMPANY OVERVIEW AUGUST 2014
EPS\Management Presentation\American Residential Properties - 602505097 EXECUTIVE SUMMARY 2
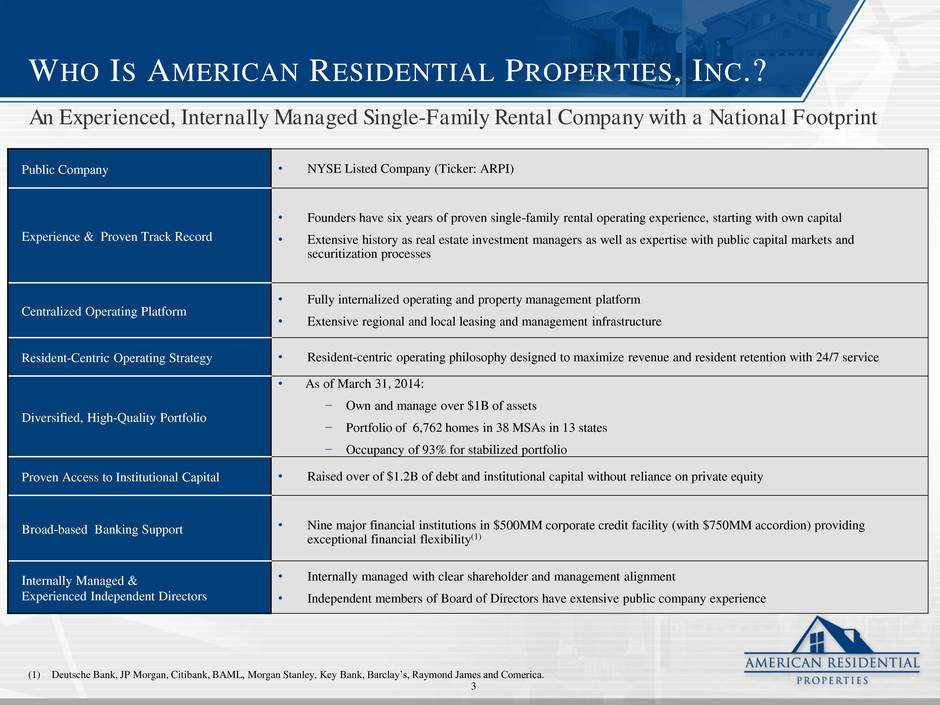
EPS\Management Presentation\American Residential Properties - 602505097 WHO IS AMERICAN RESIDENTIAL PROPERTIES, INC.? An Experienced, Internally Managed Single-Family Rental Company with a National Footprint (1) Deutsche Bank, JP Morgan, Citibank, BAML, Morgan Stanley, Key Bank, Barclay’s, Raymond James and Comerica. Public Company • NYSE Listed Company (Ticker: ARPI) Experience & Proven Track Record • Founders have six years of proven single-family rental operating experience, starting with own capital • Extensive history as real estate investment managers as well as expertise with public capital markets and securitization processes Centralized Operating Platform • Fully internalized operating and property management platform • Extensive regional and local leasing and management infrastructure Resident-Centric Operating Strategy • Resident-centric operating philosophy designed to maximize revenue and resident retention with 24/7 service Diversified, High-Quality Portfolio • As of March 31, 2014: − Own and manage over $1B of assets − Portfolio of 6,762 homes in 38 MSAs in 13 states − Occupancy of 93% for stabilized portfolio Proven Access to Institutional Capital • Raised over of $1.2B of debt and institutional capital without reliance on private equity Broad-based Banking Support • Nine major financial institutions in $500MM corporate credit facility (with $750MM accordion) providing exceptional financial flexibility(1) Internally Managed & Experienced Independent Directors • Internally managed with clear shareholder and management alignment • Independent members of Board of Directors have extensive public company experience 3
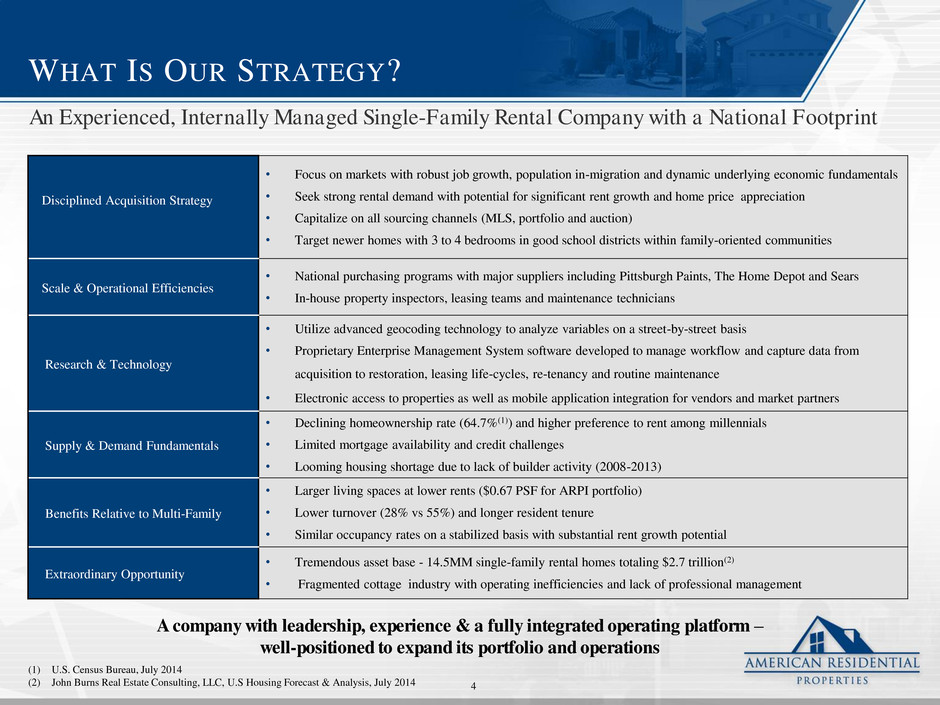
EPS\Management Presentation\American Residential Properties - 602505097 WHAT IS OUR STRATEGY? An Experienced, Internally Managed Single-Family Rental Company with a National Footprint A company with leadership, experience & a fully integrated operating platform – well-positioned to expand its portfolio and operations Disciplined Acquisition Strategy • Focus on markets with robust job growth, population in-migration and dynamic underlying economic fundamentals • Seek strong rental demand with potential for significant rent growth and home price appreciation • Capitalize on all sourcing channels (MLS, portfolio and auction) • Target newer homes with 3 to 4 bedrooms in good school districts within family-oriented communities Scale & Operational Efficiencies • National purchasing programs with major suppliers including Pittsburgh Paints, The Home Depot and Sears • In-house property inspectors, leasing teams and maintenance technicians Research & Technology • Utilize advanced geocoding technology to analyze variables on a street-by-street basis • Proprietary Enterprise Management System software developed to manage workflow and capture data from acquisition to restoration, leasing life-cycles, re-tenancy and routine maintenance • Electronic access to properties as well as mobile application integration for vendors and market partners Supply & Demand Fundamentals • Declining homeownership rate (64.7%(1)) and higher preference to rent among millennials • Limited mortgage availability and credit challenges • Looming housing shortage due to lack of builder activity (2008-2013) Benefits Relative to Multi-Family • Larger living spaces at lower rents ($0.67 PSF for ARPI portfolio) • Lower turnover (28% vs 55%) and longer resident tenure • Similar occupancy rates on a stabilized basis with substantial rent growth potential Extraordinary Opportunity • Tremendous asset base - 14.5MM single-family rental homes totaling $2.7 trillion(2) • Fragmented cottage industry with operating inefficiencies and lack of professional management (1) U.S. Census Bureau, July 2014 (2) John Burns Real Estate Consulting, LLC, U.S Housing Forecast & Analysis, July 2014 4
EPS\Management Presentation\American Residential Properties - 602505097 AN EXPERIENCED OPERATING COMPANY 5
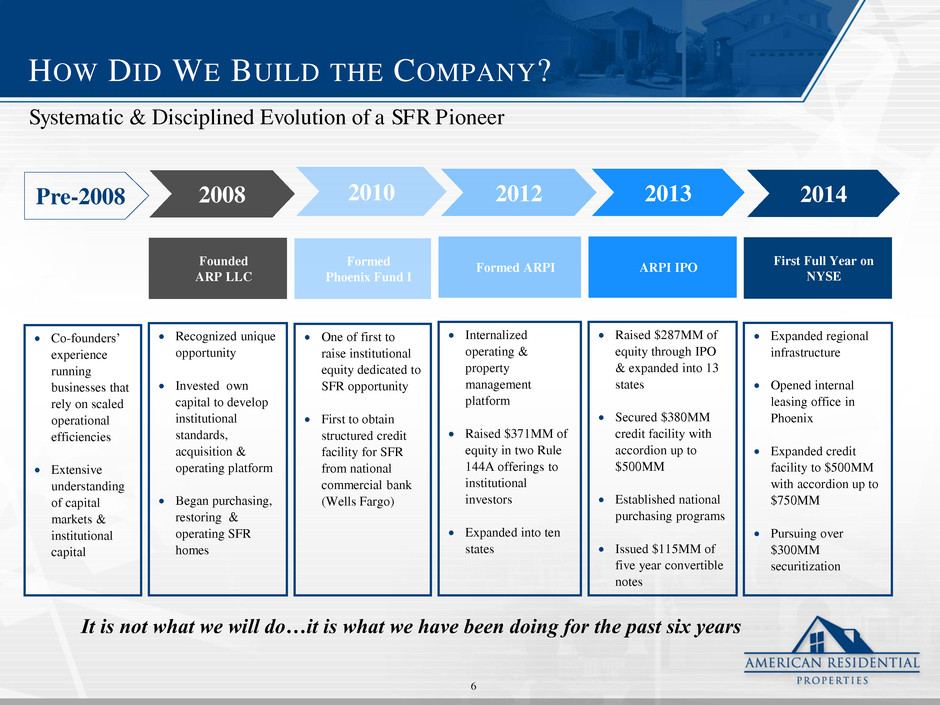
EPS\Management Presentation\American Residential Properties - 602505097 HOW DID WE BUILD THE COMPANY? One of first to raise institutional equity dedicated to SFR opportunity First to obtain structured credit facility for SFR from national commercial bank (Wells Fargo) Internalized operating & property management platform Raised $371MM of equity in two Rule 144A offerings to institutional investors Expanded into ten states Raised $287MM of equity through IPO & expanded into 13 states Secured $380MM credit facility with accordion up to $500MM Established national purchasing programs Issued $115MM of five year convertible notes Co-founders’ experience running businesses that rely on scaled operational efficiencies Extensive understanding of capital markets & institutional capital Systematic & Disciplined Evolution of a SFR Pioneer 2010 2013 2012 Pre-2008 It is not what we will do…it is what we have been doing for the past six years Formed Phoenix Fund I Formed ARPI ARPI IPO Recognized unique opportunity Invested own capital to develop institutional standards, acquisition & operating platform Began purchasing, restoring & operating SFR homes 2008 Founded ARP LLC Expanded regional infrastructure Opened internal leasing office in Phoenix Expanded credit facility to $500MM with accordion up to $750MM Pursuing over $300MM securitization 2014 First Full Year on NYSE 6
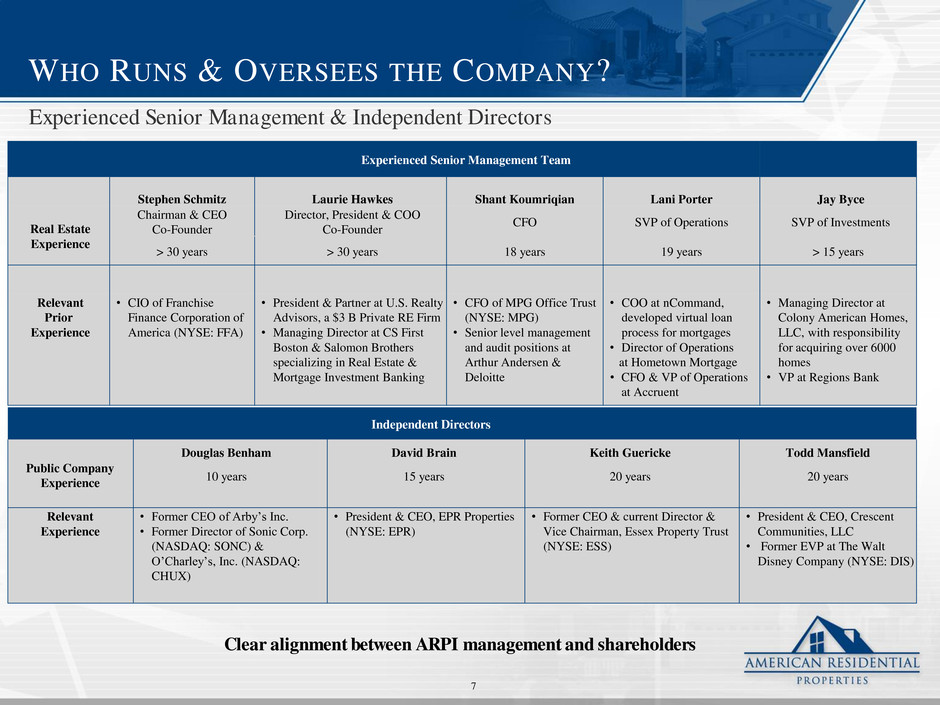
EPS\Management Presentation\American Residential Properties - 602505097 WHO RUNS & OVERSEES THE COMPANY? Experienced Senior Management & Independent Directors Experienced Senior Management Team Stephen Schmitz Laurie Hawkes Shant Koumriqian Lani Porter Jay Byce Real Estate Experience Chairman & CEO Co-Founder Director, President & COO Co-Founder CFO SVP of Operations SVP of Investments > 30 years > 30 years 18 years 19 years > 15 years Relevant Prior Experience • CIO of Franchise Finance Corporation of America (NYSE: FFA) • President & Partner at U.S. Realty Advisors, a $3 B Private RE Firm • Managing Director at CS First Boston & Salomon Brothers specializing in Real Estate & Mortgage Investment Banking • CFO of MPG Office Trust (NYSE: MPG) • Senior level management and audit positions at Arthur Andersen & Deloitte • COO at nCommand, developed virtual loan process for mortgages • Director of Operations at Hometown Mortgage • CFO & VP of Operations at Accruent • Managing Director at Colony American Homes, LLC, with responsibility for acquiring over 6000 homes • VP at Regions Bank Independent Directors Douglas Benham David Brain Keith Guericke Todd Mansfield Public Company Experience 10 years 15 years 20 years 20 years Relevant Experience • Former CEO of Arby’s Inc. • Former Director of Sonic Corp. (NASDAQ: SONC) & O’Charley’s, Inc. (NASDAQ: CHUX) • President & CEO, EPR Properties (NYSE: EPR) • Former CEO & current Director & Vice Chairman, Essex Property Trust (NYSE: ESS) • President & CEO, Crescent Communities, LLC • Former EVP at The Walt Disney Company (NYSE: DIS) 7 Clear alignment between ARPI management and shareholders
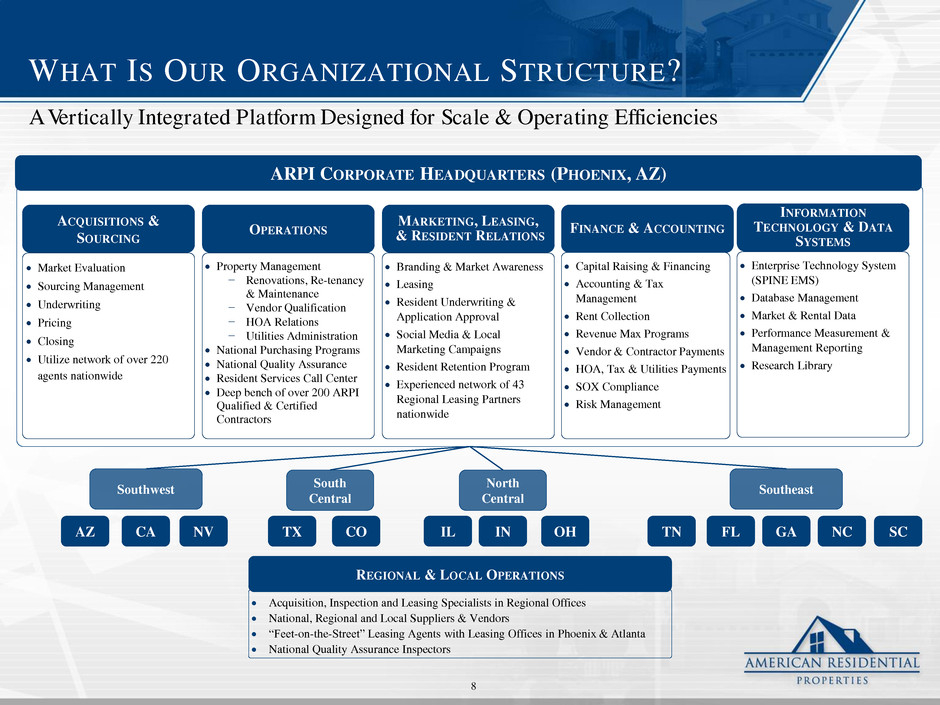
EPS\Management Presentation\American Residential Properties - 602505097 WHAT IS OUR ORGANIZATIONAL STRUCTURE? Market Evaluation Sourcing Management Underwriting Pricing Closing Utilize network of over 220 agents nationwide ACQUISITIONS & SOURCING Property Management − Renovations, Re-tenancy & Maintenance − Vendor Qualification − HOA Relations − Utilities Administration National Purchasing Programs National Quality Assurance Resident Services Call Center Deep bench of over 200 ARPI Qualified & Certified Contractors OPERATIONS Branding & Market Awareness Leasing Resident Underwriting & Application Approval Social Media & Local Marketing Campaigns Resident Retention Program Experienced network of 43 Regional Leasing Partners nationwide MARKETING, LEASING, & RESIDENT RELATIONS Capital Raising & Financing Accounting & Tax Management Rent Collection Revenue Max Programs Vendor & Contractor Payments HOA, Tax & Utilities Payments SOX Compliance Risk Management FINANCE & ACCOUNTING CA AZ NV TX IL IN FL GA NC Acquisition, Inspection and Leasing Specialists in Regional Offices National, Regional and Local Suppliers & Vendors “Feet-on-the-Street” Leasing Agents with Leasing Offices in Phoenix & Atlanta National Quality Assurance Inspectors REGIONAL & LOCAL OPERATIONS North Central Southeast ARPI CORPORATE HEADQUARTERS (PHOENIX, AZ) South Central A Vertically Integrated Platform Designed for Scale & Operating Efficiencies SC Southwest CO TN OH 8 Enterprise Technology System (SPINE EMS) Database Management Market & Rental Data Performance Measurement & Management Reporting Research Library INFORMATION TECHNOLOGY & DATA SYSTEMS
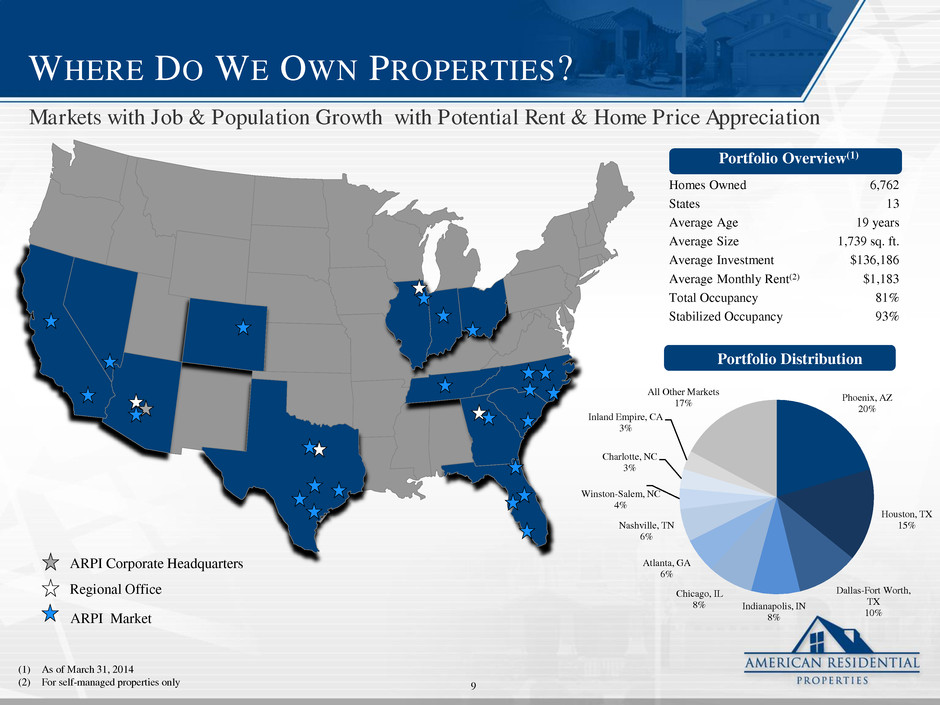
EPS\Management Presentation\American Residential Properties - 602505097 WHERE DO WE OWN PROPERTIES? Homes Owned 6,762 States 13 Average Age 19 years Average Size 1,739 sq. ft. Average Investment $136,186 Average Monthly Rent(2) $1,183 Total Occupancy 81% Stabilized Occupancy 93% Markets with Job & Population Growth with Potential Rent & Home Price Appreciation Portfolio Overview(1) ARPI Corporate Headquarters Regional Office ARPI Market Phoenix, AZ 20% Houston, TX 15% Dallas-Fort Worth, TX 10% Indianapolis, IN 8% Chicago, IL 8% Atlanta, GA 6% Nashville, TN 6% Winston-Salem, NC 4% Charlotte, NC 3% Inland Empire, CA 3% All Other Markets 17% Portfolio Distribution (1) As of March 31, 2014 (2) For self-managed properties only 9
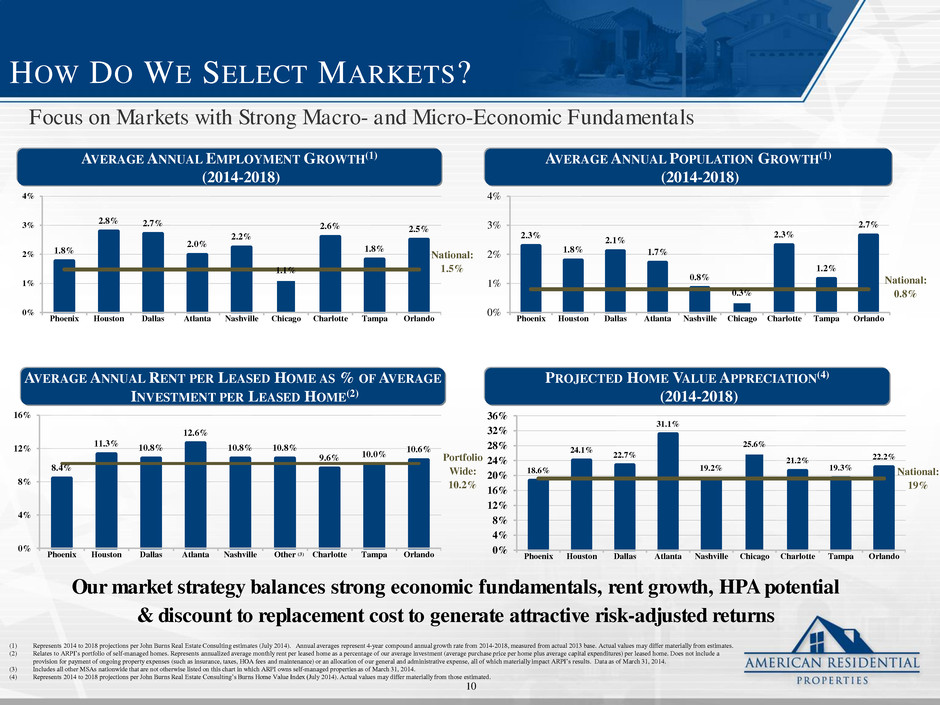
EPS\Management Presentation\American Residential Properties - 602505097 HOW DO WE SELECT MARKETS? Our market strategy balances strong economic fundamentals, rent growth, HPA potential & discount to replacement cost to generate attractive risk-adjusted returns AVERAGE ANNUAL EMPLOYMENT GROWTH(1) (2014-2018) 1.8% 2.8% 2.7% 2.0% 2.2% 1.1% 2.6% 1.8% 2.5% 0% 1% 2% 3% 4% Phoenix Houston Dallas Atlanta Nashville Chicago Charlotte Tampa Orlando National: 1.5% AVERAGE ANNUAL POPULATION GROWTH(1) (2014-2018) 2.3% 1.8% 2.1% 1.7% 0.8% 0.3% 2.3% 1.2% 2.7% 0% 1% 2% 3% 4% Phoenix Houston Dallas Atlanta Nashville Chicago Charlotte Tampa Orlando National: 0.8% AVERAGE ANNUAL RENT PER LEASED HOME AS % OF AVERAGE INVESTMENT PER LEASED HOME(2) PROJECTED HOME VALUE APPRECIATION(4) (2014-2018) 8.4% 11.3% 10.8% 12.6% 10.8% 10.8% 9.6% 10.0% 10.6% 0% 4% 8% 12% 16% Phoenix Houston Dallas Atlanta Nashville Other Charlotte Tampa Orlando Portfolio Wide: 10.2% 18.6% 24.1% 22.7% 31.1% 19.2% 25.6% 21.2% 19.3% 22.2% 0% 4% 8% 12% 16% 20% 24% 28% 32% 36% Phoenix Houston Dallas Atlanta Nashville Chicago Charlotte Tampa Orlando National: 19% (3) (1) Represents 2014 to 2018 projections per John Burns Real Estate Consulting estimates (July 2014). Annual averages represent 4-year compound annual growth rate from 2014-2018, measured from actual 2013 base. Actual values may differ materially from estimates. (2) Relates to ARPI’s portfolio of self-managed homes. Represents annualized average monthly rent per leased home as a percentage of our average investment (average purchase price per home plus average capital expenditures) per leased home. Does not include a provision for payment of ongoing property expenses (such as insurance, taxes, HOA fees and maintenance) or an allocation of our general and administrative expense, all of which materially impact ARPI’s results. Data as of March 31, 2014. (3) Includes all other MSAs nationwide that are not otherwise listed on this chart in which ARPI owns self-managed properties as of March 31, 2014. (4) Represents 2014 to 2018 projections per John Burns Real Estate Consulting’s Burns Home Value Index (July 2014). Actual values may differ materially from those estimated. Focus on Markets with Strong Macro- and Micro-Economic Fundamentals 10
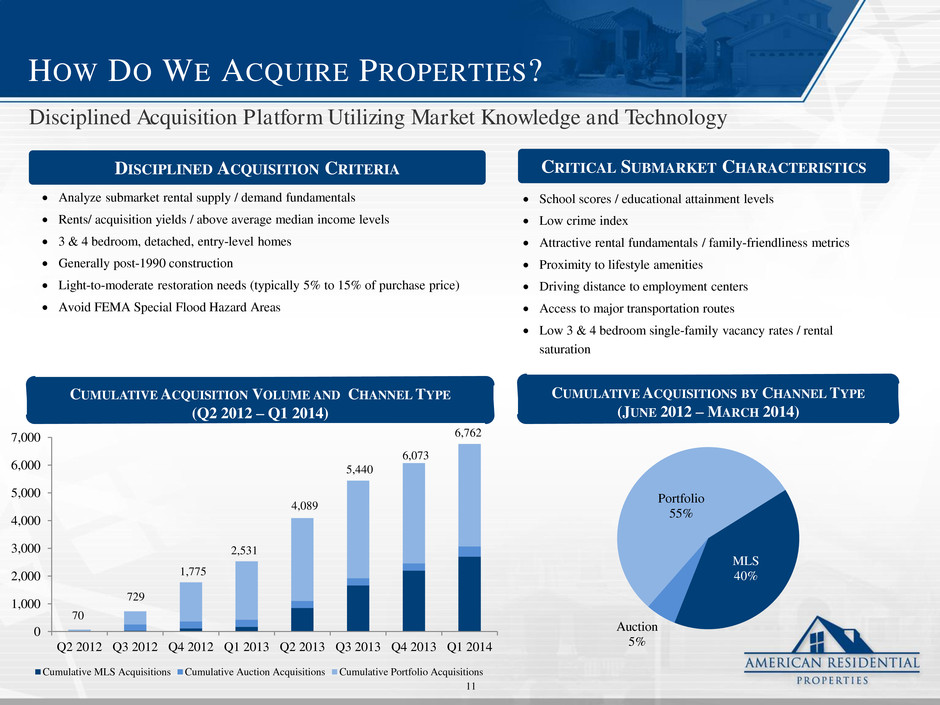
EPS\Management Presentation\American Residential Properties - 602505097 HOW DO WE ACQUIRE PROPERTIES? Disciplined Acquisition Platform Utilizing Market Knowledge and Technology School scores / educational attainment levels Low crime index Attractive rental fundamentals / family-friendliness metrics Proximity to lifestyle amenities Driving distance to employment centers Access to major transportation routes Low 3 & 4 bedroom single-family vacancy rates / rental saturation CRITICAL SUBMARKET CHARACTERISTICS Analyze submarket rental supply / demand fundamentals Rents/ acquisition yields / above average median income levels 3 & 4 bedroom, detached, entry-level homes Generally post-1990 construction Light-to-moderate restoration needs (typically 5% to 15% of purchase price) Avoid FEMA Special Flood Hazard Areas DISCIPLINED ACQUISITION CRITERIA CUMULATIVE ACQUISITION VOLUME AND CHANNEL TYPE (Q2 2012 – Q1 2014) CUMULATIVE ACQUISITIONS BY CHANNEL TYPE (JUNE 2012 – MARCH 2014) 11 0 1,000 2,000 3,000 4,000 5,000 6,000 7,000 Q2 2012 Q3 2012 Q4 2012 Q1 2013 Q2 2013 Q3 2013 Q4 2013 Q1 2014 Cumulative MLS Acquisitions Cumulative Auction Acquisitions Cumulative Portfolio Acquisitions 70 729 1,775 2,531 4,089 5,440 6,073 6,762 MLS 40% Auction 5% Portfolio 55%
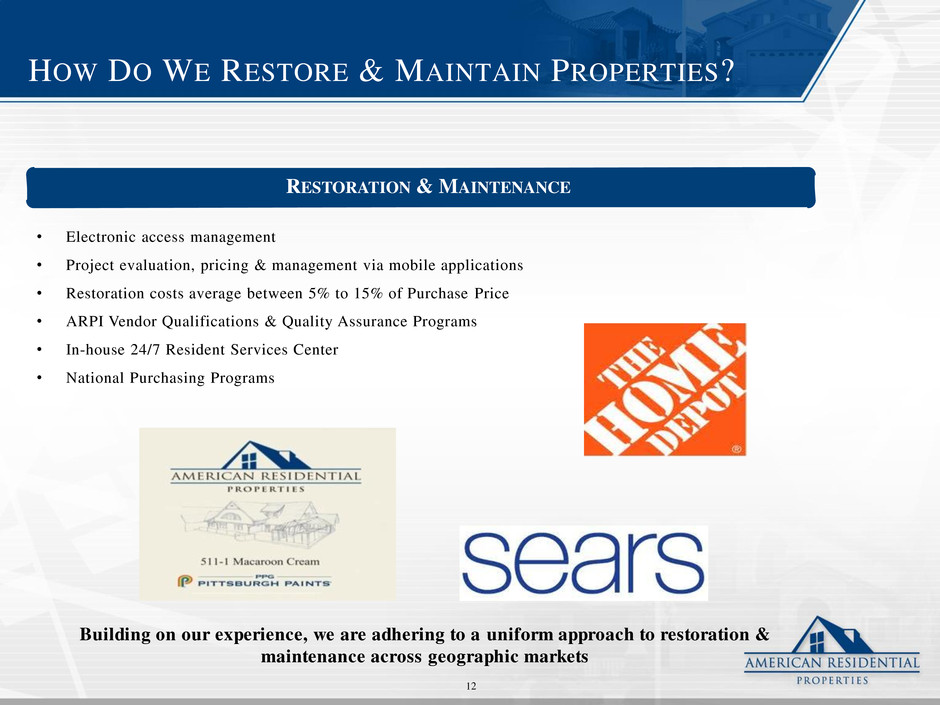
EPS\Management Presentation\American Residential Properties - 602505097 HOW DO WE RESTORE & MAINTAIN PROPERTIES? • Electronic access management • Project evaluation, pricing & management via mobile applications • Restoration costs average between 5% to 15% of Purchase Price • ARPI Vendor Qualifications & Quality Assurance Programs • In-house 24/7 Resident Services Center • National Purchasing Programs Building on our experience, we are adhering to a uniform approach to restoration & maintenance across geographic markets RESTORATION & MAINTENANCE 12
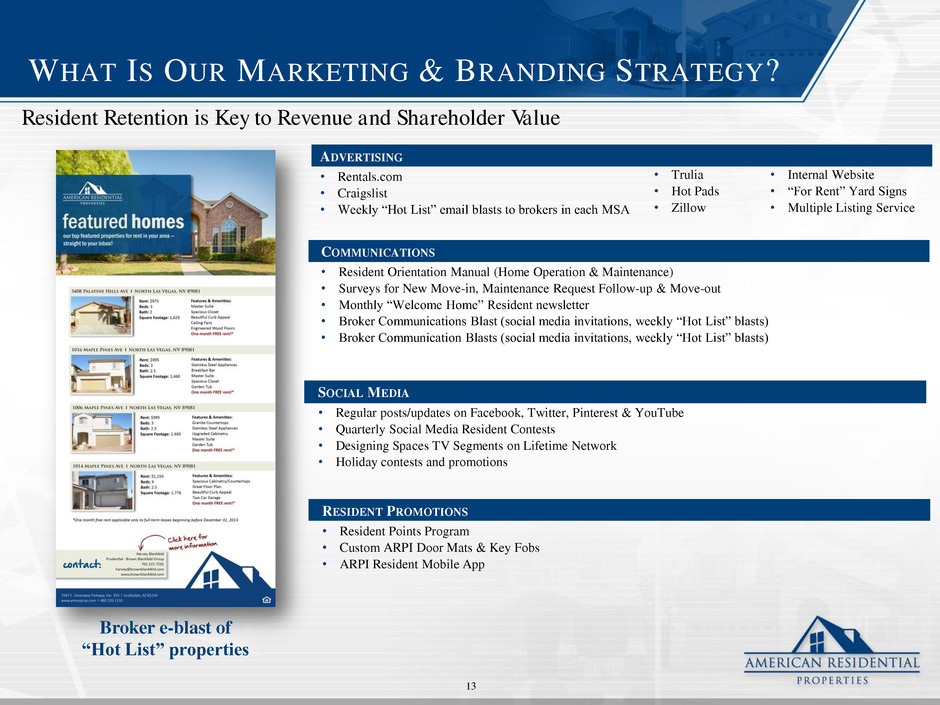
EPS\Management Presentation\American Residential Properties - 602505097 COMMUNICATIONS • Resident Orientation Manual (Home Operation & Maintenance) • Surveys for New Move-in, Maintenance Request Follow-up & Move-out • Monthly “Welcome Home” Resident newsletter • Broker Communications Blast (social media invitations, weekly “Hot List” blasts) • Broker Communication Blasts (social media invitations, weekly “Hot List” blasts) SOCIAL MEDIA • Regular posts/updates on Facebook, Twitter, Pinterest & YouTube • Quarterly Social Media Resident Contests • Designing Spaces TV Segments on Lifetime Network • Holiday contests and promotions RESIDENT PROMOTIONS • Resident Points Program • Custom ARPI Door Mats & Key Fobs • ARPI Resident Mobile App Broker e-blast of “Hot List” properties ADVERTISING • Rentals.com • Craigslist • Weekly “Hot List” email blasts to brokers in each MSA • Trulia • Hot Pads • Zillow • Internal Website • “For Rent” Yard Signs • Multiple Listing Service WHAT IS OUR MARKETING & BRANDING STRATEGY? Resident Retention is Key to Revenue and Shareholder Value 13
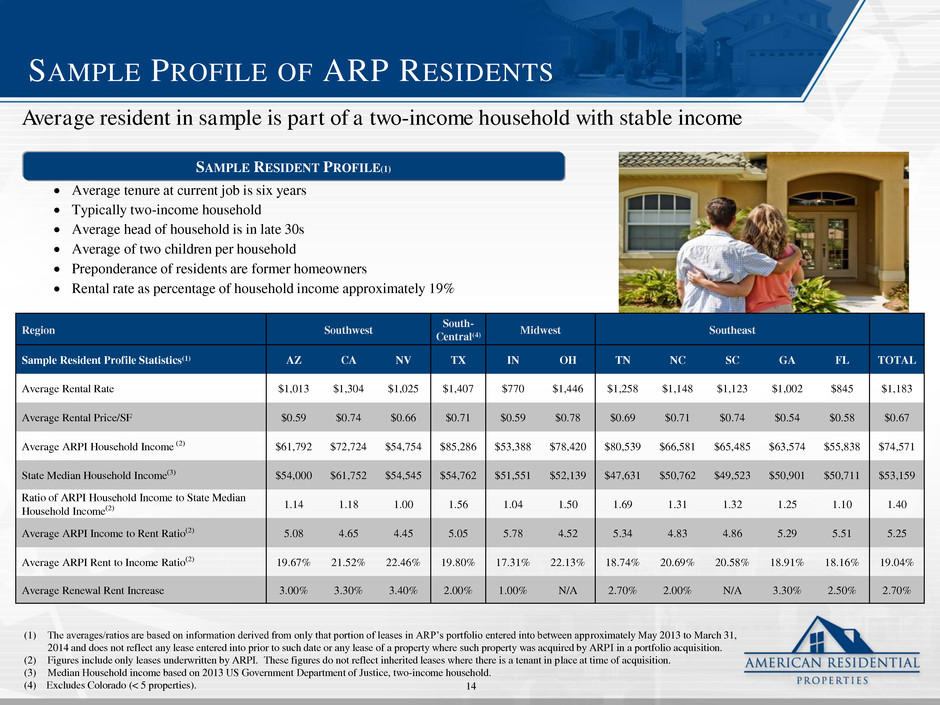
EPS\Management Presentation\American Residential Properties - 602505097 SAMPLE PROFILE OF ARP RESIDENTS (1) The averages/ratios are based on information derived from only that portion of leases in ARP’s portfolio entered into between approximately May 2013 to March 31, 2014 and does not reflect any lease entered into prior to such date or any lease of a property where such property was acquired by ARPI in a portfolio acquisition. (2) Figures include only leases underwritten by ARPI. These figures do not reflect inherited leases where there is a tenant in place at time of acquisition. (3) Median Household income based on 2013 US Government Department of Justice, two-income household. (4) Excludes Colorado (< 5 properties). SAMPLE RESIDENT PROFILE(1) Average tenure at current job is six years Typically two-income household Average head of household is in late 30s Average of two children per household Preponderance of residents are former homeowners Rental rate as percentage of household income approximately 19% Average resident in sample is part of a two-income household with stable income Region Southwest South- Central(4) Midwest Southeast Sample Resident Profile Statistics(1) AZ CA NV TX IN OH TN NC SC GA FL TOTAL Average Rental Rate $1,013 $1,304 $1,025 $1,407 $770 $1,446 $1,258 $1,148 $1,123 $1,002 $845 $1,183 Average Rental Price/SF $0.59 $0.74 $0.66 $0.71 $0.59 $0.78 $0.69 $0.71 $0.74 $0.54 $0.58 $0.67 Average ARPI Household Income (2) $61,792 $72,724 $54,754 $85,286 $53,388 $78,420 $80,539 $66,581 $65,485 $63,574 $55,838 $74,571 State Median Household Income(3) $54,000 $61,752 $54,545 $54,762 $51,551 $52,139 $47,631 $50,762 $49,523 $50,901 $50,711 $53,159 Ratio of ARPI Household Income to State Median Household Income(2) 1.14 1.18 1.00 1.56 1.04 1.50 1.69 1.31 1.32 1.25 1.10 1.40 Average ARPI Income to Rent Ratio(2) 5.08 4.65 4.45 5.05 5.78 4.52 5.34 4.83 4.86 5.29 5.51 5.25 Average ARPI Rent to Income Ratio(2) 19.67% 21.52% 22.46% 19.80% 17.31% 22.13% 18.74% 20.69% 20.58% 18.91% 18.16% 19.04% Average Renewal Rent Increase 3.00% 3.30% 3.40% 2.00% 1.00% N/A 2.70% 2.00% N/A 3.30% 2.50% 2.70% 14
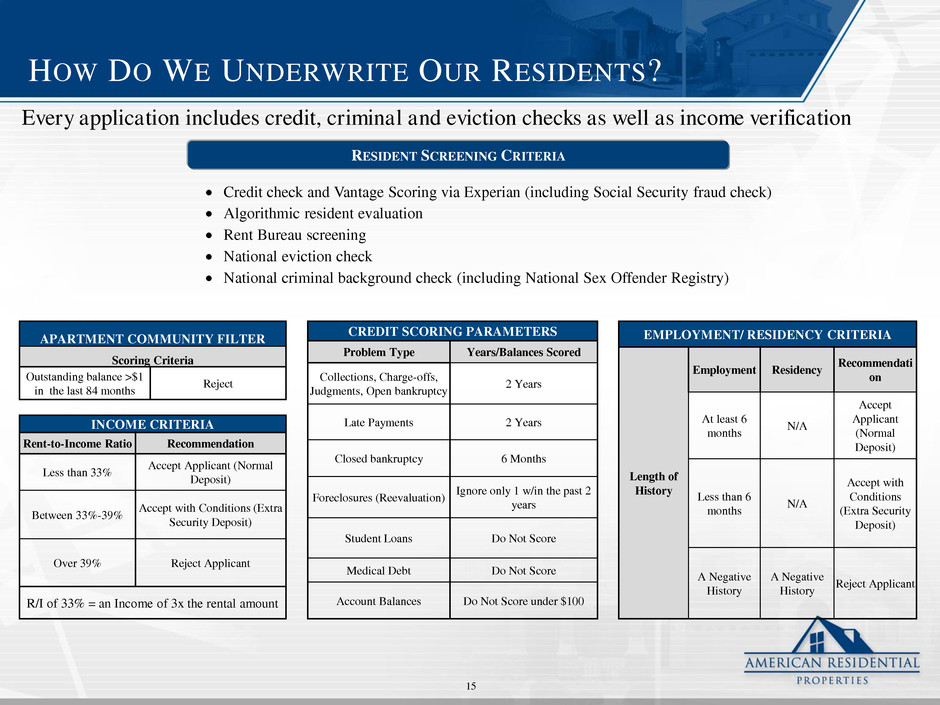
EPS\Management Presentation\American Residential Properties - 602505097 HOW DO WE UNDERWRITE OUR RESIDENTS? RESIDENT SCREENING CRITERIA Credit check and Vantage Scoring via Experian (including Social Security fraud check) Algorithmic resident evaluation Rent Bureau screening National eviction check National criminal background check (including National Sex Offender Registry) Every application includes credit, criminal and eviction checks as well as income verification INCOME CRITERIA Rent-to-Income Ratio Recommendation Less than 33% Accept Applicant (Normal Deposit) Between 33%-39% Accept with Conditions (Extra Security Deposit) Over 39% Reject Applicant R/I of 33% = an Income of 3x the rental amount EMPLOYMENT/ RESIDENCY CRITERIA Length of History Employment Residency Recommendati on At least 6 months N/A Accept Applicant (Normal Deposit) Less than 6 months N/A Accept with Conditions (Extra Security Deposit) A Negative History A Negative History Reject Applicant APARTMENT COMMUNITY FILTER Scoring Criteria Outstanding balance >$1 in the last 84 months Reject CREDIT SCORING PARAMETERS Problem Type Years/Balances Scored Collections, Charge-offs, Judgments, Open bankruptcy 2 Years Late Payments 2 Years Closed bankruptcy 6 Months Foreclosures (Reevaluation) Ignore only 1 w/in the past 2 years Student Loans Do Not Score Medical Debt Do Not Score Account Balances Do Not Score under $100 15

EPS\Management Presentation\American Residential Properties - 602505097 THE OPPORTUNITY & FUTURE GROWTH 16
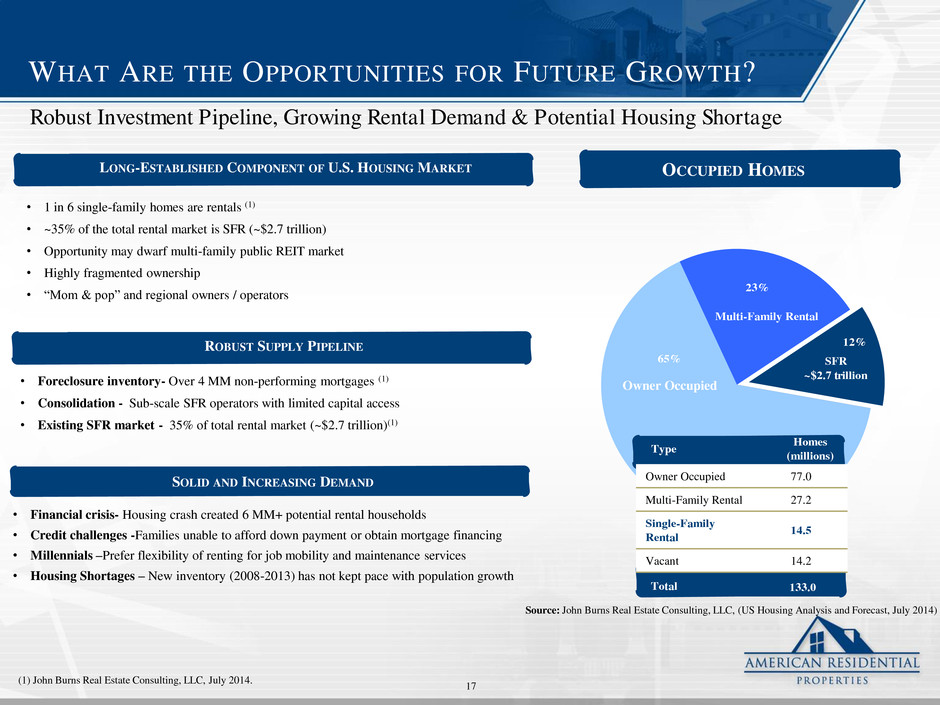
EPS\Management Presentation\American Residential Properties - 602505097 WHAT ARE THE OPPORTUNITIES FOR FUTURE GROWTH? Robust Investment Pipeline, Growing Rental Demand & Potential Housing Shortage • Foreclosure inventory- Over 4 MM non-performing mortgages (1) • Consolidation - Sub-scale SFR operators with limited capital access • Existing SFR market - 35% of total rental market (~$2.7 trillion)(1) ROBUST SUPPLY PIPELINE • Financial crisis- Housing crash created 6 MM+ potential rental households • Credit challenges -Families unable to afford down payment or obtain mortgage financing • Millennials –Prefer flexibility of renting for job mobility and maintenance services • Housing Shortages – New inventory (2008-2013) has not kept pace with population growth SOLID AND INCREASING DEMAND (1) John Burns Real Estate Consulting, LLC, July 2014. 65% 23% 12% Type Homes (millions) Total 133.0 Owner Occupied 77.0 Multi-Family Rental 27.2 Single-Family Rental 14.5 Vacant 14.2 Source: John Burns Real Estate Consulting, LLC, (US Housing Analysis and Forecast, July 2014) Owner Occupied Multi-Family Rental OCCUPIED HOMES SFR ~$2.7 trillion LONG-ESTABLISHED COMPONENT OF U.S. HOUSING MARKET • 1 in 6 single-family homes are rentals (1) • ~35% of the total rental market is SFR (~$2.7 trillion) • Opportunity may dwarf multi-family public REIT market • Highly fragmented ownership • “Mom & pop” and regional owners / operators 17
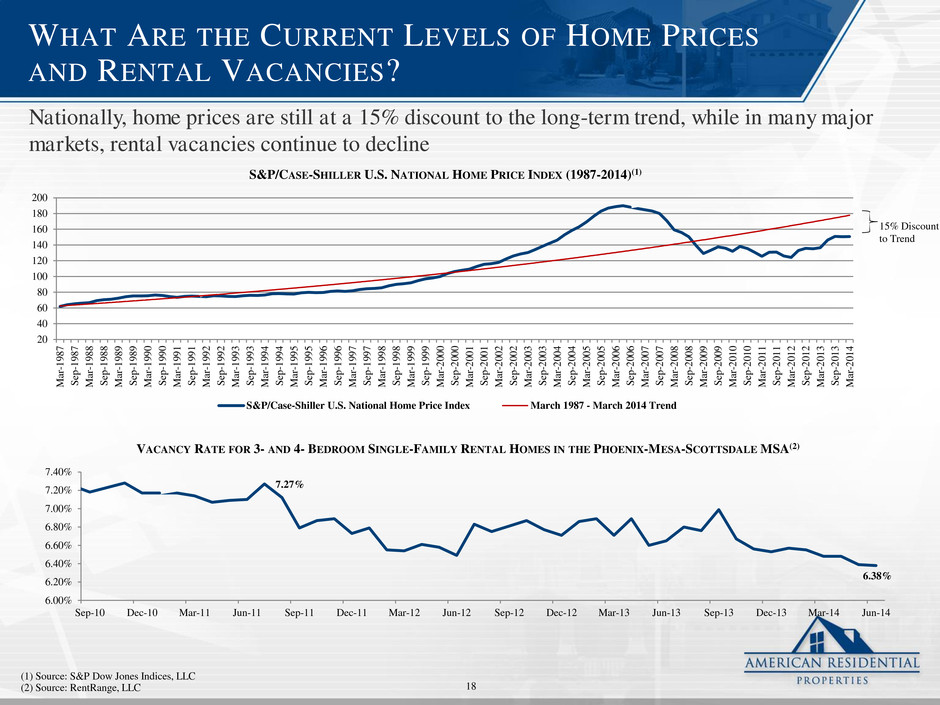
EPS\Management Presentation\American Residential Properties - 602505097 WHAT ARE THE CURRENT LEVELS OF HOME PRICES AND RENTAL VACANCIES? (1) Source: S&P Dow Jones Indices, LLC (2) Source: RentRange, LLC Nationally, home prices are still at a 15% discount to the long-term trend, while in many major markets, rental vacancies continue to decline 20 40 60 80 100 120 140 160 180 200 M ar -1 9 8 7 S ep -1 9 8 7 M ar -1 9 8 8 S ep -1 9 8 8 M ar -1 9 8 9 S ep -1 9 8 9 M ar -1 9 9 0 S ep -1 9 9 0 M ar -1 9 9 1 S ep -1 9 9 1 M ar -1 9 9 2 S ep -1 9 9 2 M ar -1 9 9 3 S ep -1 9 9 3 M ar -1 9 9 4 S ep -1 9 9 4 M ar -1 9 9 5 S ep -1 9 9 5 M ar -1 9 9 6 S ep -1 9 9 6 M ar -1 9 9 7 S ep -1 9 9 7 M ar -1 9 9 8 S ep -1 9 9 8 M ar -1 9 9 9 S ep -1 9 9 9 M ar -2 0 0 0 S ep -2 0 0 0 M ar -2 0 0 1 S ep -2 0 0 1 M ar -2 0 0 2 S ep -2 0 0 2 M ar -2 0 0 3 S ep -2 0 0 3 M ar -2 0 0 4 S ep -2 0 0 4 M ar -2 0 0 5 S ep -2 0 0 5 M ar -2 0 0 6 S ep -2 0 0 6 M ar -2 0 0 7 S ep -2 0 0 7 M ar -2 0 0 8 S ep -2 0 0 8 M ar -2 0 0 9 S ep -2 0 0 9 M ar -2 0 1 0 S ep -2 0 1 0 M ar -2 0 1 1 S ep -2 0 1 1 M ar -2 0 1 2 S ep -2 0 1 2 M ar -2 0 1 3 S ep -2 0 1 3 M ar -2 0 1 4 S&P/CASE-SHILLER U.S. NATIONAL HOME PRICE INDEX (1987-2014)(1) S&P/Case-Shiller U.S. National Home Price Index March 1987 - March 2014 Trend 15% Discount to Trend 7.27% 6.38% 6.00% 6.20% 6.40% 6.60% 6.80% 7.00% 7.20% 7.40% Sep-10 Dec-10 Mar-11 Jun-11 Sep-11 Dec-11 Mar-12 Jun-12 Sep-12 Dec-12 Mar-13 Jun-13 Sep-13 Dec-13 Mar-14 Jun-14 VACANCY RATE FOR 3- AND 4- BEDROOM SINGLE-FAMILY RENTAL HOMES IN THE PHOENIX-MESA-SCOTTSDALE MSA(2) 18
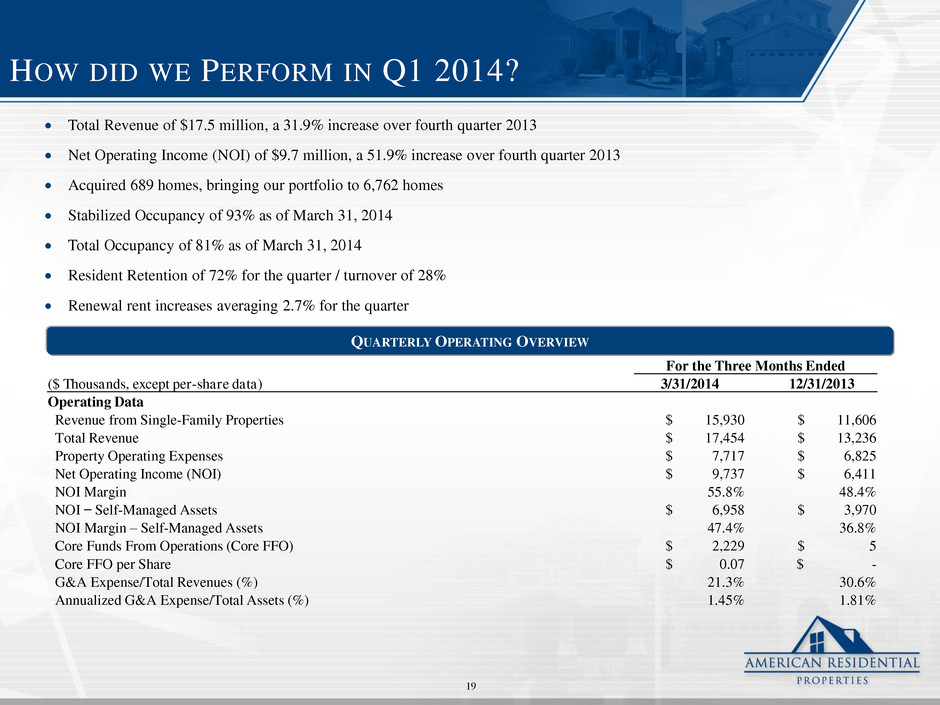
EPS\Management Presentation\American Residential Properties - 602505097 HOW DID WE PERFORM IN Q1 2014? Total Revenue of $17.5 million, a 31.9% increase over fourth quarter 2013 Net Operating Income (NOI) of $9.7 million, a 51.9% increase over fourth quarter 2013 Acquired 689 homes, bringing our portfolio to 6,762 homes Stabilized Occupancy of 93% as of March 31, 2014 Total Occupancy of 81% as of March 31, 2014 Resident Retention of 72% for the quarter / turnover of 28% Renewal rent increases averaging 2.7% for the quarter For the Three Months Ended ($ Thousands, except per-share data) 3/31/2014 12/31/2013 Operating Data Revenue from Single-Family Properties $ 15,930 $ 11,606 Total Revenue $ 17,454 $ 13,236 Property Operating Expenses $ 7,717 $ 6,825 Net Operating Income (NOI) $ 9,737 $ 6,411 NOI Margin 55.8% 48.4% NOI ̶ Self-Managed Assets $ 6,958 $ 3,970 NOI Margin – Self-Managed Assets 47.4% 36.8% Core Funds From Operations (Core FFO) $ 2,229 $ 5 Core FFO per Share $ 0.07 $ - G&A Expense/Total Revenues (%) 21.3% 30.6% Annualized G&A Expense/Total Assets (%) 1.45% 1.81% QUARTERLY OPERATING OVERVIEW 19
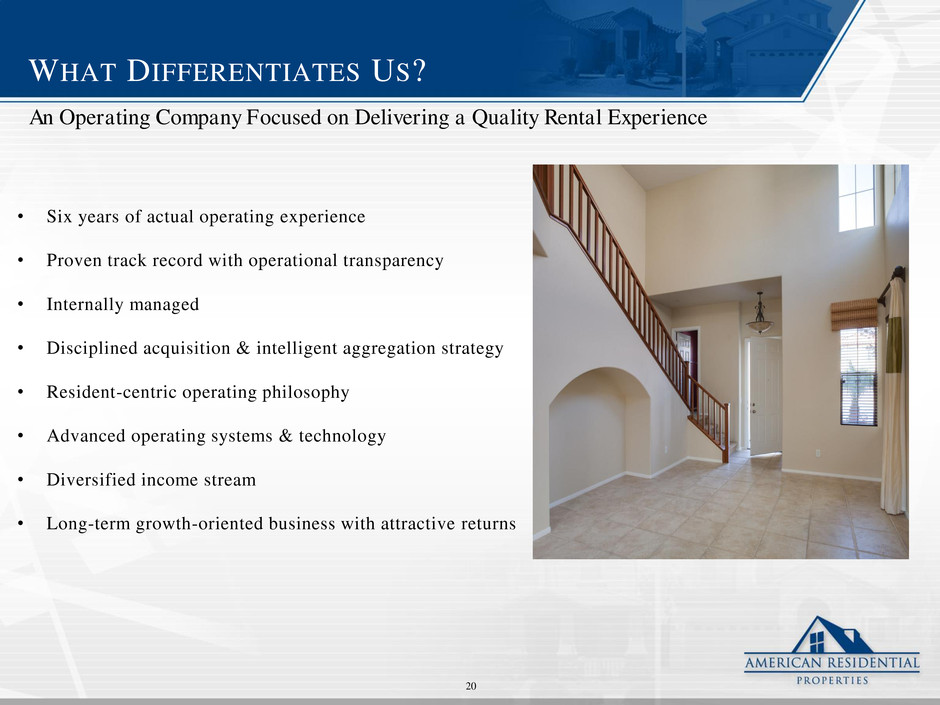
EPS\Management Presentation\American Residential Properties - 602505097 WHAT DIFFERENTIATES US? • Six years of actual operating experience • Proven track record with operational transparency • Internally managed • Disciplined acquisition & intelligent aggregation strategy • Resident-centric operating philosophy • Advanced operating systems & technology • Diversified income stream • Long-term growth-oriented business with attractive returns An Operating Company Focused on Delivering a Quality Rental Experience 20
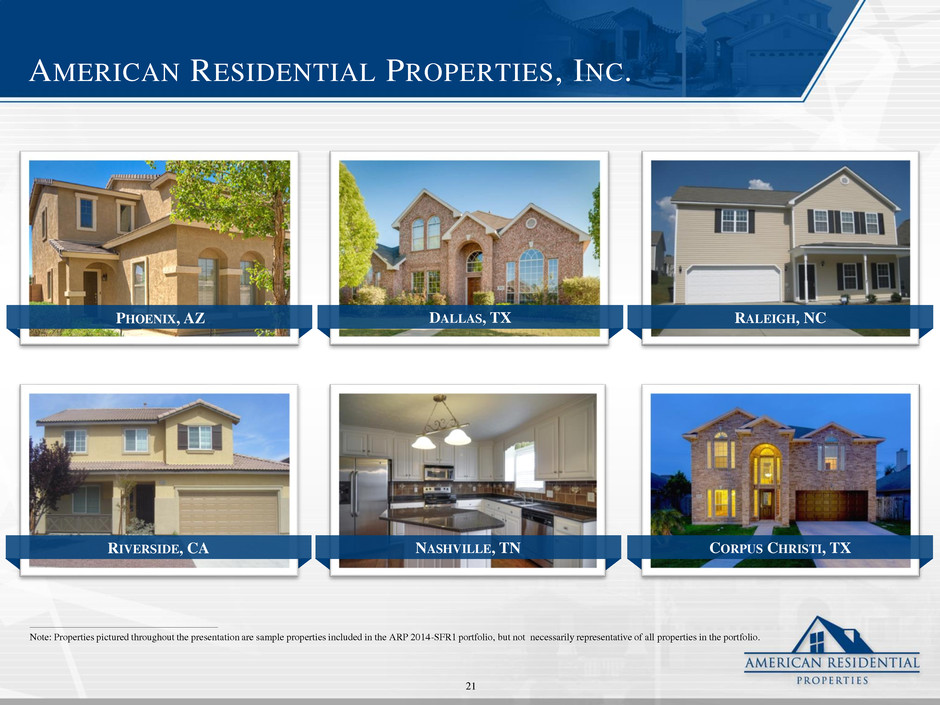
EPS\Management Presentation\American Residential Properties - 602505097 AMERICAN RESIDENTIAL PROPERTIES, INC. ________________________________________________ Note: Properties pictured throughout the presentation are sample properties included in the ARP 2014-SFR1 portfolio, but not necessarily representative of all properties in the portfolio. RALEIGH, NC DALLAS, TX PHOENIX, AZ NASHVILLE, TN CORPUS CHRISTI, TX RIVERSIDE, CA 21
