Attached files
| file | filename |
|---|---|
| EX-99.1 - EX-99.1 - Northern Power Systems Corp. | d767375dex991.htm |
| 8-K - FORM 8-K - Northern Power Systems Corp. | d767375d8k.htm |
 Q2
2014 Earnings Presentation August 5, 2014
Exhibit 99.2 |
 All
statements and other information contained in this document related to anticipated future events or results
constitute forward-looking statements. Forward-looking statements often,
but not always, are identified by the use of words such as “seek”,
“anticipate”, “believe”, “plan”, “estimate”, “expect”, “intend”, “forecast”, “project”, “likely”,
“potential”,
“targeted”
and
“possible”
and
statements
that
an
event
or
result
“may”,
“will”,
“would”,
“should”,
“could”
or “might”
occur or be achieve and other similar expressions. Forward-looking
statements are subject to known and unknown business and economic risks and
uncertainties and other factors that could cause actual results of operations to
differ materially from those expressed or implied by the forward-looking statements. Forward-
looking statements are based on estimates and opinions of management at the date the
statements are made. Northern Power Systems does not undertake any obligation to
update forward-looking statements even if circumstances or management’s
estimates or opinions should change, except as required by law. For the
reasons set forth above, investors should not place undue reliance on
forward-looking statements. This presentation references non-GAAP
financial measures with the required reconciliation referenced in the
table
captioned
“Non-GAAP
Reconciliations”
to
the
most
comparable
GAAP
financial
measures.
2
FORWARD
LOOKING
STATEMENT
AND
NON-GAAP
DISCLOSURES |
 Presentation Organization and Call Details
3
Troy Patton
President and CEO
Ciel Caldwell
CFO
Q&A Session:
Presentation Organization:
Basis of Presentation:
Q2 2014 business update
Q2 2014 operational and
financial results review
GAAP to Non-GAAP
reconciliations
Q2 2014 = Northern Power Systems Corp.
YTD 2014 = Q1 Wind Power Holdings, Inc.
+ Q2 Northern Power Systems Corp.
2013 periods = Wind Power Holdings, Inc.
Immediately following this call
Link from IR webpage at
http://www.ir.northernpower.com/
events-and-presentations.aspx
Hosted by: |
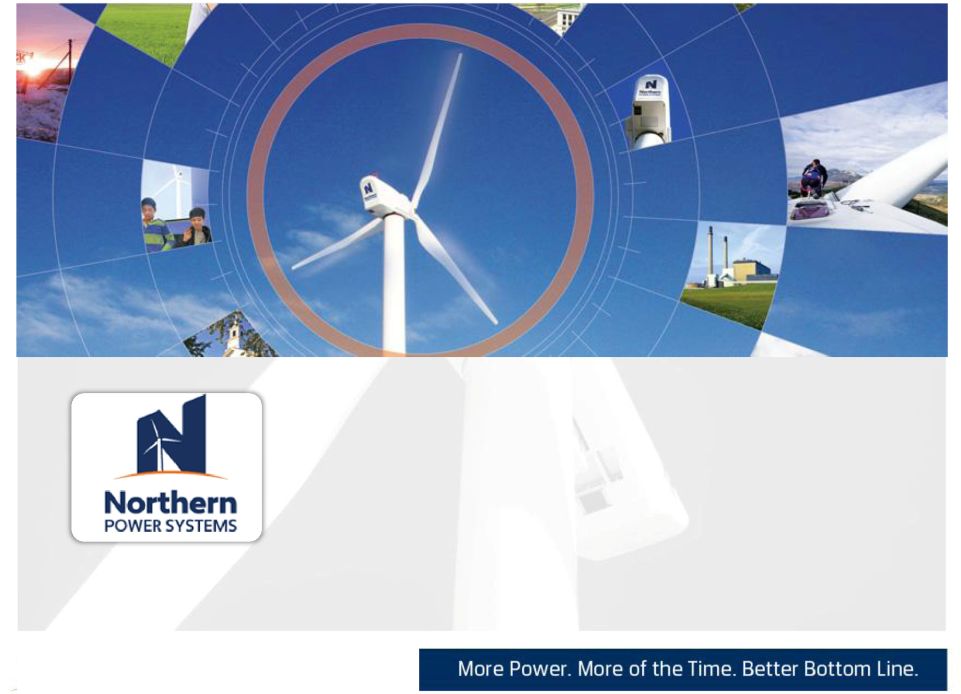
 NPS’
Business Lines
Distributed turbine
sales expanding
NPS 100kW
NPS 60kW
BRIC+ strategy
Fully developed Licensing and
Royalty Model
Successfully deployed in China
and Brazil to date
Global Growth
High-margin Engineering
Project work
Expansion of IP portfolio
Technology Licensing
Product Sales & Service
NPS 2MW
turbine
platform
Converter and
Controls Systems
4
Technology Development |
 Business Expansion Trends
5
Q1 ‘13
Q2 ‘14
Q1 ‘13
Q2 ‘14
Bridge to Net Loss
Non-GAAP EBITDA Loss
(3.4)
(2.2)
(3.1)
(4.8)
(3.2)
Q1 ‘13
Q2 ‘14
Revenue
Backlog
(2.8)
13.8
13.8
9.0
5.6
4.3
1.7
41
48
45
36
34
21
$14
$12
$10
$8
$6
$4
$2
$0
$50
$40
$30
$20
$10
$0
(2.9)
(3.0)
(2.3)
(3.0)
(2.5)
(1.3)
$0
($1)
($2)
($3)
($4)
($5) |
 Q2
2014: Product Sales and Service Update Production
of
initial
unit
of
3
rd
-
generation 60kW turbine in VT factory.
Continued strong European
momentum; evolving market
conditions
First 4 units shipped to Korea
Staffing expansion plan for Sales and
Marketing to expand regions and re-
focus efforts in North America
Exploring further Power Converter
supply agreements
6
Distributed turbine
sales expanding
Product Sales & Service
NPS 2MW
turbine
platform
NPS 100kW
NPS 60kW
Converter and
Controls Systems |
 Next
Generation Distributed Turbine 7
Next gen
turbine in testing
Installation at
customer site
Power generation
Second
generation
turbine
Third generation turbine |
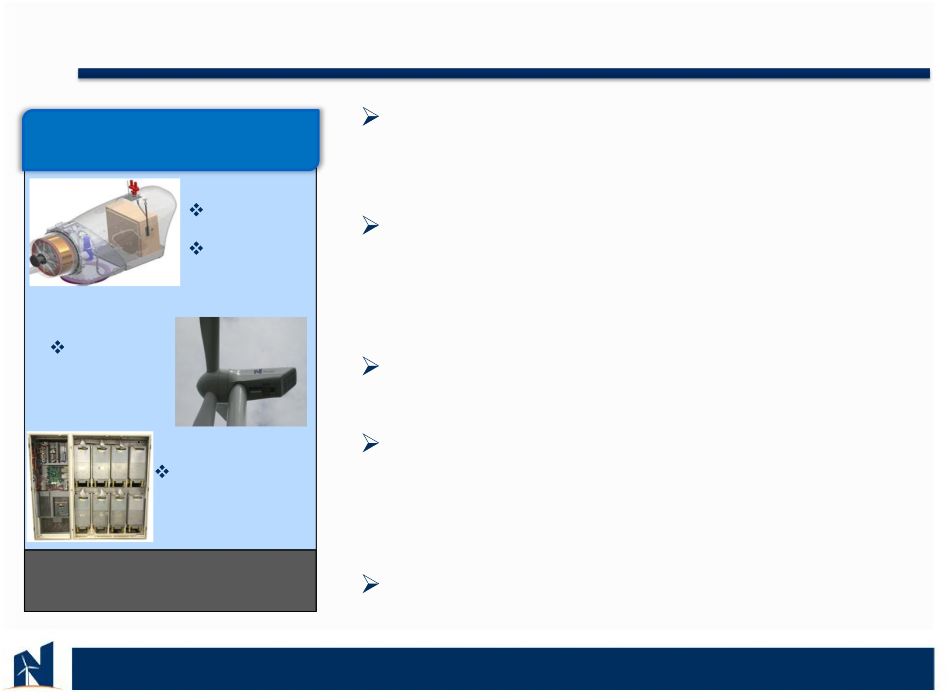
 Q2
2014: Technology Licensing Update WEG 2.1MW turbine deliveries
begin in Brazil
Initial 2.1MW units expected to
commission in 4Q14
3Q14 expecting partial WEG
license revenue recognition and
commenced royalty payments
Other smaller technology
licensing transactions underway
8
BRIC+ strategy
Fully developed Licensing and
Royalty Model
Successfully deployed in China
and Brazil to date
Technology Licensing |
 WEG
Manufactured 2.1MW Turbines 9 |
 Q2
2014: Technology Development WEG 3.3MW license agreement
commenced:
Expecting to scale development in Q3
into Q4; anticipated completion in 2015
Backbone of planned development
activity for next twelve months
Patented FlexPhase Power
Converters currently under
development for other
applications in the power sector
NPS expertise in complex power
grid connections currently utilized
for work with a regulated utility in
the US Northeast
10
Broad scale expansion
High-margin Engineering
Project work
Expansion of IP portfolio
Technology Development |
 Q2
2014: Key Financial Metrics Q2 2014
YTD 2014
Revenue
•
$13.8M
•
220% y/y growth
•
$27.5M
•
360% y/y growth
Backlog
•
$41M
•
21% y/y growth
Gross Margin
•
16%
•
PY at (1%)
•
12%
•
PY at (4%)
Net Loss
•
($2.2M)
•
22% y/y loss reduction
•
($0.10/share)
•
($5.3M)
•
14% y/y loss reduction
•
($0.31/share)
Non-GAAP EBITDA
Loss
•
($1.3M)
•
58% y/y loss reduction
•
($0.06/share)
•
($3.8M)
•
36% y/y loss reduction
•
($0.22/share)
11 |
 Revenue and Gross Margin Trends
12
Q1 ‘13
Q2 ‘13
Q4 ‘13
Q2 ‘14
Q1 ‘14
Q3 ‘13
High-wind Regimes
Non-turbine Revenue
Low-wind Regimes
$0
$2
$4
$6
$8
$10
$12
$14
-
9.9%
-1.3%
16.2%
6.1%
8.6%
15.9%
-
10.0%
0.0%
10.0%
20.0% |
 Q2
2014: Other Financial Metrics Cash Flow Statement
Q2 2014
YTD 2014
Cash used in operations
($6.9M)
($9.2M)
Cash provided by investing
activities
$.9M
$.7M
Cash provided by financing
activities
$19.3M
$19.2M
13
Balance Sheet Metrics
June 30, 2014
December 31, 2013
Cash and cash equivalents
$15.4M
$4.5M
Debt
$0*
$12.5M
* Comerica working capital line of credit available through 6/30/15 for up to
$6M Change in
operating assets /
liab. ($5.6M)
•
•
Cap-Ex ($.4M)
Facility Sale $1.3M
•
•
Change in
operating assets /
liab. ($5.1M)
•
Cap-Ex ($.6M)
Facility Sale $1.3M
• |
 14
Non-GAAP Reconciliations |
 Non-GAAP Reconciliations –
Non-GAAP adjusted EBITDA
(All amounts in thousand)
15
Q1
2013
Q2
2013
Q3
2013
Q4
2013
Q1
2014
Q2
2014
Net Loss
$(3,384)
$(2,753)
$(3,163)
$(4,828)
$(3,124)
$(2,152)
Interest
18
111
99
286
240
37
Taxes
26
3
(16)
22
14
15
Depreciation
227
310
234
214
178
391
Stock compensation
122
57
85
437
148
454
Fair value warrants
63
(724)
489
-
-
-
Non-cash restructuring
-
-
-
70
-
-
Loss on asset held for sale
-
-
-
768
-
-
Adjusted EBITDA
$(2,928)
$(2,996)
$(2,272)
$(3,031)
$(2,544)
$(1,255) |
 Non-GAAP Reconciliations –
Earnings Per Share
16
Q2
2014
Year to Date
2014
Net
Loss
per
common
share
–
Basic
and
Diluted
$(0.10)
$(0.31)
Interest
-
0.02
Depreciation
0.02
0.03
Stock compensation
0.02
0.04
Adjusted
EBITDA
per
common
share
–
Basic
and
Diluted
$(0.06)
$(0.22)
Weighted
average
number
of
common
shares
outstanding
–
Basic
and
Diluted
21,088,589
16,964,388 |