Attached files
| file | filename |
|---|---|
| 8-K - ALBANY INTERNATIONAL CORP. 8-K - ALBANY INTERNATIONAL CORP /DE/ | a50917987.htm |
| EX-99.1 - EXHIBIT 99.1 - ALBANY INTERNATIONAL CORP /DE/ | a50917987ex99_1.htm |
Exhibit 99.2
August 4, 2014 Albany International Corp. Q2 Financial Performance
‘Non-GAAP’ Items and Forward-Looking StatementsThis presentation contains certain items, such as net income attributable to the Company, excluding adjustments (absolute as well as per-share), earnings before interest, taxes, depreciation and amortization (EBITDA), adjusted EBITDA and net debt, that could be considered ‘non-GAAP’ financial measures under SEC rules. We think such items provide useful information to investors regarding the Company’s operational performance. This presentation also may contain statements, estimates, or projections that constitute “forward-looking statements” as defined under U.S. federal securities laws. Forward-looking statements are subject to certain risks and uncertainties that could cause actual results to differ materially from the Company’s historical experience and our present expectations or projections. We disclaim any obligation to update any information in this presentation to reflect any changes or developments after the date on the cover page. Certain additional disclosures regarding our use of these ‘non-GAAP’ items and forward-looking statements are set forth in our second-quarter earnings press release dated August 4, 2014, and in our SEC filings, including our most recent quarterly reports and our annual reports for the years ended December 31, 2011, 2012, and 2013. Our use of such items in this presentation is subject to those additional disclosures, which we urge you to read.
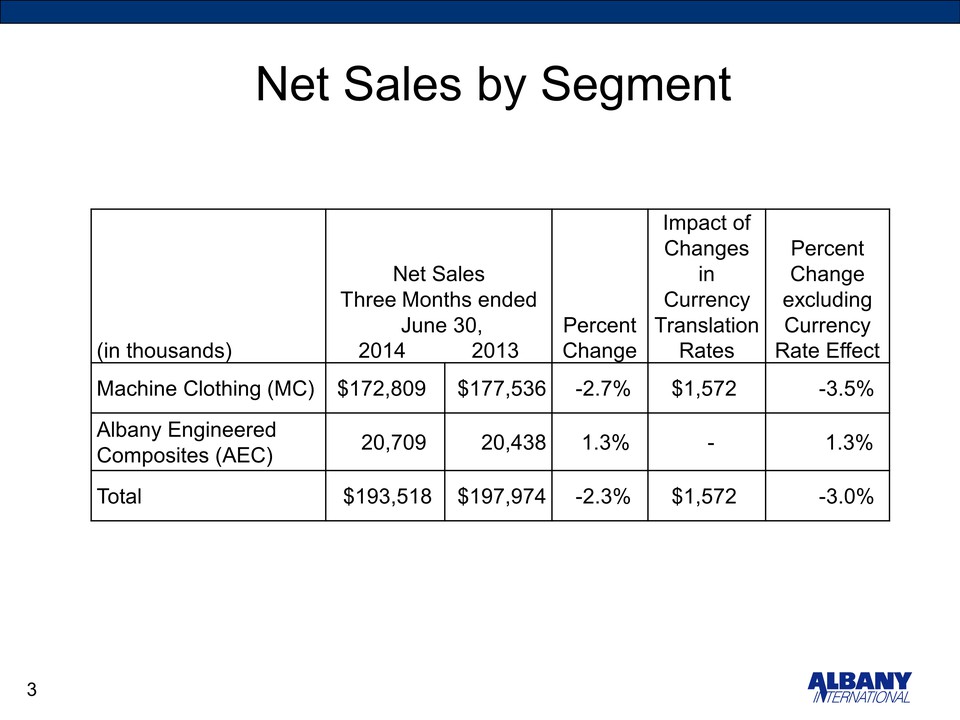
Net Sales by Segment Net Sales Three Months ended June 30, 2014 2013Percent Change Impact of Changes in Currency Translation Rates Percent Change excluding Currency Rate Effect (in thousands) Machine Clothing (MC) Albany Engineered Composites (AEC) Total $172,809 20,709 $193,518 $177,536 20,438 $197,974 -2.7% 1.3% -2.3% $1,572 - $1,572 -3.5% 1.3% -3.0%
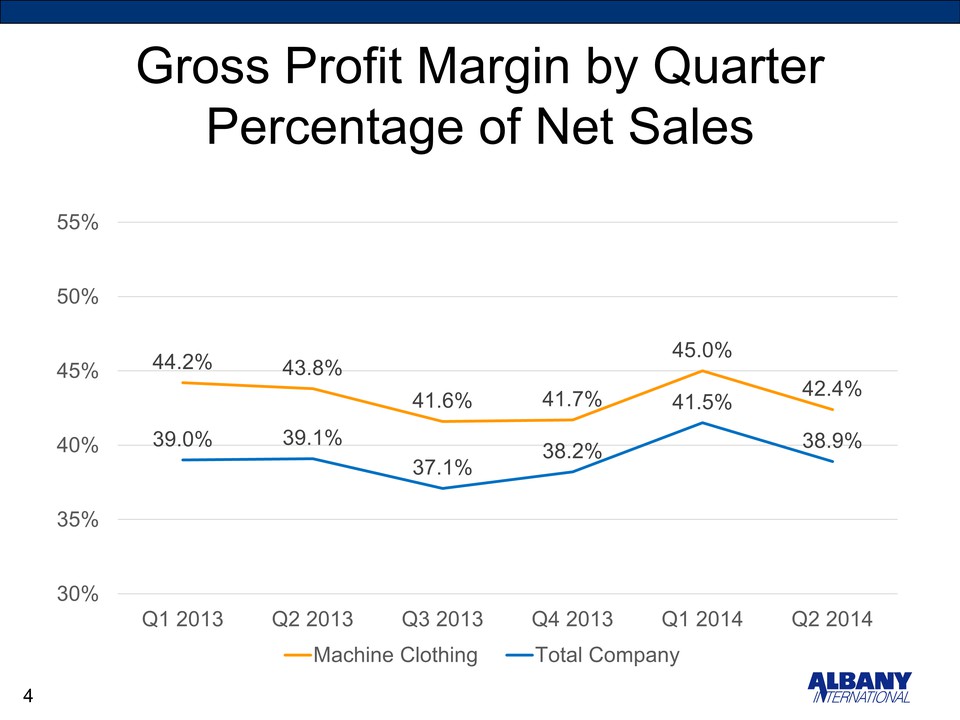
Gross Profit Margin by Quarter Percentage of Net Sales Machine Clothing Total Company Q1 2013 0.442 0.39 Q2 2013 0.438 0.391 Q3 2013 0.416 0.371 Q4 2013 0.417 0.382 Q1 2014 0.45 0.415 Q2 2014 0.424 0.389
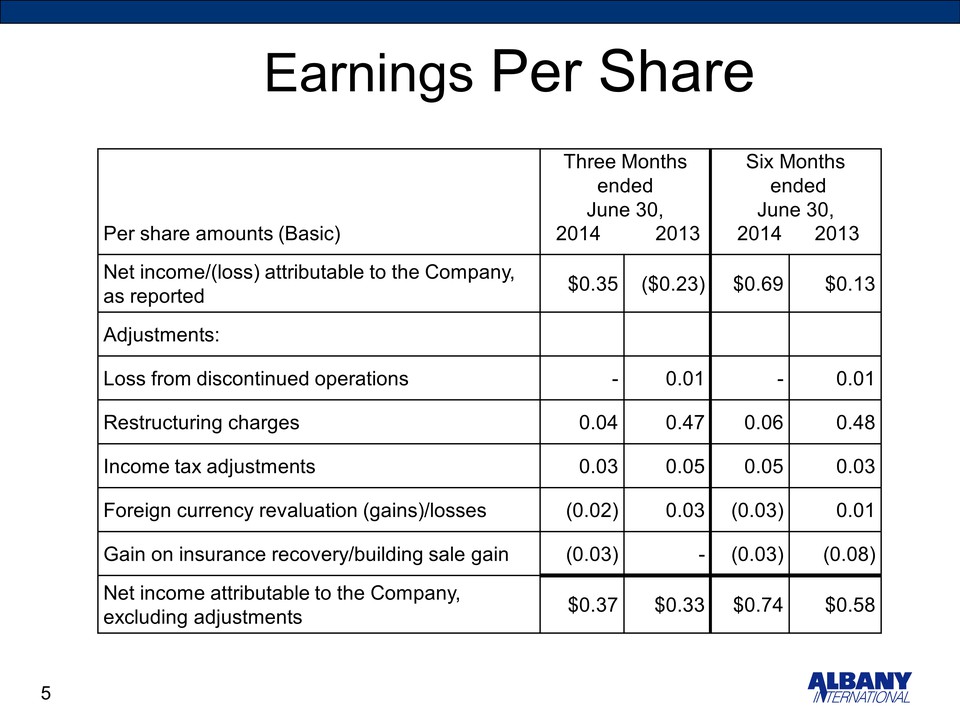
Earnings Per Share Per share amounts (Basic) Three Months ended June 30, 2014 2013 Six Months ended June 30, 2014 2013 Net income/(loss) attributable to the Company, as reported $0.35 ($0.23) $0.69 $0.13 Adjustments: Loss from discontinued operations - 0.01 - 0.01 Restructuring charges 0.04 0.47 0.06 0.48 Income tax adjustments 0.03 0.05 0.05 0.03 Foreign currency revaluation (gains)/losses (0.02) 0.03 (0.03) 0.01 Gain on insurance recovery/building sale gain (0.03) - (0.03) (0.08) Net income attributable to the Company, excluding adjustments $0.37 $0.33 $0.74 $0.58
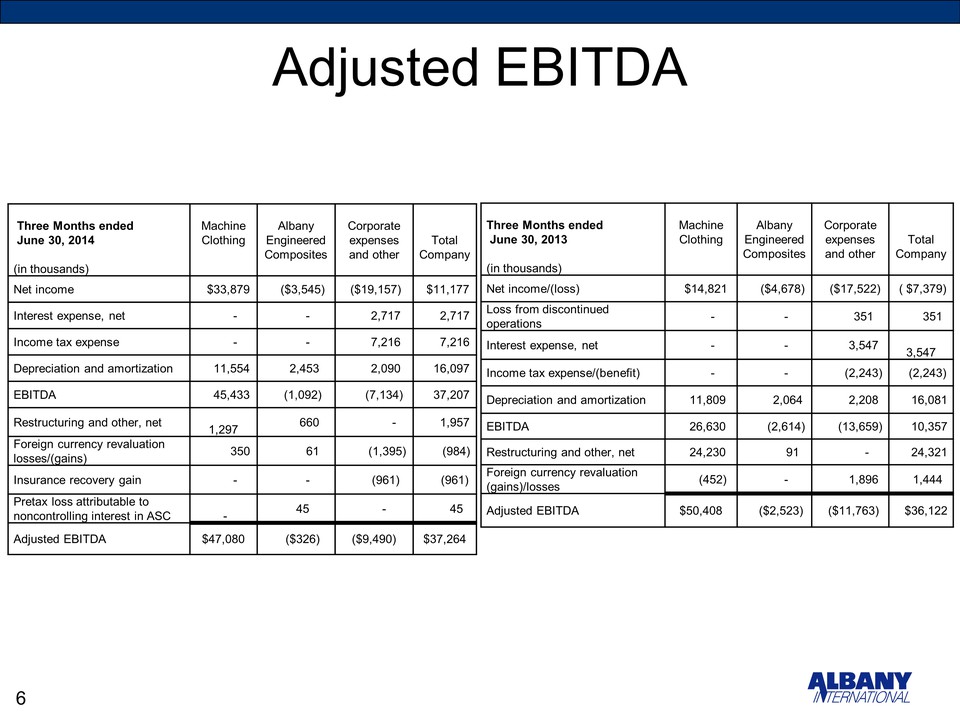
Adjusted EBITDA Three Months ended June 30, 2014 (in thousands) Machine Clothing Albany Engineered Composites Corporate expenses and other Total Company Net income $33,879 ($3,545) ($19,157) $11,177 Interest expense, net - - 2,717 2,717 Income tax expense - - 7,216 7,216 Depreciation and amortization 11,554 2,453 2,090 16,097 EBITDA 45,433 (1,092) (7,134) 37,207 Restructuring and other, net 1,297 660 - 1,957 Foreign currency revaluation losses/(gains) 350 61 (1,395) (984) Insurance recovery gain - - (961) (961) Pretax loss attributable to noncontrolling interest in ASC - 45 - 45 Adjusted EBITDA $47,080 ($326) ($9,490) $37,264 Three Months ended June 30, 2013 (in thousands) Machine Clothing Albany Engineered Composites Corporate expenses and other Total Company Net income/(loss) $14,821 ($4,678) ($17,522) ( $7,379) Loss from discontinued operations - - 351 351 Interest expense, net - - 3,547 3,547 Income tax expense/(benefit) - - (2,243) (2,243) Depreciation and amortization 11,809 2,064 2,208 16,081 EBITDA 26,630 (2,614) (13,659) 10,357 Restructuring and other, net 24,230 91 - 24,321 Foreign currency revaluation (gains)/losses (452) - 1,896 1,444 Adjusted EBITDA $50,408 ($2,523) ($11,763) $36,122
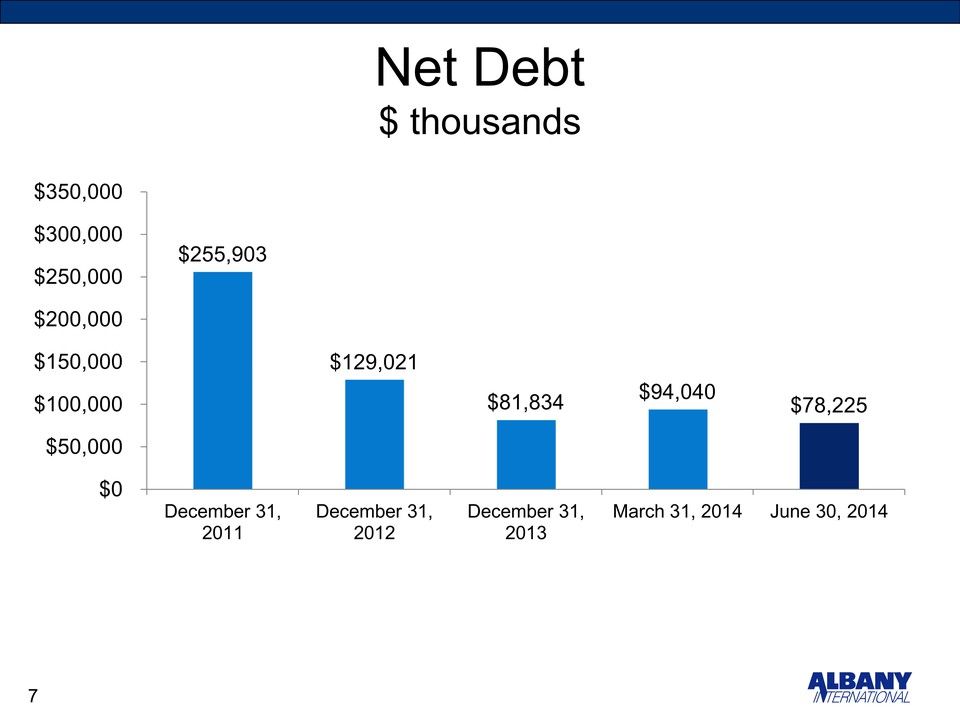
Net Debt $ thousands Net Debt December 31, 2011 $255,903 December 31, 2012 $129,021 December 31, 2013 $81,834 March 31, 2014 $94,040 June 30, 2014 $78,225