Attached files
| file | filename |
|---|---|
| EXCEL - IDEA: XBRL DOCUMENT - HECLA MINING CO/DE/ | Financial_Report.xls |
| EX-31 - EXHIBIT 31.2 - HECLA MINING CO/DE/ | ex31-2.htm |
| EX-95 - EXHIBIT 95 - HECLA MINING CO/DE/ | ex95.htm |
| EX-31 - EXHIBIT 31.1 - HECLA MINING CO/DE/ | ex31-1.htm |
| EX-32 - EXHIBIT 32.2 - HECLA MINING CO/DE/ | ex32-2.htm |
| EX-32 - EXHIBIT 32.1 - HECLA MINING CO/DE/ | ex32-1.htm |
UNITED STATES
SECURITIES AND EXCHANGE COMMISSION
Washington, D.C. 20549
FORM 10-Q
[X] QUARTERLY REPORT PURSUANT TO SECTION 13 OR 15(d) OF THE
SECURITIES EXCHANGE ACT OF 1934
For the quarterly period ended June 30, 2014
|
Commission file number |
1-8491 |
HECLA MINING COMPANY
(Exact name of registrant as specified in its charter)
|
Delaware |
77-0664171 |
|||
|
(State or other jurisdiction of |
(I.R.S. Employer |
|||
|
incorporation or organization) |
Identification No.) |
|||
|
6500 Mineral Drive, Suite 200 |
||||
|
Coeur d'Alene, Idaho |
83815-9408 |
|||
|
(Address of principal executive offices) |
(Zip Code) |
|||
|
208-769-4100 | ||||
|
(Registrant's telephone number, including area code) | ||||
Indicate by check mark whether the registrant: (1) has filed all reports required to be filed by Section 13 or 15(d) of the Securities Exchange Act of 1934 during the preceding 12 months (or for such shorter period that the registrant was required to file such reports), and (2) has been subject to such filing requirements for the past 90 days.
Yes XX . No .
Indicate by check mark whether the registrant has submitted electronically and posted on its corporate Web site, if any, every Interactive Data File required to be submitted and posted pursuant to Rule 405 of Regulation S-T (§ 232.405 of this chapter) during the preceding 12 months (or for such shorter period that the registrant was required to submit and post such files).
Yes XX . No___.
Indicate by check mark whether the registrant is a large accelerated filer, an accelerated filer, a non-accelerated filer, or a smaller reporting company. See definitions of “large accelerated filer,” “accelerated filer” and “smaller reporting company” in Rule 12b-2 of the Exchange Act (check one):
|
Large accelerated filer XX. |
Accelerated filer . |
|
Non-accelerated filer . |
Smaller reporting company . |
(Do not check if a smaller reporting company)
Indicate by check mark whether the registrant is a shell company (as defined in Rule 12b-2 of the Exchange Act).
Yes . No XX.
Indicate the number of shares outstanding of each of the issuer’s classes of common stock, as of the latest practicable date.
|
Class |
Shares Outstanding July 28, 2014 | |
|
Common stock, par value $0.25 per share |
349,502,627 |
Hecla Mining Company and Subsidiaries
Form 10-Q
For the Quarter Ended June 30, 2014
INDEX*
| Page | |
|
PART I - Financial Information |
|
|
Item 1 – Condensed Consolidated Financial Statements (Unaudited) |
|
|
Condensed Consolidated Balance Sheets - June 30, 2014 and December 31, 2013 |
3 |
|
Condensed Consolidated Statements of Operations and Comprehensive Loss - Three Months Ended and Six Months Ended – June 30, 2014 and 2013 |
4 |
|
Condensed Consolidated Statements of Cash Flows - Six Months Ended June 30, 2014 and 2013 |
5 |
|
Notes to Condensed Consolidated Financial Statements |
6 |
|
Item 2. Management's Discussion and Analysis of Financial Condition and Results of Operations |
25 |
|
Item 3. Quantitative and Qualitative Disclosures About Market Risk |
47 |
|
Item 4. Controls and Procedures |
49 |
|
PART II - Other Information |
|
|
Item 1 – Legal Proceedings |
49 |
|
Item 1A – Risk Factors |
50 |
|
Item 2 – Unregistered Sales of Securities and Use of Proceeds |
50 |
|
Item 4 – Mine Safety Disclosures |
50 |
|
Item 6 – Exhibits |
50 |
|
Signatures |
51 |
|
Exhibits |
52 |
*Items 3 and 5 of Part II are omitted as they are not applicable.
Part I - Financial Information
Item 1. Financial Statements
Hecla Mining Company and Subsidiaries
Condensed Consolidated Balance Sheets (Unaudited)
(In thousands, except shares)
|
June 30, 2014 |
December 31, 2013 |
|||||||
|
ASSETS |
||||||||
|
Current assets: |
||||||||
|
Cash and cash equivalents |
$ | 222,083 | $ | 212,175 | ||||
|
Accounts receivable: |
||||||||
|
Trade |
21,033 | 17,672 | ||||||
|
Other, net |
8,978 | 20,893 | ||||||
|
Inventories: |
||||||||
|
Concentrates, doré, and stockpiled ore |
29,569 | 27,740 | ||||||
|
Materials and supplies |
21,385 | 21,097 | ||||||
|
Current deferred income taxes |
37,898 | 35,734 | ||||||
|
Other current assets |
5,934 | 8,324 | ||||||
|
Total current assets |
346,880 | 343,635 | ||||||
|
Non-current investments |
7,466 | 7,019 | ||||||
|
Non-current restricted cash and investments |
883 | 5,217 | ||||||
|
Properties, plants, equipment and mineral interests, net |
1,818,632 | 1,791,601 | ||||||
|
Non-current deferred income taxes |
77,689 | 78,780 | ||||||
|
Other non-current assets and deferred charges |
3,577 | 5,867 | ||||||
|
Total assets |
$ | 2,255,127 | $ | 2,232,119 | ||||
|
LIABILITIES |
||||||||
|
Current liabilities: |
||||||||
|
Accounts payable and accrued liabilities |
$ | 39,414 | $ | 51,152 | ||||
|
Accrued payroll and related benefits |
22,533 | 18,769 | ||||||
|
Accrued taxes |
10,442 | 7,881 | ||||||
|
Current portion of capital leases |
8,410 | 8,471 | ||||||
|
Other current liabilities |
8,057 | 6,781 | ||||||
|
Current portion of accrued reclamation and closure costs |
58,190 | 58,425 | ||||||
|
Total current liabilities |
147,046 | 151,479 | ||||||
|
Capital leases |
12,061 | 14,332 | ||||||
|
Accrued reclamation and closure costs |
56,968 | 46,766 | ||||||
|
Long-term debt |
496,354 | 490,726 | ||||||
|
Non-current deferred tax liability |
165,442 | 164,861 | ||||||
|
Other non-current liabilities |
35,873 | 37,536 | ||||||
|
Total liabilities |
913,744 | 905,700 | ||||||
|
Commitments and contingencies |
||||||||
|
SHAREHOLDERS’ EQUITY |
||||||||
| Preferred stock, 5,000,000 shares authorized: | ||||||||
|
Series B preferred stock, $0.25 par value, 157,816 shares issued and outstanding, liquidation preference — $7,891 |
39 | 39 | ||||||
|
Common stock, $0.25 par value, authorized 500,000,000 shares; issued and outstanding 2014 — 348,689,981 shares and 2013 — 342,663,381 shares |
87,516 | 85,896 | ||||||
|
Capital surplus |
1,447,333 | 1,426,845 | ||||||
|
Accumulated deficit |
(159,748 |
) |
(154,982 |
) | ||||
|
Accumulated other comprehensive loss |
(27,137 |
) |
(26,299 |
) | ||||
|
Less treasury stock, at cost; 2014 — 1,466,611 shares and 2013 — 921,721 shares issued and held in treasury |
(6,620 |
) |
(5,080 |
) | ||||
|
Total shareholders’ equity |
1,341,383 | 1,326,419 | ||||||
|
Total liabilities and shareholders’ equity |
$ | 2,255,127 | $ | 2,232,119 | ||||
The accompanying notes are an integral part of the interim condensed consolidated financial statements.
Hecla Mining Company and Subsidiaries
Condensed Consolidated Statements of Operations and Comprehensive Loss (Unaudited)
(Dollars and shares in thousands, except for per-share amounts)
|
Three Months Ended |
Six Months Ended |
|||||||||||||||
|
June 30, 2014 |
June 30, 2013 |
June 30, 2014 |
June 30, 2013 |
|||||||||||||
|
Sales of products |
$ | 117,502 | $ | 85,330 | $ | 243,289 | $ | 161,780 | ||||||||
|
Cost of sales and other direct production costs |
71,039 | 60,008 | 148,780 | 96,833 | ||||||||||||
|
Depreciation, depletion and amortization |
27,735 | 20,211 | 53,538 | 34,218 | ||||||||||||
| 98,774 | 80,219 | 202,318 | 131,051 | |||||||||||||
|
Gross profit |
18,728 | 5,111 | 40,971 | 30,729 | ||||||||||||
|
Other operating expenses: |
||||||||||||||||
|
General and administrative |
8,159 | 7,482 | 16,100 | 14,421 | ||||||||||||
|
Exploration |
3,140 | 6,221 | 7,290 | 12,714 | ||||||||||||
|
Pre-development |
437 | 4,512 | 856 | 9,303 | ||||||||||||
|
Other operating expense |
693 | 205 | 1,411 | 1,229 | ||||||||||||
|
Provision for closed operations and environmental matters |
1,267 | 1,845 | 2,371 | 3,639 | ||||||||||||
|
Lucky Friday suspension-related income |
— | (2,840 |
) |
— | (1,342 |
) | ||||||||||
|
Aurizon acquisition costs |
— | 20,308 | — | 25,600 | ||||||||||||
| 13,696 | 37,733 | 28,028 | 65,564 | |||||||||||||
|
Income (loss) from operations |
5,032 | (32,622 |
) |
12,943 | (34,835 |
) | ||||||||||
|
Other income (expense): |
||||||||||||||||
|
Gain on sale of investments |
— | 197 | — | 197 | ||||||||||||
|
Unrealized gain (loss) on investments |
(608 |
) |
— | 80 | — | |||||||||||
|
Gain (loss) on derivative contracts |
(11,601 |
) |
6,541 | (2,149 |
) |
28,080 | ||||||||||
|
Net foreign exchange gain (loss) |
(5,382 |
) |
(144 |
) |
(1,248 |
) |
389 | |||||||||
|
Interest and other income |
97 | 829 | 176 | 183 | ||||||||||||
|
Interest expense, net of amount capitalized |
(6,962 |
) |
(6,454 |
) |
(13,802 |
) |
(7,158 |
) | ||||||||
| (24,456 |
) |
969 | (16,943 |
) |
21,691 | |||||||||||
|
Loss before income taxes |
(19,424 |
) |
(31,653 |
) |
(4,000 |
) |
(13,144 |
) | ||||||||
|
Income tax benefit (provision) |
5,025 | 6,795 | 1,242 | (620 |
) | |||||||||||
|
Net loss |
(14,399 |
) |
(24,858 |
) |
(2,758 |
) |
(13,764 |
) | ||||||||
|
Preferred stock dividends |
(138 |
) |
(138 |
) |
(276 |
) |
(276 |
) | ||||||||
|
Loss applicable to common shareholders |
$ | (14,537 |
) |
$ | (24,996 |
) |
$ | (3,034 |
) |
$ | (14,040 |
) | ||||
|
Comprehensive loss: |
||||||||||||||||
|
Net loss |
$ | (14,399 |
) |
$ | (24,858 |
) |
$ | (2,758 |
) |
$ | (13,764 |
) | ||||
|
Unrealized loss and amortization of prior service on pension plans |
(1,192 |
) |
— | (1,192 |
) |
— | ||||||||||
|
Reclassification of net gain on sale of marketable securities included in net income |
— | (197 |
) |
— | (197 |
) | ||||||||||
|
Unrealized holding (losses) gains on investments |
(996 |
) |
(1,747 |
) |
354 | (4,578 |
) | |||||||||
|
Comprehensive income (loss) |
$ | (16,587 |
) |
$ | (26,802 |
) |
$ | (3,596 |
) |
$ | (18,539 |
) | ||||
|
Basic loss per common share after preferred dividends |
$ | (0.04 |
) |
$ | (0.08 |
) |
$ | (0.01 |
) |
$ | (0.05 |
) | ||||
|
Diluted loss per common share after preferred dividends |
$ | (0.04 |
) |
$ | (0.08 |
) |
$ | (0.01 |
) |
$ | (0.05 |
) | ||||
|
Weighted average number of common shares outstanding - basic |
344,216 | 303,566 | 343,437 | 294,317 | ||||||||||||
|
Weighted average number of common shares outstanding - diluted |
344,216 | 303,566 | 343,437 | 294,317 | ||||||||||||
|
Cash dividends declared per common share |
$ | 0.0025 | $ | 0.0025 | $ | 0.0050 | $ | 0.0050 | ||||||||
The accompanying notes are an integral part of the interim condensed consolidated financial statements.
Hecla Mining Company and Subsidiaries
Condensed Consolidated Statements of Cash Flows (Unaudited)
(In thousands)
|
Six Months Ended |
||||||||
|
June 30, 2014 |
June 30, 2013 |
|||||||
|
Operating activities: |
||||||||
|
Net loss |
$ | (2,758 |
) |
$ | (13,764 |
) | ||
|
Non-cash elements included in net loss: |
||||||||
|
Depreciation, depletion and amortization |
54,045 | 34,834 | ||||||
|
Gain on sale of investments |
— | (195 |
) | |||||
|
(Gain) loss on disposition of properties, plants, equipment, and mineral interests |
44 | (125 |
) | |||||
|
Provision for reclamation and closure costs |
2,710 | 1,190 | ||||||
|
Stock compensation |
2,561 | 1,870 | ||||||
|
Deferred income taxes |
(6,840 |
) |
(1,610 |
) | ||||
|
Amortization of loan origination fees |
1,135 | 397 | ||||||
|
(Gain) loss on derivative contracts |
6,231 | (21,528 |
) | |||||
|
Foreign exchange gain |
(55 |
) |
— | |||||
|
Other non-cash charges, net |
(986 |
) |
(25 |
) | ||||
|
Change in assets and liabilities, net of amounts acquired in business combination: |
||||||||
|
Accounts receivable |
8,398 | 9,117 | ||||||
|
Inventories |
(2,418 |
) |
3,601 | |||||
|
Other current and non-current assets |
1,617 | 4,254 | ||||||
|
Accounts payable and accrued liabilities |
(17,084 |
) |
5,790 | |||||
|
Accrued payroll and related benefits |
9,069 | (1,577 |
) | |||||
|
Accrued taxes |
2,582 | (7,518 |
) | |||||
|
Accrued reclamation and closure costs and other non-current liabilities |
(1,222 |
) |
(4,436 |
) | ||||
|
Cash provided by operating activities |
57,029 | 10,275 | ||||||
|
Investing activities: |
||||||||
|
Additions to properties, plants, equipment and mineral interests |
(57,461 |
) |
(60,291 |
) | ||||
|
Acqusition of Aurizon, net of cash acquired |
— | (321,117 |
) | |||||
|
Proceeds from sale of investments |
— | 1,771 | ||||||
|
Proceeds from disposition of properties, plants and equipment |
238 | 126 | ||||||
|
Purchases of investments |
— | (5,738 |
) | |||||
|
Changes in restricted cash and investment balances |
4,334 | 55 | ||||||
|
Net cash used in investing activities |
(52,889 |
) |
(385,194 |
) | ||||
|
Financing activities: |
||||||||
|
Proceeds from exercise of warrants |
14,112 | — | ||||||
|
Acquisition of treasury shares |
(1,501 |
) |
(286 |
) | ||||
|
Dividends paid to common shareholders |
(1,715 |
) |
(4,277 |
) | ||||
|
Dividends paid to preferred shareholders |
(276 |
) |
(276 |
) | ||||
|
Credit availability and debt issuance fees paid |
(577 |
) |
(1,426 |
) | ||||
|
Borrowings on debt |
— | 490,000 | ||||||
|
Repayments of capital leases |
(4,525 |
) |
(3,425 |
) | ||||
|
Net cash provided by financing activities |
5,518 | 480,310 | ||||||
|
Effect of exchange rates on cash |
250 | — | ||||||
|
Net increase in cash and cash equivalents |
9,908 | 105,391 | ||||||
|
Cash and cash equivalents at beginning of period |
212,175 | 190,984 | ||||||
|
Cash and cash equivalents at end of period |
$ | 222,083 | $ | 296,375 | ||||
|
Significant non-cash investing and financing activities: |
||||||||
|
Addition of capital lease obligations |
$ | 2,193 | $ | 6,725 | ||||
|
Increase in asset retirement obligations |
$ | 8,210 | $ | — | ||||
|
Stock issued for the acquisition of Aurizon |
$ | — | $ | 218,302 | ||||
|
Senior notes contributed to pension plan, par value |
$ | 5,000 | $ | — | ||||
|
Payment of accrued compensation in restricted stock units |
$ | 4,600 | $ | — | ||||
The accompanying notes are an integral part of the interim condensed consolidated financial statements.
Note 1. Basis of Preparation of Financial Statements
In the opinion of management, the accompanying unaudited interim condensed consolidated financial statements and notes to the interim condensed consolidated financial statements contain all adjustments, consisting of normal recurring items, necessary to present fairly, in all material respects, the financial position of Hecla Mining Company and its consolidated subsidiaries (“we” or “our” or “us”). These unaudited interim condensed consolidated financial statements should be read in conjunction with our audited consolidated financial statements and related footnotes as set forth in our annual report filed on Form 10-K for the year ended December 31, 2013, as it may be amended from time to time.
The results of operations for the periods presented may not be indicative of those which may be expected for a full year. The unaudited interim condensed consolidated financial statements have been prepared pursuant to the rules and regulations of the Securities and Exchange Commission. Certain information and footnote disclosures normally included in audited financial statements prepared in accordance with generally accepted accounting principles in the United States (“GAAP”) have been condensed or omitted pursuant to those rules and regulations, although we believe that the disclosures are adequate for the information not to be misleading.
The preparation of financial statements in conformity with GAAP requires management to make estimates and assumptions that affect the reported amounts of assets and liabilities as of the date of the financial statements, the reported amounts of revenues and expenses during the reporting period and the disclosures of contingent liabilities. Accordingly, ultimate results could differ materially from those estimates.
On June 1, 2013, we completed the acquisition of Aurizon Mines Ltd. ("Aurizon"), giving us 100% ownership of the Casa Berardi mine and various other interests in Quebec, Canada. The unaudited interim condensed consolidated financial statements included herein reflect our ownership of the assets previously held by Aurizon as of the June 1, 2013 acquisition date. We have determined that the functional currency for our Canadian operations acquired from Aurizon is the U.S. dollar.
Note 2. Investments and Restricted Cash
Investments
At June 30, 2014 and December 31, 2013, the fair values of our non-current investments were $7.5 million and $7.0 million, respectively. Our non-current investments consist of marketable equity securities, which are carried at fair value as they are classified as “available-for-sale.” The cost bases of our non-current investments were approximately $9.1 million and $10.0 million, respectively, at June 30, 2014 and December 31, 2013.
At June 30, 2014, total unrealized loss positions of $2.4 million, net of unrealized gains of $0.5 million, for our non-current investments were included in accumulated other comprehensive loss.
Our non-current investments balance as of June 30, 2014 includes our ownership of approximately 29.4% of the outstanding common shares of Typhoon Exploration Inc. having a cost basis of $0.8 million and fair value of $1.0 million. This investment would have been accounted for under the equity method; however, we chose to apply the fair value option to the investment upon it meeting the criteria for equity method accounting during the second quarter of 2013. We individually evaluate the accounting treatment of our investments based on whether we believe our ownership percentage and other factors indicate that we have the ability to exercise significant influence in the financial and/or operational decisions of the investee. As of June 30, 2014, we have no other investments that we have determined to qualify for equity method accounting.
Restricted Cash and Investments
Various laws, permits, and covenants require that financial assurances be in place for certain environmental and reclamation obligations and other potential liabilities. These restricted investments are used primarily for reclamation funding or for funding surety bonds, and were $0.9 million at June 30, 2014 and $5.2 million at December 31, 2013. The decrease in restricted cash was attributed to a modification of Casa Berardi's reclamation funding, which substituted a letter of credit from previously help cash collateral.
Note 3. Income Taxes
Major components of our income tax provision (benefit) for the three and six months ended June 30, 2014 and 2013 are as follows (in thousands):
|
Three Months Ended |
Six Months Ended |
|||||||||||||||
|
June 30, |
June 30, |
|||||||||||||||
|
2014 |
2013 |
2014 |
2013 |
|||||||||||||
|
Current: |
||||||||||||||||
|
Domestic |
$ | (1,192 |
) |
$ | 1,028 | $ | 5,307 | $ | 4,165 | |||||||
|
Foreign |
227 | 115 | 383 | 230 | ||||||||||||
|
Total current income tax provision (benefit) |
(965 |
) |
1,143 | 5,690 | 4,395 | |||||||||||
|
Deferred: |
||||||||||||||||
|
Domestic |
(3,886 |
) |
(3,387 |
) |
(7,016 |
) |
776 | |||||||||
|
Foreign |
(174 |
) |
(4,551 |
) |
84 | (4,551 |
) | |||||||||
|
Total deferred income tax benefit |
(4,060 |
) |
(7,938 |
) |
(6,932 |
) |
(3,775 |
) | ||||||||
|
Total income tax provision (benefit) |
$ | (5,025 |
) |
$ | (6,795 |
) |
$ | (1,242 |
) |
$ | 620 | |||||
As of June 30, 2014, we have a net deferred tax asset in the U.S. of $115.6 million and a net deferred tax liability in Canada of $166.4 million for a consolidated worldwide net deferred tax liability of $50.8 million. Our ability to utilize our deferred tax assets depends on future taxable income generated from operations. For the six months ended June 30, 2014, there were no circumstances that caused us to change our assessment of the ability to generate sufficient future taxable income to realize the currently recognized U.S. deferred tax assets. At June 30, 2014 and December 31, 2013, the balances of the valuation allowances on our deferred tax assets were $28 million and $27 million, respectively, primarily for foreign net operating loss carryforwards. The amount of the deferred tax asset considered recoverable, however, could be reduced in the near term if estimates of future taxable income are reduced.
The current income tax provisions for the three and six months ended June 30, 2014 and 2013 vary from the amounts that would have resulted from applying the statutory income tax rate to pre-tax income primarily due to the effects of percentage depletion for all periods presented and the impact of taxation in foreign jurisdictions.
Note 4. Commitments, Contingencies and Obligations
General
We follow the FASB Accounting Standards Codification guidance in determining our accruals and disclosures with respect to loss contingencies, and evaluate such accruals and contingencies for each reporting period. Accordingly, estimated losses from loss contingencies are accrued by a charge to income when information available prior to issuance of the financial statements indicates that it is probable that a liability could be incurred and the amount of the loss can be reasonably estimated. Legal expenses associated with the contingency are expensed as incurred. If a loss contingency is not probable or reasonably estimable, disclosure of the loss contingency is made in the financial statements when it is at least reasonably possible that a material loss could be incurred.
Rio Grande Silver Guaranty
Our wholly-owned subsidiary, Rio Grande Silver Inc. (“Rio”), is party to a joint venture with Emerald Mining & Leasing, LLC (“EML”) and certain other parties with respect to a land package in the Creede Mining District of Colorado that is adjacent to other land held by Rio. Rio holds a 70% interest in the joint venture. In connection with the joint venture, we are required to guarantee certain environmental remediation-related obligations of EML to a third party up to a maximum liability to us of $2.5 million. As of June 30, 2014, we have not been required to make any payments pursuant to the guaranty. We may be required to make payments in the future, limited to the $2.5 million maximum liability, should EML fail to meet its obligations to the third party. However, to the extent that any payments are made by us under the guaranty, EML, in addition to other parties, have jointly and severally agreed to reimburse and indemnify us for any such payments. We have not recorded a liability relating to the guaranty as of June 30, 2014.
Lucky Friday Water Permit Matters
Over the last several years, the Lucky Friday unit has experienced several regulatory issues relating to its water discharge permits and water management more generally.
In late 2008 and early 2009, Hecla Limited experienced a number of alleged permit exceedances for water discharges at the Lucky Friday unit. These alleged violations resulted in Hecla Limited entering into a Consent Agreement and Final Order (“CAFO”) and a Compliance Order with the EPA in April 2009, which included an extended compliance timeline. In connection with the CAFO, Hecla Limited paid the maximum administrative penalty to the EPA of $177,500 to settle any liability for such alleged exceedances.
In 2009, additional alleged permit exceedances for water discharges at the Lucky Friday unit occurred. In 2010, alleged unpermitted discharges of pollutants occurred at the Lucky Friday unit. These alleged permit exceedances and certain alleged unpermitted discharges were the subject of a December 2010 notice of violation (“2010 NOV”) from the EPA informing Hecla Limited that the EPA was prepared to seek civil penalties for these alleged violations. Hecla Limited disputes many of EPA's assertions, but commenced negotiations with the EPA in 2010 in an attempt to resolve the matter. There has not yet been any resolution of the 2010 NOV.
In 2012, the Lucky Friday unit had two weekly water samples, one of which exceeded the permit concentration limit for lead (but not the associated load limit), and one of which exceeded the permit concentration limit for zinc (but not the associated load limit). Also, in late 2012, heavy rains resulted in alleged impacted storm water being discharged to a nearby river. After these incidents, in February 2013, the EPA issued a notice of violation and request for information to Hecla Limited alleging that the storm water incidents were each a violation of Hecla Limited's storm water permit. In March 2014, the Lucky Friday unit had a weekly water sample which exceeded the maximum daily permitted concentration limit for zinc (but not the associated load limit).
The EPA referred the two alleged 2012 permit exceedances, along with the alleged violations in the 2010 NOV and some additional alleged unpermitted discharges from 2010 that were not included in the 2010 NOV, to the U.S. Department of Justice to possibly file a civil complaint by the United States against Hecla Limited. In addition, it is possible that the United States may include other alleged unpermitted discharges (including the 2012 storm water incidents) or permit violations in any complaint. There is the potential for larger civil penalties in the context of a United States complaint than in an administrative action by the EPA such as the 2009 CAFO.
In December 2013, the EPA issued to Hecla Limited a notice of violation (“2013 NOV”) alleging certain storm water reporting violations under Lucky Friday’s Clean Water Act Multi-Sector General Stormwater Permit for Industrial Activities. The 2013 NOV also contains a request for information under Section 308 of the Clean Water Act directing Hecla Limited to undertake a comprehensive groundwater investigation of Lucky Friday’s tailings pond no. 3 to evaluate whether the pond is causing the discharge of pollutants via seepage to groundwater that is discharging to surface water. We cannot ascertain what impacts, if any, the 2013 NOV and request for information will have on the matters that were already pending with the United States, including the 2010 NOV.
Hecla Limited strives to maintain its water discharges at the Lucky Friday unit in full compliance with its permits and applicable laws; however, we cannot provide assurances that it will be able to fully comply with the permit limits and other regulatory requirements regarding water management in the future.
We believe that it is reasonably possible that Hecla Limited faces some liability for the above water issues; however, we cannot with reasonable certainty estimate the amount or range of any such liability because, among other reasons, we have not completed the report called for by the request for information contained in the 2013 NPOV, and we do not know what will be the impact of that report.
Johnny M Mine Area near San Mateo, McKinley County, New Mexico
In May 2011, the EPA made a formal request to Hecla Mining Company for information regarding the Johnny M Mine Area near San Mateo, McKinley County, New Mexico, and asserted that Hecla Mining Company may be responsible under CERCLA for environmental remediation and past costs the EPA has incurred at the site. Mining at the Johnny M was conducted for a limited period of time by a predecessor of our subsidiary, Hecla Limited. In August 2012, Hecla Limited and the EPA entered into a Settlement Agreement and Administrative Order on Consent for Removal Action (“Consent Decree”), pursuant to which Hecla Limited agreed to pay (i) $1.1 million to the EPA for its past response costs at the site and (ii) any future response costs at the site, in exchange for a covenant not to sue by the EPA. The Consent Decree also describes additional work at the site to be conducted by Hecla Limited. Hecla Limited paid the $1.1 million to the EPA for its past response costs in the fourth quarter of 2012. Hecla Limited cannot reasonably estimate the amount or range of any additional liability it may face at the site until, at a minimum, the amount and type of remediation required have been determined and EPA has determined whether to seek reimbursement for additional past costs, and if so in what amounts.
Carpenter Snow Creek Site, Cascade County, Montana
In July 2010, the EPA made a formal request to Hecla Mining Company for information regarding the Carpenter Snow Creek Superfund Site located in Cascade County, Montana. The Carpenter Snow Creek Site is located in a historic mining district, and in the early 1980s Hecla Limited leased 6 mining claims and performed limited exploration activities at the site. Hecla Limited terminated the mining lease in 1988.
In June 2011, the EPA informed Hecla Limited that it believes Hecla Limited, among several other viable companies, may be liable for cleanup of the site or for costs incurred by the EPA in cleaning up the site. The EPA stated in the June 2011 letter that it has incurred approximately $4.5 million in response costs and estimated that total remediation costs may exceed $100 million. Hecla Limited cannot with reasonable certainty estimate the amount or range of liability, if any, relating to this matter because of, among other reasons, the lack of information concerning the site.
South Dakota and Colorado Superfund Sites Related to CoCa Mines, Inc.
In 1991, Hecla Limited acquired all of the outstanding common stock of CoCa Mines, Inc. (“CoCa”). CoCa is alleged to have current or prior ownership interests, and engaged in exploration activities at each of Gilt Edge Mine in South Dakota and in the area adjacent to the Nelson Tunnel property in Creede, Colorado.
Gilt Edge Mine Superfund Site
In August 2008, the EPA made a formal request to CoCa for information regarding the Gilt Edge Mine Site located in Lawrence County, South Dakota, and asserted that CoCa may be liable for environmental cleanup at the site. The Gilt Edge Mine Site was explored and/or mined beginning in the 1870s. Beginning in the mid-1970s, CoCa held property interests at the site (primarily in the form of mining claims), and was party to an agreement with another mining company (the “operator”) that conducted a limited program of exploration work at the site. The two companies assigned the right to mine in 1983 to a third mining company, and by 1986 CoCa had divested itself of any property interests at the site.
In July 2010, the United States informed CoCa that it intended to pursue CoCa and other potentially responsible parties (“PRPs”) on a strict, joint and several basis for liability for past and future response costs incurred at Gilt Edge under CERCLA. Currently, the United States alleges that CoCa is liable based on its historical relationship to the site, and that CoCa has succeeded to the liabilities of one or more predecessor entities that may have held certain property interests at the site. Most of the other viable PRPs have settled with the United States. The operator of the exploration effort that CoCa was party to settled for $26 million, while the third mining company referred to above settled for $4.2 million.
The United States alleges that estimated total costs associated with the site may exceed $191 million, including both past and future response costs. We believe that it is reasonably possible that CoCa faces some liability under CERCLA based on its historical ownership interests at the site; however, we cannot with reasonable certainty estimate the amount or range of any such liability. Furthermore, in the event CoCa incurs a liability at this site, it has limited assets with which to satisfy any claim. Because of this, we believe that it is possible that the United States will seek to recover some of the alleged $191 million in costs associated with the site from Hecla Limited, as the sole stockholder of CoCa. We believe Hecla Limited has strong defenses and would vigorously defend against any such claim. Among other things, Hecla Limited did not acquire CoCa until 1991, well after CoCa discontinued its involvement with the Gilt Edge site. In addition, CoCa is and always has been a separate corporate entity from Hecla Limited. Therefore, we believe that Hecla Limited is not liable for any claims at the Gilt Edge site.
Settlement negotiations with the United States commenced in 2010 and are ongoing. Because of the unpredictability of settlement negotiations or the outcome of any trial, as well as the nature of CERCLA as a strict, joint and several liability statute, we cannot with reasonable certainty estimate the amount or range of liability faced by CoCa or Hecla Limited. Furthermore, there can be no assurance settlement negotiations will be successful, or that Hecla Limited will not incur a material liability with respect to this site.
Nelson Tunnel/Commodore Waste Rock Pile Superfund Site
In August 2009, the EPA made a formal request to CoCa for information regarding the Nelson Tunnel/Commodore Waste Rock Pile Superfund Site in Creede, Colorado. CoCa was involved in exploration and mining activities in Creede during the 1970s and the 1980s. In September 2013, the EPA made a formal claim against CoCa for past response costs under CERCLA as an owner/operator of the site, and against Hecla Limited as a corporate successor to CoCa. The EPA is seeking a total of approximately $5 million for past response costs, plus an undetermined amount of interest from CoCa, Hecla Limited, and other PRPs. The EPA stated that it is continuing its remedial investigation/feasibility study at the site, and once that is complete, it will begin remedial design and remedial action for the site. Presumably, the EPA will also seek reimbursement of at least some of those costs from viable PRPs. In April 2014, CoCa received notice from another PRP alleging that CoCa is required to indemnify it in connection with any liability it may have with respect to the Nelson/Commodore site. We believe that it is reasonably possible that CoCa faces some liability under CERCLA based on its historical ownership interests at the site. However, in the event CoCa incurs a liability for this site, it has limited assets with which to satisfy any claim. Because of this, we believe that it is possible that the United States will seek to recover some of the costs associated with the site from Hecla Limited, as the sole stockholder of CoCa. We believe Hecla Limited would have strong defenses to such a claim and would vigorously defend against any such claim. Among other things, Hecla Limited did not acquire CoCa until 1991, well after CoCa discontinued its historical activities in the vicinity of the site. In addition, CoCa is and always has been a separate corporate entity from Hecla Limited. Therefore, we believe that Hecla Limited is not liable for any claims at this site.
In sum, despite the potential for liability of CoCa or Hecla Limited at the site, we cannot with reasonable certainty estimate the amount or range of that liability because, among other things, there is little information known on EPA’s remediation plans for the site, as well as the unpredictability of settlement negotiations or the outcome of any trial. Thus, there can be no assurance that Hecla Limited will not incur a material liability with respect to this site.
Senior Notes
On April 12, 2013, we completed an offering of $500 million aggregate principal amount of 6.875% Senior Notes ("Notes") due 2021. The net proceeds from the offering of the Notes were used to partially fund the acquisition of Aurizon Mines Ltd. ("Aurizon") and for general corporate purposes, including expenses related to the Aurizon acquisition. In April and June 2014, we completed additional issuances of our Notes for aggregate principal amounts of $2.0 million and $3.0 million, respectively, which were contributed to our pension plan to partially satisfy the funding requirement for 2014. Interest on the Notes is payable on May 1 and November 1 of each year, commencing November 1, 2013. See Note 9 for more information.
Other Commitments
Our contractual obligations as of June 30, 2014 included approximately $5.1 million for various non-capital costs. In addition, our open purchase orders at June 30, 2014 included approximately $0.5 million, $2.4 million, and $1.7 million, respectively, for various capital items at the Casa Berardi, Greens Creek, and Lucky Friday units, and approximately $1.1 million, $0.5 million, and $0.8 million, respectively, for various non-capital costs at such units. We also have total commitments of approximately $21.4 million relating to scheduled payments on capital leases, including interest, primarily for equipment at our Greens Creek and Lucky Friday units (see Note 9 for more information). In addition, in 2011, we settled Hecla Limited's Coeur d'Alene Basin environmental litigation and related claims pursuant to a Consent Decree entered by the Court on September 8, 2011. Hecla Limited remains obligated under the Consent Decree to make a final payment of approximately $41.3 million (net of $14.1 million paid in July 2014) by August 2014, which would be funded by proceeds from our outstanding warrants, if exercised (see Note 8 for more information).
We had letters of credit for approximately $9.1 million outstanding as of June 30, 2014 for workers' compensation insurance bonding.
Other Contingencies
In March 2012, Hecla Limited received notice of a complaint filed against it by the United Steel Workers, Local 5114, with the Federal Mine Safety and Health Review Commission for compensation for bargaining unit workers at the Lucky Friday mine idled as a result of the temporary suspension of production at the mine. The complaint alleges the bargaining unit workers are entitled to compensation under Section 111 of the Federal Mine Safety and Health Act of 1977 from November 16, 2011 - the date an order was issued by the Mine Safety Health Administration (“MSHA”) to Hecla Limited - until June 12, 2013 - the date the order was terminated. We submitted a motion for summary decision to the administrative law judge within the Federal Mine Safety and Health Review Commission, which was denied in December 2012. Currently we are awaiting further proceedings. We believe the claim is without merit, and that all wages due under Section 111, which was an immaterial amount, have already been paid. Therefore, we have not recorded a liability relating to the claim as of June 30, 2014. The value of the union's claim is estimated to be in the range of $0 to $10 million.
On April 12, 2013, the family of Larry Marek, an employee of Hecla Limited who was fatally injured in an April 2011 accident, filed a lawsuit against us and certain of our officers and employees seeking damages for, among other claims, wrongful death and infliction of emotional distress. No dollar amount of damages is specified in the complaint, which was filed in state court in Idaho (Kootenai County District Court). We cannot reasonably predict the outcome of this matter, however, we believe the case is without merit and intend to vigorously defend this lawsuit.
On December 11, 2013, four employees of Hecla Limited who were injured in a December 2011 rock burst filed a lawsuit against us and certain of our employees seeking damages for, among other claims, intentional and willful injury and infliction of emotional distress. The plaintiffs seek damages in excess of $1,000,000, as claimed in the complaint, which was filed in state court in Idaho (Kootenai County District Court). We cannot reasonably predict the outcome of this matter, however, we believe the case is without merit and intend to vigorously defend this lawsuit.
We also have certain other contingencies resulting from litigation, claims and other commitments and are subject to a variety of environmental and safety laws and regulations incident to the ordinary course of business. We currently expect that the resolution of such contingencies will not materially affect our financial position, results of operations or cash flows. However, in the future, there may be changes to these contingencies, and additional contingencies may occur as well, any of which might result in an accrual or a change in the estimated accruals recorded by us, and there can be no assurance that their ultimate disposition will not have a material adverse effect on our financial position, results of operations or cash flows.
Note 5. Loss Per Common Share
We are authorized to issue 500,000,000 shares of common stock, $0.25 par value per share. At June 30, 2014, there were 350,156,592 shares of our common stock issued and 1,466,611 shares issued and held in treasury, for a net of 348,689,981 shares outstanding.
The following table reconciles weighted average common shares used in the computations of basic and diluted earnings per share for the three- and six-month periods ended June 30, 2014 and 2013 (thousands, except per-share amounts):
|
Three Months Ended |
Six Months Ended |
|||||||||||||||
|
2014 |
2013 |
2014 |
2013 |
|||||||||||||
|
Numerator |
||||||||||||||||
|
Net loss |
$ | (14,399 |
) |
$ | (24,858 |
) |
$ | (2,758 |
) |
$ | (13,764 |
) | ||||
|
Preferred stock dividends |
(138 |
) |
(138 |
) |
(276 |
) |
(276 |
) | ||||||||
|
Net loss applicable to common shares for basic and diluted earnings per share |
$ | (14,537 |
) |
$ | (24,996 |
) |
$ | (3,034 |
) |
$ | (14,040 |
) | ||||
|
Denominator |
||||||||||||||||
|
Basic weighted average common shares |
344,216 | 303,566 | 343,437 | 294,317 | ||||||||||||
|
Dilutive stock options and restricted stock |
— | — | — | — | ||||||||||||
|
Diluted weighted average common shares |
344,216 | 303,566 | 343,437 | 294,317 | ||||||||||||
|
Basic loss per common share |
||||||||||||||||
|
Net loss applicable to common shares |
$ | (0.04 |
) |
$ | (0.08 |
) |
$ | (0.01 |
) |
$ | (0.05 |
) | ||||
|
Diluted loss per common share |
||||||||||||||||
|
Net loss applicable to common shares |
$ | (0.04 |
) |
$ | (0.08 |
) |
$ | (0.01 |
) |
$ | (0.05 |
) | ||||
Diluted loss per share for the three- and six-month periods ended June 30, 2014 and 2013 excludes the potential effects of outstanding shares of our convertible preferred stock, as their conversion and exercise would have no effect on the calculation of dilutive shares.
For the three-month and six-month periods ended June 30, 2014 and 2013, all outstanding options, restricted share units, and warrants were excluded from the computation of diluted loss per share, as our reported net losses for those periods would cause their conversion and exercise to have no effect on the calculation of loss per share.
Note 6. Business Segments
We are currently organized and managed in three reporting segments: the Greens Creek unit, the Lucky Friday unit and the Casa Berardi unit. On June 1, 2013 we completed the acquisition of Aurizon, giving us 100% ownership of the Casa Berardi mine in Quebec, Canada. As a result, we added a new reporting segment for the Casa Berardi unit, and the information below reflects our ownership of the assets previously held by Aurizon as of the June 1, 2013 acquisition date.
General corporate activities not associated with operating units and their various exploration activities, as well as discontinued operations and idle properties, are presented as “other.” Interest expense, interest income and income taxes are considered general corporate items, and are not allocated to our segments.
The following tables present information about reportable segments for the three and six months ended June 30, 2014 and 2013 (in thousands):
|
Three Months Ended |
Six Months Ended June 30, |
|||||||||||||||
|
2014 |
2013 |
2014 |
2013 |
|||||||||||||
|
Net sales to unaffiliated customers: |
||||||||||||||||
|
Greens Creek |
$ | 55,449 | $ | 70,082 | $ | 119,045 | $ | 142,731 | ||||||||
|
Lucky Friday |
23,762 | 5,128 | 43,858 | 8,929 | ||||||||||||
|
Casa Berardi |
38,291 | 10,120 | 80,386 | 10,120 | ||||||||||||
| $ | 117,502 | $ | 85,330 | $ | 243,289 | $ | 161,780 | |||||||||
|
Income (loss) from operations: |
||||||||||||||||
|
Greens Creek |
$ | 8,804 | $ | 9,802 | $ | 19,850 | $ | 36,991 | ||||||||
|
Lucky Friday |
6,398 | (2,757 |
) |
11,098 | (6,604 |
) | ||||||||||
|
Casa Berardi |
996 | (13,356 |
) |
4,437 | (13,356 |
) | ||||||||||
|
Other |
(11,166 |
) |
(26,311 |
) |
(22,442 |
) |
(51,866 |
) | ||||||||
| $ | 5,032 | $ | (32,622 |
) |
$ | 12,943 | $ | (34,835 |
) | |||||||
The following table presents identifiable assets by reportable segment as of June 30, 2014 and December 31, 2013 (in thousands):
|
June 30, 2014 |
December 31, 2013 |
|||||||
|
Identifiable assets: |
||||||||
|
Greens Creek |
$ | 731,743 | $ | 744,027 | ||||
|
Lucky Friday |
335,468 | 313,793 | ||||||
|
Casa Berardi |
796,243 | 821,058 | ||||||
|
Other |
391,673 | 353,241 | ||||||
| $ | 2,255,127 | $ | 2,232,119 | |||||
Note 7. Employee Benefit Plans
We sponsor defined benefit pension plans covering substantially all U.S. employees. Net periodic pension cost for the plans consisted of the following for the three and six months ended June 30, 2014 and 2013 (in thousands):
|
Three Months Ended June 30, |
||||||||
|
2014 |
2013 |
|||||||
|
Service cost |
$ | 1,020 | $ | 1,058 | ||||
|
Interest cost |
1,186 | 969 | ||||||
|
Expected return on plan assets |
(1,249 |
) |
(1,205 |
) | ||||
|
Amortization of prior service cost |
(84 |
) |
98 | |||||
|
Amortization of net (gain) loss |
756 | 776 | ||||||
|
Net periodic pension cost |
$ | 1,629 | $ | 1,696 | ||||
|
Six Months Ended June 30, |
||||||||
|
2014 |
2013 |
|||||||
|
Service cost |
$ | 2,040 | $ | 2,115 | ||||
|
Interest cost |
2,372 | 1,939 | ||||||
|
Expected return on plan assets |
(2,498 |
) |
(2,409 |
) | ||||
|
Amortization of prior service cost |
(168 |
) |
195 | |||||
|
Amortization of net (gain) loss |
1,512 | 1,552 | ||||||
|
Net periodic pension cost |
$ | 3,258 | $ | 3,392 | ||||
In April and June 2014, we contributed aggregate principal amounts of $2.0 million and $3.0 million, respectively, of our Senior Notes to our defined benefit pension plan, and expect to contribute an additional $2.5 million aggregate principal amount, for a total of $7.5 million, in aggregate principal amount, over the course of 2014 (see Note 9 for more information). We expect to contribute approximately $0.3 million to our unfunded supplemental executive retirement plan in 2014.
Note 8. Shareholders’ Equity
Stock-based Compensation Plans
We periodically grant restricted stock unit awards and/or shares of common stock to our employees and directors. We measure compensation cost for restricted stock units and stock grants at the closing price of our stock at the time of grant. Restricted stock unit grants vest after a specified period with compensation cost amortized over that period. Although we have no current plans to issue stock options, we may do so in the future.
On March 3, 2014, the Board of Directors granted 1,345,072 restricted stock units to employees in payment of annual and long-term incentive compensation for the period ended December 31, 2013. The restricted stock units will be distributed in August 2014, and the $4.6 million in expense related to the unit awards was recognized as of December 31, 2013.
On June 25, 2014, the Board of Directors granted the following restricted stock unit awards to employees:
|
• |
1,251,213 restricted stock units, with one third of those vesting in June 2015, one third vesting in June 2016, and one third vesting in June 2017; |
|
• |
107,576 restricted stock units, with one half of those vesting in June 2015 and one half vesting in June 2016; and |
|
• |
87,872 restricted stock units that vest in June 2015. |
The $3.1 million in expense related to the unit awards discussed above vesting in 2015 will be recognized on a straight-line basis over the next twelve months, while the $1.7 million in expense related to awards vesting in 2016 and 2017 will be recognized over the next twenty-four and thirty-six month periods, respectively.
In the second quarter of 2014, a total of 150,378 shares of common stock were granted to nonemployee directors. We granted a total of 122,250 shares of common stock to nonemployee directors in the second quarter of 2013.
Stock-based compensation expense for restricted stock unit grants to employees and shares issued to nonemployee directors recorded in the first six months of 2014 totaled $2.6 million, compared to $1.9 million in the same period last year.
In connection with the vesting of restricted stock units, employees have in the past, at their election and when permitted by us, chosen to satisfy their minimum tax withholding obligations through net share settlement, pursuant to which the Company withholds the number of shares necessary to satisfy such withholding obligations. As a result, in the first quarter of 2014 we withheld 11,090 shares for approximately $40,000, or approximately $3.57 per share.
Common Stock Dividends
In September 2011 and February 2012, our Board of Directors adopted a common stock dividend policy that has two components: (1) a dividend that links the amount of dividends on our common stock to our average quarterly realized silver price in the preceding quarter, and (2) a minimum annual dividend of $0.01 per share of common stock, in each case, payable quarterly, when and if declared. For illustrative purposes only, the table below summarizes potential per share dividend amounts at different quarterly average realized price levels according to the first component of the policy:
|
Quarterly average realized silver price per ounce |
Quarterly dividend per share |
Annualized dividend per share |
||||||
| $30 | $0.01 | $0.04 | ||||||
| $35 | $0.02 | $0.08 | ||||||
| $40 | $0.03 | $0.12 | ||||||
| $45 | $0.04 | $0.16 | ||||||
| $50 | $0.05 | $0.20 | ||||||
| $55 | $0.06 | $0.24 | ||||||
| $60 | $0.07 | $0.28 |
On July 29, 2014, our Board of Directors declared a common stock dividend, pursuant to the minimum annual dividend component of the policy described above, of $0.0025 per share, for a total dividend of $0.9 million payable in September 2014. Because the average realized silver price for the second quarter of 2014 was $19.62 per ounce, below the minimum threshold of $30 according to the policy, no silver-price-linked component was declared or paid. The declaration and payment of common stock dividends is at the sole discretion of our Board of Directors.
Status of Warrants
At December 31, 2013, there were 22,307,623 common stock purchase warrants outstanding. During the first six months of 2014, 5,856,092 warrants were exercised for total proceeds of approximately $14.1 million. At June 30, 2014, there were 16,451,531 Series 3 stock purchase warrants outstanding having an exercise price of $2.45. Under the financial terms of the 2011 Consent Decree settling the Coeur d'Alene Basin environmental (CERCLA) litigation, the proceeds from the exercise of our outstanding warrants are paid to the United States and the Coeur d'Alene Indian Tribe within 30 days after the end of the quarter when exercised. Thus, in July 2014, we paid $14.1 million in warrant proceeds over to the United States and the Tribe. The remaining Series 3 warrants expire on August 10, 2014, and any proceeds received from their exercise will also be paid over as part of the settlement. To the extent the warrants are not exercised, we are responsible for the final payment under the Consent Decree.
Common Stock Repurchase Program
On May 8, 2012, we announced that our Board of Directors approved a stock repurchase program. Under the program, we are authorized to repurchase up to 20 million shares of our outstanding common stock from time to time in open market or privately negotiated transactions, depending on prevailing market conditions and other factors. The repurchase program may be modified, suspended or discontinued by us at any time. Whether or not we engage in repurchases from time to time may depend on a variety of factors, including not only price and cash resources, but customary black-out restrictions, whether we have any material inside information, limitations on share repurchases or cash usage that may be imposed by our credit agreement or in connection with issuances of securities, alternative uses for cash, applicable law, and other investment opportunities from time to time. As of June 30, 2014, a total of 934,100 shares have been purchased at an average price of $3.99 per share, including 533,800 shares purchased during the first six months of 2014 at an average price of $2.81 per share. As of June 30, 2014, there were approximately 19.1 million shares that may yet be purchased under the program. The closing price of our common stock at July 28, 2014, was $3.26 per share.
Note 9. Senior Notes, Credit Facilities, and Capital Leases
Senior Notes
On April 12, 2013, we completed an offering of $500 million in aggregate principal amount of our Senior Notes due May 1, 2021, in a private placement conducted pursuant to Rule 144A and Regulation S under the Securities Act of 1933, as amended, and in the first half of 2014, an additional $5 million aggregate principal amount of the notes were issued to our pension plan as described below (collectively, the “Notes”). The Notes are governed by the Indenture, dated as of April 12, 2013, as amended (the “Indenture”), among Hecla Mining Company ("Hecla") and certain of our subsidiaries and The Bank of New York Mellon Trust Company, N.A., as trustee. The net proceeds from the initial offering of the Notes ($490 million) were used to partially fund the acquisition of Aurizon and for general corporate purposes, including expenses related to the Aurizon acquisition.
In connection with the sale of the Notes, we entered into a Registration Rights Agreement, dated as of April 12, 2013, pursuant to which Hecla and the Guarantors agreed to exchange the Notes for a new issue of debt securities registered under the Securities Act, with terms substantially identical to those of the Notes (except with respect to certain transfer restrictions and certain obligations to pay special interest as described in the Notes). The exchange offer was completed in January 2014 with 99.99% of the Notes tendered for exchange.
The Notes are recorded net of a 2% initial purchaser discount totaling $10 million at the time of issuance and having an unamortized balance of $9.0 million as of June 30, 2014. The Notes bear interest at a rate of 6.875% per year from the date of original issuance or from the most recent payment date to which interest has been paid or provided for. Interest on the Notes is payable on May 1 and November 1 of each year, commencing November 1, 2013. During the first half of 2014, interest expense related to the notes and amortization of the initial purchaser discount and fees related to the issuance of the Notes, net of $5.6 million in capitalized interest, totaled $12.6 million.
The Notes are guaranteed on a senior unsecured basis by certain of our subsidiaries (the "Guarantors"). The Notes and the guarantees will be, respectively, Hecla's and the Guarantors' general senior unsecured obligations and will be subordinated to all of Hecla's and the Guarantors' existing and future secured debt to the extent of the assets securing that secured debt. In addition, the Notes will be effectively subordinated to all of the liabilities of Hecla's subsidiaries that are not guaranteeing the Notes, to the extent of the assets of those subsidiaries.
The Notes will be redeemable in whole or in part, at any time and from time to time on or after May 1, 2016, on the redemption dates and at the redemption prices specified in the Indenture, plus accrued and unpaid interest, if any, to the date of redemption. Prior to May 1, 2016, we may redeem some or all of the Notes at a redemption price of 100% of the principal amount, plus accrued and unpaid interest, if any, to the redemption date, plus a “make whole” premium. We may redeem up to 35% of the Notes before May 1, 2016 with the net cash proceeds from certain equity offerings.
Upon the occurrence of a change of control (as defined in the Indenture), each holder of Notes will have the right to require us to purchase all or a portion of such holder's Notes pursuant to a change of control offer (as defined in the Indenture), at a purchase price equal to 101% of the principal amount thereof plus accrued and unpaid interest, if any, to the date of purchase, subject to the rights of holders of the Notes on the relevant record date to receive interest due on the relevant interest payment date.
On April 14, 2014, we entered into an agreement with the Hecla Mining Company Retirement Plan Trust pursuant to which we agreed to contribute to the trust over the course of 2014 approximately $7.5 million in aggregate principal amount of the Notes in order to satisfy the funding requirement for our funded pension plan for 2014. On the same day we filed a registration statement with the SEC for resale of the Notes that we agreed to contribute to the trust. In April and June 2014, we contributed $2.0 million and $3.0 million, respectively, in aggregate principal amounts of the Notes to the trust.
Credit Facilities
In February 2014, we entered into a $100 million senior secured revolving credit facility having a maturity date of August 1, 2016. The credit facility is collateralized by the shares of common stock held in our material domestic subsidiaries and by our joint venture interests in the Greens Creek mine, all of our rights and interests in the joint venture agreement, and all of our rights and interests in the assets of the joint venture. This credit facility replaced our previous $100 million credit facility which had the same terms of collateral as described above. Below is information on the interest rates, standby fee, and financial covenant terms under our current credit facility:
|
Interest rates: |
||||
|
Spread over the London Interbank Offer Rate |
2.25 - 3.25% | |||
|
Spread over alternative base rate |
1.25 - 2.25% | |||
|
Standby fee per annum on undrawn amounts |
0.50% | |||
|
Covenant financial ratios: |
||||
| Senior leverage ratio (debt secured by liens/EBITDA) | not more than 2.50:1 | |||
| Leverage ratio (total debt less unencumbered cash/EBITDA) | not more than 4.00:1 | |||
| Interest coverage ratio (EBITDA/interest expense) | not more than 3.00:1 |
We were in compliance with all covenants under the credit agreement and no amounts were outstanding as of June 30, 2014. We have not drawn funds on the current revolving credit facility as of the filing date of this Form 10-Q.
Capital Leases
We have entered into various lease agreements, primarily for equipment at our Greens Creek and Lucky Friday units, which we have determined to be capital leases. At June 30, 2014, the total liability balance associated with capital leases, including certain purchase option amounts, was $20.5 million, with $8.4 million of the liability classified as current and the remaining $12.1 million classified as non-current. At December 31, 2013, the total liability balance associated with capital leases was $22.8 million, with $8.5 million of the liability classified as current and $14.3 million classified as non-current. The total obligation for future minimum lease payments was $21.4 million at June 30, 2014, with $0.9 million attributed to interest.
At June 30, 2014, the annual maturities of capital lease commitments, including interest, are (in thousands):
|
Twelve-month period ending June 30, |
||||||
|
2015 |
$ | 8,535 | ||||
|
2016 |
7,615 | |||||
|
2017 |
4,150 | |||||
|
2018 |
1,074 | |||||
|
Total |
21,374 | |||||
|
Less: imputed interest |
(903 |
) |
||||
|
Net capital lease obligation |
$ | 20,471 |
Note 10. Developments in Accounting Pronouncements
In July 2013, the FASB issued ASU No. 2013-11, which requires entities to present unrecognized tax benefits as a decrease in a net operating loss, similar tax loss, or tax credit carryforward if certain criteria are met. The guidance eliminated the diversity in practice in the presentation of unrecognized tax benefits but will not alter the way in which entities assess deferred tax assets for realizability. ASU No. 2013-11 is effective for annual and interim reporting periods beginning after December 15, 2013. Adoption of this guidance has not had a material impact on our consolidated financial statements.
In May 2014, the FASB issued ASU No. 2014-09 Revenue Recognition, replacing guidance currently codified in Subtopic 605-10 Revenue Recognition-Overall with various SEC Staff Accounting Bulletins providing interpretive guidance. The guidance establishes a new five step principle-based framework in an effort to significantly enhance comparability of revenue recognition practices across entities, industries, jurisdictions, and capital markets. ASU No. 2014-09 is effective for annual and interim reporting periods beginning after December 15, 2016. We are in the process of evaluating this guidance.
Note 11. Derivative Instruments
At times, we may use commodity forward sales commitments, commodity swap contracts and commodity put and call option contracts to manage our exposure to fluctuation in the prices of certain metals which we produce. Contract positions are designed to ensure that we will receive a defined minimum price for certain quantities of our production, thereby partially offsetting our exposure to fluctuations in the market. These instruments do, however, expose us to (i) credit risk in the event of non-performance by counterparties for contracts in which the contract price exceeds the spot price of a commodity and (ii) price risk to the extent that the spot price exceeds the contract price for quantities of our production contained under contract positions.
We are currently using financially-settled forward contracts to manage the exposure to changes in prices of silver, gold, zinc and lead contained in our concentrate shipments between the time of shipment and final settlement. In addition, we use financially-settled forward contracts to manage the exposure to changes in prices of zinc and lead (but not silver and gold) contained in our forecasted future concentrate shipments. These contracts do not qualify for hedge accounting and are marked-to-market through earnings each period. At June 30, 2014, we recorded the following balances related to these contracts:
|
• |
a current asset of $0.9 million which is included in other current assets and is net of $0.4 million in contracts in a fair value liability position; |
|
• |
a non-current asset of $0.1 million which included in other non-current assets and is net of $1 thousand in contracts in a fair value liability position; |
|
• |
a current liability of $1.2 million which is included in other current liabilities and is net of $1.9 million in contracts in a fair value asset position; and |
|
• |
a non-current liability of $1.5 million which is included in other non-current liabilities and is net of $2.4 million in contracts in a fair value asset position. |
We recognized a $3.5 million net loss during the first six months of 2014 on the contracts utilized to manage exposure to prices of metals in our concentrate shipments, which is included in sales of products. The net loss recognized on the contracts offsets gains related to price adjustments on our provisional concentrate sales due to changes to silver, gold, lead and zinc prices between the time of sale and final settlement.
We recognized a $2.1 million net loss during the first six months of 2014 on the contracts utilized to manage exposure to prices for forecasted future concentrate shipments, which is net of $2.0 million in gains realized on settled contracts. The net loss on these contracts is included as a separate line item under other income (expense), as they relate to forecasted future shipments, as opposed to sales that have already taken place but are subject to final pricing as discussed in the preceding paragraph. The net loss during the first six months of 2014 is the result of increasing zinc and lead prices. This program is designed to mitigate the impact of potential future declines in lead and zinc prices from the price levels established in the contracts (see average price information below).
The following tables summarize the quantities of metals committed under forward sales contracts at June 30, 2014 and December 31, 2013:
|
June 30, 2014 |
Ounces/pounds under contract (in 000's) |
Average price per ounce/pound |
||||||||||||||||||||||||||||||
|
Silver |
Gold |
Zinc |
Lead |
Silver |
Gold |
Zinc |
Lead |
|||||||||||||||||||||||||
|
(ounces) |
(ounces) |
(pounds) |
(pounds) |
(ounces) |
(ounces) |
(pounds) |
(pounds) |
|||||||||||||||||||||||||
|
Contracts on provisional sales |
||||||||||||||||||||||||||||||||
|
2014 settlements |
786 | 4 | 12,236 | 6,449 | $ | 18.90 | $ | 1,263 | $ | 0.95 | $ | 0.95 | ||||||||||||||||||||
|
Contracts on forecasted sales |
||||||||||||||||||||||||||||||||
|
2014 settlements |
— | — | 19,566 | 14,330 |
N/A |
N/A |
$ | 1.01 | $ | 1.09 | ||||||||||||||||||||||
|
2015 settlements |
— | — | 49,604 | 40,179 |
N/A |
N/A |
$ | 0.96 | $ | 1.07 | ||||||||||||||||||||||
|
2016 settlements |
— | — | 32,022 | 32,132 |
N/A |
N/A |
$ | 0.97 | $ | 1.03 | ||||||||||||||||||||||
|
2017 settlements |
— | — | 661 | — |
N/A |
N/A |
$ | 0.99 |
N/A |
|||||||||||||||||||||||
|
December 31, 2013 |
Ounces/pounds under contract (in 000's) |
Average price per ounce/pound |
||||||||||||||||||||||||||||||
|
Silver |
Gold |
Zinc |
Lead |
Silver |
Gold |
Zinc |
Lead |
|||||||||||||||||||||||||
|
(ounces) |
(ounces) |
(pounds) |
(pounds) |
(ounces) |
(ounces) |
(pounds) |
(pounds) |
|||||||||||||||||||||||||
|
Contracts on provisional sales |
||||||||||||||||||||||||||||||||
|
2014 settlements |
673 | 3 | 11,188 | 3,472 | $ | 19.50 | $ | 1,205 | $ | 0.89 | $ | 1.00 | ||||||||||||||||||||
|
Contracts on forecasted sales |
||||||||||||||||||||||||||||||||
|
2014 settlements |
— | — | 31,967 | 34,282 |
N/A |
N/A |
$ | 1.00 | $ | 1.04 | ||||||||||||||||||||||
|
2015 settlements |
— | — | 39,683 | 36,982 |
N/A |
N/A |
$ | 0.96 | $ | 1.07 | ||||||||||||||||||||||
|
2016 settlements |
— | — | 3,803 | 30,589 |
N/A |
N/A |
$ | 0.93 | $ | 1.03 | ||||||||||||||||||||||
Our concentrate sales are based on a provisional sales price containing an embedded derivative that is required to be separated from the host contract for accounting purposes. The host contract is the receivable from the sale of the concentrates at the forward price at the time of the sale. The embedded derivative, which relates to the change in price between sale and settlement, does not qualify for hedge accounting; therefore, it is adjusted to market through earnings each period prior to final settlement.
Note 12. Fair Value Measurement
The table below sets forth our assets and liabilities that were accounted for at fair value on a recurring basis and the fair value calculation input hierarchy level that we have determined applies to each asset and liability category (in thousands).
|
Description |
Balance at June 30, 2014 |
Balance at December 31, 2013 |
Input Hierarchy Level |
|||||||||
|
Assets: |
||||||||||||
|
Cash and cash equivalents: |
||||||||||||
|
Money market funds and other bank deposits |
$ | 222,083 | $ | 212,175 |
Level 1 |
|||||||
|
Available for sale securities: |
||||||||||||
|
Equity securities – mining industry |
7,466 | 7,019 |
Level 1 |
|||||||||
|
Trade accounts receivable: |
||||||||||||
|
Receivables from provisional concentrate sales |
21,033 | 17,672 |
Level 2 |
|||||||||
|
Restricted cash balances: |
||||||||||||
|
Certificates of deposit and other bank deposits |
883 | 5,217 |
Level 1 |
|||||||||
|
Derivative contracts: |
||||||||||||
|
Metal forward contracts |
995 | 4,461 |
Level 2 |
|||||||||
|
Total assets |
$ | 252,460 | $ | 246,544 | ||||||||
|
Liabilities: |
||||||||||||
|
Derivative contracts: |
||||||||||||
|
Metal forward contracts |
2,764 | — |
Level 2 |
|||||||||
Cash and cash equivalents consist primarily of money market funds and are valued at cost, which approximates fair value.
Current and non-current restricted cash balances consist primarily of certificates of deposit and U.S. Treasury securities and are valued at cost, which approximates fair value.
Our current and non-current available for sale securities consist of marketable equity securities of companies in the mining industry which are valued using quoted market prices for each security.
Trade accounts receivable include amounts due to us for shipments of concentrates and doré sold to smelters and refiners. Revenues and the corresponding accounts receivable for sales of metals products are recorded when title and risk of loss transfer to the customer (generally at the time of loading on truck or ship). Sales of concentrates are recorded using estimated forward prices for the anticipated month of settlement applied to our estimate of payable metal quantities contained in each shipment. Sales are recorded net of estimated treatment and refining charges, which are also impacted by changes in metals prices and quantities of contained metals. We estimate the prices at which sales of our concentrates will be settled due to the time elapsed between shipment and final settlement with the smelter. Receivables for previously recorded concentrate sales are adjusted to reflect estimated forward metals prices at the end of each period until final settlement by the smelter. We obtain the forward metals prices used each period from a pricing service. Changes in metal prices between shipment and final settlement result in changes to revenues previously recorded upon shipment. The embedded derivative contained in our concentrate sales is adjusted to fair market value through earnings each period prior to final settlement.
We use financially-settled forward contracts to manage the exposure to changes in prices of silver, gold, zinc and lead contained in our concentrate shipments that have not reached final settlement. We also use financially-settled forward contracts to manage the exposure to changes in prices of zinc and lead contained in our forecasted future concentrate shipments (see Note 11 for more information). These contracts do not qualify for hedge accounting, and are marked-to-market through earnings each period. The fair value of each contract represents the present value of the difference between the forward metal price for the contract settlement period as of the measurement date and the contract settlement metal price.
Our senior notes, which are not measured at fair value, had a fair value of $500.9 million and a carrying value of $496.4 million, net of unamortized initial purchaser discount, at June 30, 2014. Third-party quotes, which we consider to be Level 1 inputs, are utilized to estimate fair values of the senior notes. See Note 9 for more information.
Note 13. Guarantor Subsidiaries
Presented below are Hecla’s unaudited interim condensed consolidating financial statements as required by Rule 3-10 of Regulation S-X of the Securities Exchange Act of 1934, as amended, resulting from the guarantees by certain of Hecla's subsidiaries (the "Guarantors") of the Notes (see Note 9 for more information). The Guarantors consist of the following of Hecla's 100%-owned subsidiaries: Hecla Limited; Silver Hunter Mining Company; Rio Grande Silver, Inc.; RHL Holdings, Inc.; Hecla MC Subsidiary, LLC; Hecla Silver Valley, Inc.; Burke Trading, Inc.; Hecla Alaska LLC; Hecla Greens Creek Mining Company; Hecla Admiralty Company; and Hecla Juneau Mining Company. We completed the initial offering of the Notes on April 12, 2013, and a related exchange offer for virtually identical notes registered with the SEC on January 3, 2014.
The unaudited interim condensed consolidating financial statements below have been prepared from our financial information on the same basis of accounting as the unaudited interim consolidated financial statements. Investments in the subsidiaries are accounted for under the equity method. Accordingly, the entries necessary to consolidate Hecla and the Guarantors are reflected in the intercompany eliminations column. In the course of preparing consolidated financial statements, we eliminate the effects of various transactions conducted between Hecla's subsidiaries. While valid at an individual subsidiary level, such activities are eliminated in consolidation because, when taken as a whole, they do not represent business activity with third-party customers, vendors, and other parties. Examples of such eliminations include the following:
|
• |
Investments in subsidiaries. The acquisition of a company results in an investment on the records of the parent company and a contribution of capital on the records of the subsidiary. Such investments and capital contributions are eliminated in consolidation. |
|
• |
Capital contributions. Other of Hecla's subsidiaries do not generate cash flow, and their cash requirements are routinely met with inter-company advances from their parent companies. On an annual basis, the boards of directors of such parent companies declare contributions of capital to their subsidiary companies, which increase the parent's investment and the subsidiaries' additional paid-in capital. In consolidation, investments in subsidiaries and related additional paid-in capital are eliminated. |
|
• |
Deferred taxes. Our ability to realize deferred tax assets and liabilities is considered on a consolidated basis for subsidiaries within the United States, with all subsidiaries' estimated future taxable income contributing to the ability to realize all such assets and liabilities. However, when Hecla's subsidiaries are viewed independently, we use the separate return method to assess the realizability of each subsidiary's deferred tax assets and whether a valuation allowance is required against such deferred tax assets. In some instances, a parent company or subsidiary may possess deferred tax assets whose realization depends on the future taxable incomes of other subsidiaries on a consolidated-return basis, but would not be considered realizable if such parent or subsidiary filed on a separate stand-alone basis. In such a situation, a valuation allowance is assessed on that subsidiary's deferred tax assets, with the resulting adjustment reported in the eliminations column of the guarantor and parent's financial statements, as is the case in the financial statements set forth below. The separate return method can result in significant eliminations of deferred tax assets and liabilities and related income tax provisions and benefits. Non-current deferred tax asset balances are included in other non-current assets on the condensed consolidating balance sheets and make up a large portion of that item, particularly for the guarantor balances. |
Separate financial statements of the subsidiary guarantors are not presented because the guarantees by the guarantors are joint and several and full and unconditional, except for certain customary release provisions. These release provisions include: (1) the sale or disposal of all or substantially all of the assets of the guarantor; (2) the sale or other disposition of the capital stock of the guarantor; (3) the guarantor is designated as an unrestricted entity in accordance with the applicable provisions of the indenture; (4) the guarantor ceases to be a borrower as defined in the indenture; and (5) upon legal or covenant defeasance or satisfaction and discharge of the indenture.
Condensed Consolidating Balance Sheets
|
As of June 30, 2014 |
||||||||||||||||||||
|
Parent |
Guarantors |
Non-Guarantors |
Eliminations |
Consolidated |
||||||||||||||||
|
(in thousands) |
||||||||||||||||||||
|
Assets |
||||||||||||||||||||
|
Cash and cash equivalents |
$ | 160,374 | $ | 38,639 | $ | 23,070 | $ | — | $ | 222,083 | ||||||||||
|
Other current assets |
2,911 | 84,491 | 35,488 | 1,907 | 124,797 | |||||||||||||||
|
Properties, plants, and equipment - net |
1,280 | 1,070,673 | 746,679 | — | 1,818,632 | |||||||||||||||
|
Intercompany receivable (payable) |
475,113 | (75,243 |
) |
(387,124 |
) |
(12,746 |
) |
— | ||||||||||||
|
Investments in subsidiaries |
1,243,429 | — | — | (1,243,429 |
) |
— | ||||||||||||||
|
Other non-current assets |
9,744 | 160,560 | 6,923 | (87,612 |
) |
89,615 | ||||||||||||||
|
Total assets |
$ | 1,892,851 | $ | 1,279,120 | $ | 425,036 | $ | (1,341,880 |
) |
$ | 2,255,127 | |||||||||
|
Liabilities and Stockholders' Equity |
||||||||||||||||||||
|
Current liabilities |
$ | 22,502 | $ | 117,510 | $ | 22,189 | $ | (15,155 |
) |
$ | 147,046 | |||||||||
|
Long-term debt |
496,354 | 12,030 | 31 | — | 508,415 | |||||||||||||||
|
Non-current portion of accrued reclamation |
— | 48,169 | 8,799 | — | 56,968 | |||||||||||||||
|
Non-current deferred tax liability |
— | 11,901 | 236,837 | (83,296 |
) |
165,442 | ||||||||||||||
|
Other non-current liabilities |
32,612 | 4,386 | (1,125 |
) |
— | 35,873 | ||||||||||||||
|
Stockholders' equity |
1,341,383 | 1,085,124 | 158,305 | (1,243,429 |
) |
1,341,383 | ||||||||||||||
|
Total liabilities and stockholders' equity |
$ | 1,892,851 | $ | 1,279,120 | $ | 425,036 | $ | (1,341,880 |
) |
$ | 2,255,127 | |||||||||
|
As of December 31, 2013 |
||||||||||||||||||||
|
Parent |
Guarantors |
Non-Guarantors |
Eliminations |
Consolidated |
||||||||||||||||
|
(in thousands) |
||||||||||||||||||||
|
Assets |
||||||||||||||||||||
|
Cash and cash equivalents |
$ | 126,271 | $ | 40,009 | $ | 45,895 | $ | — | $ | 212,175 | ||||||||||
|
Other current assets |
4,795 | 75,083 | 33,129 | 18,453 | 131,460 | |||||||||||||||
|
Properties, plants, and equipment - net |
803 | 1,052,102 | 738,696 | — | 1,791,601 | |||||||||||||||
|
Intercompany receivable (payable) |
528,290 | (112,815 |
) |
(464,634 |
) |
49,159 | — | |||||||||||||
|
Investments in subsidiaries |
1,195,076 | — | — | (1,195,076 |
) |
— | ||||||||||||||
|
Other non-current assets |
5,249 |
|
164,563 | 11,115 | (84,044 |
) |
96,883 | |||||||||||||
|
Total assets |
$ | 1,860,484 | $ | 1,218,942 | $ | 364,201 | $ | (1,211,508 |
) |
$ | 2,232,119 | |||||||||
|
Liabilities and Stockholders' Equity |
||||||||||||||||||||
|
Current liabilities |
$ | 10,058 | $ | 117,421 | $ | 24,000 | $ | — |
|
$ | 151,479 | |||||||||
|
Long-term debt |
490,726 | 14,292 |
|
40 | — |
|
505,058 | |||||||||||||
|
Non-current portion of accrued reclamation |
— | 38,426 | 8,340 | — | 46,766 | |||||||||||||||
|
Non-current deferred tax liability |
— | 16,430 | 164,861 | (16,430 |
) |
164,861 | ||||||||||||||
|
Other non-current liabilities |
33,281 | 4,043 | 212 | — | 37,536 | |||||||||||||||
|
Stockholders' equity |
1,326,419 | 1,028,330 | 166,748 | (1,195,078 |
) |
1,326,419 | ||||||||||||||
|
Total liabilities and stockholders' equity |
$ | 1,860,484 | $ | 1,218,942 | $ | 364,201 | $ | (1,211,508 |
) |
$ | 2,232,119 | |||||||||
Condensed Consolidating Statements of Operations
|
Three Months Ended June 30, 2014 |
||||||||||||||||||||
|
Parent |
Guarantors |
Non-Guarantors |
Eliminations |
Consolidated |
||||||||||||||||
|
(in thousands) |
||||||||||||||||||||
|
Revenues |
$ | (3,454 |
) |
$ | 82,665 | $ | 38,291 | $ | — | $ | 117,502 | |||||||||
|
Cost of sales |
— | (43,217 |
) |
(27,822 |
) |
— | (71,039 |
) | ||||||||||||
|
Depreciation, depletion, amortization |
— | (19,280 |
) |
(8,455 |
) |
— | (27,735 |
) | ||||||||||||
|
General and administrative |
(4,529 |
) |
(3,221 |
) |
(409 |
) |
— | (8,159 |
) | |||||||||||
|
Exploration and pre-development |
(8 |
) |
(1,784 |
) |
(1,785 |
) |
— | (3,577 |
) | |||||||||||
|
Loss on derivative contracts |
(11,601 |
) |
— | — | — | (11,601 |
) | |||||||||||||
|
Equity in earnings of subsidiaries |
(81,189 |
) |
— | — | 81,189 | — | ||||||||||||||
|
Other (expense) income |
86,382 | 870 | (25,955 |
) |
(76,112 |
) |
(14,815 |
) | ||||||||||||
|
Income (loss) before income taxes |
(14,399 |
) |
16,033 | (26,135 |
) |
5,077 | (19,424 |
) | ||||||||||||
|
(Provision) benefit from income taxes |
— | (4,722 |
) |
(66,365 |
) |
76,112 | 5,025 | |||||||||||||
|
Net income (loss) |
(14,399 |
) |
11,311 | (92,500 |
) |
81,189 | (14,399 |
) | ||||||||||||
|
Preferred stock dividends |
(138 |
) |
— | — | — | (138 |
) | |||||||||||||
|
Income (loss) applicable to common stockholders |
(14,537 |
) |
11,311 | (92,500 |
) |
81,189 | (14,537 |
) | ||||||||||||
|
Net income (loss) |
(14,399 |
) |
11,311 | (92,500 |
) |
81,189 | (14,399 |
) | ||||||||||||
|
Changes in comprehensive income (loss) |
(2,188 |
) |
168 | (1,096 |
) |
928 | (2,188 |
) | ||||||||||||
|
Comprehensive income (loss) |
$ | (16,587 |
) |
$ | 11,479 | $ | (93,596 |
) |
$ | 82,117 | $ | (16,587 |
) | |||||||
|
Six Months Ended June 30, 2014 |
||||||||||||||||||||
|
Parent |
Guarantors |
Non-Guarantors |
Eliminations |
Consolidated |
||||||||||||||||
|
(in thousands) |
||||||||||||||||||||
|
Revenues |
$ | (3,473 |
) |
$ | 166,375 | $ | 80,387 | $ | — | $ | 243,289 | |||||||||
|
Cost of sales |
— | (93,150 |
) |
(55,630 |
) |
— | (148,780 |
) | ||||||||||||
|
Depreciation, depletion, amortization |
— | (36,501 |
) |
(17,037 |
) |
— | (53,538 |
) | ||||||||||||
|
General and administrative |
(9,159 |
) |
(6,229 |
) |
(712 |
) |
— | (16,100 |
) | |||||||||||
|
Exploration and pre-development |
(52 |
) |
(2,742 |
) |
(5,352 |
) |
— | (8,146 |
) | |||||||||||
|
Loss on derivative contracts |
(2,149 |
) |
— | — | — | (2,149 |
) | |||||||||||||
|
Equity in earnings of subsidiaries |
(63,486 |
) |
— | — | 63,486 | — | ||||||||||||||
|
Other (expense) income |
75,561 | 1,278 | (16,000 |
) |
(79,415 |
) |
(18,576 |
) | ||||||||||||
|
Income (loss) before income taxes |
(2,758 |
) |
29,031 | (14,344 |
) |
(15,929 |
) |
(4,000 |
) | |||||||||||
|
(Provision) benefit from income taxes |
— | (7,608 |
) |
(70,565 |
) |
79,415 | 1,242 | |||||||||||||
|
Net income (loss) |
(2,758 |
) |
21,423 | (84,909 |
) |
63,486 | (2,758 |
) | ||||||||||||
|
Preferred stock dividends |
(276 |
) |
— | — | — | (276 |
) | |||||||||||||
|
Income (loss) applicable to common stockholders |
(3,034 |
) |
21,423 | (84,909 |
) |
63,486 | (3,034 |
) | ||||||||||||
|
Net income (loss) |
(2,758 |
) |
21,423 | (84,909 |
) |
63,486 | (2,758 |
) | ||||||||||||
|
Changes in comprehensive income (loss) |
(838 |
) |
225 | 220 | (445 |
) |
(838 |
) | ||||||||||||
|
Comprehensive income (loss) |
$ | (3,596 |
) |
$ | 21,648 | $ | (84,689 |
) |
$ | 63,041 | $ | (3,596 |
) | |||||||
|
Three Months Ended June 30, 2013 |
||||||||||||||||||||
|
Parent |
Guarantors |
Non-Guarantors |
Eliminations |
Consolidated |
||||||||||||||||
|
(in thousands) |
||||||||||||||||||||
|
Revenues |
$ | 372 | $ | 74,838 | $ | 10,120 | $ | — | $ | 85,330 | ||||||||||
|
Cost of sales |
— | (51,777 |
) |
(8,231 |
) |
— | (60,008 |
) | ||||||||||||
|
Depreciation, depletion, amortization |
— | (16,887 |
) |
(3,324 |
) |
— | (20,211 |
) | ||||||||||||
|
General and administrative |
(3,993 |
) |
(3,137 |
) |
(352 |
) |
— | (7,482 |
) | |||||||||||
|
Exploration and pre-development |
(253 |
) |
(8,553 |
) |
(1,927 |
) |
— | (10,733 |
) | |||||||||||
|
Gain on derivative contracts |
6,541 | — | — | — | 6,541 | |||||||||||||||
|
Aurizon acquisition costs |
(10,650 |
) |
1,422 | (11,080 |
) |
— | (20,308 |
) | ||||||||||||
|
Equity in earnings of subsidiaries |
(13,625 |
) |
— | — | 13,625 | — | ||||||||||||||
|
Other (expense) income |
(3,250 |
) |
3,643 | (3,225 |
) |
(1,950 |
) |
(4,782 |
) | |||||||||||
|
Income (loss) before income taxes |
(24,858 |
) |
(451 |
) |
(18,019 |
) |
11,675 | (31,653 |
) | |||||||||||
|
Benefit from income taxes |
— | 211 | 6,321 | 263 | 6,795 | |||||||||||||||
|
Net income (loss) |
(24,858 |
) |
(240 |
) |
(11,698 |
) |
11,938 | (24,858 |
) | |||||||||||
|
Preferred stock dividends |
(138 |
) |
— | — | — | (138 |
) | |||||||||||||
|
Income (loss) applicable to common stockholders |
(24,996 |
) |
(240 |
) |
(11,698 |
) |
11,938 | (24,996 |
) | |||||||||||
|
Net income (loss) |
(24,858 |
) |
(240 |
) |
(11,698 |
) |
11,938 | (24,858 |
) | |||||||||||
|
Changes in comprehensive income (loss) |
(1,944 |
) |
4,257 | (1,425 |
) |
(2,832 |
) |
(1,944 |
) | |||||||||||
|
Comprehensive income (loss) |
$ | (26,802 |
) |
$ | 4,017 | $ | (13,123 |
) |
$ | 9,106 | $ | (26,802 |
) | |||||||
|
Six Months Ended June 30, 2013 |
||||||||||||||||||||
|
Parent |
Guarantors |
Non-Guarantors |
Eliminations |
Consolidated |
||||||||||||||||
|
(in thousands) |
||||||||||||||||||||
|
Revenues |
$ | 2,785 | $ | 148,875 | $ | 10,120 | $ | — | $ | 161,780 | ||||||||||
|
Cost of sales |
— | (88,602 |
) |
(8,231 |
) |
— | (96,833 |
) | ||||||||||||
|
Depreciation, depletion, amortization |
— | (30,894 |
) |
(3,324 |
) |
— | (34,218 |
) | ||||||||||||
|
General and administrative |
(7,465 |
) |
(6,547 |
) |
(409 |
) |
— | (14,421 |
) | |||||||||||
|
Exploration and pre-development |
(417 |
) |
(16,748 |
) |
(4,852 |
) |
— | (22,017 |
) | |||||||||||
|
Gain on derivative contracts |
28,080 | — | — | — | 28,080 | |||||||||||||||
|
Aurizon acquisition costs |
(14,148 |
) |
— | (11,452 |
) |
— | (25,600 |
) | ||||||||||||
|
Equity in earnings of subsidiaries |
(14,698 |
) |
— | — | 14,698 | |||||||||||||||
|
Other (expense) income |
(7,901 |
) |
1,943 | (3,957 |
) |
— | (9,915 |
) | ||||||||||||
|
Income (loss) before income taxes |
(13,764 |
) |
8,027 | (22,105 |
) |
14,698 | (13,144 |
) | ||||||||||||
|
(Provision) benefit from income taxes |
— | (5,254 |
) |
6,321 | (1,687 |
) |
(620 |
) | ||||||||||||
|
Net income (loss) |
(13,764 |
) |
2,773 | (15,784 |
) |
13,011 | (13,764 |
) | ||||||||||||
|
Preferred stock dividends |
(276 |
) |
— | — | — | (276 |
) | |||||||||||||
|
Income (loss) applicable to common stockholders |
(14,040 |
) |
2,773 | (15,784 |
) |
13,011 | (14,040 |
) | ||||||||||||
|
Net income (loss) |
(13,764 |
) |
2,773 | (15,784 |
) |
13,011 | (13,764 |
) | ||||||||||||
|
Changes in comprehensive income (loss) |
(4,775 |
) |
3,830 | (3,830 |
) |
— | (4,775 |
) | ||||||||||||
|
Comprehensive income (loss) |
$ | (18,539 |
) |
$ | 6,603 | $ | (19,614 |
) |
$ | 13,011 | $ | (18,539 |
) | |||||||
Condensed Consolidating Statements of Cash Flows
|
Six Months Ended June 30, 2014 |
||||||||||||||||||||
|
Parent |
Guarantors |
Non-Guarantors |
Eliminations |
Consolidated |
||||||||||||||||
|
(in thousands) |
||||||||||||||||||||
|
Cash flows from operating activities |
$ | 10,632 | $ | 46,829 | $ | (2,006 |
) |
$ | 1,574 |
|
$ | 57,029 | ||||||||
|
Cash flows from investing activities: |
||||||||||||||||||||
|
Additions to properties, plants, and equipment |
(736 |
) |
(32,891 |
) |
(23,834 |
) |
— | (57,461 |
) | |||||||||||
|
Other investing activities, net |
— | 238 | 4,334 | — |
|
4,572 | ||||||||||||||
|
Cash flows from financing activities: |
||||||||||||||||||||
|
Dividends paid to stockholders |
(1,991 |
) |
— | — | — | (1,991 |
) | |||||||||||||
|
Borrowings on debt |
— | — | — | — | — | |||||||||||||||
|
Payments on debt |
— | (4,525 |
) |
— | — | (4,525 |
) | |||||||||||||
|
Other financing activity |
26,198 | (11,021 |
) |
(1,569 |
) |
(1,574 | ) | 12,034 | ||||||||||||
|
Effect of exchange rate changes on cash |
— | — | 250 | — | 250 | |||||||||||||||
|
Changes in cash and cash equivalents |
34,103 | (1,370 |
) |
(22,825 |
) |
— | 9,908 | |||||||||||||
|
Beginning cash and cash equivalents |
126,271 | 40,009 | 45,895 | — | 212,175 | |||||||||||||||
|
Ending cash and cash equivalents |
$ | 160,374 | $ | 38,639 | $ | 23,070 | $ | — | $ | 222,083 | ||||||||||
|
Six Months Ended June 30, 2013 |
||||||||||||||||||||
|
Parent |
Guarantors |
Non-Guarantors |
Eliminations |
Consolidated |
||||||||||||||||
|
(in thousands) |
||||||||||||||||||||
|
Cash flows from operating activities |
$ | (7,524 |
) |
$ | 54,148 | $ | (36,349 |
) |
$ | — | $ | 10,275 | ||||||||
|
Cash flows from investing activities: |
||||||||||||||||||||
|
Additions to properties, plants, and equipment |
(229 |
) |
(54,128 |
) |
(5,934 |
) |
— | (60,291 |
) | |||||||||||
|
Acquisition of Aurizon Mines |
(498,705 |
) |
177,588 | — | (321,117 |
) | ||||||||||||||
|
Other investing activities, net |
— | 102 | (3,888 |
) |
— | (3,786 |
) | |||||||||||||
|
Cash flows from financing activities: |
||||||||||||||||||||
|
Dividends paid to stockholders |
(4,553 |
) |
— | — | — | (4,553 |
) | |||||||||||||
|
Borrowings on debt |
490,000 | — | — | — | 490,000 | |||||||||||||||
|
Payments on debt |
— | (3,425 |
) |
— | — | (3,425 |
) | |||||||||||||
|
Other financing activity |
(2,706 |
) |
1,681 | (687 |
) |
— | (1,712 |
) | ||||||||||||
|
Changes in cash and cash equivalents |
(23,717 |
) |
(1,622 |
) |
130,730 | — | 105,391 | |||||||||||||
|
Beginning cash and cash equivalents |
132,266 | 57,075 | 1,643 | — | 190,984 | |||||||||||||||
|
Ending cash and cash equivalents |
$ | 108,549 | $ | 55,453 | $ | 132,373 | $ | — | $ | 296,375 | ||||||||||
Item 2. Management's Discussion and Analysis of Financial Condition and Results of Operations
Certain statements contained in this Form 10-Q, including in Management’s Discussion and Analysis of Financial Condition and Results of Operations and Quantitative and Qualitative Disclosure About Market Risk, are intended to be covered by the safe harbor provided for under Section 27A of the Securities Act of 1933, as amended, and Section 21E of the Securities Exchange Act of 1934, as amended. Our forward-looking statements include our current expectations and projections about future results, performance, results of litigation, prospects and opportunities, including reserves and other mineralization. We have tried to identify these forward-looking statements by using words such as “may,” “will,” “expect,” “anticipate,” “believe,” “intend,” “feel,” “plan,” “estimate,” “project,” “forecast” and similar expressions. These forward-looking statements are based on information currently available to us and are expressed in good faith and believed to have a reasonable basis. However, our forward-looking statements are subject to a number of risks, uncertainties and other factors that could cause our actual results, performance, prospects or opportunities to differ materially from those expressed in, or implied by, these forward-looking statements.
These risks, uncertainties and other factors include, but are not limited to, those set forth under Part I, Item 1A – Business – Risk Factors in our annual report filed on Form 10-K for the year ended December 31, 2013. Given these risks and uncertainties, readers are cautioned not to place undue reliance on our forward-looking statements. All subsequent written and oral forward-looking statements attributable to Hecla Mining Company or to persons acting on our behalf are expressly qualified in their entirety by these cautionary statements. Except as required by federal securities laws, we do not intend to update or revise any forward-looking statements, whether as a result of new information, future events or otherwise.
Overview
Hecla Mining Company and its subsidiaries have provided precious and base metals to the U.S. and worldwide since 1891. We discover, acquire, develop, and produce silver, gold, lead and zinc.
We produce lead, zinc and bulk concentrates, which we sell to custom smelters, and unrefined bullion bars (doré) containing gold and silver, which are further refined before sale to precious metals traders. We are organized and managed into three segments that encompass our operating units: the Greens Creek, Lucky Friday, and Casa Berardi. The map below shows the locations of our operating units and our exploration and pre-development projects, as well as our corporate offices located in Coeur d'Alene, Idaho and Vancouver, British Columbia.

Our current business strategy is to focus our financial and human resources in the following areas:
|
• |
operating our properties safely, in an environmentally responsible manner, and cost-effectively; |
|
• |
optimizing and improving operations at our Casa Berardi unit, which, along with other mineral interests, was obtained with the acquisition of Aurizon Mines Ltd. ("Aurizon") as discussed further below; |
|
• |
expanding our reserves and production capacity at our operating properties; |
|
• |
maintaining and investing in exploration and pre-development projects in the vicinities of five mining districts we believe to be under-explored and under-invested: North Idaho's Silver Valley in the historic Coeur d'Alene Mining District; our Greens Creek unit on Alaska's Admiralty Island located near Juneau; the silver-producing district near Durango, Mexico; the Abitibi region of north-western Quebec, Canada; and the Creede district of Southwestern Colorado; and |
|
• |
continuing to seek opportunities to acquire and invest in mining properties and companies. Examples include our acquisition of Aurizon and minority investments in certain exploration stage companies in 2012 and 2013. |
A number of key factors may impact the execution of our strategy, including regulatory issues and metals prices. Metals prices can be very volatile. As discussed in the Critical Accounting Estimates section below, metals prices are influenced by a number of factors beyond our control. Average market prices of silver, gold, and lead in the first six months of 2014 were lower than their levels from the comparable period last year, while average zinc prices were higher compared to the first six months of 2013, as illustrated by the table in Results of Operations below. We believe current global economic and industrial trends could result in demand growth for the metals we produce. However, prices have been volatile over the last five years and there can be no assurance that current prices will continue.
On June 1, 2013, we completed the acquisition of all of the issued and outstanding common shares of Aurizon for total consideration of CAD$740.8 million (US$714.5 million). The acquisition gave us 100% ownership of the producing Casa Berardi gold mine, along with interests in various gold exploration properties in the Abitibi region of northwestern Quebec, Canada. The acquisition has significantly increased our gold production and gives us ownership of an operating gold mine with significant gold reserves, and provides access to a large land package with known mineralization. Nonetheless, we are faced with the challenge of continuing the integration of, and the operating responsibility for, Casa Berardi and other Aurizon projects. In addition, as further discussed in Item 3. Quantitative and Qualitative Disclosures About Market Risk, the acquisition has increased our exposure to risks associated with exchange fluctuations between the U.S. dollar and Canadian dollar. The acquisition was partially funded by $490 million in net proceeds from our issuance of Senior Notes in April 2013 (see Note 9 of Notes to Condensed Consolidated Financial Statements (Unaudited)). As discussed in the Financial Liquidity and Capital Resources section below, we believe that we will be able to meet the obligations associated with the acquisition of Aurizon and additional debt; however, a number of factors could impact our ability to meet the debt obligations and fund our other projects.
As further discussed in the Lucky Friday Segment section below, we are in the process of constructing an internal shaft at the Lucky Friday mine (“#4 Shaft”), which, we believe, will significantly increase production and extend the life of the mine. The #4 Shaft project will involve significant additional capital costs during the periods leading up to its expected completion date in 2016. Although we believe that our current capital resources will allow us to complete the #4 Shaft project, there are a number of factors that could affect its completion.
We strive to achieve excellent mine safety and health performance. We seek to realize these goals by: training employees in safe work practices; establishing, following and improving safety standards; investigating accidents, incidents and losses to avoid recurrence; involving employees in the establishment of safety standards; and participating in the National Mining Association's CORESafety program. We attempt to implement reasonable best practices with respect to mine safety and emergency preparedness. See Part I, Item 1A. Risk Factors of our annual report filed on Form 10-K for the year ended December 31, 2013 and the Lucky Friday Segment section below for information on accidents and other events that involved operations at our Lucky Friday unit. We work with the Mine Safety and Health Administration ("MSHA") to address issues outlined in the investigations of these incidents and continue to evaluate our safety practices.
Another challenge we face is the risk associated with environmental litigation and ongoing reclamation activities. As described in Part I, Item 1A. Risk Factors of our annual report filed on Form 10-K for the year ended December 31, 2013 and Note 4 of Notes to Condensed Consolidated Financial Statements (Unaudited), it is possible that our estimate of these liabilities (and our ability to estimate liabilities in general) may change in the future, affecting our strategic plans. We are involved in various environmental legal matters with no assurance that the estimate of our environmental liabilities, liquidity needs, or strategic plans will not be significantly impacted as a result of these matters or new matters that may arise. We strive to ensure that our activities are conducted in compliance with applicable laws and regulations and attempt to resolve environmental litigation on the most favorable terms possible.
Results of Operations
Sales of products by metal for the three- and six-month periods ended June 30, 2014 and 2013 were as follows:
|
Three Months Ended June 30, |
Six Months Ended June 30, |
|||||||||||||||
|
(in thousands) |
2014 |
2013 |
2014 |
2013 |
||||||||||||
|
Silver |
$ | 43,490 | $ | 37,655 | $ | 87,373 | $ | 83,650 | ||||||||
|
Gold |
52,283 | 27,421 | 109,368 | 43,607 | ||||||||||||
|
Lead |
17,236 | 12,926 | 32,094 | 22,229 | ||||||||||||
|
Zinc |
18,376 | 20,752 | 42,653 | 35,717 | ||||||||||||
|
Less: smelter charges |
(13,883 |
) |
(13,424 |
) |
(28,199 |
) |
(23,423 |
) | ||||||||
|
Sales of products |
$ | 117,502 | $ | 85,330 | $ | 243,289 | $ | 161,780 | ||||||||
For the second quarter and first six months of 2014, we recorded losses applicable to common shareholders of $14.5 million ($0.04 per basic common share) and $3.0 million ($0.01 per basic common share), respectively, compared to losses applicable to common shareholders of $25.0 million ($0.08 per basic common share) and $14.0 million ($0.05 per basic common share) for the second quarter and first six months of 2013, respectively. The following factors contributed to the results for the second quarter and first six months of 2014 compared to the same periods in 2013:
|
• |
Higher average realized prices for silver, gold, lead, and zinc for the second quarter of 2014 compared to the corresponding period of 2013, and higher realized lead and zinc prices for the first half of 2014 compared to the first half of 2013. However, average realized silver and gold prices for the the six-month period in 2014 were lower than in 2013. These price variances are illustrated in the table below. |
|
Three Months Ended |
Six Months Ended June 30, |
||||||||||||||||
|
2014 |
2013 |
2014 |
2013 |
||||||||||||||
|
Silver – |
London PM Fix ($/ounce) |
$ | 19.62 | $ | 23.11 | $ | 20.06 | $ | 26.59 | ||||||||
|
Realized price per ounce |
$ | 19.62 | $ | 16.27 | $ | 19.83 | $ | 21.41 | |||||||||
|
Gold – |
London PM Fix ($/ounce) |
$ | 1,288 | $ | 1,414 | $ | 1,291 | $ | 1,522 | ||||||||
|
Realized price per ounce |
$ | 1,291 | $ | 1,245 | $ | 1,295 | $ | 1,362 | |||||||||
|
Lead – |
LME Final Cash Buyer ($/pound) |
$ | 0.95 | $ | 0.93 | $ | 0.95 | $ | 0.99 | ||||||||
|
Realized price per pound |
$ | 1.00 | $ | 0.93 | $ | 0.99 | $ | 0.98 | |||||||||
|
Zinc – |
LME Final Cash Buyer ($/pound) |
$ | 0.94 | $ | 0.83 | $ | 0.93 | $ | 0.88 | ||||||||
|
Realized price per pound |
$ | 0.94 | $ | 0.84 | $ | 0.92 | $ | 0.88 | |||||||||
Average realized prices can differ from average market prices primarily because concentrate sales are generally recorded as revenues at the time of shipment at forward prices for the estimated month of settlement, which differ from average market prices. Due to the time elapsed between shipment of concentrates and final settlement with the smelters, we must estimate the prices at which sales of our metals will be settled. Previously recorded sales are adjusted to estimated settlement metals prices each period through final settlement. For the second quarter and first six months of 2014, we recorded net negative price adjustments to provisional settlements of $0.2 million and $0.9 million, respectively, compared to net negative price adjustments to provisional settlements of $15.1 million and $17.8 million, respectively, in the second quarter and first six months of 2013. The price adjustments related to zinc and lead contained in our concentrate shipments were largely offset by gains and losses on forward contracts for those metals for each period. For the second quarter and first six months of 2014, the price adjustments related to silver and gold contained in our concentrate shipments were also partially offset by gains and losses on forward contracts for those metals, which we began using for those metals in July 2013 (see Note 11 of Notes to Condensed Consolidated Financial Statements (Unaudited) for more information). The gains and losses on these contracts are included in revenues and impact the realized prices for silver, gold, lead and zinc. Realized prices are calculated by dividing gross revenues for each metal (which include the price adjustments and gains and losses on the forward contracts discussed above) by the payable quantities of each metal included in concentrate and doré shipped during the period.
|
• |
Increased gross profit at our Lucky Friday and Casa Berardi units of $12.2 million and $3.4 million, respectively, for the second quarter of 2014, and by $19.2 million and $9.2 million, respectively, for the first six months of 2014 compared to the same periods in 2013. This was partially offset by lower gross profit at our Greens Creek unit in the second quarter and first six months of 2014 by $2.0 million and $18.1 million, respectively, compared to the same periods in 2013. See The Greens Creek Segment, The Lucky Friday Segment, and The Casa Berardi Segment sections below. |
|
• |
Costs related to the acquisition of Aurizon completed on June 1, 2013, of $20.3 million and $25.6 million, respectively, recognized during the second quarter and first six months of 2013, with no comparable costs in 2014. |
|
• |
Lower exploration and pre-development costs by $7.2 million and $13.9 million for the second quarter and first half of 2014, respectively, compared to the same periods in 2013. The decrease is primarily the result of reduced discretionary spending in response to lower metals prices. "Pre-development costs" are costs incurred in the exploration stage that may ultimately benefit production, such as underground ramp development, which are expensed due to the lack of proven and probable reserves. |
Other significant variances affecting the comparison of our income applicable to common shareholders for the second quarter and first six months of 2014 to the same periods in 2013 were as follows:
|
• |
$11.6 million and $2.1 million of losses on base metal derivatives contracts for the second quarter and first half of 2014, respectively, compared to gains of $6.5 million and $28.1 million for the same periods in 2013. The gains and losses are related to financially-settled forward contracts on forecasted zinc and lead production as a part of a risk management program. The losses in the first half of 2014 are net of $2.0 million in gains realized on settled contracts. The gains in the first half of 2013 include $7.2 million in gains realized on settled contracts. See Item 3. Quantitative and Qualitative Disclosures About Market Risk - Commodity-Price Risk Management for more information on our derivatives contracts. |
|
• |
Interest expense, net of amount capitalized, of $7.0 million and $13.8 million, respectively, during the three- and six-month periods ended June 30, 2014 compared to $6.5 million and $7.2 million, respectively, for the same periods in 2013. The increase for the six-month period is due to the issuance of senior notes in April 2013, with the net proceeds used to partially fund the acquisition of Aurizon (see Notes 9 of Notes to Condensed Consolidated Financial Statements (Unaudited)). |
|
• |
Net foreign exchange losses in the second quarter and first half of 2014 of $5.4 million and $1.2 million, respectively, versus a net loss of $0.1 million in the second quarter of 2013 and a net gain of $0.4 million in the first half of 2013. The acquisition of Aurizon has resulted in increased exposure to exchange fluctuations between the U.S. dollar and Canadian dollar. |
|
• |
Income related to the temporary suspension of operations at the Lucky Friday mine of $2.8 million and $1.3 million in the second quarter and first six months of 2013, respectively, with no comparable income for the same periods of 2014. The income in the 2013 periods is the result of business interruption insurance proceeds. As discussed further in The Lucky Friday Segment section below, production resumed at the Lucky Friday mine in February 2013. |
|
• |
$5.0 million and $1.2 million of income tax benefits for the three- and six-month periods ended June 30, 2014, respectively, compared to an income tax benefit of $6.8 million and and income tax provision of $0.6 million for the same 2013 periods, with the variance primarily due to discrete tax adjustments recognized in the second quarter of 2013 related to the acquisition of Aurizon. See the Corporate Matters section below for more information. |
The Greens Creek Segment
|
Dollars are in thousands (except per ounce and per ton amounts) |
Three Months Ended |
Six Months Ended |
||||||||||||||
|
2014 |
2013 |
2014 |
2013 |
|||||||||||||
|
Sales |
$ | 55,449 | $ | 70,082 | $ | 119,045 | $ | 142,731 | ||||||||
|
Cost of sales and other direct production costs |
(28,379 |
) |
(43,242 |
) |
(65,116 |
) |
(75,275 |
) | ||||||||
|
Depreciation, depletion and amortization |
(16,960 |
) |
(14,743 |
) |
(31,986 |
) |
(27,422 |
) | ||||||||
|
Gross profit |
$ | 10,110 | $ | 12,097 | $ | 21,943 | $ | 40,034 | ||||||||
|
Tons of ore milled |
201,146 | 211,755 | 403,861 | 409,578 | ||||||||||||
|
Production: |
||||||||||||||||
|
Silver (ounces) |
1,689,183 | 2,018,961 | 3,476,320 | 3,799,485 | ||||||||||||
|
Gold (ounces) |
14,931 | 15,486 | 29,940 | 29,175 | ||||||||||||
|
Zinc (tons) |
15,288 | 15,538 | 30,329 | 29,610 | ||||||||||||
|
Lead (tons) |
5,044 | 5,778 | 9,869 | 10,613 | ||||||||||||
|
Payable metal quantities sold: |
||||||||||||||||
|
Silver (ounces) |
1,435,602 | 2,131,747 | 2,981,225 | 3,625,044 | ||||||||||||
|
Gold (ounces) |
10,873 | 14,519 | 22,381 | 24,510 | ||||||||||||
|
Zinc (tons) |
8,153 | 11,908 | 20,261 | 19,793 | ||||||||||||
|
Lead (tons) |
4,194 | 5,957 | 7,817 | 9,757 | ||||||||||||
|
Ore grades: |
||||||||||||||||
|
Silver ounces per ton |
12.03 | 13.72 | 12.24 | 13.24 | ||||||||||||
|
Gold ounces per ton |
0.12 | 0.12 | 0.12 | 0.12 | ||||||||||||
|
Zinc percent |
8.6 |
% |
8.8 |
% |
8.6 |
% |
8.6 |
% | ||||||||
|
Lead percent |
3.3 |
% |
3.7 |
% |
3.2 |
% |
3.5 |
% | ||||||||
|
Mining cost per ton |
$ | 73.09 | $ | 65.00 | $ | 69.98 | $ | 68.45 | ||||||||
|
Milling cost per ton |
$ | 31.07 | $ | 32.98 | $ | 29.29 | $ | 35.26 | ||||||||
|
Total Cash Cost, After By-product Credits, Per Silver Ounce (1) |
$ | 3.52 | $ | 2.71 | $ | 2.52 | $ | 3.79 | ||||||||
|
(1) |
A reconciliation of this non-GAAP measure to cost of sales and other direct production costs and depreciation, depletion and amortization, the most comparable GAAP measure, can be found below in Reconciliation of Cash Cost, Before By-product Credits and Cash Cost, After By-product Credits (non-GAAP) to Costs of Sales and Other Direct Production Costs and Depreciation, Depletion and Amortization (GAAP). |
The $2.0 million and $18.1 million decreases in gross profit during the second quarter and first six months of 2014, respectively, compared to the same 2013 periods were primarily the result of lower sales volume driven by lower silver and lead ore grades, slightly offset by higher average prices in the second quarter of 2014. Sales volume was down due to lower precious metals production, and the timing of a zinc concentrate parcel scheduled for the second quarter of 2014 that will not be shipped until August. In addition, gross profit at Greens Creek was affected by negative price adjustments to revenues of $0.1 million and $0.4 million for the second quarter and first six months of 2014, respectively, compared to negative price adjustments of $14.6 million and $17.3 million for the second quarter and first six months of 2013, respectively. Price adjustments to revenues result from changes in metals prices between time of shipment and final settlements during the period. The price adjustments related to zinc and lead contained in concentrate shipments were largely offset by gains and losses on forward contracts for those metals for each period. The price adjustments related to silver and gold were also offset by gains and losses on forward contracts in the 2014 periods, as we initiated a forward contract program for those metals in July 2013 (see Note 11 of Notes to Condensed Consolidated Financial Statements (Unaudited) for more information).
Mining costs per ton increased 12% and 2% in the second quarter and first six months of 2014, respectively, compared to the same periods in 2013, primarily due to reduced ore volume and higher labor costs. Milling costs per ton decreased 6% and 17% in the second quarter and first six months of 2014, respectively, compared to the same periods in 2013. The decrease in milling costs was primarily the result of higher availability of less expensive hydroelectric power, the result of higher precipitation levels in Southeastern Alaska. When weather conditions are favorable to maintain lake water levels, the mine relies less on more expensive diesel generated power. Both mining and milling costs were impacted by an increase in hourly labor costs.
Depreciation, depletion and amortization expense was 15% and 17% more in the second quarter and first six months of 2014, respectively, compared to the same periods in 2013. This was attributable primarily to higher base metal production value in 2014, as silver equivalent production is the primary driver of units-of-production depreciation.
The chart below illustrates the factors contributing to the variances in Cash Cost, After By-product Credits, Per Silver Ounce for the second quarter and first six months of 2014 compared to the same periods of 2013.
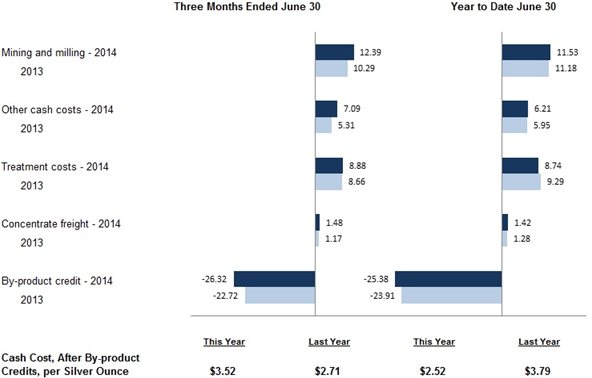
As set forth above, Cash Cost, After By-product Credits, per Silver Ounce in the second quarter of 2014 was $3.52, consisting of $29.84 of Cash Cost, Before By-product Credits, per Silver Ounce and $26.32 per ounce of by-product credits, compared to $2.71, consisting of $25.43 of Cash Cost, Before By-product Credits, per Silver Ounce and $22.72 per ounce of by-product credits for the same period in 2013. The Cash Cost, After By-product Credits, per Silver Ounce in the first six months of 2014 was $2.52, consisting of $27.90 of Cash Cost, Before By-product Credits, per Silver Ounce and $25.38 per ounce of by-product credits, compared to $3.79, consisting of $27.70 of Cash Cost, Before By-product Credits, per Silver Ounce and $23.91 per ounce of by-product credits, for the first six months of 2013. The increase in Cash Cost, After By-product Credits, per Silver Ounce for the second quarter was the result of lower silver production attributable to lower ore volumes and silver grades. The decrease in Cash Cost, After By-product Credits, per Silver Ounce for the first six months was due to lower electrical power and treatment costs, offset slightly by higher labor costs.
Mining and milling cost per ounce increased in the second quarter and first six months of 2014 compared to 2013 due to lower silver production and increased labor costs, partially offset by a decrease in power costs.
Other cash costs for the second quarter and first six months of 2014 were higher compared to 2013 due to the effect of lower silver production and increased labor costs, partially offset by lower power costs.
Treatment costs were slightly higher in the second quarter of 2014 compared to 2013 due to lower silver production resulting from decreased grades, and higher zinc and lead prices. Treatment costs were lower in the first six months of 2014 compared to 2013 as a result of lower silver prices, as treatment costs include the value of silver not payable to us as part of the smelting process.
By-product credits were higher in the second quarter and first six months of 2014 compared to 2013 due to higher zinc prices in the second quarter and first half of 2014 and higher lead prices in the second quarter of 2014. The difference between what we report as "production" and "payable metal quantities sold" is attributable to the difference between the quantities of metals contained in the concentrates we produce versus the portion of those metals actually payable by our smelter customers according to the terms of the smelter contracts. Differences can also arise from inventory changes incidental to shipping schedules. The decrease in payable quantities sold for the second quarter and first six months of 2014 compared to the same periods in 2013 is due to the timing of concentrate shipments and decreased production during the 2014 period.
While revenue from zinc, lead and gold by-products is significant, we believe that identification of silver as the primary product of the Greens Creek unit is appropriate because:
|
• |
silver has historically accounted for a higher proportion of revenue than any other metal and is expected to do so in the future; |
|
• |
we have historically presented Greens Creek as a producer primarily of silver, based on the original analysis that justified putting the project into production, and believe that consistency in disclosure is important to our investors regardless of the relationships of metals prices and production from year to year; |
|
• |
metallurgical treatment maximizes silver recovery; |
|
• |
the Greens Creek deposit is a massive sulfide deposit containing an unusually high proportion of silver; and |
|
• |
in most of its working areas, Greens Creek utilizes selective mining methods in which silver is the metal targeted for highest recovery. |
Likewise, we believe the identification of gold, lead and zinc as by-product credits is appropriate because of their lower economic value compared to silver and due to the fact that silver is the primary product we intend to produce. In addition, we do not receive sufficient revenue from any single by-product metal to warrant classification of such as a co-product.
We periodically review our revenues to ensure that reporting of primary products and by-products is appropriate. Because we consider zinc, lead and gold to be by-products of our silver production, the values of these metals offset operating costs within our calculations of Cash Cost, After By-product Credits, per Silver Ounce.
In the fourth quarter of 2012, we updated our asset retirement obligation ("ARO") at Greens Creek to reflect a preliminary revised reclamation and closure plan having estimated undiscounted costs of approximately $73.9 million, an increase from the $53.4 million in the previous plan. In late 2013, a Record of Decision was completed for proposed expansion of tailings capacity. In addition, in early 2014 we were engaged in negotiations with the U.S. Forest Service and state agencies (collectively, the “agencies”) on their proposed revisions to our previously-submitted reclamation and closure plan. In the first quarter of 2014, we updated our ARO at Greens Creek to reflect a revised reclamation and closure plan having estimated undiscounted costs of approximately $102.7 million, an increase from the $73.9 million in the previous plan, which is primarily the result of a new requirement to include perpetual water treatment in the closure plan. This resulted in an increase to the ARO asset and liability of $8.0 million after discounting the estimated costs to present value. As part of the revised reclamation and closure plan, we will be required to increase our $30 million reclamation bond to approximately $65.4 million, and are currently evaluating bonding options. The proposed bond is subject to comment by the agencies and the final amount may change. There can be no assurance that sufficient bonding capacity will be available to us.
The Lucky Friday Segment
|
Dollars are in thousands (except per ounce and per ton amounts) |
Three Months Ended |
Six Months Ended |
||||||||||||||
|
2014 |
2013 |
2014 |
2013 |
|||||||||||||
|
Sales |
$ | 23,762 | $ | 5,128 | $ | 43,858 | $ | 8,929 | ||||||||
|
Cost of sales and other direct production costs |
(14,837 |
) |
(8,534 |
) |
(28,033 |
) |
(13,327 |
) | ||||||||
|
Depreciation, depletion and amortization |
(2,320 |
) |
(2,145 |
) |
(4,516 |
) |
(3,473 |
) | ||||||||
|
Gross profit |
$ | 6,605 | $ | (5,551 |
) |
$ | 11,309 | $ | (7,871 |
) | ||||||
|
Tons of ore milled |
80,379 | 23,226 | 159,468 | 37,152 | ||||||||||||
|
Production: |
||||||||||||||||
|
Silver (ounces) |
820,786 | 217,096 | 1,520,391 | 337,588 | ||||||||||||
|
Lead (tons) |
5,185 | 1,426 | 9,995 | 2,132 | ||||||||||||
|
Zinc (tons) |
2,095 | 591 | 4,145 | 790 | ||||||||||||
|
Payable metal quantities sold: |
||||||||||||||||
|
Silver (ounces) |
775,096 | 177,378 | 1,414,113 | 277,830 | ||||||||||||
|
Lead (tons) |
4,460 | 1,004 | 8,417 | 1,560 | ||||||||||||
|
Zinc (tons) |
1,614 | 401 | 3,009 | 551 | ||||||||||||
|
Ore grades: |
||||||||||||||||
|
Silver ounces per ton |
10.73 | 10.04 | 10.06 | 9.82 | ||||||||||||
|
Lead percent |
6.83 |
% |
6.79 |
% |
6.66 |
% |
6.38 |
% | ||||||||
|
Zinc percent |
2.88 |
% |
3.48 |
% |
2.94 |
% |
2.99 |
% | ||||||||
|
Mining cost per ton |
$ | 87.83 | $ | 140.93 | $ | 84.44 | $ | 134.02 | ||||||||
|
Milling cost per ton |
$ | 21.81 | $ | 49.09 | $ | 21.21 | $ | 52.71 | ||||||||
|
Total Cash Cost, Net of By-product Credits, per Silver Ounce (1) |
$ | 9.10 | $ | 32.19 | $ | 9.33 | $ | 33.75 | ||||||||
|
(1) |
A reconciliation of this non-GAAP measure to cost of sales and other direct production costs and depreciation, depletion and amortization, the most comparable GAAP measure, can be found below in Reconciliation of Total Cash Cost, Before By-product Credits and Total Cash Cost, Net of By-product Credits (non-GAAP) to Costs of Sales and Other Direct Production Costs and Depreciation, Depletion and Amortization (GAAP). |
Following a special impact inspection by MSHA at the end of 2011, production at Lucky Friday was suspended through all of 2012, with limited production recommencing in February 2013. The special impact inspection resulted in an order to remove built-up cementitious material from the Silver Shaft, a one-mile deep, concrete-lined shaft from the surface that provides the primary access to underground workings. During the suspension, we also removed unused utilities, constructed a water ring to prevent ice from forming in the winter, installed a new power cable, and installed a metal brattice designed to better partition the compartments in the shaft. Upon completion of work on the Silver Shaft in the first quarter of 2013, we constructed a haulage way bypass around an area impacted by a rock burst in 2011. Completion of the Silver Shaft project also enabled work to resume on the #4 shaft project (discussed below). Income related to the suspension period in the first half of 2013 totaled $1.3 million, consisting of business interruption insurance proceeds partially offset by care and maintenance costs incurred in the first quarter. This income is included in a separate line item under Other operating expenses on the Condensed Consolidated Statement of Operations and Comprehensive Income (Unaudited). A full historical production level was attained in the third quarter of 2013, and has been sustained since that time.
The chart below illustrates the factors contributing to the variances in Cash Cost, After By-product Credits, Per Silver Ounce for the second quarter and first six months of 2014 compared to the same periods of 2013:

As set forth above, Cash Cost, After By-product Credits, per Silver Ounce in the second quarter of 2014 was $9.10, consisting of $23.95 of Cash Cost, Before By-product Credits, per Silver Ounce and $14.85 per ounce of by-product credits, compared to $32.19 in 2013, consisting of $48.07 of Cash Cost, Before By-product Credits, per Silver Ounce and $15.88 per ounce of by-product credits. The decrease in Cash Cost, After By-product Credits, per Silver Ounce was the result of increased production in the first half of 2014, as we ramped up production during 2013 following the suspension period discussed above.
Similar to the Greens Creek segment, the difference between what we report as “production” and “payable metal quantities sold” is due essentially to the difference between the quantities of metals contained in the concentrates we produce versus the portion of those metals actually payable by our smelter customers according to the terms of the smelter contracts.
While value from lead and zinc is significant, we believe that identification of silver as the primary product of the Lucky Friday unit is appropriate because:
|
• |
silver has historically accounted for a higher proportion of revenue than any other metal and is expected to do so in the future; |
|
• |
the Lucky Friday unit is situated in a mining district long associated with silver production; and |
|
• |
the Lucky Friday unit generally utilizes selective mining methods to target silver production. |
Likewise, we believe the identification of lead and zinc as by-product credits is appropriate because of their lower economic value compared to silver and due to the fact that silver is the primary product we intend to produce. In addition, we do not receive sufficient revenue from any single by-product metal to warrant classification of such as a co-product.
We periodically review our revenues to ensure that reporting of primary products and by-products is appropriate. Because we consider zinc and lead to be by-products of our silver production, the values of these metals offset operating costs within our calculations of Cash Cost, After By-product Credits, per Silver Ounce.
The #4 Shaft project, an internal shaft at the Lucky Friday mine, is expected to provide deeper access in order to extend the mine's operational life and expand silver ounce production. We commenced engineering and construction activities on the #4 Shaft in late 2008, and our Board of Directors gave its final approval of the project in August 2011. Construction of the #4 Shaft as currently designed is expected to cost approximately $215 million, including approximately $148 million already spent as of June 30, 2014, with completion expected in 2016. As discussed above, the #4 Shaft sinking activities were temporarily suspended until rehabilitation work in the Silver Shaft was completed in early 2013. We believe that our current capital resources will allow us to complete the project. However, there are a number of factors that could affect completion of the project, including: (i) a significant decline in metals prices, (ii) a reduction in available cash or credit, whether arising from decreased cash flow or other uses of available cash, (iii) increased regulatory burden, or (iv) a significant increase in operating or capital costs.
Many of the employees at our Lucky Friday unit are represented by a union. The collective bargaining agreement with the union expires on April 30, 2016.
In March 2012, Hecla Limited received notice of a complaint filed against it by the United Steel Workers, Local 5114, with the Federal Mine Safety Health Review Commission for compensation for bargaining unit workers at the Lucky Friday mine who were idled as a result of the previously-announced, temporary suspension of production at the mine (see the Other Contingencies section of Note 4 of Notes to Condensed Consolidated Financial Statements (Unaudited) for more information).
The Casa Berardi Segment
On June 1, 2013, we completed the acquisition of all of the issued and outstanding common shares of Aurizon Mines, Ltd. ("Aurizon") for total consideration of CDN$740.8 million (US$714.5 million). The acquisition gave us 100% ownership of the producing Casa Berardi mine, along with interests in various gold exploration properties in the Abitibi region of north-western Quebec, Canada.
|
Dollars are in thousands (except per ounce and per ton amounts) |
Three Months Ended |
Six Months Ended |
||||||||||||||
|
2014 |
2013 |
2014 |
2013 |
|||||||||||||
|
Sales |
$ | 38,291 | $ | 10,120 | $ | 80,387 | $ | 10,120 | ||||||||
|
Cost of sales and other direct production costs |
(27,822 |
) |
(8,231 |
) |
(55,630 |
) |
(8,231 |
) | ||||||||
|
Depreciation, depletion and amortization |
(8,456 |
) |
(3,324 |
) |
(17,037 |
) |
(3,324 |
) | ||||||||
|
Gross profit (loss) |
$ | 2,013 | $ | (1,435 |
) |
$ | 7,720 | $ | (1,435 |
) | ||||||
|
Tons of ore milled |
212,489 | 60,480 | 398,632 | 60,480 | ||||||||||||
|
Production: |
||||||||||||||||
|
Gold (ounces) |
28,623 | 6,740 | 59,882 | 6,740 | ||||||||||||
|
Silver (ounces) |
5,866 | 1,788 | 10,977 | 1,788 | ||||||||||||
|
Payable metal quantities sold: |
||||||||||||||||
|
Gold (ounces) |
29,641 | 7,500 | 62,097 | 7,500 | ||||||||||||
|
Silver (ounces) |
5,566 | 4,900 | 10,629 | 4,900 | ||||||||||||
|
Ore grades: |
||||||||||||||||
|
Gold ounces per ton |
0.15 | 0.13 | 0.17 | 0.13 | ||||||||||||
|
Silver ounces per ton |
0.031 | 0.033 | 0.031 | 0.033 | ||||||||||||
|
Mining cost per ton |
$ | 103.92 | $ | 108.39 | $ | 111.96 | $ | 108.39 | ||||||||
|
Milling cost per ton |
$ | 19.23 | $ | 17.91 | $ | 20.89 | $ | 17.91 | ||||||||
|
Total Cash Cost, Net of By-product Credits, per Gold Ounce (1) |
$ | 952 | $ | 1,152 | $ | 917 | $ | 1,152 | ||||||||
|
(1) |
A reconciliation of this non-GAAP measure to cost of sales and other direct production costs and depreciation, depletion and amortization, the most comparable GAAP measure, can be found below in Reconciliation of Cash Cost, Before By-product Credits and Cash Cost, After By-product Credits (non-GAAP) to Costs of Sales and Other Direct Production Costs and Depreciation, Depletion and Amortization (GAAP). |
Gross profit increased by $3.4 million and $9.2 million for the second quarter and first half of 2014, respectively, compared to the same periods of the prior year, primarily due to there being only one month of our ownership in the 2013 periods. Tons of ore milled increased by 251% and 559% for the second quarter and year-to-date, respectively, compared to the prior year, not only due to our ownership for the full periods of 2014, but also due to increased daily throughput, as increased development activity in 2014 compared to 2013 has allowed mining operations to remove and process greater quantities of ore. Mill throughput achieved during the second quarter of 2014 reached 2,335 tons per day and for the first six months was 2,202 tons per day, compared to 2,016 tons per day for the same periods of 2013. Gold production during the second quarter and first half of 2014 totaled 28,623 and 59,882 ounces respectively, compared to 6,740 ounces under our ownership in the prior year for both periods. Ore grades realized for gold production of 0.15 ounces of per ton for the second quarter and 0.17 ounces per ton for the first half of 2014, were 15% and 31% higher, respectively, than the same periods in 2013. The increases in ore grade are primarily due to mine sequencing which allowed access to higher grade material in 2014 compared to the prior year.
On a per unit basis, mining costs per ton of $103.92 for second quarter 2014 production were 4% lower than the second quarter of last year which totaled $108.39. The decrease is primarily due to foreign exchange differences between the two periods, as the U.S. dollar was stronger compared to the Canadian dollar in the second quarter of 2014 than it was in the second quarter of 2013.This is partially offset by higher stope preparation costs in the first quarter of 2014 resulting from increased development in the production stopes.
Mining costs per ton for the first half of 2014 totaled $111.96, 3% higher than the costs of $108.39 achieved in the same period of last year, primarily due to higher stope preparation costs as a result of increased development in the stopes, and higher mechanical service costs relating to colder weather and increased propane costs. Partially mitigating these increases is the impact of the change in foreign exchange rates observed between the first halves of 2014 and 2013.
Milling unit costs increased by 7% and 17% in the second quarter and first half of 2014, respectively, mainly due to the startup of the paste backfill plant which was commissioned in the fourth quarter of 2013. The plant is expected to create efficiencies by allowing greater flexibility for mine sequencing and production planning.
Gold sales during the second quarter and first half of 2014 totaled $38.3 million and $80.4 million, respectively, compared to $10.1 million for the same periods of 2013. The increases in 2014 are primarily due to there only being one month of sales under our ownership in the 2013 periods; but also contributing to the increase were improved gold grades and increased throughput for the current year periods. The average realized sale price per ounce of gold during the second quarter and first half of 2014 was $1,293 for both periods, compared to $1,329 for the same periods of 2013. The average London PM gold fix for the second quarter and first half of 2014, respectively, was $1,288 and $1,291.
In June of 2014, the Company successfully modified the type of financial guarantee for reclamation work as prescribed by the Quebec Mining Act from restricted cash deposits to a letter of credit. This allowed the Company to access formerly restricted cash totaling $7.5 million.
The West Mine shaft is undergoing a deepening project which is progressing well. As of June 30, 2014, the shaft bottom at the 1080 level had been reached, while construction of loading pockets and other related infrastructure is ongoing. The timing of commissioning of the deepened shaft is expected to be determined in the third quarter of 2014. Other recent mine enhancements include a new paste backfill facility and a concrete plant, which, we believe, should improve operational efficiency. In addition, a new dry house facility was completed in March 2014 at the West Mine, which will provide greater flexibility and efficiency for the underground miners, as this facility is located much closer to the main mine access than the existing facility.
The chart below illustrates the factors contributing to Cash Cost, After By-product Credits, Per Gold Ounce for the second quarter and first half of 2014 and 2013:

As set forth above, Cash Cost, After By-product Credits, per Gold Ounce in the second quarter of 2014 was $951.55, consisting of $955.54 of Cash Cost, Before By-product Credits, per Gold Ounce and $3.98 per ounce of by-product credits. The Cash Cost, After By-product Credits, per Gold Ounce in the first six months of 2014 was $917.48, consisting of $921.13 of Cash Cost, Before By-product Credits, per Gold Ounce and $3.64 per ounce of by-product credits. This is compared to Cash Cost, After By-product Credits, per Gold Ounce of $1,152.48, consisting of $1,157.86 of Cash Cost, Before By-product Credits, per Gold Ounce and $5.49 per ounce of by-product credits, for the second quarter and first six months of 2013. The decrease in Cash Cost, After By-product Credits, per Gold Ounce for the 2014 periods compared to 2013 was primarily the result of higher gold production due to increased gold grades and ore throughput.
We believe the identification of silver as a by-product credit is appropriate at Casa Berardi because of its lower economic value compared to gold and due to the fact that gold is the primary product we intend to produce there. In addition, we do not receive sufficient revenue from silver at Casa Berardi to warrant classification of such as a co-product. Because we consider silver to be a by-product of our gold production at Casa Berardi, the value of silver offsets operating costs within our calculations of Cash Cost, After By-product Credits, per Gold Ounce.
Corporate Matters
Employee Benefit Plans
Our defined benefit pension plans, while affording a significant benefit to our employees, also represent a significant liability to us. The liability recorded for the funded status of our plans was $31.6 million and $32.1 million as of June 30, 2014 and December 31, 2013, respectively. We made contributions of $5.0 million, aggregate principal value, of our Notes during the first half of 2014, with additional contributions of $2.5 million anticipated during the rest of 2014. See Note 9 of Notes to Condensed Consolidated Financial Statements (Unaudited) for more information. While the economic variables which will determine future cash requirements are uncertain, we expect contributions to increase in future years. See Note 7 of Notes to Condensed Consolidated Financial Statements (Unaudited) for more information.
Income Taxes
We continue to have a net deferred tax asset in the U.S., and as a result of our acquisition of Aurizon, a net deferred tax liability in Canada. Our U.S. net deferred tax asset at June 30, 2014 totaled $115.6 million, or 5% of total assets, an increase of $1.1 million from the $114.5 million net deferred tax asset at December 31, 2013. The largest component of the deferred tax asset is net operating loss carryforwards which are available to be applied against future taxable income. The next largest component is deferred reclamation, of which the majority should be realized in the current year, assuming adequate taxable income. Each reporting period we assess our deferred tax assets utilizing long-range forecasts to provide reasonable assurance that they will be realized through future earnings. At June 30, 2014, we retained a valuation allowance on U.S. deferred tax assets of $3.5 million primarily for foreign tax credits. A $24.8 million valuation allowance remains on deferred tax assets in foreign jurisdictions.
Our net Canadian deferred tax liability at June 30, 2014 was $166.4 million, an increase of $0.5 million from the $165.9 million net deferred tax liability at December 31, 2013. The deferred tax liability is the result of the acquisition of Aurizon completed on June 1, 2013, and is primarily related to the excess of the fair market value of the assets acquired over the tax bases of those assets for Canadian tax reporting, with the majority of that value allocated to mineral resources and reserves.
Our effective tax rate for the six months ended June 30, 2014, was 30% compared to negative 5% for the six months ended June 30, 2013. The change in the effective tax rate is primarily due to changes in discrete tax adjustments, primarily related to one-time acquisition costs incurred for the Aurizon acquisition, and the effects of the U.S. deduction for percentage depletion and the impact of taxation in foreign jurisdiction.
Reconciliation of Total Cash Cost, Before By-product Credits and Total Cash Cost, After By-product Credits (non-GAAP) to Cost of Sales and Other Direct Production Costs and Depreciation, Depletion and Amortization (GAAP)
Set forth below are tables that present reconciliations between the non-GAAP measures of Cash Cost, Before By-product Credits and Cash Cost, After By-product Credits to the GAAP measure of cost of sales and other direct production costs and depreciation, depletion and amortization for our operations at the Greens Creek, Lucky Friday, and Casa Berardi units for the three- and six-month periods ended June 30, 2014 and 2013.
Cash Cost, After By-product Credits is an important operating statistic that we utilize to measure each mine's operating performance. It also allows us to benchmark the performance of each of our mines versus those of our competitors. As a primary silver mining company, we also use the statistic on an aggregate basis - aggregating the Greens Creek and Lucky Friday mines - to compare our performance with that of other primary silver mining companies. With regard to Casa Berardi, we use Cash Cost, After By-product Credits to compare its performance with other gold mines. Similarly, the statistic is useful in identifying acquisition and investment opportunities as it provides a common tool for measuring the financial performance of other mines with varying geologic, metallurgical and operating characteristics.
Cash Cost, Before By-product Credits include all direct and indirect operating cash costs related directly to the physical activities of producing metals, including mining, processing and other plant costs, third-party refining expense, on-site general and administrative costs, royalties and mining production taxes. By-product credits include revenues earned from all metals other than the primary metal produced at each unit. Cash Cost, After By-product Credits, per Ounce, provides management and investors an indication of operating cash flow received from production, after consideration of average metals prices. Management also uses this measurement for the comparative monitoring of performance of our mining operations period-to-period from a cash flow perspective. Cash Cost, After By-product Credits, per Ounce is a measure developed by precious metals companies (including the Silver Institute) in an effort to provide a uniform standard for comparison purposes. There can be no assurance, however, that our reporting of this non-GAAP measure is the same as that reported by other mining companies.
The Casa Berardi section below reports Cash Cost, After By-product Credits, per Gold Ounce for the production of gold, its primary product, and by-product revenues earned from silver, which is a by-product at Casa Berardi. Only costs and ounces produced relating to units with the same primary product are combined to represent Cash Cost, After By-product Credits, per Ounce. Thus, the gold produced at our Casa Berardi unit is not included as a by-product credit when calculating Cash Cost, After By-product Credits, per Silver Ounce for the total of Greens Creek and Lucky Friday, our combined silver properties.
As depicted in the Greens Creek Unit and the Lucky Friday Unit tables below, by-product credits comprise an essential element of our silver unit cost structure distinguishing our silver operations and the polymetallic nature of their orebodies from other mines with less or no by-products in their orebodies. By-product credits included in our presentation of Cash Cost, After By-product Credits, per Silver Ounce include:
|
Total, Greens Creek and Lucky Friday |
||||||||||||||||
|
Three Months Ended |
Six Months Ended |
|||||||||||||||
|
2014 |
2013 |
2014 |
2013 |
|||||||||||||
|
By-product value, all silver properties: |
||||||||||||||||
|
Zinc |
23,653 | $ | 19,823 | $ | 46,609 | $ | 38,940 | |||||||||
|
Gold |
15,997 | 18,169 | 32,257 | 36,437 | ||||||||||||
|
Lead |
16,988 | 11,332 | 32,755 | 20,524 | ||||||||||||
|
Total by-product credits |
$ | 56,638 | $ | 49,324 | $ | 111,621 | $ | 95,901 | ||||||||
|
By-product credits per silver ounce, all silver properties |
||||||||||||||||
|
Zinc |
$ | 9.42 | $ | 8.85 | $ | 9.32 | $ | 9.41 | ||||||||
|
Gold |
6.38 | 8.13 | 6.46 | 8.81 | ||||||||||||
|
Lead |
6.77 | 5.07 | 6.56 | 4.96 | ||||||||||||
|
Total by-product credits |
$ | 22.57 | $ | 22.05 | $ | 22.34 | $ | 23.18 | ||||||||
By-product credits included in our presentation of Cash Cost, After By-product Credits, per Gold Ounce for our Casa Berardi Unit include:
|
Casa Berardi Unit (1) |
||||||||||||||||
|
Three Months Ended |
Six Months Ended |
|||||||||||||||
|
2014 |
2013 |
2014 |
2013 |
|||||||||||||
|
Silver by-product value |
$ | 114 | $ | 37 | $ | 218 | $ | 37 | ||||||||
|
Silver by-product credits per gold ounce |
$ | 3.98 | $ | 5.49 | $ | 3.64 | $ | 5.49 | ||||||||
Cost of sales and other direct production costs and depreciation, depletion and amortization is the most comparable financial measure calculated in accordance with GAAP to Cash Cost, After By-product Credits. The sum of the cost of sales and other direct production costs and depreciation, depletion and amortization for our operating units in the tables below is presented in our Consolidated Statement of Operations and Comprehensive Income (Loss) (in thousands).
|
Dollars are in thousands (except per ounce amounts) |
Total, Greens Creek and Lucky Friday |
|||||||||||||||
|
Three Months Ended |
Six Months Ended June 30, |
|||||||||||||||
|
2014 |
2013 |
2014 |
2013 |
|||||||||||||
|
Total Cash Cost, Before By-product Credits (2) |
$ | 70,051 | $ | 61,777 | $ | 134,570 | $ | 121,700 | ||||||||
|
By-product credits |
(56,638 |
) |
(49,324 |
) |
(111,621 |
) |
(95,901 |
) | ||||||||
|
Total Cash Cost, After By-product Credits |
13,413 | 12,453 | 22,949 | 25,799 | ||||||||||||
|
Divided by silver ounces produced |
2,509 | 2,237 | 4,996 | 4,137 | ||||||||||||
|
Total Cash Cost, Before By-product Credits, per Silver Ounce |
$ | 27.91 | $ | 27.61 | $ | 26.93 | $ | 29.42 | ||||||||
|
By-product credits per silver ounce |
$ | (22.57 |
) |
$ | (22.05 |
) |
$ | (22.34 |
) |
$ | (23.18 |
) | ||||
|
Total Cash Cost, After By-product Credits, per Silver Ounce |
$ | 5.34 | $ | 5.56 | $ | 4.59 | $ | 6.24 | ||||||||
|
Reconciliation to GAAP: |
||||||||||||||||
|
Total Cash Cost, After By-product Credits |
$ | 13,413 | $ | 12,453 | $ | 22,949 | $ | 25,799 | ||||||||
|
Depreciation, depletion and amortization |
19,280 | 16,888 | 36,502 | 30,895 | ||||||||||||
|
Treatment costs |
(20,010 |
) |
(18,972 |
) |
(39,916 |
) |
(37,569 |
) | ||||||||
|
By-product credits |
56,641 | 49,324 | 111,624 | 95,901 | ||||||||||||
|
Change in product inventory |
(7,211 |
) |
8,436 | (2,416 |
) |
3,832 | ||||||||||
|
Reclamation and other costs |
383 | 536 | 908 | 639 | ||||||||||||
|
Cost of sales and other direct production costs and depreciation, depletion and amortization (GAAP) |
$ | 62,496 | $ | 68,665 | $ | 129,651 | $ | 119,497 | ||||||||
|
Dollars are in thousands (except per ounce amounts) |
Greens Creek Unit |
|||||||||||||||
|
Three Months Ended |
Six Months Ended June 30, |
|||||||||||||||
|
2014 |
2013 |
2014 |
2013 |
|||||||||||||
|
Total Cash Cost, Before by-Product Credits (2) |
$ | 50,405 | $ | 51,342 | $ | 97,004 | $ | 105,250 | ||||||||
|
By-product credits |
(44,459 |
) |
(45,878 |
) |
(88,236 |
) |
(90,844 |
) | ||||||||
|
Total Cash Cost, After By-product Credits |
5,946 | 5,464 | 8,768 | 14,406 | ||||||||||||
|
Divided by silver ounces produced |
1,689 | 2,019 | 3,476 | 3,799 | ||||||||||||
|
Total Cash Cost, Before By-product Credits, per Silver Ounce |
$ | 29.84 | $ | 25.43 | $ | 27.90 | $ | 27.70 | ||||||||
|
By-product credits per silver ounce |
$ | (26.32 |
) |
$ | (22.72 |
) |
$ | (25.38 |
) |
$ | (23.91 |
) | ||||
|
Total Cash Cost, After By-product Credits, per Silver Ounce |
$ | 3.52 | $ | 2.71 | $ | 2.52 | $ | 3.79 | ||||||||
|
Reconciliation to GAAP: |
||||||||||||||||
|
Total Cash Cost, After By-product Credits |
$ | 5,946 | $ | 5,464 | $ | 8,768 | $ | 14,406 | ||||||||
|
Depreciation, depletion and amortization |
16,960 | 14,743 | 31,986 | 27,422 | ||||||||||||
|
Treatment costs |
(14,993 |
) |
(17,493 |
) |
(30,382 |
) |
(35,306 |
) | ||||||||
|
By-product credits |
44,462 | 45,878 | 88,239 | 90,844 | ||||||||||||
|
Change in product inventory |
(7,376 |
) |
8,869 | (2,377 |
) |
4,707 | ||||||||||
|
Reclamation and other costs |
340 | 524 | 868 | 624 | ||||||||||||
|
Cost of sales and other direct production costs and depreciation, depletion and amortization (GAAP) |
$ | 45,339 | $ | 57,985 | $ | 97,102 | $ | 102,697 | ||||||||
|
Dollars are in thousands (except per ounce amounts) |
Lucky Friday Unit |
|||||||||||||||
|
Three Months Ended |
Six Months Ended June 30, |
|||||||||||||||
|
2014 |
2013 |
2014 |
2013 |
|||||||||||||
|
Total Cash Cost, Before By-product Credits (2) |
$ | 19,646 | $ | 10,435 | $ | 37,566 | $ | 16,450 | ||||||||
|
By-product credits |
(12,179 |
) |
(3,446 |
) |
(23,385 |
) |
(5,057 |
) | ||||||||
|
Total Cash Cost, After By-product Credits |
7,467 | 6,989 | 14,181 | 11,393 | ||||||||||||
|
Divided by silver ounces produced |
820 | 217 | 1,520 | 338 | ||||||||||||
|
Total Cash Cost, Before By-product Credits, per Silver Ounce |
$ | 23.95 | $ | 48.07 | $ | 24.71 | $ | 48.71 | ||||||||
|
By-product credits per silver ounce |
$ | (14.85 |
) |
$ | (15.88 |
) |
$ | (15.38 |
) |
$ | (14.96 |
) | ||||
|
Total Cash Cost, After By-product Credits, per Silver Ounce |
$ | 9.10 | $ | 32.19 | $ | 9.33 | $ | 33.75 | ||||||||
|
Reconciliation to GAAP: |
||||||||||||||||
|
Total Cash Cost, After By-product Credits |
$ | 7,467 | $ | 6,989 | $ | 14,181 | $ | 11,393 | ||||||||
|
Depreciation, depletion and amortization |
2,320 | 2,145 | 4,516 | 3,473 | ||||||||||||
|
Treatment costs |
(5,017 |
) |
(1,479 |
) |
(9,534 |
) |
(2,263 |
) | ||||||||
|
By-product credits |
12,179 | 3,446 | 23,385 | 5,057 | ||||||||||||
|
Change in product inventory |
165 | (433 |
) |
(39 |
) |
(875 |
) | |||||||||
|
Reclamation and other costs |
43 | 11 | 40 | 15 | ||||||||||||
|
Cost of sales and other direct production costs and depreciation, depletion and amortization (GAAP) |
$ | 17,157 | $ | 10,679 | $ | 32,549 | $ | 16,800 | ||||||||
|
Dollars are in thousands (except per ounce amounts) |
Casa Berardi Unit (1) |
|||||||||||||||
|
Three Months Ended |
Six Months Ended June 30, |
|||||||||||||||
|
2014 |
2013 |
2014 |
2013 |
|||||||||||||
|
Total Cash Cost, Before By-product Credits (2) |
$ | 27,351 | $ | 7,804 | $ | 55,159 | $ | 7,804 | ||||||||
|
By-product credits |
(114 |
) |
(37 |
) |
(218 |
) |
(37 |
) | ||||||||
|
Total Cash Cost, After by-product credits |
27,237 | 7,767 | 54,941 | 7,767 | ||||||||||||
|
Divided by gold ounces produced |
28,624 | 6,740 | 59,882 | 6,740 | ||||||||||||
|
Total Cash Cost, Before By-product Credits, per Gold Ounce |
$ | 955.54 | $ | 1,157.86 | $ | 921.13 | $ | 1,157.86 | ||||||||
|
By-product credits per silver ounce |
$ | (3.98 |
) |
$ | (5.49 |
) |
$ | (3.64 |
) |
$ | (5.49 |
) | ||||
|
Total Cash Cost, After By-product Credits, per Gold Ounce |
$ | 951.56 | $ | 1,152.37 | $ | 917.49 | $ | 1,152.37 | ||||||||
|
Reconciliation to GAAP: |
||||||||||||||||
|
Total Cash Cost, After By-product Credits |
$ | 27,237 | $ | 7,767 | $ | 54,941 | $ | 7,767 | ||||||||
|
Depreciation, depletion and amortization |
8,456 | 3,324 | 17,037 | 3,324 | ||||||||||||
|
Treatment costs |
(131 |
) |
(9 |
) |
(229 |
) |
(9 |
) | ||||||||
|
By-product credits |
114 | 37 | 218 | 37 | ||||||||||||
|
Change in product inventory |
395 | 414 | 288 | 414 | ||||||||||||
|
Reclamation and other costs |
207 | 21 | 412 | 21 | ||||||||||||
|
Cost of sales and other direct production costs and depreciation, depletion and amortization (GAAP) |
$ | 36,278 | $ | 11,554 | $ | 72,667 | $ | 11,554 | ||||||||
|
Dollars are in thousands (except per ounce amounts) |
Total, All Locations |
|||||||||||||||
|
Three Months Ended |
Six Months Ended June 30, |
|||||||||||||||
|
2014 |
2013 |
2014 |
2013 |
|||||||||||||
|
Reconciliation to GAAP: |
||||||||||||||||
|
Total Cash Cost, After By-product Credits |
$ | 40,650 | $ | 20,220 | $ | 77,890 | $ | 33,566 | ||||||||
|
Depreciation, depletion and amortization |
27,736 | 20,212 | 53,539 | 34,219 | ||||||||||||
|
Treatment costs |
(20,141 |
) |
(18,981 |
) |
(40,145 |
) |
(37,578 |
) | ||||||||
|
By-product credits |
56,755 | 49,361 | 111,842 | 95,938 | ||||||||||||
|
Change in product inventory |
(6,816 |
) |
8,850 | (2,128 |
) |
4,246 | ||||||||||
|
Reclamation and other costs |
590 | 557 | 1,320 | 660 | ||||||||||||
|
Cost of sales and other direct production costs and depreciation, depletion and amortization (GAAP) |
$ | 98,774 | $ | 80,219 | $ | 202,318 | $ | 131,051 | ||||||||
|
(1) |
On June 1, 2013, we completed the acquisition of Aurizon Mines Ltd., which gave us 100% ownership of the Casa Berardi mine in Quebec, Canada. The information presented reflects our ownership of Casa Berardi commencing as of that date. The primary metal produced at Casa Berardi is gold, with a by-product credit for the value of silver production. |
|
(2) |
Includes all direct and indirect operating costs related directly to the physical activities of producing metals, including mining, processing and other plant costs, third-party refining and marketing expense, on-site general and administrative costs, royalties and mining production taxes, before by-product revenues earned from all metals other than the primary metal produced at each unit. |
Financial Liquidity and Capital Resources
Our liquid assets include (in millions):
|
June 30, 2014 |
December 31, 2013 |
|||||||
|
Cash and cash equivalents held in U.S. dollars |
$ | 199.2 | $ | 166.5 | ||||
|
Cash and cash equivalents held in foreign currency |
22.9 | 45.7 | ||||||
|
Total cash and cash equivalents |
222.1 | 212.2 | ||||||
|
Marketable equity securities - non-current |
7.5 | 7.0 | ||||||
|
Total cash, cash equivalents and investments |
$ | 229.6 | $ | 219.2 | ||||
Cash and cash equivalents increased by $9.9 million in the first six months of 2014, as discussed below, while the value of non-current marketable equity securities increased by $0.5 million (see Note 2 of Notes to Condensed Consolidated Financial Statements (Unaudited) for more information).
On April 12, 2013, we completed an offering of Notes in the total principal amount of US$500 million, as discussed in Note 9 of Notes to Condensed Consolidated Financial Statements (Unaudited). The net proceeds from the offering of the Notes of $490 million were used to partially fund the acquisition of Aurizon and for general corporate purposes, including expenses related to the Aurizon acquisition. In addition, on April 14, 2014, we entered into an agreement with the Hecla Mining Company Retirement Plan Trust pursuant to which we agreed to contribute to the trust over the course of 2014 approximately $7.5 million in aggregate principal amount of the Notes, including $2.0 million and $3.0 million in aggregate principal amounts of the Notes which were contributed in April and June 2014, respectively, in order to satisfy the funding requirement for our funded pension plan for 2014. The Notes are due May 1, 2021 and bear interest at a rate of 6.875% per year from the date of original issuance or from the most recent payment date to which interest has been paid or provided for. Interest on the Notes is payable on May 1 and November 1 of each year, commencing November 1, 2013.
In 2011, we settled Hecla Limited's Coeur d'Alene Basin environmental litigation and related claims pursuant to a Consent Decree entered by the Court on September 8, 2011. Payments of approximately $168 million, $25 million, and $15 million (and related interest) were made in October 2011, 2012, and 2013, respectively, and a payment of approximately $14.1 million in proceeds from warrants exercised during the second quarter of 2014 was made in July 2014, pursuant to the terms of the Consent Decree. Hecla Limited's remaining obligation under the Consent Decree is approximately $41.3 million due in August 2014, $40.3 million of which would be paid from proceeds of the exercise of outstanding Series 3 warrants, to the extent they are exercised.
The #4 Shaft project, which is discussed further in the Lucky Friday Segment section above, is expected to involve capital expenditures of approximately $215 million through 2016, of which $148 million that has been spent on the project as of June 30, 2014 (leaving approximately $67 million remaining).
Pursuant to our common stock dividend policy described in Note 8 of Notes to Condensed Consolidated Financial Statements (Unaudited), our Board of Directors declared and paid dividends on common stock totaling $1.7 million in the first half of 2014 and $4.3 million in the first half of 2013. On July 29, 2014, our Board of Directors declared a dividend on common stock totaling $0.9 million payable in September 2014. Our dividend policy has a silver-price-linked component which ties the amount of declared common stock dividends to our realized silver price for the preceding quarter. Another component of our common stock dividend policy anticipates paying an annual minimum dividend. The declaration and payment of dividends on common stock is at the sole discretion of our board of directors, and there can be no assurance that we will continue to declare and pay common stock dividends in the future.
On March 3, 2014, the Board of Directors granted 1,345,072 restricted stock units to employees in payment of approximately $4.6 million in annual and long-term incentive compensation for the period ended December 31, 2013.
On May 8, 2012, we announced that our board of directors approved a stock repurchase program. Under the program, we are authorized to repurchase up to 20 million shares of our outstanding common stock from time to time in open market or privately negotiated transactions, depending on prevailing market conditions and other factors. The repurchase program may be modified, suspended or discontinued by us at any time. Whether or not we engage in repurchases from time to time may depend on a variety of factors, including not only price and cash resources, but customary black-out restrictions, whether we have any material inside information, limitations on share repurchases or cash usage that may be imposed by our credit agreement or in connection with issuances of securities, alternative uses for cash, applicable law, and other investment opportunities from time to time. As of June 30, 2014, 934,100 shares have been purchased at an average price of $3.99 per share, leaving approximately 19.1 million shares that may yet be purchased under the program. The closing price of our common stock at July 28, 2014, was $3.26 per share.
As discussed in The Greens Creek Segment section above, we anticipate that in 2014 we will complete a revised plan for reclamation and closure of the Greens Creek mine. Preliminary work on the plan has led us to believe that it will result in an increase in estimated closure costs, which will require us to increase our current $30 million reclamation bond for Greens Creek to approximately $65.4 million. The proposed bond is subject to comment by the agencies, and the final amount may change. There can be no assurance that adequate bonding capacity will be available to us at that time.
As a result of our current cash balances, the performance of our current operations, current metals prices, and full availability of our $100 million revolving credit agreement, we believe our cash, cash equivalents, investments, projected cash from operations, and availability of financing (including equity issuances) if needed will be adequate to meet our obligations during the next 12 months. These obligations include, but are not limited to: debt service obligations related to the Notes, the required environmental settlement payments previously discussed, capital outlays for the #4 Shaft project and other capital expenditures, potential repurchases of our common stock under the program described above, and payment of common stock dividends, if declared by our board of directors. We currently estimate that a total of approximately $150 million will be spent on capital expenditures, primarily for equipment, infrastructure, and development at our mines in 2014. We also estimate that exploration and pre-development expenditures will total approximately $18 million in 2014. However, capital, exploration, and pre-development expenditures may change based upon our financial position, metals prices, and other considerations. Our ability to fund the activities described above will depend on our operating performance, metals prices, our ability to estimate costs, sources of liquidity available to us, and other factors. However, a sustained downturn in metals prices or significant increase in operational or capital costs, other uses of cash, or other factors beyond our control could impact our plans.
|
Six Months Ended |
||||||||
|
June 30, 2014 |
June 30, 2013 |
|||||||
|
Cash provided by operating activities (in millions) |
$ | 57.0 | $ | 10.3 | ||||
Cash provided by operating activities in the first half of 2014 increased by $46.7 million compared to the same period in 2013 primarily due to higher income, as adjusted for non-cash items. The higher income is primarily due to increased production at the Lucky Friday mine and the addition of the Casa Berardi mine in June 2013 (see the Casa Berardi Segment and Lucky Friday Segment sections above). Working capital and other operating asset and liability changes resulted in a net cash flow increase of $0.9 million in the first six months of 2014 compared to a net increase in cash flows of $9.2 million in the 2013 period. The $8.3 million variance in working capital changes is attributed to lower accounts payable in 2014 as a result of reduced capital, exploration, and pre-development spending, and higher product inventory balances due primarily to the timing of shipments at Greens Creek. These factors were partially offset by higher accrued payroll and related benefits and accrued taxes.
|
Six Months Ended |
||||||||
|
June 30, 2014 |
June 30, 2013 |
|||||||
|
Cash used in investing activities (in millions) |
$ | (52.9 |
) |
$ | (385.2 |
) | ||
During the first half of 2014, we invested $57.5 million in capital expenditures, not including $2.2 million in non-cash capital lease additions, a decrease of $2.8 million compared to the same period in 2013 due to lower expenditures at the Greens Creek and Lucky Friday units, partially offset by expenditures at the Casa Berardi unit. We recognized a cash outflow for the acquisition of Aurizon, net of cash acquired, of $321.5 million during the first half of 2013, as discussed above. During the first half of 2014, restricted investments related to reclamation bonding at the Casa Berardi unit decreased by $4.3 million. We purchased marketable securities having a cost basis of $5.7 million, and sold investments having a costs basis of $1.6 million for proceeds of $1.8 million, during the first half of 2013.
|
Six Months Ended |
||||||||
|
June 30, 2014 |
June 30, 2013 |
|||||||
|
Cash provided by financing activities (in millions) |
$ | 5.5 | $ | 480.3 | ||||
We received $14.1 million in proceeds from the exercise warrants during the first half of 2014, as discussed above. We received proceeds from the issuance of the Notes in April 2013, net of initial purchaser discount, of $490.0 million, and incurred fees of $1.4 million related to issuance of the Notes. We incurred costs related to our credit facility of $0.6 million in the first half of 2014. During the first six months of 2014 and 2013, we paid cash dividends on our common stock totaling $1.7 million and $4.3 million, respectively, and cash dividends of $0.3 million on our Series B Preferred Stock. We made repayments on our capital leases of $4.5 million and $3.4 million in the six-month periods ended June 30, 2014 and 2013, respectively. We acquired treasury shares for $1.5 million and $0.3 million in the first half of 2014 and 2013, respectively, as part of our stock repurchase program discussed above.
Contractual Obligations, Contingent Liabilities and Commitments
The table below presents our fixed, non-cancelable contractual obligations and commitments which are primarily related to our litigation settlement, outstanding purchase orders, certain capital expenditures, our credit facility and lease arrangements as of June 30, 2014 (in thousands):
|
Payments Due By Period |
||||||||||||||||||||
|
Less than 1 year |
1-3 years |
4-5 years |
More than 5 years |
Total |
||||||||||||||||
|
Purchase obligation (1) |
$ | 6,957 | — | — | $ | — | $ | 6,957 | ||||||||||||
|
Commitment fees (2) |
500 | 542 | — | — | 1,042 | |||||||||||||||
|
Contractual obligations (3) |
5,139 | — | — | — | 5,139 | |||||||||||||||
|
Capital lease commitments (4) |
8,535 | 11,765 | 1,074 | — | 21,374 | |||||||||||||||
|
Operating lease commitments (5) |
2,350 | 2,539 | 2,739 | 1,330 | 8,958 | |||||||||||||||
|
Coeur d'Alene Basin litigation settlement (6) |
55,400 | — | — | — | 55,400 | |||||||||||||||
|
Surety maintenance fees (6) |
77 | — | — | — | 77 | |||||||||||||||
|
Defined benefit pension plans (7) |
2,500 | — | — | — | 2,500 | |||||||||||||||
|
Supplemental executive retirement plan (7) |
345 | 712 | 747 | 2,303 | 4,107 | |||||||||||||||
|
Senior notes (8) |
34,719 | 69,438 | 69,438 | 568,651 | 742,246 | |||||||||||||||
|
Total contractual cash obligations |
$ | 116,522 | $ | 84,996 | $ | 73,998 | $ | 572,284 | $ | 847,800 | ||||||||||
|
(1) |
Consists of open purchase orders of approximately $1.5 million at the Casa Berardi unit, $2.9 million at the Greens Creek unit, $2.5 million at the Lucky Friday unit. Included in these amounts are approximately $0.5 million, $2.4 million, and $1.7 million related to various capital projects at the Casa Berardi, Greens Creek, and Lucky Friday units, respectively. |
|
(2) |
We have a $100 million revolving credit agreement under which we are required to pay a standby fee of 0.5% per annum on undrawn amounts under the revolving credit agreement. There was no amount drawn under the revolving credit agreement as of June 30, 2014, and the amounts above assume no amounts will be drawn during the agreement's term. For more information on our credit facility, see Note 9 of Notes to Condensed Consolidated Financial Statements (Unaudited). |
|
(3) |
As of June 30, 2014, we were committed to approximately $5.1 million for various non-capital items at our operating units. |
|
(4) |
Includes scheduled capital lease payments of $18.8 million and $2.5 million (including interest) for equipment at our Greens Creek and Lucky Friday units, respectively. These leases have fixed payment terms and contain bargain purchase options at the end of the lease periods (see Note 9 of Notes to Condensed Consolidated Financial Statements (Unaudited) for more information). |
|
(5) |
We enter into operating leases in the normal course of business. Substantially all lease agreements have fixed payment terms based on the passage of time. Some lease agreements provide us with the option to renew the lease or purchase the leased property. Our future operating lease obligations would change if we exercised these renewal options and if we entered into additional operating lease arrangements. |
|
(6) |
On September 8, 2011, a Consent Decree settling the Coeur d'Alene Basin environmental litigation and related claims was entered by the U.S. District Court in Idaho. As of June 30, 2014, our remaining obligations under the terms of the settlement include payment of approximately $55.4 million by August 2014, as quarterly payments of the proceeds from the exercise of any outstanding Series 1 and Series 3 warrants during the quarter, with the remaining balance, if any, due in August 2014. These payments are secured by a third party surety for which Hecla Limited pays an annual maintenance fee of 0.556% of the remaining obligation balance. A payment of approximately $14.1 million was made in July 2014 pursuant to the terms of the Consent Decree for proceeds from warrants exercised during the second quarter of 2014, resulting in a remaining obligation of approximately $41.3 million as of the date of this filing (see Note 9 of Notes to Condensed Consolidated Financial Statements (Unaudited) for more information). |
|
(7) |
We sponsor defined benefit pension plans covering substantially all U.S. employees and provide certain post-retirement benefits for qualifying retired employees, along with a supplemental executive retirement plan. These amounts represent our estimate of the future funding requirements for these plans. See Note 7 of Notes to Condensed Consolidated Financial Statements (Unaudited) for more information. |
|
(8) |
On April 12, 2013, we completed an offering of $500 million in aggregate principal amount of our senior notes due May 1, 2021 (the "Notes"). See Note 9 of Notes to Condensed Consolidated Financial Statements (Unaudited) for more information. The Notes bear interest at a rate of 6.875% per year from the date of original issuance or from the most recent payment date to which interest has been paid or provided for. Interest on the Notes is payable on May 1 and November 1 of each year, commencing November 1, 2013. Since the initial offering, we have issued an additional $5 million in aggregate principal amount of the Notes to fund obligations under our defined benefit pension plan. See Note 7 and Note 9 of Notes to Condensed Consolidated Financial Statements (Unaudited) for more information. |
We record liabilities for costs associated with mine closure, reclamation of land and other environmental matters. At June 30, 2014, our liabilities for these matters totaled $115.2 million, including $55.4 million for Hecla Limited's liability relating to the Coeur d'Alene River Basin in North Idaho. On September 8, 2011 a Consent Decree settling the Coeur d'Alene Basin environmental litigation and related claims was entered by the U.S. District Court in Idaho. See the Financial Liquidity and Capital Resources section above for more information on the financial terms of the settlement. Future expenditures related to closure, reclamation and environmental expenditures at our other sites are difficult to estimate, although we anticipate we will incur expenditures relating to these obligations over the next 30 years. See The Greens Creek Segment above for more information regarding our closure and reclamation obligations. For additional information relating to our environmental obligations, see Note 4 of Notes to Condensed Consolidated Financial Statements (Unaudited).
Off-Balance Sheet Arrangements
At June 30, 2014, we had no existing off-balance sheet arrangements, as defined under SEC regulations, that have or are reasonably likely to have a current or future effect on our financial condition, revenues or expenses, results of operations, liquidity, capital expenditures or capital resources that are material to investors.
Critical Accounting Estimates
Our significant accounting policies are described in Note 1 of Notes to Consolidated Financial Statements in our annual report filed on Form 10-K for the year ended December 31, 2013. As described in Note 1, we are required to make estimates and assumptions that affect the reported amounts and related disclosures of assets, liabilities, revenue, and expenses. Our estimates are based on our experience and our interpretation of economic, political, regulatory, and other factors that affect our business prospects. Actual results may differ significantly from our estimates.
We believe that our most critical accounting estimates are related to future metals prices; obligations for environmental, reclamation, and closure matters; mineral reserves; and accounting for business combinations, as they require us to make assumptions that were highly uncertain at the time the accounting estimates were made and changes in them are reasonably likely to occur from period to period. Management has discussed the development and selection of these critical accounting estimates with the Audit Committee of our Board of Directors, and the Audit Committee has reviewed the disclosures presented below. In addition, there are other items within our financial statements that require estimation, but are not deemed to be critical. However, changes in estimates used in these and other items could have a material impact on our financial statements.
Future Metals Prices
Metals prices are key components in estimates that determine the valuation of some of our significant assets and liabilities, including properties, plants and equipment, deferred tax assets, and certain accounts receivable. Metals prices are also an important component in the estimation of reserves. As shown under Item 1A. — Risk Factors in our annual report filed on Form 10-K for the year ended December 31, 2013, metals prices have historically been volatile. Silver demand arises from investment demand, particularly in Exchange-Traded Funds, industrial demand, and consumer demand. Gold demand arises primarily from investment and consumer demand. Investment demand for silver and gold is influenced by various factors, including: the value of the U.S. Dollar and other currencies, expanding U.S. budget deficits, widening availability of exchange-traded commodity funds, interest rate levels, the health of credit markets, and inflationary expectations. Uncertainty towards a global economic recovery could result in continued investment demand for precious metals. Industrial demand for silver is closely linked to world Gross Domestic Product growth and industrial fabrication levels, as it is difficult to substitute for silver in industrial fabrication. Consumer demand is driven significantly by demand for jewelry and similar retail products. We believe that global economic conditions are improving, though slowly and unevenly, and that industrial and economic trends, including urbanization and growth of the middle class in countries such as China and India, will result in continued consumer demand growth for silver and gold and industrial demand growth for silver. However, there can be no assurance whether these trends will continue or to how they will impact prices of the metals we produce. In the past, we have recorded impairments to our asset carrying value because of low prices, and we can offer no assurance that prices will either remain at their current levels or increase.
Processes supporting valuation of our assets and liabilities that are most significantly affected by prices include analysis of asset carrying values, depreciation, reserves, and deferred income taxes. On at least an annual basis – and more frequently if circumstances warrant – we examine our depreciation rates, reserve estimates, and the valuation allowances on our deferred tax assets. We examine the carrying values of our assets as changes in facts and circumstances warrant. In our analysis of carrying values and deferred taxes, we apply several pricing views to our forecasting model, including current prices, analyst price estimates, forward-curve prices, and historical prices (see Mineral Reserves, below, regarding prices used for reserve estimates). Using applicable accounting guidance and our view of metals markets, we use the average of the various methods to determine whether the values of our assets are fairly stated, and to determine the level of valuation allowances, if any, on our deferred tax assets. In addition, estimates of future metals prices are used in the valuation of certain assets in the determination of the purchase price allocations for our acquisitions (see Business Combinations below).
Sales of all metals products sold directly to smelters are recorded as revenues when title and risk of loss transfer to the smelter (generally at the time of shipment) at estimated forward metals prices for the estimated month of settlement. Due to the time elapsed between the time of shipment to the smelter and final settlement with the smelter, we must estimate the prices at which sales of our metals will be settled. Previously recorded sales and trade accounts receivable are adjusted to estimated settlement metals prices until final settlement by the smelter. Changes in metals prices between shipment and final settlement result in changes to revenues and accounts receivable previously recorded upon shipment. As a result, our trade accounts receivable balances are subject to changes in metals prices until final settlement occurs. For more information, see part N. Revenue Recognition of Note 1 of Notes to Consolidated Financial Statements in our annual report filed on Form 10-K for the year ended December 31, 2013.
We utilize financially-settled forward contracts to manage our exposure to changes in prices for silver, gold, zinc and lead. See Item 3. Quantitative and Qualitative Disclosures About Market Risk - Commodity-Price Risk Management below for more information on our contract programs. These contracts do not qualify for hedge accounting and are therefore marked-to-market through earnings each period. Changes in silver, gold, zinc and lead prices between the dates that the contracts are entered into and their settlements will result in changes to the fair value asset or liability associated with the contracts, with a corresponding gain or loss recognized in earnings.
Obligations for Environmental, Reclamation and Closure Matters
Accrued reclamation and closure costs represents a significant liability on our balance sheet. Of our $115.2 million total accrued reclamation and closure cost balance as of June 30, 2014, approximately $55.4 million is fixed by the terms of the Coeur d'Alene Basin litigation settlement, with much of the remaining balance subject to uncertainty. We have estimated our liabilities under appropriate accounting guidance, and on at least an annual basis - and more frequently if warranted - management reviews our liabilities with our Audit Committee. However, the ranges of liability could exceed the liabilities recognized. If substantial damages were awarded, claims were settled, or remediation costs incurred in excess of our accruals, our financial results or condition could be materially adversely affected.
Mineral Reserves
Critical estimates are inherent in the process of determining our reserves. Our reserves are affected largely by our assessment of future metals prices, as well as by engineering and geological estimates of ore grade, accessibility and production cost. Metals prices are estimated at long-term averages, as described in Item 2. — Property Descriptions in our annual report on Form 10-K filed for the year ended December 31, 2013. Our assessment of reserves occurs at least annually, and periodically utilizes external audits.
Reserves are a key component in the valuation of our properties, plants and equipment. Reserve estimates are used in determining appropriate rates of units-of-production depreciation, with net book value of many assets depreciated over remaining estimated reserves. Reserves are also a key component in forecasts, with which we compare future cash flows to current asset values to ensure that carrying values are reported appropriately. Reserves also play a key role in the valuation of certain assets in the determination of the purchase price allocations for acquisitions (see Business Combinations below). Reserves are a culmination of many estimates and are not guarantees that we will recover the indicated quantities of metals or that we will do so at a profitable level.
Business Combinations
We are required to allocate the purchase price of acquired companies to the tangible and intangible assets acquired and liabilities assumed based on their estimated fair values at the acquisition date. The valuation of assets acquired and liabilities assumed requires management to make significant estimates and assumptions, especially with respect to long-lived assets, including estimates of future metals prices and mineral reserves, as discussed above. In some cases, we use third-party appraisers to determine the fair values and lives of property and other identifiable assets. In addition, costs related to business combinations are included in earnings as incurred, and our financial results for periods in which business combinations are pursued could be adversely affected as a result.
Item 3. Quantitative and Qualitative Disclosures About Market Risk
The following discussion about our risk management activities includes forward-looking statements that involve risk and uncertainties, as well as summarizes the financial instruments held by us at June 30, 2014, which are sensitive to changes in commodity prices and foreign exchange rates and are not held for trading purposes. Actual results could differ materially from those projected in the forward-looking statements. In the normal course of business, we also face risks that are either non-financial or non-quantifiable. See Item 1A – Risk Factors of our annual report filed on Form 10-K for the year ended December 31, 2013.
Provisional Sales
Sales of all metals products sold directly to smelters, including by-product metals, are recorded as revenues when title and risk of loss transfers to the smelter (generally at the time of shipment) at forward prices for the estimated month of settlement. Due to the time elapsed between shipment to the smelter and the final settlement with the smelter we must estimate the prices at which sales of our metals will be settled. Previously recorded sales are adjusted to estimated settlement metals prices until final settlement by the smelter. Changes in metals prices between shipment and final settlement will result in changes to revenues previously recorded upon shipment. Metals prices can and often do fluctuate widely and are affected by numerous factors beyond our control (see Item 1A – Risk Factors – A substantial or extended decline in metals prices would have a material adverse effect on us of our annual report filed on Form 10-K for the year ended December 31, 2013 for more information). At June 30, 2014, metals contained in concentrates and exposed to future price changes totaled approximately 0.9 million ounces of silver, 3,723 ounces of gold, 6,344 tons of zinc, and 3,354 tons of lead. If the price for each metal were to change by ten percent, the change in the total value of the concentrates sold would be approximately $4.3 million. However, as discussed in Commodity-Price Risk Management below, we utilize a program designed and intended to mitigate the risk of negative price adjustments with limited mark-to-market financially-settled forward contracts for our silver, gold, zinc and lead sales.
Commodity-Price Risk Management
At times, we may use commodity forward sales commitments, commodity swap contracts and commodity put and call option contracts to manage our exposure to fluctuation in the prices of certain metals which we produce. Contract positions are designed to ensure that we will receive a defined minimum price for certain quantities of our production, thereby partially offsetting our exposure to price fluctuations. These instruments do, however, expose us to (i) credit risk in the event of non-performance by counterparties for contracts in which the contract price exceeds the spot price of a commodity and (ii) price risk to the extent that the spot price exceeds the contract price for quantities of our production covered by contract positions.
We are currently using financially-settled forward contracts to manage the exposure to changes in prices of silver, gold, zinc and lead contained in our concentrate shipments between the time of shipment and final settlement. In addition, we use financially-settled forward contracts to manage the exposure to changes in prices of zinc and lead (but not silver and gold) contained in our forecasted future concentrate shipments. These contracts do not qualify for hedge accounting and are marked-to-market through earnings each period. At June 30, 2014, we recorded a current the following balances related to these contracts:
|
• |
a current asset of $0.9 million which is included in other current assets and is net of $0.4 million in contracts in a fair value liability position; |
|
• |
a non-current asset of $0.1 million which included in other non-current assets and is net of $1 thousand in contracts in a fair value liability position; |
|
• |
a current liability of $1.2 million which is included in other current liabilities and is net of $1.9 million in contracts in a fair value asset position; and |
|
• |
a non-current liability of $1.5 million which is included in other non-current liabilities and is net of $2.4 million in contracts in a fair value asset position. |
We recognized a $3.5 million net loss during the first six months of 2014 on the contracts utilized to manage exposure to prices of metals in our concentrate shipments, which is included in sales of products. The net loss recognized on the contracts offsets gains related to price adjustments on our provisional concentrate sales due to changes to silver, gold, lead and zinc prices between the time of sale and final settlement.
We recognized a $2.1 million net loss during the first six months of 2014 on the contracts utilized to manage exposure to prices for forecasted future concentrate shipments, which is net of $2.0 million in gains realized on settled contracts. The net loss on these contracts is included as a separate line item under other income (expense), as they relate to forecasted future shipments, as opposed to sales that have already taken place but are subject to final pricing. The net loss during the first six months of 2014 is primarily the result of increasing zinc prices. This program is designed to mitigate the impact of potential future declines in lead and zinc prices from the price levels established in the contracts (see average price information below).
The following table summarizes the quantities of metals committed under forward sales contracts at June 30, 2014:
|
Ounces/pounds under contract (in 000's) |
Average price per ounce/pound |
|||||||||||||||||||||||||||||||
|
Silver |
Gold |
Zinc |
Lead |
Silver |
Gold |
Zinc |
Lead |
|||||||||||||||||||||||||
|
(ounces) |
(ounces) |
(pounds) |
(pounds) |
(ounces) |
(ounces) |
(pounds) |
(pounds) |
|||||||||||||||||||||||||
|
Contracts on provisional sales |
||||||||||||||||||||||||||||||||
|
2014 settlements |
786 | 4 | 12,236 | 6,449 | $ | 18.90 | $ | 1,263 | $ | 0.95 | $ | 0.95 | ||||||||||||||||||||
|
Contracts on forecasted sales |
||||||||||||||||||||||||||||||||
|
2014 settlements |
— | — | 19,566 | 14,330 |
N/A |
N/A |
$ | 1.01 | $ | 1.09 | ||||||||||||||||||||||
|
2015 settlements |
— | — | 49,604 | 40,179 |
N/A |
N/A |
$ | 0.96 | $ | 1.07 | ||||||||||||||||||||||
|
2016 settlements |
— | — | 32,022 | 32,132 |
N/A |
N/A |
$ | 0.97 | $ | 1.03 | ||||||||||||||||||||||
|
2017 settlements |
— | — | 661 | — |
N/A |
N/A |
$ | 0.99 |
N/A |
|||||||||||||||||||||||
Foreign Currency
We operate or have mining interests in Canada and Mexico, which exposes us to risks associated with fluctuations in the exchange rates of the currencies involved, particularly between the U.S. dollar and Canadian dollar. On June 1, 2013, we completed the acquisition of Aurizon Mines Ltd., which gave us ownership of the Casa Berardi mine and various mineral interests in Quebec, Canada. We have determined that the functional currency for our Canadian operations is the U.S. dollar. As such, foreign exchange gains and losses associated with the re-measurement of monetary assets and liabilities from Canadian dollars to U.S. dollars are recorded to earnings each period. For the six months ended June 30, 2014, we recognized a net foreign exchange loss of $1.2 million. Foreign currency exchange rates are influenced by a number of factors beyond our control. We currently do not utilize forward contracts or other contracts to manage our exposure to foreign currency fluctuations, but we may do so in the future. A one percent change in the exchange rate between the U.S. dollar and Canadian dollar from the rate at June 30, 2014 would have resulted in a change of approximately $1.7 million in our net foreign exchange loss.
Item 4. Controls and Procedures
An evaluation was performed under the supervision and with the participation of our management, including the Chief Executive Officer (“CEO”) and Chief Financial Officer (“CFO”), of the effectiveness of the design and operation of our disclosure controls and procedures as required by Securities Exchange Act Rules 13a-15(e) and 15d-15(e) as of the end of the period covered by this report. Based on that evaluation, our CEO and CFO concluded that our disclosure controls and procedures, including controls and procedures designed to ensure that information required to be disclosed by us is accumulated and communicated to our management (including our CEO and CFO), were effective as of June 30, 2014, in assuring them in a timely manner that material information required to be disclosed in this report has been properly recorded, processed, summarized and reported. There were no changes in our internal control over financial reporting during the quarter ended June 30, 2014, that have materially affected, or are reasonably likely to materially affect, our internal control over financial reporting.
Internal control systems, no matter how well designed and operated, have inherent limitations. Therefore, even a system which is determined to be effective cannot provide absolute assurance that all control issues have been detected or prevented. Our systems of internal controls are designed to provide reasonable assurance with respect to financial statement preparation and presentation.
Part II - Other Information
Hecla Mining Company and Subsidiaries
Item 1. Legal Proceedings
For information concerning legal proceedings, refer to Note 4 of Notes to Condensed Consolidated Financial Statements (Unaudited), which is incorporated by reference into this Item 1.
Item 1A. Risk Factors
Item 1A – Risk Factors of our annual report filed on Form 10-K for the year ended December 31, 2013 sets forth information relating to important risks and uncertainties that could materially adversely affect our business, financial condition or operating results. Those risk factors continue to be relevant to an understanding of our business, financial condition and operating results.
Item 2. Unregistered Sales of Equity Securities and Uses of Proceeds
Issuer Purchases of Equity Securities
On May 8, 2012, we announced that our Board of Directors approved a stock repurchase program. Under the program, we are authorized to repurchase up to 20 million shares of our outstanding common stock from time to time in open market or privately negotiated transactions. See Note 9 of Notes to Condensed Consolidated Financial Statements (Unaudited) for more information. The following table provides information about purchases we made under the program during the quarter ended June 30, 2014 of equity securities that are registered by us pursuant to Section 12 of the Exchange Act:
|
Period |
Total number of shares purchased |
Average price paid per share |
Total number of shares purchased as part of publicly announced programs |
Maximum number of shares that may yet to be purchased under the program as of 6/30/2014 |
||||||||||||
|
4/1/2014 - 4/30/2014 |
— |
N/A |
N/A |
|||||||||||||
|
5/1/2014 - 5/31/2014 |
175,000 | $ | 2.90 | 175,000 | ||||||||||||
|
6/1/2014 - 6/30/2014 |
358,800 | $ | 2.76 | 358,800 | ||||||||||||
|
Total |
533,800 | $ | 2.81 | 533,800 | 19,065,900 | |||||||||||
Item 4. Mine Safety Disclosures
The information concerning mine safety violations or other regulatory matters required by Section 1503(a) of the Dodd-Frank Wall Street Reform and Consumer Protection Act and Item 104 of Regulation S-K is included in exhibit 95 to this Quarterly Report.
Item 6. Exhibits
See the exhibit index to this Quarterly Report for the list of exhibits.
Items 3 and 5 of Part II are not applicable and are omitted from this report.
Hecla Mining Company and Subsidiaries
SIGNATURES
Pursuant to the requirements of the Securities Exchange Act of 1934, the registrant has duly caused this report to be signed on its behalf by the undersigned thereunto duly authorized.
|
HECLA MINING COMPANY | |||
|
(Registrant) | |||
|
Date: |
July 31, 2014 |
By: |
/s/ Phillips S. Baker, Jr. |
|
Phillips S. Baker, Jr., President, | |||
|
Chief Executive Officer and Director | |||
|
Date: |
July 31, 2014 |
By: |
/s/ James A. Sabala |
|
James A. Sabala, Senior Vice President and | |||
|
Chief Financial Officer | |||
Hecla Mining Company and Wholly Owned Subsidiaries
Form 10-Q – June 30, 2014
Index to Exhibits
|
3.1 |
Certificate of Incorporation of the Registrant as amended to date. Filed as exhibit 3.1 to Registrant's Form 10-Q for the quarter ended June 30, 2010 (File No. 1-8491), and incorporated herein by reference. |
|
3.2 |
Bylaws of the Registrant as amended to date. Filed as exhibit 3.1 to Registrant's Current Report on Form 8-K filed on December 6, 2007 (File No. 1-8491), and incorporated herein by reference. |
|
4.1(a) |
Certificate of Designations, Preferences and Rights of Series A Junior Participating Preferred Stock of the Registrant. Filed as exhibit 3.1 to Registrant's Quarterly Report on Form 10-Q for the quarter ended June 30, 2010 (File No 1-8491), and incorporated herein by reference. |
|
4.1(b) |
Certificate of Designations, Preferences and Rights of Series B Cumulative Convertible Preferred Stock of the Registrant. Filed as exhibit 3.1 to Registrant's Quarterly Report on Form 10-Q for the quarter ended June 30, 2010 (File No. 1-8491), and incorporated herein by reference. |
|
4.2(a) |
Form of Series 1 Common Stock Purchase Warrant. Filed as exhibit 4.1 to Registrant's Current Report on Form 8-K filed on December 11, 2008 (File No. 1-8491), and incorporated herein by reference. |
|
4.2(b) |
Form of Series 3 Common Stock Purchase Warrant. Filed as exhibit 4.1 to Registrant's Current Report on Form 8-K filed on February 9, 2009 (File No. 1-8491), and incorporated herein by reference. |
|
4.3(a) |
Indenture dated as of April 12, 2013 among Hecla Mining Company, as Issuer, certain subsidiaries of Hecla Mining Company, as Guarantors thereto, and The Bank of New York Mellon Trust Company, N.A., as Trustee. Filed as exhibit 10.1 to Registrant’s Current Report on Form 8-K filed on April 15, 2013 (File No. 1-8491), and incorporated herein by reference. |
|
4.3(b) |
Supplemental Indenture dated as of April 14, 2014 among Hecla Mining Company, as Issuer, certain subsidiaries of Hecla Mining Company, as Guarantors thereto, and the Bank of New York Mellon Trust Company, N.A., as Trustee. Filed as exhibit 4.2 to Registrant's Form S-3ASR filed on April 14, 2014 (File No. 1-8491), and incorporated herein by reference. |
|
|
4.3(c) |
Registration Rights Agreement dated as of April 14, 2014 among Hecla Mining Company, as Issuer, certain subsidiaries of Hecla Mining Company, as Guarantors thereto, and Hecla Mining Company Retirement Plan Trust, which is the funding vehicle for the Hecla Mining Company Retirement Plan, a tax-qualified employee benefit pension plan sponsored by Hecla Mining Company. Filed as exhibit 4.3 to Registrant's S-3ASR filed on April 14, 2014 (File No. 1-8491), and incorporated herein by reference. |
|
10.1 |
Third Amended and Restated Credit Agreement effective February 14, 2014, by and among Hecla Mining Company, Hecla Limited, Hecla Alaska LLC, Hecla Greens Creek Mining Company and Hecla Juneau Mining Company, as Borrowers, The Bank of Nova Scotia, as the Administrative Agent for the Lenders, and various Lenders. Filed as exhibit 10.1 Registrant's Current Report on Form 8-K on February 18, 2014 (File No. 1-8491), and incorporated herein by reference. |
|
31.1 |
Certification pursuant to Section 302 of the Sarbanes-Oxley Act of 2002. * |
|
31.2 |
Certification pursuant to Section 302 of the Sarbanes-Oxley Act of 2002. * |
|
32.1 |
Certification pursuant to Section 906 of the Sarbanes-Oxley Act of 2002. * |
|
32.2 |
Certification pursuant to Section 906 of the Sarbanes-Oxley Act of 2002. * |
|
95 |
Mine safety information listed in Section 1503 of the Dodd-Frank Act. * |
|
|
101.INS |
XBRL Instance. ** |
|
101.SCH |
XBRL Taxonomy Extension Schema.** |
|
101.CAL |
XBRL Taxonomy Extension Calculation.** |
|
101.DEF |
XBRL Taxonomy Extension Definition.** |
|
101.LAB |
XBRL Taxonomy Extension Labels.** |
|
|
101.PRE |
XBRL Taxonomy Extension Presentation.** |
* Filed herewith.
** XBRL information is furnished and not filed or a part of a registration statement or prospectus for purposes of Sections 11 or 12 of the Securities and Exchange Act of 1933, as amended, is deemed not filed for purposes of Section 18 of the Securities and Exchange Act of 1934, as amended, and otherwise is not subject to liability under these sections.
53