Attached files
| file | filename |
|---|---|
| 8-K - FORM 8-K - U.S. CONCRETE, INC. | d765113d8k.htm |
 Investor Presentation
July 29, 2014
Exhibit 99.1 |
 Certain
statements
and
information
provided
in
this
presentation
are
“forward-looking
statements”
within
the
meaning
of
the
Private Securities Litigation Reform Act of 1995. These forward-looking
statements include, without limitation, statements concerning plans,
objectives, goals, projections, strategies, future events or performance, and underlying assumptions and other
statements, which are not statements of historical facts. These forward-looking
statements are based on our current expectations and beliefs concerning
future developments and their potential effect on us and do not include the impact of future acquisitions.
While
management
believes
that
these
forward-looking
statements
are
reasonable
as
and
when
made,
there
can
be
no
assurance
that future developments affecting us will be those that we anticipate. Our
forward-looking statements involve significant risks and uncertainties
(some of which are beyond our control) and assumptions that could cause actual results to differ materially. The
forward-looking statements speak only as of the date of this
presentation. Investors are cautioned not to rely unduly upon these
forward-looking statements. The Company undertakes no obligation to
update these forward-looking statements, except as required by
law. Important factors that could cause actual results to differ
materially from those in the forward-looking statements include, but are
not limited to, general economic and business conditions, which will, among other
things, affect demand for new residential and commercial construction; our
ability to successfully identify, manage, and integrate acquisitions; the cyclical nature of, and
changes in, the real estate and construction markets, including pricing changes by
our competitors; governmental requirements and initiatives, including those
related to mortgage lending or mortgage financing, funding for public or infrastructure construction,
land usage, and environmental, health, and safety matters; disruptions,
uncertainties or volatility in the credit markets that may limit our, our
suppliers' and our customers' access to capital; our ability to successfully implement our operating strategy; weather
conditions; our substantial indebtedness and the restrictions imposed on us by the
terms of our indebtedness; our ability to maintain favorable relationships
with third parties who supply us with equipment and essential supplies; our ability to retain key
personnel
and
maintain
satisfactory
labor
relations;
and
product
liability,
property
damage,
and
other
claims
and
insurance
coverage issues.
For
additional
information
regarding
known
material
factors
that
could
cause
our
actual
results
to
differ
from
our
projected
results,
please see “Risk Factors”
in our Form 10-K and our Quarterly Reports on Form 10-Q filed with the
Securities and Exchange Commission. All written and oral
forward-looking statements in this presentation are expressly qualified by these “Risk Factors.”
Page 2
Forward-Looking Statements |
 Company Overview |
 Business Overview
U.S. Concrete is one of the largest non-integrated concrete producers in the
U.S. National producer of ready-mixed concrete
Headquartered in Euless, TX
Trades on NASDAQ under ticker “USCR”
Market
capitalization
of
$362.9
million
Total
Enterprise
Value
of
$481.2
million
Financial Overview
LTM
3/31/14
Revenue:
$619.0
million
(91.1%
ready-mixed;
3.7%
aggregates)
3
LTM
3/31/14
Adjusted
EBITDA:
$53.8
million
4
U.S. Concrete Overview
¹
Based on USCR stock price of $25.95 as of 7/24/14 and basic shares outstanding of
13.985 million as of 7/24/14 2
Enterprise value is defined as market capitalization plus debt less cash and cash
equivalents 3
Excludes $16.8 million of internal aggregates sales that are eliminated in
consolidation. 4
Adjusted EBITDA is a non-GAAP financial measure, see page 28 for more
information Page 4
1
2 |
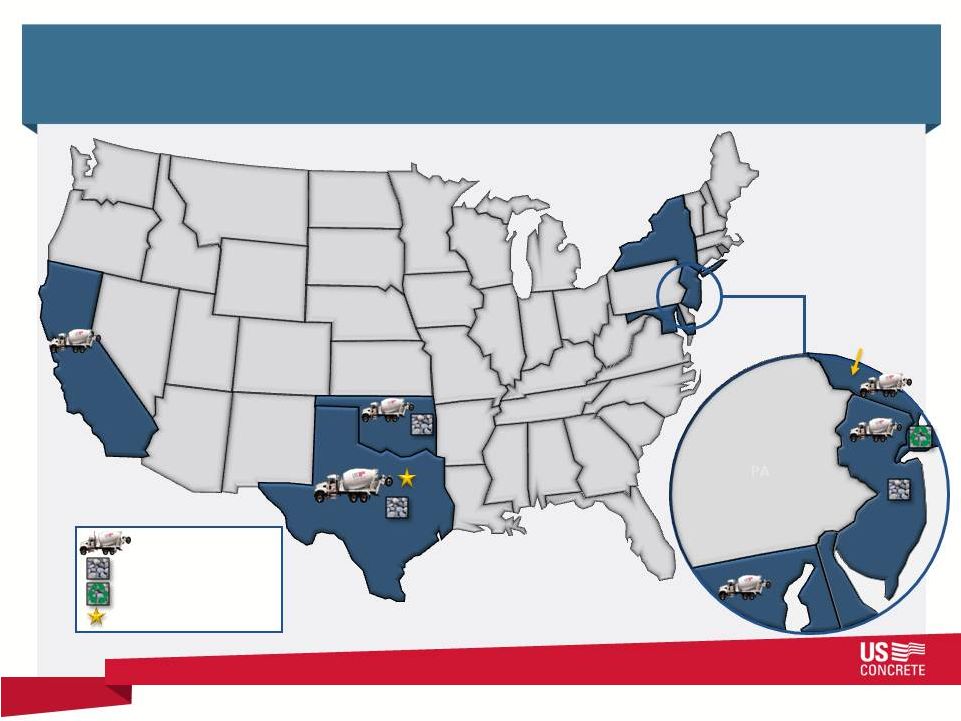 SAN
FRANCISCO Strong Positions in Attractive Markets
Page 5
17 Ready-
Mixed
67 Ready-Mixed
5 Aggregates
9 Ready-Mixed
1 Aggregate
DC
NJ
DE
PA
PA
2 Ready-
Mixed
14 Ready-
Mixed
3 Aggs.
5 Ready-Mixed
1 Recycled
Aggregates
NY
READY-MIXED PLANTS
AGGREGATES FACILITIES
RECYCLED AGGREGATES
CORPORATE HEADQUARTERS |
 Growth Driven by Key Sectors
Texas/Oklahoma
Northern California
New York/New Jersey
Washington, D.C.
Page 6
Energy
Technology
Financial Services
Government |
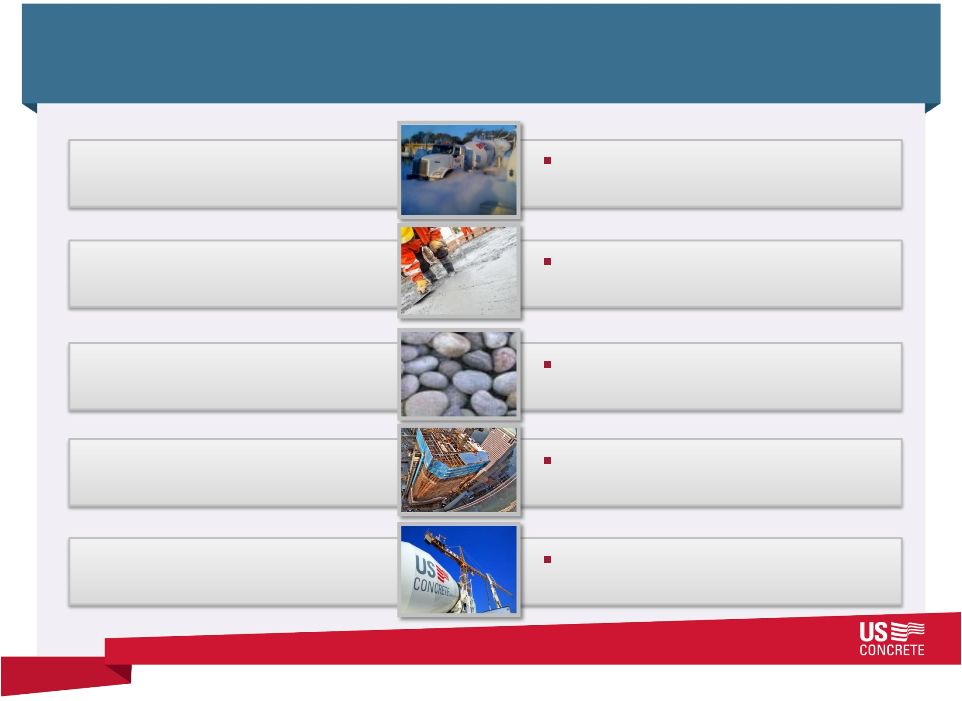
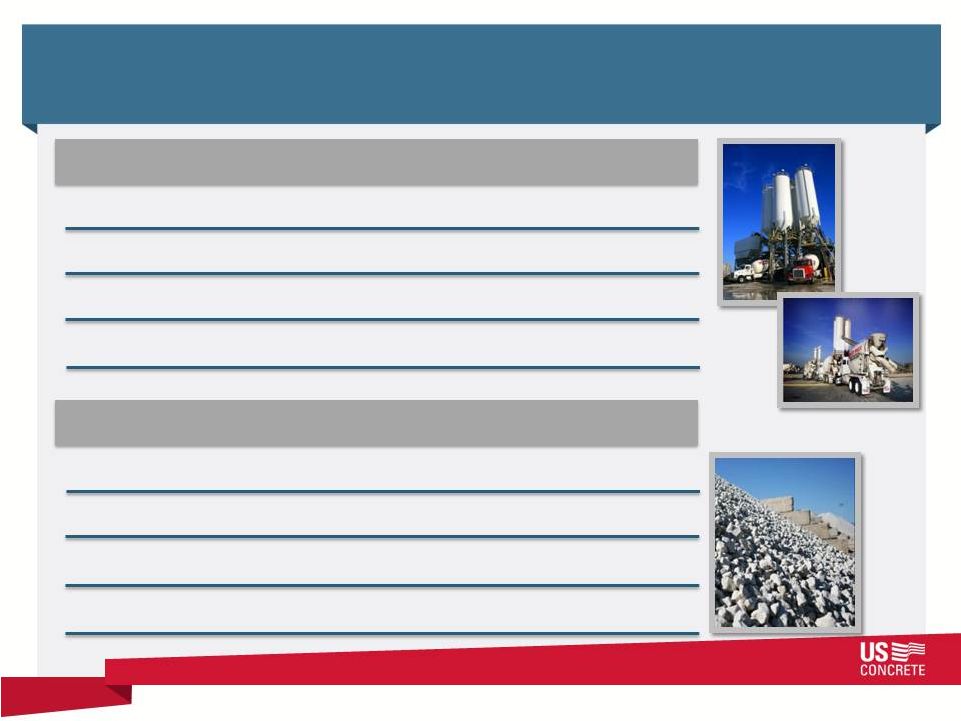 -
Over 80 million tons of owned and leased reserves
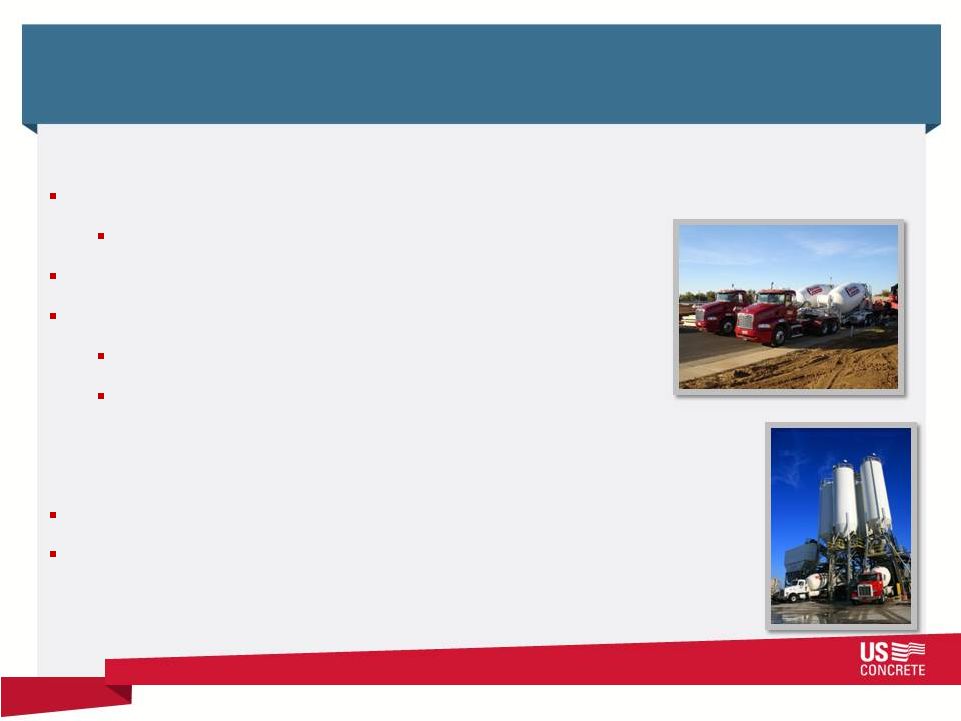
Significant Quality Asset Base
Page 7
5.2 million cubic yards of concrete sold in 2013
940+ ready-mixed concrete trucks
Aggregates’
primary focus is supply of USCR ready-mixed operations
-
9 aggregate facilities and 1 aggregate recycle operation
114 ready-mixed concrete plants
-
3.6 million tons of aggregates produced in 2013
Leading market position in four regions with attractive fundamentals
Ready-Mixed Concrete
Aggregates |
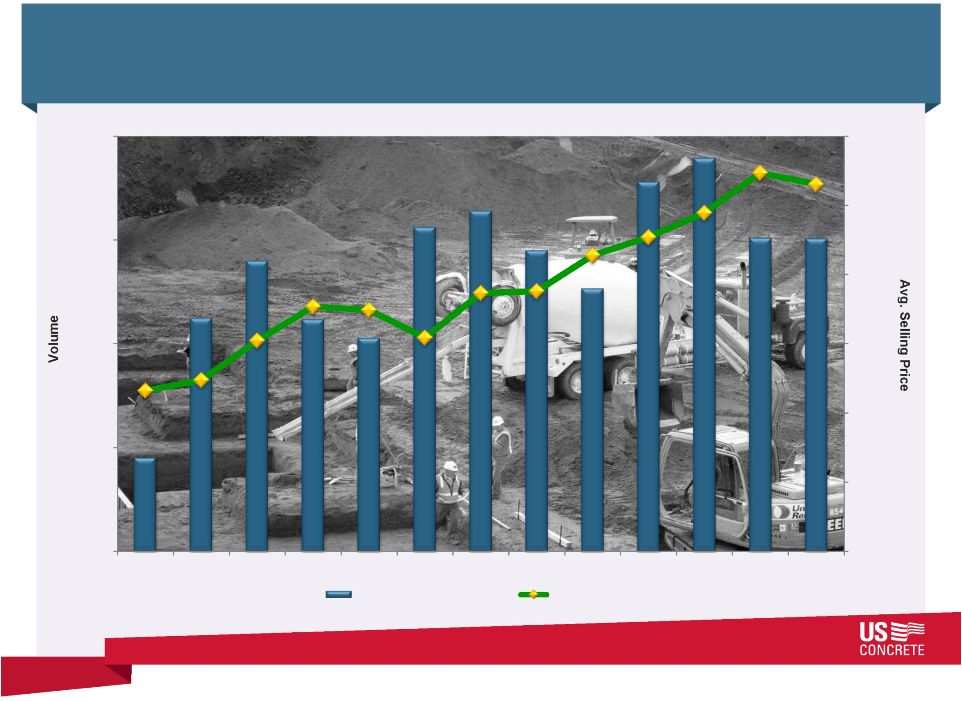
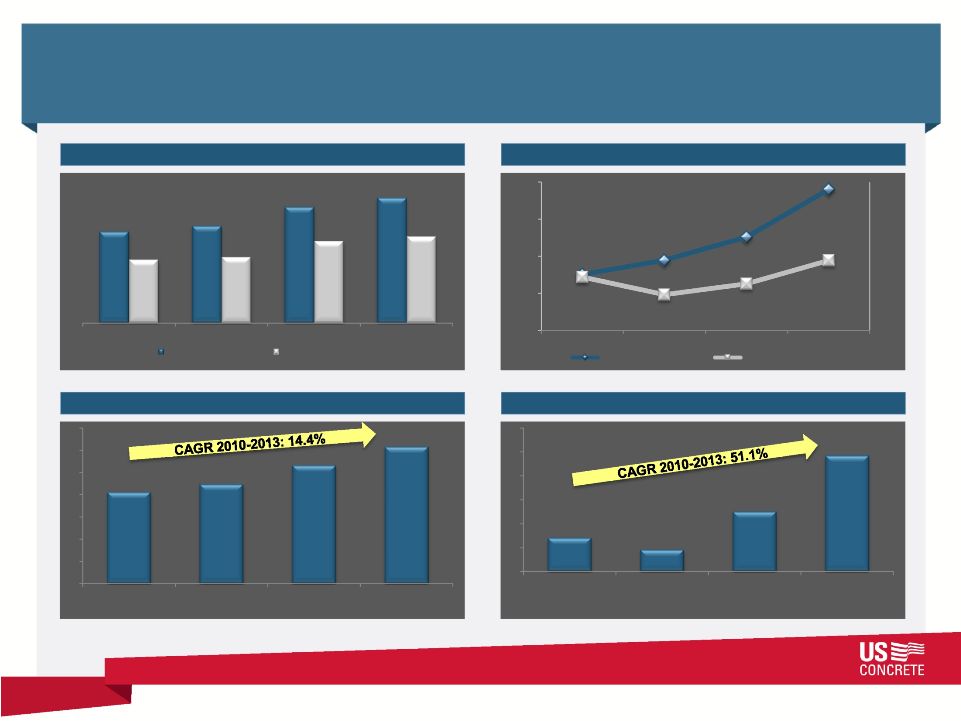 Strong Historical Performance Trend
Page 8
Volume (‘000)
Average Selling Price
Revenue ($mm)
Adjusted EBITDA ($mm)
3,805
2,624
4,047
2,741
4,839
3,407
5,225
3,597
2010
2011
2012
2013
Ready Mix (CYDs)
Ready Mix ($/CYD)
Aggregate (Tons)
Aggregate ($/ton)
2010
2011
2012
2013
2010
2011
2012
2013
2010
2011
2012
2013
$411
$446
$531
$615
$14
$9
$25
$48
$92.54
$94.48
$97.59
$104.03
$8.16
$7.46
$7.89
$8.84
$105
$100
$95
$90
$85
$12
$11
$10
$9
$8
$7
$6 |
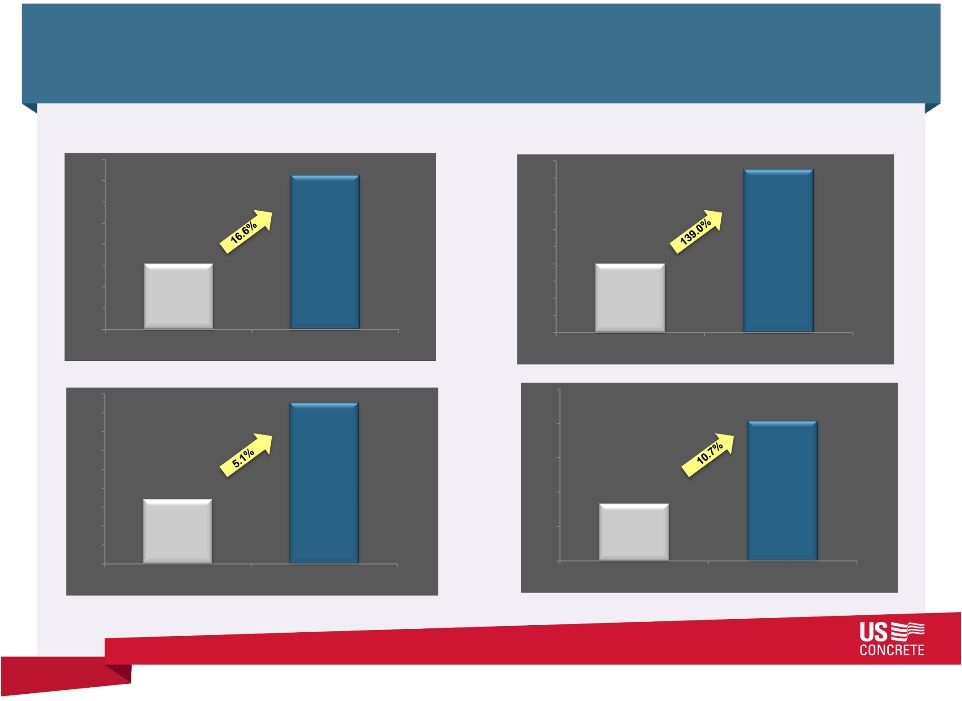 Improved Year-over-Year Performance
Page 9
(in millions, except ASP)
$110
$115
$120
$125
$130
$135
$140
$145
$150
$125.4
$146.3
Q1 '13
Q1 '14
Revenue
$-
$1
$2
$3
$4
$5
$6
$7
$8
$9
$10
$4.0
$9.5
Q1 '13
Q1 '14
Adj. EBITDA
$98
$99
$100
$101
$102
$103
$104
$105
$106
$107
$106.53
Q1 '13
Q1 '14
ASP (per cyd)
1.05
1.10
1.15
1.20
1.25
1.30
Q1 '13
Q1 '14
Ready
-Mixed Volume
(cyds)
$101.40
1.133
1.254 |
 Ready-Mixed Top Line Drivers
Page 10
726
1,062
1,200
1,059
1,014
1,281
1,320
1,225
1,133
1,390
1,447
1,255
1,254
$91.61
$92.37
$95.23
$97.70
$97.44
$95.44
$98.67
$98.81
$101.40
$102.71
$104.47
$107.36
$106.53
$80
$85
$90
$95
$100
$105
$110
500
750
1,000
1,250
1,500
Q1 '11
Q2 '11
Q3 '11
Q4 '11
Q1 '12
Q2 '12
Q3 '12
Q4 '12
Q1 '13
Q2 '13
Q3 '13
Q4 '13
Q1 '14
Volume (cyds in 000's)
ASP (per cyd) |
 Solid Capital Structure
As of March 31, 2014
8.5% Senior Secured Notes due December 1, 2018
$ 200.0
$125mm ABL Revolver expiring October 2, 2018
0.0
Other Debt
14.5
Total Debt
214.5
1
Based on stock price of $25.95 as of 7/24/14
Cash
$ 96.2
Net Debt
118.3
362.9
Enterprise Value
481.2
LTM Adjusted EBITDA
$ 53.8
Total Debt/LTM Adjusted EBITDA
4.0x
Net Debt/LTM Adjusted EBITDA
2.2x
Page 11
($ millions)
1
Equity
Value |
 Industry Overview |
 Increasing vertical integration among
cement, aggregates and concrete
producers
Source: National Ready-Mixed Concrete Association
Annual Revenue
$30.0 B
Ready-Mixed
Concrete Producers
2,000
Ready-Mixed Concrete Market Size
Large, Fragmented Market
Page 13
Ready-Mixed
Concrete Plants
5,500 |
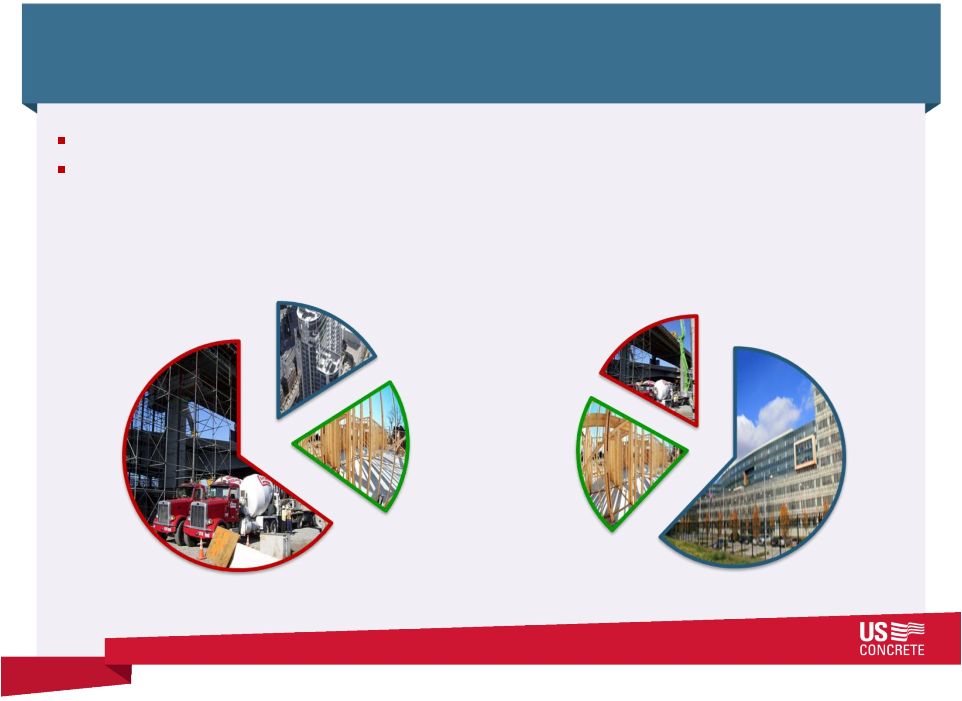 Focused on Key End Use Markets
Page 14
Source: McGraw-Hill Construction market outlook for 2013 as of Q4
2013 Total U.S. Market
Commercial and industrial sectors generate higher margins
Streets and highways often self-performed by construction companies
U.S. Concrete, Inc.
Residential
19%
Commercial & Industrial
16%
Street, Highway, &
Other Public Works
65%
Residential
21%
Commercial &
Industrial
62%
Street, Highway, &
Other Public Works
17%
Source: U.S. Concrete, Inc.
2013 Ready-Mixed Concrete Volume |
 Evidence of Strength in our Regional Markets
Page 15
Housing starts in U.S. Concrete served regional markets
2-Year Compound Annual Growth Rate, 2011-2013
Source: United States Census Bureau –
Building Permits Survey
0%
10%
20%
30%
40%
50%
New York -
New
Jersey
Dallas -
Fort Worth
West Texas
San Francisco
National
Average |
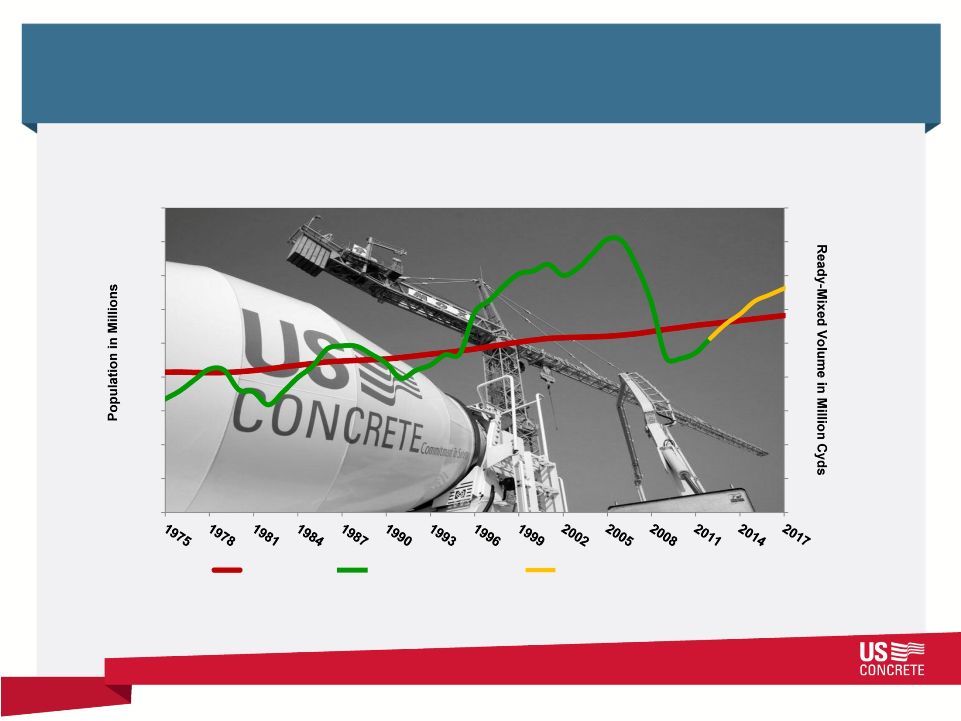 Growth Trend for U.S. Concrete Served Markets
Page 16
Source: Company estimates of ready-mixed concrete demand using market
population data from Woods & Poole. U.S.
Concrete’
s
Regional
Markets
Leveraged
to
Favorable
Growth
Prospects
0
5
10
15
20
25
30
35
40
45
0
5
10
15
20
25
30
35
40
45
Population
Concrete Production
Forecasted Concrete Demand |
 Company Strategy and Focus |
 U.S. Concrete’s Focus Today to Continue to Improve
Performance
Page 18
Pursue strategic development opportunities
Focus on ready-mixed concrete and aggregates
Evaluate assets, business units and opportunities
Continue to aggressively manage cost structure |
 Acquisition Strategy and Historical Acquisitions
Acquisition Strategy
Continue
to
expand
within
and
concentrically
around
our
existing
regional
markets
through
bolt-ons and vertical integration
Focus on ready-mixed in all regions and aggregates, particularly in Northern
California and Dallas / Forth Worth
Also considering selected larger-scale opportunities in new geographies
Recent Transactions
Choice Ready-Mix (March 2014)
Red River Sand & Gravel Greenfield (March 2014)
Young Ready-Mix (Feb 2014)
Bodin Concrete (July 2013)
Bode Concrete (Oct 2012)
Colorado River Concrete (Sept 2012)
Granite/Scara Mix (July 2012)
Page 19 |
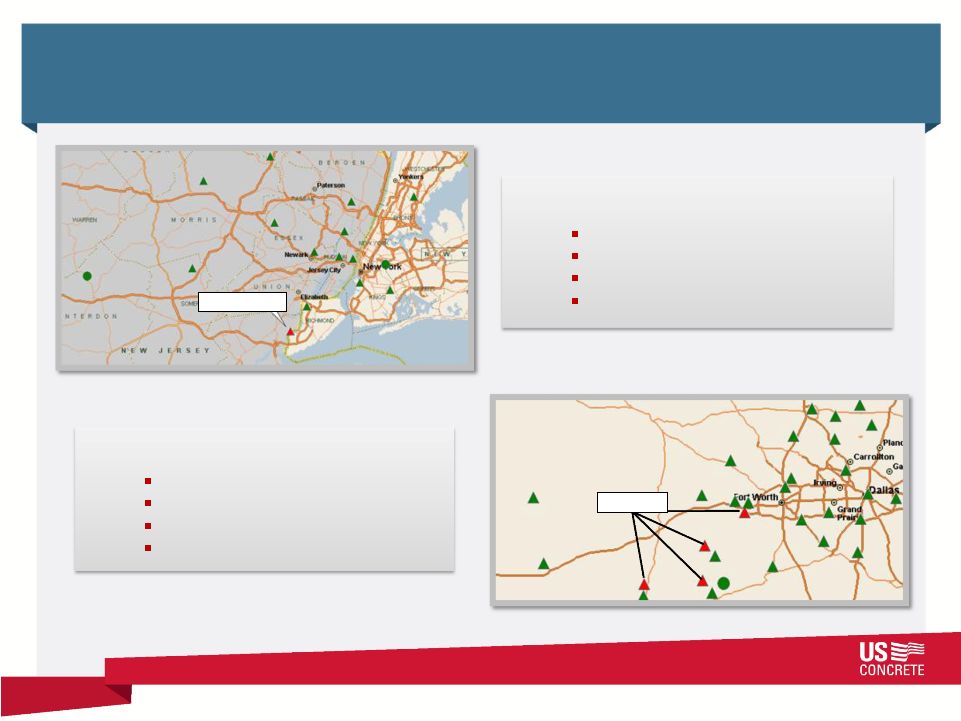 Acquisition Activity
Page 20
Granite/Scara Mix: Staten Island, NY
Lease Agreement (July 2012)
Single Facility –
One Plant
Volume –
80K cyds/year
16 Mixer Trucks
Scara Mix
Colorado River Concrete: West Texas
Asset Deal (closed Sept 2012)
Four Facilities –
Four Plants
Volume –
80K cyds/year
16 Mixer Trucks
CRC Plants |
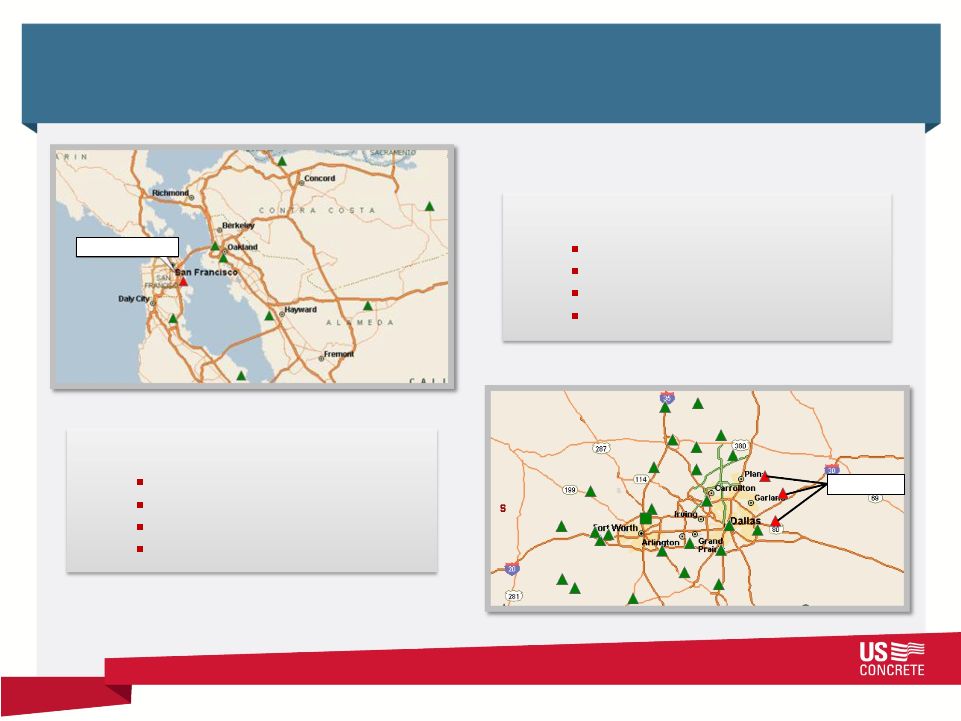 Acquisition Activity (contd.)
Page 21
Bode Companies: San Francisco, CA
Stock Deal (closed Oct 2012)
Single Facility –
Three Plants
Volume -
260K cyds/year
41 Mixer Trucks
Bode Concrete
Bodin Concrete: Dallas,TX
Asset Deal (closed July 2013)
Acquired out of bankruptcy
Three Facilities –
Three Plants
Volume –
100K cyds/year
Bodin Plants |
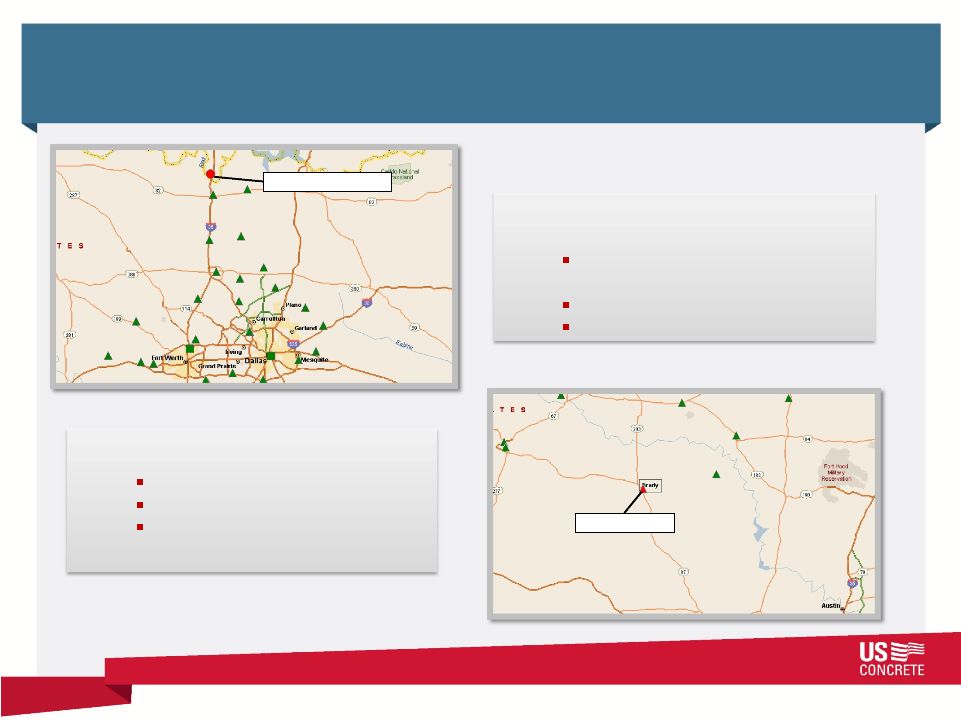 Acquisition Activity (contd.)
Page 22
Red River Sand & Gravel:
Thackerville, OK
Greenfield (announced March
2014)
Single facility
Addresses DFW’s sand shortage
Red River Sand & Gravel
Young Ready-Mix: Brady, TX
Asset Deal (closed Feb 2014)
Single plant facility
Expands footprint in West
Texas
Young Ready-Mix |
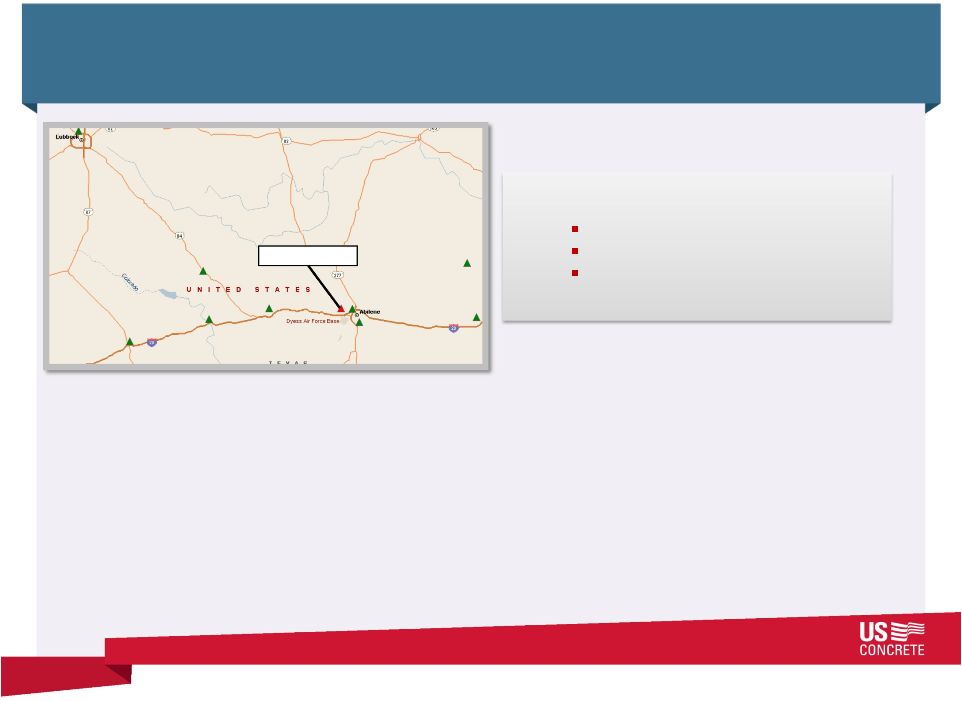 Page 23
Choice Ready-Mix: Tye, TX
Asset Deal (closed March 2014)
Single plant facility
Strengthens position in greater
Abilene market of West Texas
Choice Ready-Mix
Acquisition Activity (contd.) |
 USCR Competitive Advantage
Strong
Leadership
Operating
excellence
Group-wide
sourcing
Central IT &
support
Focused R&D
Page 24
Healthy regional
economies
Vertically
integrated
synergies
Best practice
execution
Concentrated
Purchasing
Power
Deep market
knowledge
Fast & flexible
delivery
Customer
relationships
High end product
offering
Superior
returns
Excellent
reputation
Supplier of
choice
Accelerated
growth
potential
National Support
Selected
Regional
Franchises
Local
Presence
Success
Large
company
resources
–
local
company
entrepreneurship |
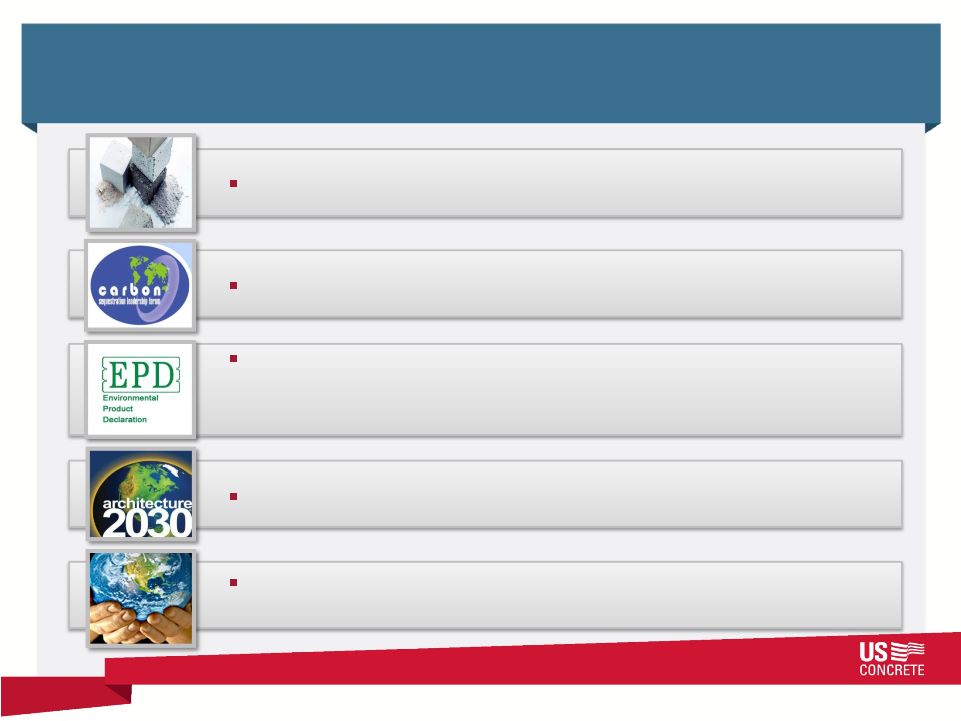 Sustainability Leadership
Page 25
Leader in low CO
2
concrete
Charter member of Carbon Leadership Forum
First ready-mix company in North America to adopt and
receive verified Environmental Product Declarations (EPDs)
for its concrete mixes
Pledged to Architecture 2030
Employ extensive sustainable operational practices across
the enterprise |
 Benefits of Our Sustainable Strategy
Page 26
Sustainable demand to grow
at a higher rate
Increase product demand
Higher priced value-added
products drive margins
Increase revenue and
profit per yard
Lower cost of cement
alternatives
Reduce raw material cost
per yard
Cement companies remain
focused on core cement
Differentiate USCR from
competition
First mover offering solution to
owners
Create competitive
advantage |
 Investment Highlights
Page 27
Experienced management team
Strong financial performance and conservative balance sheet
Focus on sustainable leadership and strategy
Long-term diversified customer base
Well positioned to benefit from rebound in construction market
High quality asset base in attractive markets
Favorable exposure to commercial projects with higher margins and barriers to
entry |
 Disclosure of Non-GAAP Financial Measures
U.S. CONCRETE, INC.
ADDITIONAL STATISTICS
(In thousands, unless otherwise noted; unaudited)
We report our financial results in accordance with generally accepted accounting
principles in the United States (“GAAP”). However, our management
believes that certain non-GAAP performance measures and ratios, which our management uses in
managing our business, may provide users of this financial information additional
meaningful comparisons between current results and results in prior operating
periods. See the following table for presentations of our adjusted EBITDA and adjusted EBITDA margin
for the years 2012 and 2013 and the first three months of 2013 and 2014.
We define adjusted EBITDA as our net income (loss) from continuing operations plus
the provision (benefit) for income taxes, net interest expense, depreciation,
depletion and amortization, reorganization costs, noncash impairments, derivative (income) loss,
expenses related to the departure of our former CEO, expenses related to the
relocation of our corporate headquarters, gain (loss) on extinguishment of
debt and non-cash stock compensation expense. We define adjusted EBITDA margin as the amount determined by
dividing adjusted EBITDA by total revenue. We have included adjusted EBITDA and
adjusted EBITDA margin in the accompanying tables because they are often used
by investors for valuation and for comparing our financial performance with the performance of
other building material companies. We also use adjusted EBITDA to monitor and compare
the financial performance of our operations. Adjusted EBITDA does not give
effect to the cash we must use to service our debt or pay our income taxes and thus does
not reflect the funds actually available for capital expenditures. In addition,
our presentation of adjusted EBITDA may not be comparable to similarly titled
measures other companies report. Non-GAAP
financial
measures
should
be
viewed
in
addition
to,
and
not
as
an
alternative
for,
our
reported
operating
results
or
cash flow from operations or any other measure of performance prepared in accordance
with GAAP. Page 28 |
 Reconciliation of Non-GAAP Financial Measures
Page 29
¹
Adjusted EBITDA is defined as income (loss) from continuing operations, plus income
tax provision (benefit), net interest expense, derivative (income) loss related to our
Convertible
Notes
and
Warrants,
depreciation,
depletion
and
amortization,
loss
on
early
extinguishment
of
debt,
expenses
related
to
our
corporate
headquarters
relocation,
officer severance, and non-cash stock compensation expense.
(in thousands, except per share amounts)
2012
2013
2013
2014
Adjusted EBITDA¹
reconciliation:
Net Loss from Continuing Operations
(25,749)
$
(18,390)
$
(13,560)
$
(1,626)
$
Income tax (benefit) expense
(3,760)
1,155
(5,197)
22
Interest expense, net
11,344
11,332
2,772
5,010
Derivative loss (income)
19,725
29,964
18,446
623
Depreciation, depletion and amortization
15,676
18,984
4,825
4,898
Loss (gain) on extinguishment of debt
2,630
(985)
(4,310)
-
Expenses related to corporate headquarters relocation
2,484
550
224
-
Officer severance
275
245
-
-
Non-cash stock compensation expense
2,512
5,429
758
530
Adjusted EBITDA
25,137
$
48,284
$
3,958
$
9,457
$
Adjusted EBITDA margin
4.7%
7.9%
3.2%
6.5%
Quarter Ended March 31,
Year Ended December 31, |
 Investor Presentation
July 29, 2014 |