Attached files
| file | filename |
|---|---|
| EX-32 - EXHIBIT - SCHOLASTIC CORP | schl-ex32_5312014x10k.htm |
| EX-31.2 - EXHIBIT - SCHOLASTIC CORP | schl-ex312_5312014x10k.htm |
| EX-21 - EXHIBIT - SCHOLASTIC CORP | exhibit21.htm |
| EX-31.1 - EXHIBIT - SCHOLASTIC CORP | schl-ex311_5312014x10k.htm |
| EXCEL - IDEA: XBRL DOCUMENT - SCHOLASTIC CORP | Financial_Report.xls |
| EX-23 - EXHIBIT - SCHOLASTIC CORP | exhibit_23.htm |

United States
Securities and Exchange Commission
Washington, D.C. 20549
Form 10-K
Annual Report pursuant to Section 13 or 15(d) of
the Securities Exchange Act of 1934
For the fiscal year ended May 31, 2014 | Commission File No. 000-19860
Scholastic Corporation
(Exact name of Registrant as specified in its charter)
Delaware | 13-3385513 |
(State or other jurisdiction of | (IRS Employer Identification No.) |
incorporation or organization) | |
557 Broadway, New York, New York | 10012 |
(Address of principal executive offices) | (Zip Code) |
Registrant’s telephone number, including area code: (212) 343-6100
Securities Registered Pursuant to Section 12(b) of the Act:
Title of class | Name of Each Exchange on Which Registered |
Common Stock, $0.01 par value | The NASDAQ Stock Market LLC |
Securities Registered Pursuant to Section 12(g) of the Act:
NONE
Indicate by check mark if the Registrant is a well-known seasoned issuer, as defined in Rule 405 of the Securities Act. Yes x No o
Indicate by check mark if the Registrant is not required to file reports pursuant to Section 13 or Section 15(d) of the Act. Yes o No x
Indicate by check mark whether the Registrant (1) has filed all reports required to be filed by Section 13 or 15(d) of the Securities Exchange Act of 1934 during the preceding 12 months (or for such shorter period that the Registrant was required to file such reports), and (2) has been subject to such filing requirements for the past 90 days. Yes x No o
Indicate by check mark whether the registrant has submitted electronically and posted on its corporate website, if any, every Interactive Data File required to be submitted and posted pursuant to Rule 405 of Regulation S-T (§ 232.405 of this chapter) during the preceding 12 months (or for such shorter period that the registrant was required to submit and post such files). Yes x No o
Indicate by check mark if disclosure of delinquent filers pursuant to Item 405 of Regulation S-K is not contained herein, and will not be contained, to the best of Registrant’s knowledge, in definitive proxy or information statements incorporated by reference in Part III of this Form 10-K or any amendment to this Form 10-K. x
Indicate by check mark whether the Registrant is a large accelerated filer, an accelerated filer, a non-accelerated filer or a smaller reporting company. See definitions of “large accelerated filer,” “accelerated filer” and “smaller reporting company” in Rule 12b-2 of the Exchange Act. (Check one):
x Large accelerated filer | o Accelerated filer | o Non-accelerated filer | o Smaller reporting company |
Indicate by check mark whether the Registrant is a shell company (as defined in Rule 12b-2 of the Act). Yes o No x
The aggregate market value of the Common Stock, par value $0.01, held by non-affiliates as of November 30, 2013, was approximately $807,200,649. As of such date, non-affiliates held no shares of the Class A Stock, $0.01 par value. There is no active market for the Class A Stock.
The number of shares outstanding of each class of the Registrant’s voting stock as of June 30, 2014 was as follows: 30,613,339 shares of Common Stock and 1,656,200 shares of Class A Stock.
Documents Incorporated By Reference
Part III incorporates certain information by reference from the Registrant’s definitive proxy statement for the Annual Meeting of Stockholders to be held September 24, 2014.
Table of Contents |
PAGE | |||||
1 | |||||
9 | |||||
12 | |||||
13 | |||||
13 | |||||
13 | |||||
14 | |||||
16 | |||||
17 | |||||
33 | |||||
34 | |||||
35 | |||||
36 | |||||
37 | |||||
39 | |||||
41 | |||||
43 | |||||
74 | |||||
76 | |||||
77 | |||||
77 | |||||
78 | |||||
79 | |||||
79 | |||||
79 | |||||
79 | |||||
79 | |||||
80 | |||||
83 | |||||
83 | |||||
S-2 | |||||
Part I
Item 1 | Business
Overview
Scholastic Corporation (the “Corporation” and together with its subsidiaries, “Scholastic” or the “Company”) is a global children’s publishing, education and media company. Since its founding in 1920, Scholastic has emphasized quality products and a dedication to reading and learning. The Company is the world’s largest publisher and distributor of children’s books and a leading provider of educational technology products and related services and children’s media. Scholastic creates quality books and ebooks, print and technology-based learning materials and programs, magazines, multi-media and other products that help children learn both at school and at home. The Company is the leading operator of school-based book clubs and book fairs in the United States. It distributes its products and services through these proprietary channels, as well as directly to schools and libraries, through retail stores and through the internet. The Company’s website, scholastic.com, is a leading site for teachers, classrooms and parents and an award-winning destination for children. Scholastic has operations in the United States, Canada, the United Kingdom, Australia, New Zealand, Ireland, India, China, Singapore and other parts of Asia, and, through its export business, sells products in more than 150 countries.
The Company currently employs approximately 7,500 people in the United States and approximately 2,200 people outside the United States.
Operating Segments – Continuing Operations
The Company categorizes its businesses into five reportable segments: Children’s Book Publishing and Distribution; Educational Technology and Services; Classroom and Supplemental Materials Publishing; Media, Licensing and Advertising (which collectively represent the Company’s domestic operations); and International. This classification reflects the nature of products, services and distribution consistent with the method by which the Company’s chief operating decision-maker assesses operating performance and allocates resources.
The following table sets forth revenues by operating segment for the three fiscal years ended May 31:
(Amounts in millions) | |||||||||||
2014 | 2013 | 2012 | |||||||||
Children’s Book Publishing and Distribution | $ | 873.5 | $ | 846.9 | $ | 1,111.3 | |||||
Educational Technology and Services | 248.7 | 227.7 | 254.7 | ||||||||
Classroom and Supplemental Materials Publishing | 229.6 | 218.0 | 208.2 | ||||||||
Media, Licensing and Advertising | 56.2 | 58.7 | 75.3 | ||||||||
International | 414.3 | 441.1 | 489.6 | ||||||||
Total | $ | 1,822.3 | $ | 1,792.4 | $ | 2,139.1 | |||||
Additional financial information relating to the Company’s operating segments is included in Note 4 of Notes to Consolidated Financial Statements in Item 8, “Consolidated Financial Statements and Supplementary Data,” which is included herein.
CHILDREN’S BOOK PUBLISHING AND DISTRIBUTION
(48.0% of fiscal 2014 revenues)
General
The Company’s Children’s Book Publishing and Distribution segment includes the publication and distribution of children’s books, media and interactive products in the United States through its book clubs and book fairs in its school channels and through the trade channel.
The Company is the world’s largest publisher and distributor of children’s books and is the leading operator of school-based book clubs and school-based book fairs in the United States. The Company is also a leading publisher of children’s print and ebooks distributed through the trade channel. Scholastic offers a broad range of children’s books, many of which have received awards for excellence in children’s literature, including the Caldecott and Newbery Medals.
- 1-
The Company obtains titles for sale through its distribution channels from three principal sources. The first source for titles is the Company’s publication of books created under exclusive agreements with authors, illustrators, book packagers or other media companies. Scholastic generally controls the exclusive rights to sell these titles through all channels of distribution in the United States and, to a lesser extent, internationally. Scholastic’s second source of titles is obtaining licenses to publish books exclusively in specified channels of distribution, including reprints of books originally published by other publishers for which the Company acquires rights to sell in the school market. The third source of titles is the Company’s purchase of finished books from other publishers.
School-Based Book Clubs
Scholastic founded its first school-based book club in 1948. In fiscal 2014, the Company launched its new school-based book clubs consisting of reading clubs for grades pre-kindergarten ("pre-K") through grade 5 and middle school grades 6 to 8. In addition to its regular book club reading club offerings, the Company creates special theme-based and seasonal offers targeted to different grade levels during the year.
The Company mails promotional materials containing order forms to teachers in the vast majority of the pre-K to grade 8 schools in the United States. Teachers who wish to participate in a school-based book club distribute the promotional materials to their students, who may choose from selections at substantial reductions from list prices. The teacher aggregates the students’ orders and forwards them to the Company. The Company estimates that approximately 63% of all elementary school teachers in the United States who received promotional materials in fiscal 2014 participated in the Company’s school-based book clubs. In fiscal 2014, approximately 85% of total book club revenues were placed via the internet through COOL (Clubs Ordering On-Line), the Company’s online ordering platform, which allows parents, as well as teachers, to order online. The orders are shipped to the classroom for distribution to the students. Sponsors who participate in the book clubs receive bonus points and other promotional incentives, which may be redeemed from the Company for additional books and other resource materials and items for their classrooms or the school.
School-Based Book Fairs
The Company began offering school-based book fairs in 1981 under the name Scholastic Book Fairs. Today, the Company is the leading distributor of school-based book fairs in the United States with operations in all 50 states. Book fairs give children access to hundreds of popular, quality books and educational materials, increase student reading and help book fair organizers raise funds for the purchase of school library and classroom books, supplies and equipment. Book fairs are generally weeklong events where children and families peruse and purchase their favorite books together. The Company delivers its book fairs from its warehouses to schools principally by a fleet of Company-owned vehicles. Sales and customer service representatives, working from the Company’s regional offices, distribution facilities and national distribution facility in Missouri, along with local area field representatives, provide support to book fair organizers. Book fairs are conducted by school personnel, volunteers and parent-teacher organizations, from which the schools may receive either books, supplies and equipment or a portion of the proceeds from every book fair they host. The Company is currently focused on increasing the number of second and third fairs conducted by its school customers during the school year and increasing attendance at each book fair event. Approximately 90% of the schools that conducted a Scholastic Book Fair in fiscal 2013 hosted a fair in fiscal 2014.
Trade
Scholastic is a leading publisher of children’s books sold through bookstores, internet retailers and mass merchandisers in the United States. The Company maintains approximately 6,100 titles for trade distribution. Scholastic’s original publications include Harry Potter®, The Hunger Games, The 39 Clues®, Spirit Animals™, The Magic School Bus®, I Spy™, Captain Underpants®, Goosebumps® and Clifford The Big Red Dog®, and licensed properties such as Star Wars®, Lego®, Minecraft® and Geronimo Stilton®. In addition, the Company’s Klutz® imprint is a publisher and creator of “books plus” products for children, including titles such as Clay Charms, Nail Style Studio, and Pom-Pom Puppies.
The Company’s trade organization focuses on publishing, marketing and selling print and ebook properties to bookstores, internet retailers, mass merchandisers, specialty sales outlets and other book retailers, and also supplies the Company’s proprietary school channels. The Company maintains a talented and experienced creative staff that constantly seeks to attract, develop and retain the best children’s authors and illustrators. The Company believes that its trade publishing staff, combined with the Company’s reputation and proprietary school distribution channels, provides a significant competitive advantage, evidenced by numerous bestsellers over the past decade. Print bestsellers in the trade division during fiscal 2014 included the
- 2-
Hunger Games trilogy by Suzanne Collins, which was also an ebook bestseller, the Harry Potter series, the Spirit Animal series, the Wings of Fire series and the I Survived series, as well as other titles, such as Star Wars: Jedi Academy by Jeffrey Brown.
EDUCATIONAL TECHNOLOGY AND SERVICES
(13.6% of fiscal 2014 revenues)
General
Scholastic Education, which encompasses the Company’s core curriculum publishing operations, develops and distributes technology-based instructional materials directly to schools in the United States, primarily purchased through school and district budgets, often with the help of federal and state funding, as well as local funding. These operations include reading and math improvement programs and other educational technology products, as well as consulting and professional development services.
Scholastic Education’s efforts are focused on partnering with school districts to raise student achievement by providing solutions that combine technology, content and services in the areas of reading and math. Significant technology-based reading and math improvement programs that Scholastic offers include:
• | READ 180®, a reading intervention program for students in grades 4 to 12 reading at least two years below grade level, READ 180 Next Generation, a substantially revised version of the original product; and Read 180 for iPad®, a comprehensive reading program for iPad; |
• | System 44®, a foundational reading intervention program for students in grades 4 to 12 who have not yet mastered the 44 sounds and 26 letters of the English language, and System 44 Next Generation, a revised version of the original product; |
• | Scholastic Reading Inventory, which is a research-based, computer-adaptive assessment for grades K to 12 that allows educators to assess a student’s reading comprehension; |
• | MATH 180®, a revolutionary math intervention program for students in grades 6 and up; |
• | iRead™, a digital foundational reading program for grades K-2; and |
• | Common Core Code X®, a middle school English Language Arts program with more complex texts required by the Common Core State Standards. |
Other major programs include FASTT Math®, a technology-based program to improve math fact fluency developed with the creator of READ 180, and Do The Math®, a mathematics intervention program created by Marilyn Burns, a nationally known math educator and the founder of Math Solutions. The Company considers its educational technology products and related services to be a growth driver and continues to focus on investment in its technology and services businesses. Significant recent activity includes the expansion of the Company's offering to include its Math 180 intervention mathematics solutions. The segment's consulting and professional development services focus on optimizing the utilization of the Scholastic products described above, as well as helping teachers and school districts meet professional standards and implement new requirements and standards, including the Common Core State Standards.
CLASSROOM AND SUPPLEMENTAL MATERIALS PUBLISHING
(12.6% of fiscal 2014 revenues)
General
Classroom and Supplemental Materials Publishing includes the publication and distribution to schools and libraries of children’s books, classroom magazines, supplemental classroom materials, custom curriculum and teaching guides and print and on-line reference and non-fiction products for grades pre-K to 12 in the United States.
Scholastic Classroom and Community Group
The Company is the leading provider of classroom libraries and paperback collections, including classroom books and guided reading products, to schools and school districts for classroom libraries and other uses, as well as to literacy organizations. Scholastic helps schools compile classroom collections of high quality, award-winning books for every grade level, reading level and multicultural background, including the Phyllis C. Hunter and the Leveled Math Readers series. This segment often customizes classroom library solutions for its customers, tailoring its offerings in some instances.
- 3-
The teaching resources business publishes and sells professional books and supplemental materials designed for and generally purchased by teachers, both directly from the Company and through teacher stores and booksellers, including the Company’s on-line Teacher store, which provides professional books and other educational materials to schools and teachers.
Scholastic Library Publishing and Classroom Magazines
Scholastic is a leading publisher of quality children’s reference and non-fiction products and subscriptions to databases sold primarily to schools and libraries in the United States. The Company’s products also include non-fiction/fiction books published in the United States under the imprints Children’s Press® and Franklin Watts®.
Scholastic is a leading publisher of classroom magazines. Teachers in grades pre-K to 12 use the Company’s 31 classroom magazines, including Scholastic News®, Junior Scholastic® and Weekly Reader®, to supplement formal learning programs by bringing subjects of current interest into the classroom, including literature, math, science, current events, social studies and foreign languages. These offerings provide schools with substantial non-fiction material, which is required to meet Common Core State Standards. Each magazine has its own website with online digital resources that supplement the print materials. Scholastic’s classroom magazine circulation in the United States in fiscal 2014 was approximately 13.1 million, with approximately 75% of the circulation in grades pre-K to six. The majority of magazines purchased are paid for with school or district funds, with parents and teachers paying for the balance. Circulation revenue accounted for substantially all of the classroom magazine revenues in fiscal 2014.
MEDIA, LICENSING AND ADVERTISING
(3.1% of fiscal 2014 revenues)
General
The Company’s Media, Licensing and Advertising segment includes the production and/or distribution of digital media, movie production, consumer promotions and merchandising and advertising revenue, including sponsorship programs.
Production and Distribution
Through Scholastic Media, the Company creates and produces programming and digital content for all platforms, including television, DVDs, audio, movies, interactive games, apps (applications) and websites. Scholastic Media builds consumer awareness and value for the Company’s franchises by creating family-focused media that form the foundation for the Company’s global branding campaigns. The media group generates revenue by exploiting these assets throughout the Scholastic distribution channels, globally across multiple media platforms and by developing and executing cross platform brand-marketing campaigns that support the Company’s key franchises. Scholastic Media consists of Scholastic Entertainment Inc. (SEI), Scholastic Audio, Soup2Nuts Inc. (S2N), Weston Woods Studios, Inc. and Scholastic Interactive L.L.C.
SEI has built a large television library of half-hour productions, including: Clifford The Big Red Dog®, Clifford’s Puppy Days®, Dear America®, I Spy®, WordGirl®, Maya & Miguel™ , The Magic School Bus®, Goosebumps®, Turbo Dogs, Animorphs®, Horrible Histories®, The Baby-sitters Club® and Sammy’s Storyshop™. These series have been sold in the United States and throughout the world and have garnered major awards including Emmys, Peabodys and an Academy award.
S2N is an animation and audio production studio, supplying animation and audio services for the Company that supports audio books and SEI programming, including the Emmy award-winning animated series Word Girl. Weston Woods Studios, Inc. creates audio visual adaptations of classic children’s picture books, such as Where the Wild Things Are, Chrysanthemum and Make Way for Ducklings, which were initially produced for the school and library market and are now distributed through the retail market. Scholastic Audio produces young adult and children’s audio recordings for the school, library and retail markets.
Scholastic Interactive designs and produces software, apps, games, etc., based on Scholastic properties, for grades pre-K to 8. Its products are distributed through the Company’s school-based book clubs and book fairs, as well as to the library/teacher market and the retail market. The Company’s titles for Leapster and LeapPad include the series I Spy, Brain Play®, Clifford®, Goosebumps®, The Magic School Bus®, The 39 Clues® series, Scholastic Animal Genius® and Math Missions®.
Other
Also included in this segment is Scholastic National Partnerships, which partners with non-profit organizations, government agencies, associations and selected corporations to develop literacy, education and pro-social campaigns which are aligned to
- 4-
the Company’s corporate mission of supporting children’s reading and learning in classrooms and at home, and the Company’s consumer magazines business, including Parent and Child and Instructor Magazines.
INTERNATIONAL
(22.7% of fiscal 2014 revenues)
General
The International segment includes the publication and distribution of products and services outside the United States by the Company’s international operations, and its export and foreign rights businesses.
Scholastic has operations in Canada, the United Kingdom, Australia, New Zealand, Ireland, India, China, Singapore and other parts of Asia. The Company’s international operations have original trade and educational publishing programs; distribute children’s books, software and other materials through school-based book clubs, school-based book fairs and trade channels; engage in direct sales in shopping malls and door to door; produce and distribute magazines; and offer on-line services. Many of the Company’s international operations also have their own export and foreign rights licensing programs and are book publishing licensees for major media properties. Original books published by most of these operations have received awards for excellence in children’s literature. In Asia, the Company also publishes and distributes reference products and provides services under the Grolier name, engages in direct sales in shopping malls and door to door and operates tutorial centers that provide English language training to students.
Canada
Scholastic Canada, founded in 1957, is a leading publisher and distributor of English and French language children’s books. Scholastic Canada also is the largest school-based book club and school-based book fair operator in Canada and is one of the leading suppliers of original or licensed children’s books to the Canadian trade market. Since 1965, Scholastic Canada has also produced quality Canadian-authored books and educational materials, including an early reading program sold to schools for grades K to 6.
United Kingdom
Scholastic UK, founded in 1964, is the largest school-based book club and book fair operator in the United Kingdom and one of the leading suppliers of original or licensed children’s books to the United Kingdom trade market. Scholastic UK also publishes supplemental educational materials, including professional books for teachers.
Australia
Scholastic Australia, founded in 1968, is the largest school-based book club and book fair operation in Australia, reaching approximately 90% of the country’s primary schools. Scholastic Australia also publishes quality children’s books supplying the Australian trade market.
New Zealand
Scholastic New Zealand, founded in 1962, is the largest children’s book publisher and the leading book distributor to schools in New Zealand. Through its school-based book clubs and book fairs, Scholastic New Zealand reaches approximately 90% of the country’s primary schools. In addition, Scholastic New Zealand publishes quality children’s books supplying the New Zealand trade market.
Asia
The Company’s Asian operations include initiatives for educational programs based out of Singapore, as well as the wholly-owned Grolier direct sales business, which sells English language and early childhood learning materials through a network of independent sales representatives in India, Indonesia, Malaysia, the Philippines, Singapore and Thailand. In addition, the Company operates school-based book clubs and book fairs throughout Asia; publishes original titles in English and Hindi languages in India, including specialized curriculum books for local schools; conducts reading improvement programs inside local schools in the Philippines; and operates a chain of English language tutorial centers in China in cooperation with local partners.
- 5-
Foreign Rights and Export
The Company licenses the rights to selected Scholastic titles in 45 languages to other publishing companies around the world. The Company’s export business sells educational materials, software and children’s books to schools, libraries, bookstores and other book distributors in over 150 countries that are not otherwise directly serviced by Scholastic subsidiaries. The Company partners with governments and non-governmental agencies to create and distribute books to public schools in developing countries.
PRODUCTION AND DISTRIBUTION
The Company’s books, magazines, software and interactive products and other materials are manufactured by the Company with the assistance of third parties under contracts entered into through arms-length negotiations or competitive bidding. As appropriate, the Company enters into multi-year agreements that guarantee specified volume in exchange for favorable pricing terms. Paper is purchased directly from paper mills and other third-party sources. The Company does not anticipate any difficulty in continuing to satisfy its manufacturing and paper requirements.
In the United States, the Company mainly processes and fulfills orders for school-based book clubs, trade, curriculum publishing, reference and non-fiction products and export orders from its primary warehouse and distribution facility in Jefferson City, Missouri. In connection with its trade business, the Company sometimes will ship product directly from printers to customers. Magazine orders are processed at the Jefferson City facility and are shipped directly from printers. Orders for ebooks are fulfilled through a third party.
School-based book fair orders are fulfilled through a network of warehouses across the country. The Company’s international school-based book clubs, school-based book fair, trade and educational operations use distribution systems similar to those employed in the U.S.
CONTENT ACQUISITION
Access to intellectual property or content (“Content”) for the Company’s product offerings is critical to the success of the Company’s operations. The Company incurs significant costs for the acquisition and development of Content for its product offerings. These costs are often deferred and recognized as the Company generates revenues derived from the benefits of these costs. These costs include the following:
• | Prepublication costs. Prepublication costs are incurred in all of the Company’s reportable segments. Prepublication costs include costs incurred to create and develop the art, prepress, editorial, digital conversion and other content required for the creation of the master copy of a book or other media. While prepublication costs in the Children’s Book Publishing and Distribution segment are relatively modest amounts for each individual title, there are a large number of separate titles published annually. Prepublication costs in the Educational Technology and Services segment are often in excess of $1 million for an individual program, as the development of Content for complex intervention and educational programs requires significant resources and investment. |
• | Royalty advances. Royalty advances are incurred in all of the Company’s reportable segments, but are most prevalent in the Children’s Book Publishing and Distribution segment and enable the Company to obtain contractual commitments from authors to produce Content. The Company regularly provides authors with advances against expected future royalty payments, often before the books are written. Upon publication and sale of the books or other media, the authors generally will not receive further royalty payments until the contractual royalties earned from sales of such books or other media exceed such advances. The Company values its position in the market as the largest publisher and distributor of children's books in obtaining Content, and the Company’s experienced editorial staff aggressively acquires Content from both new and established authors. |
• | Production costs. Production costs are incurred in the Media, Licensing and Advertising segment. Production costs include the costs to create films, television programming, home videos and other entertainment Content. These costs include the costs of talent, artists, production crews and editors, as well as other costs incurred in connection with the production of this Content. Advertising and promotional costs are not included in production costs. |
- 6-
SEASONALITY
The Company’s Children’s Book Publishing and Distribution school-based book fair and book club channels and most of its magazines operate on a school-year basis; therefore, the Company’s business is highly seasonal. As a result, the Company’s revenues in the first and third quarters of the fiscal year generally are lower than its revenues in the other two fiscal quarters. Typically, these school-based channel revenues are greatest in the second and fourth quarters of the fiscal year, while revenues from the sale of instructional materials and educational technology products and services are highest in the first and fourth quarters. The Company generally experiences a loss from operations in the first and third quarters of each fiscal year. Trade sales can vary through the year due to varying release dates of published titles.
COMPETITION
The markets for children’s books and entertainment materials and educational technology products and other educational materials are highly competitive. Competition is based on the quality and range of materials made available, price, promotion and customer service, as well as the nature of the distribution channels. Competitors include numerous other book, ebook, textbook, library, reference material and supplementary text publishers, distributors and other resellers (including over the internet) of children’s books and other educational materials, national publishers of classroom and professional magazines with substantial circulation, numerous producers of television and film programming (many of which are substantially larger than the Company), television and cable networks, publishers of computer software and interactive products, and distributors of products and services on the internet. In the United States, competitors also include regional and local school-based book fair operators, other fundraising activities in schools, and bookstores. In its educational technology business, additional competitive factors include the demonstrated effectiveness of the products being offered, as well as available funding sources to school districts, and, although the Company believes no other organization or company offers as comprehensive an offering as its suite of reading and math intervention products and services, the Company faces competition from textbook publishers, distributors of other technology-based programs addressing the subject areas of the Company’s offerings, such as reading, phonics and mathematics, and, with respect to its consulting services, not-for-profit organizations providing consulting covering various areas related to education. Competition may increase to the extent that other entities enter the market and to the extent that current competitors or new competitors develop and introduce new materials that compete directly with the products distributed by the Company or develop or expand competitive sales channels. The Company believes that its position as both a publisher and distributor are unique to certain of the markets in which it competes, principally in the context of its children’s book business.
COPYRIGHT AND TRADEMARKS
As an international publisher and distributor of books, software and other media products, Scholastic aggressively utilizes the intellectual property protections of the United States and other countries in order to maintain its exclusive rights to identify and distribute many of its products. Accordingly, SCHOLASTIC is a trademark registered in the United States and in a number of countries where the Company conducts business or otherwise distributes its products. The Corporation’s principal operating subsidiary in the United States, Scholastic Inc., and the Corporation’s international subsidiaries, through Scholastic Inc., have registered and/or have pending applications to register in relevant territories trademarks for important services and programs. All of the Company’s publications, including books, magazines and software and interactive products, are subject to copyright protection both in the United States and internationally. The Company also obtains domain name protection for its internet domains. The Company seeks to obtain the broadest possible intellectual property rights for its products, and because inadequate legal and technological protections for intellectual property and proprietary rights could adversely affect operating results, the Company vigorously defends those rights against infringement.
- 7-
Executive Officers
The following individuals have been determined by the Board of Directors to be the executive officers of the Company. Each such individual serves in his or her position with Scholastic until such person’s successor has been elected or appointed and qualified or until such person’s earlier resignation or removal.
Name | Age | Employed by Registrant Since | Position(s) for Past Five Years | |
Richard Robinson | 77 | 1962 | Chairman of the Board (since 1982), President (since 1974) and Chief Executive Officer (since 1975). | |
Maureen O’Connell | 52 | 2007 | Executive Vice President, Chief Administrative Officer and Chief Financial Officer (since 2007). | |
Margery W. Mayer | 62 | 1990 | Executive Vice President (since 1990), and President, Scholastic Education (since 2002); and Executive Vice President, Learning Ventures (1998-2002). | |
Judith A. Newman | 56 | 1993 | Executive Vice President and President, Book Clubs (since 2014), Book Clubs and eCommerce (2011-2014), Book Clubs (2005-2011) and Scholastic At Home (2005-2006); Senior Vice President and President, Book Clubs and Scholastic At Home (2004-2005); and Senior Vice President, Book Clubs (1997-2004). | |
Andrew S. Hedden | 73 | 2008 | Member of the Board of Directors (since 1991) and Executive Vice President, General Counsel and Secretary (since 2008). | |
Alan Boyko | 60 | 1988 | President, Scholastic Book Fairs, Inc. (since 2005). | |
Available Information
The Corporation’s annual reports on Form 10-K, quarterly reports on Form 10-Q, current reports on Form 8-K and any amendments to those reports are accessible at the Investor Relations portion of its website (scholastic.com) and are available, without charge, as soon as reasonably practicable after such reports are electronically filed or furnished to the Securities and Exchange Commission (“SEC”). The Company also posts the dates of its upcoming scheduled financial press releases, telephonic investor calls and investor presentations on the “Events and Presentations” portion of its website at least five days prior to the event. The Company’s investor calls are open to the public and remain available through the Company’s website for at least 45 days thereafter.
The public may also read and copy materials that the Company files with the SEC at the SEC’s Public Reference Room at 100 F Street, N.E., Washington, DC 20549. The public may obtain information, as well as copies of the Company’s filings, from the Office of Investor Education and Advocacy by calling the SEC at 1-800-SEC-0330. The SEC also maintains an internet site, at www.sec.gov, that contains reports, proxy and information statements and other information regarding issuers that file electronically with the SEC.
- 8-
Item 1A | Risk Factors
Set forth below and elsewhere in this Annual Report on Form 10-K and in other documents that the Corporation files with the SEC are risks that should be considered in evaluating the Corporation’s common stock, as well as risks and uncertainties that could cause the actual future results of the Company to differ from those expressed or implied in the forward-looking statements contained in this Report and in other public statements the Company makes. Additionally, because of the following risks and uncertainties, as well as other variables affecting the Company’s operating results, the Company’s past financial performance should not be considered an indicator of future performance.
If we cannot anticipate trends and develop new products or adapt to new technologies responding to changing customer preferences, this could adversely affect our revenues or profitability.
The Company operates in highly competitive markets that are subject to rapid change, including, in particular, changes in customer preferences and changes and advances in relevant technologies. There are substantial uncertainties associated with the Company’s efforts to develop successful educational, trade publishing and media products and services, including digital products and services, for its customers, as well as to adapt its print and other materials to new digital technologies, including the internet, ebook readers, tablets and other devices and school-based technologies. The Company makes significant investments in new products and services that may not be profitable, or whose profitability may be significantly lower than the Company anticipates or has experienced historically. In particular, in the context of the Company’s current focus on key digital opportunities, including ebooks for children and schools, the markets are continuing to develop and the Company may be unsuccessful in establishing itself as a significant factor in any market which does develop. Many aspects of an ebook market which could develop for children and schools, such as the nature of the relevant software and hardware, the size of the market, relevant methods of delivery and relevant content, as well as pricing models, are still evolving and will, most likely, be subject to change on a recurrent basis until a pattern develops and becomes more defined. There can be no assurance that the Company will be successful in implementing its ebook strategy, including the continuing development of its ereading applications for consumer and classroom markets, which could adversely affect the Company’s revenues and growth opportunities. In this connection, the Company has determined that it will cease its support for its ereading applications offered to consumers through its school and ecommerce channels in favor of concentrating its efforts towards the introduction of a universal cross-platform streaming application, to be made available initially to the classroom market. There can be no assurance that the Company will ultimately be successful in its redirected strategy of introducing a streaming model directed to the classroom market or the subsequent development of a broader streaming model. In addition, the Company faces market risks associated with software product development and service delivery in its evolving educational technology and ecommerce businesses as it extends to new product lines focused on mathematics and providing services that assist school districts with meeting new standards, including the Common Core State Standards.
Our financial results would suffer if we fail to successfully differentiate our offerings and meet market needs in school-based book clubs and book fairs, two of our core businesses.
The Company’s school-based book clubs and book fairs are core businesses, which produce a substantial part of the Company’s revenues. The Company is subject to the risk that it will not successfully develop and execute new promotional strategies for its school-based book clubs or book fairs in response to future customer trends, including any trends relating to a demand for ebooks on the part of customers, or technological changes or that it will not otherwise meet market needs in these businesses in a timely or cost-effective fashion and successfully maintain teacher or school sponsorship and ordering levels, which would have an adverse effect on the Company’s financial results. The Company differentiates itself from competitors by providing curated offerings in its school-based book clubs and book fairs designed to make reading attractive for children, in furtherance of its mission as a champion of literacy. Competition from mass market and on-line distributors could reduce this differentiation, posing a risk to the Company's results.
If we fail to maintain the continuance of strong relationships with our authors, illustrators and other creative talent, as well as to develop relationships with new creative talent, our business could be adversely affected.
The Company’s business, in particular the trade publishing and media portions of the business, is highly dependent on maintaining strong relationships with the authors, illustrators and other creative talent who produce the products and services that are sold to its customers. Any overall weakening of these relationships, or the failure to develop successful new relationships, could have an adverse impact on the Company’s business and financial performance.
- 9-
If we fail to adapt to new purchasing patterns or trends, our business and financial results could be adversely affected.
The Company’s business is affected significantly by changes in customer purchasing patterns or trends in, as well as the underlying strength of, the educational, trade and media markets for children. In particular, the Company’s educational technology and services and educational publishing businesses may be adversely affected by budgetary restraints and other changes in educational funding as a result of new legislation or regulatory actions, both at the federal and state level, as well as changes in the procurement process, to which the Company may be unable to adapt successfully. In addition, there are many competing demands for educational funds, and there can be no guarantee that the Company will otherwise be successful in continuing to obtain sales of its products from any available funding.
The competitive pressures we face in our businesses could adversely affect our financial performance and growth prospects.
The Company is subject to significant competition, including from other educational and trade publishers and media, entertainment and internet companies, as well as retail and internet distributors, many of which are substantially larger than the Company and have much greater resources. To the extent the Company cannot meet these challenges from existing or new competitors, including in the educational publishing business, and develop new product offerings to meet customer preferences or needs, the Company’s revenues and profitability could be adversely affected.
Additionally, demand for many of the Company’s product offerings, particularly books sold through school channels, is subject to price sensitivity. Failure to maintain a competitive pricing model could reduce revenues and profitability.
Our reputation is one of our most important assets, and any adverse publicity or adverse events, such as a significant data privacy breach or violation of privacy laws or regulations, could cause significant reputational damage and financial loss.
The businesses of the Company focus on children’s reading, learning and education, and its key relationships are with educators, teachers, parents and children. In particular, the Company believes that, in selecting its products, teachers, educators and parents rely on the Company’s reputation for quality books and educational products appropriate for children. Negative publicity, either through traditional media or through social media, could tarnish this relationship.
Also, in certain of its businesses the Company holds significant volumes of personal data, including that of customers, and, in its educational technology business, students. Adverse publicity stemming from a data breach, whether or not valid, could reduce demand for the Company’s products or adversely affect its relationship with teachers or educators, impacting participation in book clubs or book fairs or decisions to purchase educational technology or other products or services of the Company’s educational technology business. Further, a failure to adequately protect personal data, including that of customers or students, or other data security failure, such as cyber attacks from third parties, could lead to penalties, significant remediation costs and reputational damage, including loss of future business.
The Company is subject to privacy laws and regulations in the conduct of its business in the United States and in the other jurisdictions in which it conducts its international operations, many of which vary significantly, relating to use of information obtained from customers of, and participants in, the Company’s on-line offerings. In addition, the Company is also subject to the regulatory requirements of the Children’s Online Privacy Protection Act ("COPPA") in the United States relating to access to, and the use of information received from, children in respect to the Company’s on-line offerings. Since the businesses of the Company are primarily centered on children, failures of the Company to comply with the requirements of COPPA in particular, as well as failures to comply generally with applicable privacy laws and regulations, could lead to significant reputational damage and other penalties and costs, including loss of future business.
We maintain an experienced and dedicated employee base that executes the Company’s strategies. Failure to attract, retain and develop this employee base could result in difficulty with executing our strategy.
The Company’s employees, notably its Chief Executive Officer, senior executives and other editorial staff members, have substantial experience in the publishing and education markets. Inability to adequately maintain a workforce of this nature could negatively impact the Company’s operations.
- 10-
If we are unsuccessful in implementing our corporate strategy we may not be able to maintain our historical growth.
The Company’s future growth depends upon a number of factors, including the ability of the Company to successfully implement its strategies for its respective business units in a timely manner, the introduction and acceptance of new products and services, including the success of its digital strategy and its ability to implement and successfully market new product introductions in its educational technology business, as well as through the Company's developing educational publishing operation in Singapore, its ability to expand in the global markets that it serves, its ability to meet demand for content meeting current standards, including the Common Core State Standards, and its continuing success in implementing on-going cost containment and reduction programs. Difficulties, delays or failures experienced in connection with any of these factors could materially affect the future growth of the Company.
Failure of one or more of our information technology platforms could affect our ability to execute our operating strategy.
The Company relies on a variety of information technology platforms to execute its operations, including human resources, payroll, finance, order-to-cash, procurement, vendor payment, inventory management, distribution and content management systems. Many of these systems are integrated via internally developed interfaces and modifications. Failure of one or more systems could lead to operating inefficiencies or disruptions and a resulting decline in revenue or profitability. As the Company proceeds to develop an enterprise-wide platform in an effort to integrate its separate platforms into a cohesive system, there can be no assurance that it will be successful in its efforts or that the implementation of its initiative will not involve disruptions having a short term adverse impact on its operations.
Increases in certain operating costs and expenses, which are beyond our control and can significantly affect our profitability, could adversely affect our operating performance.
The Company’s major expense categories include employee compensation and printing, paper and distribution (such as postage, shipping and fuel) costs. Compensation costs are influenced by general economic factors, including those affecting costs of health insurance, post-retirement benefits and any trends specific to the employee skill sets that the Company requires.
Paper prices fluctuate based on worldwide demand and supply for paper in general, as well as for the specific types of paper used by the Company. If there is a significant disruption in the supply of paper or a significant increase in paper costs, or in its shipping or fuel costs, beyond those currently anticipated, which would generally be beyond the control of the Company, or if the Company’s strategies to try to manage these costs, including additional cost savings initiatives, are ineffective, the Company’s results of operations could be adversely affected.
Failure of third party providers to provide contracted outsourcing of business processes and information technology services could cause business interruptions and could increase the costs of these services to the Company.
The Company outsources business processes to reduce complexity and increase efficiency for activities such as distribution, manufacturing, product development, transactional processing, information technologies and various administrative functions. Increasingly, the Company is engaging third parties to provide software as a service (“SaaS”), which can reduce the Company’s internal execution risk, but increases the Company’s dependency upon third parties to execute business critical information technology tasks. If SaaS providers are unable to provide these services, or if outsource providers fail to execute their contracted functionality, the Company could experience disruptions to its business activities and may incur higher costs.
The inability to obtain and publish best-selling new titles such as Harry Potter and the Hunger Games trilogy could cause our future results to decline in comparison to historical results.
The Company invests in authors and illustrators for its Trade publication business, and has a history of publishing hit titles such as Harry Potter and the Hunger Games trilogy. The inability to publish best-selling new titles in future years could negatively impact the Company.
- 11-
The loss of or failure to obtain rights to intellectual property material to our businesses would adversely affect our financial results.
The Company’s products generally comprise intellectual property delivered through a variety of media. The ability to achieve
anticipated results depends in part on the Company’s ability to defend its intellectual property against infringement, as well as the breadth of rights obtained. The Company’s operating results could be adversely affected by inadequate legal and technological protections for its intellectual property and proprietary rights in some jurisdictions, markets and media, as well as by the costs of dealing with claims alleging infringement of the intellectual property rights of others, including claims involving business method patents in the ecommerce and internet area, and the Company’s revenues could be constrained by limitations on the rights that the Company is able to secure to exploit its intellectual property in different media and distribution channels, as well as geographic limitations on the exploitation of such rights.
Because we sell our products and services in foreign countries, changes in currency exchange rates, as well as other risks and uncertainties, could adversely affect our operations and financial results.
The Company has various operating subsidiaries domiciled in foreign countries. In addition, the Company sells products and services to customers located in foreign countries where it does not have operating subsidiaries, and a significant portion of the Company’s revenues are generated from outside of the United States. The Company’s business processes, including distribution, sales, sourcing of content, marketing and advertising, are, accordingly, subject to multiple national, regional and local laws, regulations and policies. The Company could be adversely affected by noncompliance with foreign laws, regulations and policies, including those pertaining to foreign rights and exportation. The Company is also exposed to fluctuations in foreign currency exchange rates and to business disruption caused by political, financial or economic instability or the occurrence of natural disasters in foreign countries.
Failure to meet the demands of regulators, and the associated high cost of compliance with regulations, as well as failure to enforce compliance with our Code of Ethics and other policies, could negatively impact us.
The Company operates in multiple countries and is subject to different regulations throughout the world. In the U.S., the Company is regulated by the Internal Revenue Service, the Securities and Exchange Commission, the Environmental Protection Agency, the Federal Trade Commission and other regulating bodies. Failure to comply with these regulators, including providing these regulators with accurate financial and statistical information that often is subject to estimates and assumptions, or the high cost of complying with relevant regulations, could negatively impact the Company.
In addition, the decentralized and global nature of the Company’s operations makes it more difficult to communicate and monitor compliance with the Company’s Code of Ethics and other material Company policies and to assure compliance with applicable laws and regulations, some of which have global applicability, such as the Foreign Corrupt Practices Act in the United States and the UK Bribery Act in the United Kingdom. Failures to comply with the Company’s Code of Ethics and violations of such laws or regulations, including through employee misconduct, could result in significant liabilities for the Company, including criminal liability, fines and civil litigation risk, and result in damage to the reputation of the Company.
Certain of our activities are subject to weather risks, which could disrupt our operations or otherwise adversely affect our financial performance.
The Company conducts certain of its businesses and maintains warehouse and office facilities in locations that are at risk of being negatively affected by severe weather events, such as hurricanes, tornadoes, floods or snowstorms. Notably, much of the Company’s domestic distribution facilities are located in central Missouri. A disruption of these or other facilities could impact the Company’s school-based book clubs, school-based book fairs and education businesses. Additionally, weather disruptions could result in school closures, resulting in reduced demand for the Company’s products in its school channels during the affected periods. Accordingly, the Company could be adversely affected by any future significant weather event.
Control of the Company resides in our Chairman of the Board, President and Chief Executive Officer and other members of his family through their ownership of Class A Stock, and the holders of the Common Stock generally have no voting rights with respect to transactions requiring stockholder approval.
The voting power of the Corporation’s capital stock is vested exclusively in the holders of Class A Stock, except for the right of the holders of Common Stock to elect one-fifth of the Board of Directors and except as otherwise provided by law or as may be
- 12-
established in favor of any series of preferred stock that may be issued. Richard Robinson, the Chairman of the Board, President and Chief Executive Officer, and other members of the Robinson family beneficially own all of the outstanding shares of Class A Stock and are able to elect up to four-fifths of the Corporation’s Board of Directors and, without the approval of the Corporation’s other stockholders, to effect or block other actions or transactions requiring stockholder approval, such as a merger, sale of substantially all assets or similar transaction.
Note
The risk factors listed above should not be construed as exhaustive or as any admission regarding the adequacy of disclosures made by the Company prior to and including the date hereof.
Forward-Looking Statements:
This Annual Report on Form 10-K contains forward-looking statements. Additional written and oral forward-looking statements may be made by the Company from time to time in SEC filings and otherwise. The Company cautions readers that results or expectations expressed by forward-looking statements, including, without limitation, those relating to the Company’s future business prospects, plans, ecommerce and digital initiatives, new product introductions, strategies, Common Core State Standards, goals, revenues, improved efficiencies, general costs, manufacturing costs, medical costs, merit pay, operating margins, working capital, liquidity, capital needs, interest costs, cash flows and income, are subject to risks and uncertainties that could cause actual results to differ materially from those indicated in the forward-looking statements, due to factors including those noted in this Annual Report and other risks and factors identified from time to time in the Company’s filings with the SEC. The Company disclaims any intention or obligation to update or revise forward-looking statements, whether as a result of new information, future events or otherwise.
Item 1B | Unresolved Staff Comments
None
Item 2 | Properties
The Company maintains its principal offices in the metropolitan New York area, where it owns or leases approximately 0.6 million square feet of space. On February 28, 2014, the Company acquired its headquarters space (including land, building, fixtures and related personal property and leases) at 555 Broadway, New York, NY from its landlord under a purchase and sale agreement. As a result of such purchase, the Company now owns the entirety of its principal headquarters space located at 557 and 555 Broadway in New York City.
The Company also owns or leases approximately 1.5 million square feet of office and warehouse space for its primary warehouse and distribution facility located in the Jefferson City, Missouri area. In addition, the Company owns or leases approximately 2.9 million square feet of office and warehouse space in over 70 facilities in the United States, principally for Scholastic book fairs.
Additionally, the Company owns or leases approximately 1.4 million square feet of office and warehouse space in over 100 facilities in Canada, the United Kingdom, Australia, New Zealand, Asia and elsewhere around the world for its international businesses.
The Company considers its properties adequate for its current needs. With respect to the Company’s leased properties, no difficulties are anticipated in negotiating renewals as leases expire or in finding other satisfactory space, if current premises become unavailable. For further information concerning the Company’s obligations under its leases, see Notes 1 and 6 of Notes to Consolidated Financial Statements in Item 8, “Consolidated Financial Statements and Supplementary Data.”
Item 3 | Legal Proceedings
Various claims and lawsuits arising in the normal course of business are pending against the Company. The Company accrues a liability for such matters when it is probable that a liability has occurred and the amount of such liability can be reasonably estimated. When only a range can be estimated, the most probable amount in the range is accrued unless no amount within the range is a better estimate than any other amount, in which case the minimum amount in the range is accrued. Legal costs associated with litigation loss contingencies are expensed in the period in which they are incurred. The Company does not expect, in the case of those claims and lawsuits where a loss is considered probable or reasonably possible, after taking into
- 13-
account any amounts currently accrued, that the reasonably possible losses from such claims and lawsuits would have a material adverse effect on the Company’s consolidated financial position or results of operations.
Item 4 | Mine Safety Disclosures
Not Applicable.
- 14-
Part II
Item 5 | Market for the Registrant’s Common Equity, Related Stockholder Matters and Issuer Purchases of Equity Securities
Market Information: Scholastic Corporation’s Common Stock, par value $0.01 per share (the "Common Stock"), is traded on the NASDAQ Global Select Market under the symbol SCHL. Scholastic Corporation’s Class A Stock, par value $0.01 per share (the “Class A Stock”), is convertible, at any time, into Common Stock on a share-for-share basis. There is no public trading market for the Class A Stock. Set forth below are the quarterly high and low closing sales prices for the Common Stock as reported by NASDAQ for the periods indicated:
For fiscal years ended May 31, | |||||||||||||||
2014 | 2013 | ||||||||||||||
High | Low | High | Low | ||||||||||||
First Quarter | $ | 33.14 | $ | 28.20 | $ | 31.99 | $ | 26.04 | |||||||
Second Quarter | 31.84 | 27.40 | 34.55 | 25.03 | |||||||||||
Third Quarter | 35.29 | 27.69 | 31.56 | 27.81 | |||||||||||
Fourth Quarter | 36.74 | 30.58 | 32.09 | 25.62 | |||||||||||
Holders: The number of holders of Class A Stock and Common Stock as of July 14, 2014 were 3 and approximately 10,000, respectively.
Dividends: During fiscal 2013, the Company declared four regular quarterly dividends in the amount of $0.125 per Class A and Common share, amounting to total dividends declared during fiscal 2013 of $0.50 per share. During the first quarter of fiscal 2014, the Company declared a regular quarterly dividend in the amount of $0.125 per Class A and Common share, which dividend was increased to $0.15 per Class A and Common share in the second, third and fourth quarters of fiscal 2014. Accordingly, the total dividends declared during fiscal 2014 were $0.575 per share. On July 23, 2014, the Board of Directors declared a cash dividend of $0.15 per Class A and Common share in respect of the first quarter of fiscal 2015. This dividend is payable on September 15, 2014 to shareholders of record on August 29, 2014. All dividends have been in compliance with the Company’s debt covenants.
Share purchases: During fiscal 2014, the Company repurchased 215,484 Common shares on the open market at an average price paid per share of $28.65 for a total of approximately $6.2 million, pursuant to a share buy-back program authorized by the Board of Directors. During fiscal 2013, pursuant to the same share buy-back program, the Company repurchased 432,330 Common shares on the open market at an average price paid per share of $27.34, for a total cost of approximately $11.8 million. As of May 31, 2014, approximately $13.4 million remained available for future purchases of Common shares under the current repurchase authorization of the Board of Directors.
Stock Price Performance Graph
The graph below matches the Corporation’s cumulative 5-year total shareholder return on Common Stock with the cumulative total returns of the NASDAQ Composite index and a customized peer group of three companies that includes Pearson PLC, John Wiley & Sons Inc and Houghton Mifflin Harcourt. The graph tracks the performance of a $100 investment in the Corporation’s Common Stock, in the peer group and in the index (with the reinvestment of all dividends) from June 1, 2009 to May 31, 2014. Houghton Mifflin Harcourt was added to the peer group on November 14, 2013, which was the first day they traded on the NASDAQ stock exchange.
- 15-
COMPARISON OF 5 YEAR CUMULATIVE TOTAL RETURN*
Among Scholastic Corporation, the NASDAQ Composite Index
and a Peer Group
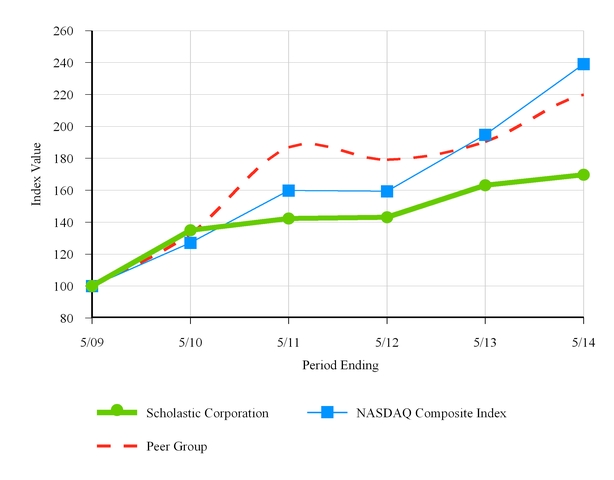
*$100 invested on 5/31/09 in stock or index, including reinvestment of dividends.
Fiscal year ending May 31, | |||||||||||||||||||||||
2009 | 2010 | 2011 | 2012 | 2013 | 2014 | ||||||||||||||||||
Scholastic Corporation | $ | 100.00 | $ | 134.87 | $ | 142.27 | $ | 143.08 | $ | 163.18 | $ | 169.70 | |||||||||||
NASDAQ Composite Index | 100.00 | 127.21 | 159.80 | 159.35 | 194.77 | 239.11 | |||||||||||||||||
Peer Group | 100.00 | 132.72 | 186.92 | 179.15 | 190.39 | 219.90 | |||||||||||||||||
The stock price performance included in this graph is not necessarily indicative of future stock price performance.
- 16-
Item 6 | Selected Financial Data
(Amounts in millions, except per share data) For fiscal years ended May 31, | |||||||||||||||||||
2014 | 2013 | 2012 | 2011 | 2010 | |||||||||||||||
Statement of Operations Data: | |||||||||||||||||||
Total revenues | $ | 1,822.3 | $ | 1,792.4 | $ | 2,139.1 | $ | 1,877.6 | $ | 1,882.0 | |||||||||
Cost of goods sold (1) | 846.0 | 829.6 | 984.6 | 869.0 | 843.1 | ||||||||||||||
Selling, general and administrative expenses (exclusive of depreciation and amortization) (2) | 812.5 | 815.0 | 878.5 | 834.7 | 798.7 | ||||||||||||||
Depreciation and amortization (3) | 61.4 | 66.5 | 68.8 | 60.1 | 59.5 | ||||||||||||||
Severance (4) | 11.3 | 13.4 | 14.9 | 6.7 | 9.2 | ||||||||||||||
Loss on leases and asset impairments (5) | 28.0 | 0.0 | 7.0 | 3.4 | 40.1 | ||||||||||||||
Operating income | 63.1 | 67.9 | 185.3 | 103.7 | 131.4 | ||||||||||||||
Other income (expense) | (0.0 | ) | 0.0 | (0.1 | ) | (0.4 | ) | 0.9 | |||||||||||
Interest expense, net | 6.9 | 14.5 | 15.5 | 15.6 | 16.2 | ||||||||||||||
Loss on investments (6) | (5.8 | ) | — | — | (3.6 | ) | (1.5 | ) | |||||||||||
Earnings (loss) from continuing operations before income taxes | 50.4 | 53.4 | 169.7 | 84.1 | 114.6 | ||||||||||||||
Provision (benefit) for income taxes (7) | 6.1 | 17.6 | 61.6 | 38.8 | 54.1 | ||||||||||||||
Earnings (loss) from continuing operations | 44.3 | 35.8 | 108.1 | 45.3 | 60.5 | ||||||||||||||
Earnings (loss) from discontinued operations, net of tax | 0.1 | (4.7 | ) | (5.7 | ) | (5.9 | ) | (4.4 | ) | ||||||||||
Net income (loss) | 44.4 | 31.1 | 102.4 | 39.4 | 56.1 | ||||||||||||||
Share Information: | |||||||||||||||||||
Earnings (loss) from continuing operations: | |||||||||||||||||||
Basic | $ | 1.38 | $ | 1.12 | $ | 3.45 | $ | 1.36 | $ | 1.66 | |||||||||
Diluted | $ | 1.36 | $ | 1.10 | $ | 3.39 | $ | 1.34 | $ | 1.64 | |||||||||
Earnings (loss) from discontinued operations: | |||||||||||||||||||
Basic | $ | 0.01 | $ | (0.15 | ) | $ | (0.18 | ) | $ | (0.18 | ) | $ | (0.12 | ) | |||||
Diluted | $ | 0.00 | $ | (0.15 | ) | $ | (0.18 | ) | $ | (0.18 | ) | $ | (0.12 | ) | |||||
Net income (loss): | |||||||||||||||||||
Basic | $ | 1.39 | $ | 0.97 | $ | 3.27 | $ | 1.18 | $ | 1.54 | |||||||||
Diluted | $ | 1.36 | $ | 0.95 | $ | 3.21 | $ | 1.16 | $ | 1.52 | |||||||||
Weighted average shares outstanding - basic | 32.0 | 31.8 | 31.2 | 33.1 | 36.5 | ||||||||||||||
Weighted average shares outstanding - diluted | 32.5 | 32.4 | 31.7 | 33.6 | 36.8 | ||||||||||||||
Dividends declared per common share | $0.575 | $0.500 | $0.450 | $0.350 | $0.300 | ||||||||||||||
Balance Sheet Data: | |||||||||||||||||||
Working Capital | $ | 233.7 | $ | 299.5 | $ | 427.5 | $ | 335.4 | $ | 493.6 | |||||||||
Cash and cash equivalents | 20.9 | 87.4 | 194.9 | 105.3 | 244.1 | ||||||||||||||
Total assets | 1,528.5 | 1,441.0 | 1,670.3 | 1,487.0 | 1,600.4 | ||||||||||||||
Long-term debt (excluding capital leases) | 120.0 | — | 152.8 | 159.9 | 202.5 | ||||||||||||||
Total debt | 135.8 | 2.0 | 159.3 | 203.4 | 252.8 | ||||||||||||||
Long-term capital lease obligations | 0.0 | 57.5 | 56.4 | 55.0 | 55.0 | ||||||||||||||
Total capital lease obligations | 0.0 | 57.7 | 57.4 | 55.5 | 55.9 | ||||||||||||||
Total stockholders’ equity | 915.4 | 864.4 | 830.3 | 740.0 | 830.4 | ||||||||||||||
- 17-
(1) | In fiscal 2014, the Company recorded a pretax charge of $2.4 for royalties related to Storia® operating system-specific apps that will no longer be supported due to the planned transition to a Storia streaming model. |
(2) | In fiscal 2014, the Company recorded a pretax charge of $1.0 related to Storia operating system-specific apps that will no longer be supported due to the planned transition to a Storia streaming model. In fiscal 2013, the Company recorded a pretax charge of $4.0 related to asset impairments. In fiscal 2012, the Company recorded a pretax charge of $1.3 for an impairment of a U.S.- based equity method investment. In fiscal 2011, the Company recorded a pretax charge of $3.0 associated with restructuring in the UK. In fiscal 2010, the Company recorded a pretax charge of $4.7 associated with restructuring in the UK. |
(3) | In fiscal 2012, the Company recorded a pretax charge of $4.9 for the impairment of intangible assets relating to certain publishing properties. |
(4) | In fiscal 2014, the Company recorded pretax severance expense of $10.8 as part of a cost savings initiative. In fiscal 2013, the Company recorded pretax severance expense of $9.6 as part of a cost savings initiative. In fiscal 2012, the Company recorded pretax severance expense of $9.3 for a voluntary retirement program. |
(5) | In fiscal 2014, the Company recorded a pretax impairment charge of $14.6 for assets related to Storia operating system-specific apps that will no longer be supported due to the planned transition to a Storia streaming model. In fiscal 2014, the Company recorded a pretax impairment charge of $13.4 related to goodwill associated with the book clubs reporting unit in the Children's Book Publishing and Distribution segment. In fiscal 2012, the Company recorded a pretax impairment loss of $6.2 related to certain subleases in lower Manhattan. In fiscal 2011, the Company recorded a pretax impairment charge of $3.4 related to assets in the library publishing and classroom magazines business. In fiscal 2010, the Company recorded a pretax asset impairment charge of $36.3 attributable to intangible assets and prepublication costs associated with the library business and a pretax charge of $3.8 associated with a customer list. |
(6) | In fiscal 2014, the Company recorded a pretax loss of $1.0 and $4.8 related to a US-based equity method investment and a UK-based cost-method investment, respectively. In fiscal 2011, the Company recorded a pretax loss of $3.6 related to a UK-based cost method investment. In fiscal 2010, the Company recorded a pretax loss of $1.5 related to a U.S.-based cost method investment. |
(7) | In fiscal 2014, the Company recognized previously unrecognized tax positions resulting in a benefit of $13.8, inclusive of interest, as a result of a settlement with the Internal Revenue Service related to the audits for fiscal years ended May 31, 2007, 2008 and 2009. |
Item 7 | Management’s Discussion and Analysis of Financial Condition and Results of Operations
General
The Company categorizes its businesses into five reportable segments: Children’s Book Publishing and Distribution; Educational Technology and Services; Classroom and Supplemental Materials Publishing; Media, Licensing and Advertising (which collectively represent the Company’s domestic operations); and International. This classification reflects the nature of products, services and distribution consistent with the method by which the Company’s chief operating decision-maker assesses operating performance and allocates resources.
The following discussion and analysis of the Company’s financial position and results of operations should be read in conjunction with the Company’s Consolidated Financial Statements and the related Notes included in Item 8, “Consolidated Financial Statements and Supplementary Data.”
Overview and Outlook
Revenues in 2014 were $1.82 billion, an increase of 2% from $1.79 billion in 2013, reflecting higher engagement levels in school-based book clubs, buoyed by more popular titles and incentives and revamped marketing tools, the successful introduction of new educational technology products, higher circulation in classroom magazines, and strong demand for the Company’s summer reading programs, all partially offset by unfavorable foreign currency translation of $24.2 million. Consolidated earnings per diluted share were $1.36 for the fiscal year ended May 31, 2014, compared to $0.95 in the prior fiscal year.
The Company began the year with the successful introduction of new innovative educational technology programs, including the ground-breaking math intervention program, MATH 180, further strengthening the Company’s portfolio of offerings to schools and classrooms. Book clubs operations improved significantly in the second half of the fiscal year, with new mailing and incentive marketing strategies that, combined with an expanded line of popular and engaging titles, resulted in higher value orders and increased ordering frequency. In addition to increased sales in the fiscal year, the Company achieved manufacturing and distribution efficiencies across all businesses, which are expected to drive sustained margin expansion and strong operating cash flows in fiscal 2015 and beyond.
In fiscal 2015, the Company expects revenue growth and enhanced profitability across the majority of its businesses and distribution channels. The Company expects sales of its educational technology products to continue their positive trajectory as the Company builds its sales organization and focuses on broadening the user base of its high-margin programs, including READ 180 and SYSTEM 44. This outlook also reflects the Company’s expectation for modest growth in its re-positioned book clubs and increased revenue per fair in its book fairs unit as it continues to rebalance its fair mix towards schools that generate higher revenue per fair. The Company expects growth in its International segment to be partially offset by increased investment in new products and the build-out of the sales organization in Asia. The Company anticipates the recent success of Minecraft to continue, with two additional titles and a boxed set scheduled for release later in 2014, and expects sales of the Hunger Games trilogy in its domestic trade and international major markets to decrease in fiscal 2015.
- 18-
Critical Accounting Policies and Estimates
General:
The Company’s discussion and analysis of its financial condition and results of operations is based upon its Consolidated Financial Statements, which have been prepared in accordance with accounting principles generally accepted in the United States. The preparation of these financial statements involves the use of estimates and assumptions by management, which affects the amounts reported in the Consolidated Financial Statements and accompanying notes. The Company bases its estimates on historical experience, current business factors, future expectations and various other assumptions believed to be reasonable under the circumstances, all of which are necessary in order to form a basis for determining the carrying values of assets and liabilities. Actual results may differ from those estimates and assumptions. On an on-going basis, the Company evaluates the adequacy of its reserves and the estimates used in calculations, including, but not limited to: collectability of accounts receivable; sales returns; amortization periods; stock-based compensation expense; pension and other post-retirement obligations; tax rates; recoverability of inventories, deferred income taxes and tax reserves, fixed assets, prepublication costs, royalty advances and customer reward programs; and the fair value of goodwill and other intangibles. For a complete description of the Company’s significant accounting policies, see Note 1 of Notes to Consolidated Financial Statements in Item 8, “Consolidated Financial Statements and Supplementary Data,” of this Report. The following policies and account descriptions include all those identified by the Company as critical to its business operations and the understanding of its results of operations:
Revenue Recognition:
The Company’s revenue recognition policies for its principal businesses are as follows:
School-Based Book Clubs – Revenue from school-based book clubs is recognized upon shipment of the products. For ebooks, revenue is recognized upon electronic delivery to the customer.
School-Based Book Fairs – Revenues associated with school-based book fairs are related to sales of product. Book fairs are typically run by schools and/or parent teacher organizations over a five business-day period. The amount of revenue recognized for each fair represents the net amount of cash collected at the fair. Revenue is fully recognized at the completion of the fair. At the end of reporting periods, the Company defers estimated revenue for those fairs that have not been completed as of the period end, based on the number of fair days occurring after period end on a straight-line calculation of the full fair’s estimated revenue.
Trade –Revenue from the sale of children’s books for distribution in the retail channel is recognized when risks and benefits transfer to the customer, or when the product is on sale and available to the public. For newly published titles, the Company, on occasion, contractually agrees with its customers when the publication may be first offered for sale to the public, or an agreed upon “Strict Laydown Date.” For such titles, the risks and benefits of the publication are not deemed to be transferred to the customer until such time that the publication can contractually be sold to the public, and the Company defers revenue on sales of such titles until such time as the customer is permitted to sell the product to the public. Revenue for ebooks, which is the net amount received from the retailer, is generally recognized upon electronic delivery to the customer by the retailer.
A reserve for estimated returns is established at the time of sale and recorded as a reduction to revenue. Actual returns are charged to the reserve as received. The calculation of the reserve for estimated returns is based on historical return rates, sales patterns, type of product and expectations. Actual returns could differ from the Company’s estimate. In order to develop the estimate of returns that will be received subsequent to May 31, 2014, management considers patterns of sales and returns in the months preceding May 31, 2014, as well as actual returns received subsequent to year end, available sell-through information and other return rate information that management believes is relevant. A one percentage point change in the estimated reserve for returns rate would have resulted in an increase or decrease in operating income for the year ended May 31, 2014 of approximately $1.0 million. A reserve for estimated bad debts is established based on the aggregate aging of accounts receivable and specific reserves on a customer-by-customer basis, where applicable.
Educational Technology and Services – For shipments to schools, revenue is recognized when risks and benefits transfer to the customer. Shipments to depositories are on consignment and revenue is recognized based on actual shipments from the depositories to the schools. For certain software-based products, the Company offers new customers installation, maintenance and training with these products and, in such cases, revenue is deferred and recognized as services are delivered or over the life of the contract. Revenues from contracts with multiple deliverables are recognized as each deliverable is earned, based on the relative selling price of each deliverable, provided the deliverable has value to customers on a standalone basis, the customer
- 19-
has full use of the deliverable and there is no further obligation from the Company. If there is a right of return, revenue is recognized if delivery of the undelivered items or services is probable and substantially in control of the Company.
Classroom and Supplemental Materials Publishing – Revenue from the sale of classroom and supplemental materials is recognized upon shipment of the products.
Film Production and Licensing – Revenue from the sale of film rights, principally for the home video and domestic and foreign television markets, is recognized when the film has been delivered and is available for showing or exploitation. Licensing revenue is recorded in accordance with royalty agreements at the time the licensed materials are available to the licensee and collections are reasonably assured.
Magazines – Revenue is deferred and recognized ratably over the subscription period, as the magazines are delivered.
Magazine Advertising – Revenue is recognized when the magazine is for sale and available to the subscribers.
Scholastic In-School Marketing – Revenue is recognized when the Company has satisfied its obligations under the program and the customer has acknowledged acceptance of the product or service. Certain revenues may be deferred pending future deliverables.
Accounts receivable:
Accounts receivable are recorded net of allowances for doubtful accounts and reserves for returns. In the normal course of business, the Company extends credit to customers that satisfy predefined credit criteria. Reserves for returns are based on historical return rates, sales patterns and an assessment of product on hand with the customer when estimable. Allowances for doubtful accounts are established through the evaluation of accounts receivable aging, prior collection experience and creditworthiness of the Company’s customers to estimate the ultimate collectability of these receivables. At the time the Company determines that a receivable balance, or any portion thereof, is deemed to be permanently uncollectible, the balance is then written off. A one percentage point change in the estimated bad debt reserve rates, which are applied to the accounts receivable aging, would have resulted in an increase or decrease in operating income for the year ended May 31, 2014 of approximately $3.0 million.
Inventories:
Inventories, consisting principally of books, are stated at the lower of cost, using the first-in, first-out method, or market. The Company records a reserve for excess and obsolete inventory based upon a calculation using the historical usage rates and sales patterns of its products, and specifically identified obsolete inventory. The impact of a one percentage point change in the obsolescence reserve rate would have resulted in an increase or decrease in operating income for the year ended May 31, 2014 of approximately $3.5 million.
Royalty advances:
Royalty advances are initially capitalized and subsequently expensed as related revenues are earned or when the Company determines future recovery through earndowns is not probable. The Company has a long history of providing authors with royalty advances, and it tracks each advance earned with respect to the sale of the related publication. Historically, the longer the unearned portion of the advance remains outstanding, the less likely it is that the Company will recover the advance through the sale of the publication, as the related royalties earned are applied first against the remaining unearned portion of the advance. The Company applies this historical experience to its existing outstanding royalty advances to estimate the likelihood of recovery. Additionally, the Company’s editorial staff regularly reviews its portfolio of royalty advances to determine if individual royalty advances are not recoverable through earndowns for discrete reasons, such as the death of an author prior to completion of a title or titles, a Company decision to not publish a title, poor market demand or other relevant factors that could impact recoverability.
Goodwill and intangible assets:
Goodwill and other intangible assets with indefinite lives are not amortized and are reviewed for impairment annually or more frequently if impairment indicators arise.
- 20-
With regard to goodwill, the Company compares the estimated fair values of its identified reporting units to the carrying values of their net assets. The Company first performs a qualitative assessment to determine whether it is more likely than not that the fair values of its identified reporting units are less than their carrying values. If it is more likely than not that the fair value of a reporting unit is less than its carrying amount, the Company performs the two-step test. For each of the reporting units, the estimated fair value is determined utilizing the expected present value of the projected future cash flows of the unit, in addition to comparisons to similar companies. The Company reviews its definition of reporting units annually or more frequently if conditions indicate that the reporting units may change. The Company evaluates its operating segments to determine if there are components one level below the operating segment level. A component is present if discrete financial information is available and segment management regularly reviews the operating results of the business. If an operating segment only contains a single component, that component is determined to be a reporting unit for goodwill impairment testing purposes. If an operating segment contains multiple components, the Company evaluates the economic characteristics of these components. Any components within an operating segment that share similar economic characteristics are aggregated and deemed to be a reporting unit for goodwill impairment testing purposes. Components within the same operating segment that do not share similar economic characteristics are deemed to be individual reporting units for goodwill impairment testing purposes. The Company has identified twelve separate reporting units for goodwill impairment testing purposes. The determination of the fair value of the Company’s reporting units involves a number of assumptions, including the estimates of future cash flows, discount rates and market-based multiples, among others, each of which is subject to change. Accordingly, it is possible that changes in assumptions and the performance of certain reporting units could lead to impairments in future periods,which may be material.
With regard to other intangibles with indefinite lives, the Company determines the fair value by asset, which is then compared to its carrying value. The Company first performs a qualitative assessment to determine whether it is more likely than not that the fair value of its identified reporting unit is less than its carrying value. If it is more likely than not that the fair value of a reporting unit is less than its carrying amount, the Company performs a quantitative test. The estimated fair value is determined utilizing the expected present value of the projected future cash flows of the asset.
Intangible assets with definite lives consist principally of customer lists, covenants not to compete, and certain other intellectual property assets and are amortized over their expected useful lives. Customer lists are amortized on a straight-line basis over a five-year period, while covenants not to compete are amortized on a straight-line basis over their contractual term. Other intellectual property assets are amortized over their remaining useful lives, which range from five to twenty years.
Unredeemed Incentive Credits:
The Company employs incentive programs to encourage sponsor participation in its book clubs and book fairs. These programs allow the sponsors to accumulate credits which can then be redeemed for Company products or other items offered by the Company. The Company recognizes a liability at the estimated cost of providing these credits at the time of the recognition of revenue for the underlying purchases of Company product that resulted in the granting of the credits. As the credits are redeemed, such liability is reduced.
Other noncurrent liabilities:
All of the rate assumptions discussed below impact the Company’s calculations of its pension and post-retirement obligations. The rates applied by the Company are based on the portfolios’ past average rates of return, discount rates and actuarial information. Any change in market performance, interest rate performance, assumed health care costs trend rate or compensation rates could result in significant changes in the Company’s pension and post-retirement obligations.
Pension obligations – The Company’s pension calculations are based on three primary actuarial assumptions: the discount rate, the long-term expected rate of return on plan assets and the anticipated rate of compensation increases. The discount rate is used in the measurement of the projected, accumulated and vested benefit obligations and interest cost components of net periodic pension costs. The long-term expected return on plan assets is used to calculate the expected earnings from the investment or reinvestment of plan assets. The anticipated rate of compensation increase is used to estimate the increase in compensation for participants of the plan from their current age to their assumed retirement age. The estimated compensation amounts are used to determine the benefit obligations and the service cost. A one percentage point change in the discount rate would have resulted in an increase or decrease in operating income for the year ended May 31, 2014 of approximately $0.2 million. A one percentage point change in the expected long-term return on plan assets would have resulted in an increase or decrease in operating income for the year ended May 31, 2014 of approximately $1.7 million. Pension benefits in the cash balance plan for employees located in the United States are based on formulas in which the employees’ balances are credited monthly with interest based on the
- 21-
average rate for one-year United States Treasury Bills plus 1%. Contribution credits are based on employees’ years of service and compensation levels during their employment periods for the periods prior to June 1, 2009.
Other post-retirement benefits – The Company provides post-retirement benefits, consisting of healthcare and life insurance benefits, to eligible retired United States-based employees. The post-retirement medical plan benefits are funded on a pay-as-you-go basis, with the employee paying a portion of the premium and the Company paying the remainder of the medical cost. The existing benefit obligation is based on the discount rate and the assumed health care cost trend rate. The discount rate is used in the measurement of the projected and accumulated benefit obligations and the service and interest cost components of net periodic post-retirement benefit cost. A one percentage point change in the discount rate would have resulted in an increase or decrease in operating income for the year ended May 31, 2014 of approximately $0.6 million and $0.7 million respectively. The assumed health care cost trend rate is used in the measurement of the long-term expected increase in medical claims. A one percentage point change in the health care cost trend rate would have resulted in an increase or decrease in operating income for the year ended May 31, 2014 of approximately $0.1 million. A one percentage point change in the health care cost trend rate would have resulted in an increase or decrease in the post-retirement benefit obligation as of May 31, 2014 of approximately $3.6 million and $3.1 million, respectively.
Stock-based compensation – The Company measures the cost of services received in exchange for an award of equity instruments based on the grant-date fair value of the award. The Company recognizes the cost on a straight-line basis over an award’s requisite service period, which is generally the vesting period, based on the award’s fair value at the date of grant. The fair value of each option grant is estimated on the date of grant using the Black-Scholes option-pricing model. The determination of the assumptions used in the Black-Scholes model requires management to make significant judgments and estimates. The use of different assumptions and estimates in the option pricing model could have a material impact on the estimated fair value of option grants and the related expense. The risk-free interest rate is based on a U.S. Treasury rate in effect on the date of grant with a term equal to the expected life. The expected term is determined based on historical employee exercise and post-vesting termination behavior. The expected dividend yield is based on actual dividends paid or to be paid by the Company. The volatility is estimated based on historical volatility corresponding to the expected life.
Income Taxes – The Company uses the asset and liability method of accounting for income taxes. Under this method, deferred tax assets and liabilities are determined based on differences between financial reporting and tax bases of assets and liabilities and are measured using enacted tax rates and laws that will be in effect when the differences are expected to enter into the determination of taxable income.
The Company believes that its taxable earnings, during the periods when the temporary differences giving rise to deferred tax assets become deductible or when tax benefit carryforwards may be utilized, should be sufficient to realize the related future income tax benefits. For those jurisdictions where the expiration date of the tax benefit carryforwards or the projected taxable earnings indicate that realization is not likely, the Company establishes a valuation allowance.
In assessing the need for a valuation allowance, the Company estimates future taxable earnings, with consideration for the feasibility of on-going tax planning strategies and the realizability of tax benefit carryforwards, to determine which deferred tax assets are more likely than not to be realized in the future. Valuation allowances related to deferred tax assets can be impacted by changes to tax laws, changes to statutory tax rates and future taxable earnings. In the event that actual results differ from these estimates in future periods, the Company may need to adjust the valuation allowance.
The Company recognizes a liability for uncertain tax positions that the Company has taken or expects to file in an income tax return. An uncertain tax position is recognized only if it is “more likely than not” that the position is sustainable based on its technical merit. A recognized tax benefit of a qualifying position is the largest amount of tax benefit that is greater than 50% likely of being realized upon settlement with a taxing authority having full knowledge of all relevant information.
The Company assesses foreign investment levels periodically to determine if all or a portion of the Company’s investments in foreign subsidiaries are indefinitely invested. If foreign investments are not expected to be indefinitely invested, the Company provides for income taxes on the portion that is not indefinitely invested.
Non-income Taxes – The Company is subject to tax examinations for sales-based taxes. A number of these examinations are ongoing and, in certain cases, have resulted in assessments from taxing authorities. Where a liability associated with these examinations and assessments is probable and can be reliably estimated, the Company has made accruals for these matters which are reflected in the Company’s Consolidated Financial Statements. Future developments relating to the foregoing could result in adjustments being made to these accruals.
- 22-
Results of Operations
(Amounts in millions, except per share data)
For fiscal years ended May 31,
2014 | 2013 | 2012 | ||||||||||||||||||
$ | % (1) | $ | % (1) | $ | % (1) | |||||||||||||||
Revenues: | ||||||||||||||||||||
Children’s Book Publishing and Distribution | $ | 873.5 | 48.0 | $ | 846.9 | 47.2 | $ | 1,111.3 | 52.0 | |||||||||||
Educational Technology and Services | 248.7 | 13.6 | 227.7 | 12.7 | 254.7 | 11.9 | ||||||||||||||
Classroom and Supplemental Materials Publishing | 229.6 | 12.6 | 218.0 | 12.2 | 208.2 | 9.7 | ||||||||||||||
Media, Licensing and Advertising | 56.2 | 3.1 | 58.7 | 3.3 | 75.3 | 3.5 | ||||||||||||||
International | 414.3 | 22.7 | 441.1 | 24.6 | 489.6 | 22.9 | ||||||||||||||
Total revenues | 1,822.3 | 100.0 | 1,792.4 | 100.0 | 2,139.1 | 100.0 | ||||||||||||||
Cost of goods sold (2) | 846.0 | 46.4 | 829.6 | 46.3 | 984.6 | 46.0 | ||||||||||||||
Selling, general and administrative expenses (exclusive of depreciation and amortization) (3) | 812.5 | 44.6 | 815.0 | 45.5 | 878.5 | 41.1 | ||||||||||||||
Depreciation and amortization (4) | 61.4 | 3.4 | 66.5 | 3.7 | 68.8 | 3.2 | ||||||||||||||
Severance (5) | 11.3 | 0.6 | 13.4 | 0.7 | 14.9 | 0.7 | ||||||||||||||
Loss on leases and asset impairments (6) | 28.0 | 1.5 | 0.0 | 0.0 | 7.0 | 0.3 | ||||||||||||||
Operating income | 63.1 | 3.5 | 67.9 | 3.8 | 185.3 | 8.7 | ||||||||||||||
Interest income | 0.6 | 0.0 | 1.2 | 0.1 | 1.0 | 0.1 | ||||||||||||||
Interest expense | (7.5 | ) | (0.4 | ) | (15.7 | ) | (0.9 | ) | (16.5 | ) | (0.8 | ) | ||||||||
Loss on investments and other(7) | (5.8 | ) | (0.3 | ) | — | — | (0.1 | ) | — | |||||||||||
Earnings (loss) from continuing operations before income taxes | 50.4 | 2.8 | 53.4 | 3.0 | 169.7 | 8.0 | ||||||||||||||
Provision (benefit) for income taxes (8) | 6.1 | 0.4 | 17.6 | 1.0 | 61.6 | 2.9 | ||||||||||||||
Earnings (loss) from continuing operations | 44.3 | 2.4 | 35.8 | 2.0 | 108.1 | 5.1 | ||||||||||||||
Earnings (loss) from discontinued operations, net of tax | 0.1 | 0.0 | (4.7 | ) | (0.3 | ) | (5.7 | ) | (0.3 | ) | ||||||||||
Net income (loss) | $ | 44.4 | 2.4 | $ | 31.1 | 1.7 | $ | 102.4 | 4.8 | |||||||||||
Earnings (loss) per share: | ||||||||||||||||||||
Basic: | ||||||||||||||||||||
Earnings (loss) from continuing operations | $ | 1.38 | $ | 1.12 | $ | 3.45 | ||||||||||||||
Earnings (loss) from discontinued operations | $ | 0.01 | $ | (0.15 | ) | $ | (0.18 | ) | ||||||||||||
Net income (loss) | $ | 1.39 | $ | 0.97 | $ | 3.27 | ||||||||||||||
Diluted: | ||||||||||||||||||||
Earnings (loss) from continuing operations | $ | 1.36 | $ | 1.10 | $ | 3.39 | ||||||||||||||
Earnings (loss) from discontinued operations | $ | 0.00 | $ | (0.15 | ) | $ | (0.18 | ) | ||||||||||||
Net income (loss) | $ | 1.36 | $ | 0.95 | $ | 3.21 | ||||||||||||||
(1) | Represents percentage of total revenues. |
(2) | In fiscal 2014, the Company recorded a pretax charge of $2.4 for royalties related to Storia operating system-specific apps that will no longer be supported due to the planned transition to a Storia streaming model. |
(3) | In fiscal 2014, the Company recorded a pretax charge of $1.0 related to Storia operating system-specific apps that will no longer be supported due to the planned transition to a Storia streaming model. In fiscal 2013, the Company recorded a pretax charge of $4.0 related to asset impairments. In fiscal 2012, the Company recorded a pretax charge of $1.3 for an impairment of a U.S.-based equity investment. |
(4) | In fiscal 2012, the Company recorded a pretax charge of $4.9 for the impairment of intangible assets relating to certain publishing properties. |
(5) | In fiscal 2014, the Company recorded pretax severance expense of $10.8 as part of a cost savings initiative. In fiscal 2013, the Company recorded pretax severance expense of $9.6 as part of a cost savings initiative. In fiscal 2012, the Company recorded pretax severance expense of $9.3 for a voluntary retirement program. |
(6) | In fiscal 2014, the Company recorded a pretax impairment charge of $14.6 for assets in the Children's Book Publishing and Distribution segment related to Storia operating system-specific apps that will no longer be supported due to the planned transition to a Storia streaming model. In fiscal 2014, the Company recorded a pretax impairment charge of $13.4 related to goodwill associated with the book clubs reporting unit in the Children's |
- 23-
Book Publishing and Distribution segment. In fiscal 2012, the Company recorded a pretax impairment loss of $6.2 related to certain subleases in lower Manhattan.
(7) | In fiscal 2014, the Company recorded a pretax loss of $1.0 and $4.8 related to a US-based equity-method investment and a UK-based cost-method investment, respectively. |
(8) | In fiscal 2014, the Company recognized previously unrecognized tax positions resulting in a benefit of $13.8, inclusive of interest, as a result of a settlement with the Internal Revenue Service related to the audits for fiscal years ended May 31, 2007, 2008 and 2009. |
Results of Operations – Consolidated
Fiscal 2014 compared to fiscal 2013
Revenues for the fiscal year ended May 31, 2014 increased by $29.9 million, or 1.7%, to $1,822.3 million, compared to $1,792.4 million in the prior fiscal year. The book clubs and book fairs channels of the Children’s Book Publishing and Distribution segment experienced higher revenues of $24.7 million and $14.1 million, respectively, driven by changes in the marketing strategies for these channels. Also contributing to the increase were strong results from new product offerings in the Company’s Educational Technology and Services segment. MATH 180®, iRead™ and Common Core Code X®, all of which are new product offerings successfully launched for the 2013-2014 school year, resulted in increased revenues of $28.3 million. Classroom and Supplemental Materials Publishing segment revenues were also higher by $11.6 million, driven by higher classroom magazine circulation. Offsetting the increase were lower revenues from the Hunger Games trilogy of $27.3 million across the Children’s Book Publishing and Distribution segment, the International segment and the Media, Licensing and Advertising segment. Lower International segment revenues also resulted from the adverse impact of foreign exchange rates of $24.2 million in fiscal 2014 compared to fiscal 2013, and the absence of low margin software sales in Australia totaling $8.0 million.
Cost of goods sold as a percentage of revenue for the fiscal year ended May 31, 2014 remained relatively constant at 46.4%, compared to the prior fiscal year, despite higher prepublication amortization costs of $9.5 million in fiscal 2014. In fiscal 2014, 13.6% of the Company’s revenues were from the Educational Technology and Services segment, compared to 12.7% in the prior fiscal year. The Educational Technology and Services segment experiences significantly higher gross margins than the Children’s Book Publishing and Distribution and the International segments. Royalty costs in the Children’s Book Publishing and Distribution segment include $2.4 million related to Storia operating system-specific apps that will no longer be supported due to the planned transition to a Storia streaming model.
Components of Cost of goods sold for fiscal years 2014, 2013 and 2012 are as follows:
($ amounts in millions) | |||||||||||||||
2014 | % of revenue | 2013 | % of revenue | 2012 | % of revenue | ||||||||||
Product, service and production costs | $ | 459.7 | 25.2 | % | $ | 456.0 | 25.4 | % | $ | 536.2 | 25.0 | % | |||
Royalty costs | 94.0 | 5.2 | 90.7 | 5.1 | 157.4 | 7.4 | |||||||||
Prepublication and production amortization | 61.2 | 3.4 | 51.7 | 2.9 | 56.1 | 2.6 | |||||||||
Postage, freight, shipping, fulfillment and all other costs | 231.1 | 12.6 | 231.2 | 12.9 | 234.9 | 11.0 | |||||||||
Total cost of goods sold | $ | 846.0 | 46.4 | % | $ | 829.6 | 46.3 | % | $ | 984.6 | 46.0 | % | |||
Selling, general and administrative expenses for the fiscal year ended May 31, 2014 decreased modestly to $812.5 million, compared to $815.0 million in the prior fiscal year. While the Company experienced lower salaries and benefits of $11.4 million, as well as lower promotional spending of $11.3 million, compared to fiscal 2013, as a result of prior cost savings initiatives, the Company recognized higher incentive compensation of $17.8 million and higher stock based compensation of $3.0 million in fiscal 2014. The Company recorded a charge of $1.0 related to Storia operating system-specific apps that will no longer be supported due to the planned transition to a Storia streaming model.
Severance expense of $11.3 million in fiscal 2014 includes $10.8 million related to cost reduction initiatives as the Company continues to focus on efficiency initiatives.
In fiscal 2014, the Company recorded an asset impairment of $14.6 million related to Storia operating system-specific apps that will no longer be supported due to the planned transition to a Storia streaming model. In fiscal 2014, the Company recognized a $13.4 million impairment of goodwill attributable to legacy acquisitions associated with the book club operations in the Children’s Book Publishing and Distribution segment.
- 24-
For the fiscal year ended May 31, 2014, net interest expense decreased to $6.9 million, compared to $14.5 million in the prior fiscal year, primarily resulting from the April 2013 repayment of the Company’s 5% Notes. In addition, in fiscal 2014, the Company increased its borrowings under the Loan Agreement (described under "Financing" below) by $175.0 million related to the purchase of its 555 Broadway headquarters building, but simultaneously satisfied its obligation under its 555 Broadway capital lease of $58.3 million. The net effect on interest expense prospectively is expected to be minimal, as the capital lease had a substantially higher imputed interest rate than the current floating rate under the Loan Agreement.
In the fourth quarter of fiscal 2014, the Company recorded a loss of $1.0 million related to a US-based equity-method investment. In the third quarter of fiscal 2014, the Company recorded a loss of $4.8 million related to a UK-based cost-method investment.
The Company’s effective tax rate for the fiscal year ended May 31, 2014 was 12.1%, compared to 33.0% in the prior fiscal year. The effective tax rate for fiscal 2014 was favorably impacted by a settlement with the Internal Revenue Service and the associated recognition of $13.8 million of previously unrecognized income tax positions, including interest.
Earnings from continuing operations for fiscal 2014 increased by $8.5 million to $44.3 million, compared to $35.8 million in fiscal 2013. The basic and diluted earnings from continuing operations per share of Class A Stock and Common Stock were $1.38 and $1.36, respectively, in fiscal 2014, compared to $1.12 and $1.10, respectively, in fiscal 2013.
Earnings from discontinued operations, net of tax, for the fiscal year ended May 31, 2014 was $0.1 million, compared to a loss from discontinued operations, net of tax, of $4.7 million in the prior fiscal year. The Company did not discontinue any operations in fiscal 2014.
The resulting net income for fiscal 2014 was $44.4 million, or $1.39 and $1.36 per basic and diluted share, respectively, compared to net income of $31.1 million, or $0.97 and $0.95 per basic and diluted share, respectively, in fiscal 2013.
Fiscal 2013 compared to fiscal 2012
Revenues for fiscal 2013 decreased by $346.7 million, or 16.2%, to $1,792.4 million, compared to $2,139.1 million in fiscal 2012, due to lower revenues in the Children’s Book Publishing and Distribution segment, the Educational Technology and Services segment, the International segment and the Media, Licensing and Advertising segment of $264.4 million, $27.0 million, $48.5 million and $16.6 million, respectively, partially offset by increased revenues of $9.8 million in the Classroom and Supplemental Materials Publishing segment.
Cost of goods sold as a percentage of revenue for fiscal 2013 remained relatively consistent at 46.3%, compared to 46.0% in the prior fiscal year. While cost of goods sold as a percentage of revenue remained relatively flat for the total Company, the Children’s Book Publishing and Distribution segment experienced higher relative costs for free books and related fulfillment costs in the book clubs distribution channel and lower volumes in the trade business, but these were largely offset by improvements in the book fairs business. In the Company's educational segments, higher service revenues in the Educational Technology and Services segment, which carry a higher relative cost, were offset by improved margins in the Classroom and Supplemental Materials Publishing segment due to increased circulation of classroom magazines.
Selling, general and administrative expenses in fiscal 2013 decreased by $63.5 million to $815.0 million, compared to $878.5 million in the prior fiscal year. The decrease was driven by lower sales tax accrual in two jurisdictions in the Children’s Book Publishing and Distribution segment resulting from sales tax assessments of $19.7 million recorded in fiscal 2012, and the absence of employee bonuses and lower stock compensation expense in fiscal 2013.
Severance expense of $13.4 million in fiscal 2013 included $9.6 million related to cost reduction initiatives. Severance expense was $14.9 million in fiscal 2012, related to the Company’s cost reduction programs, which included $9.3 million recorded in fiscal 2012 relating to a voluntary retirement program.
During fiscal 2012, the Company entered into sublease arrangements for certain leased properties in lower Manhattan. The fair value of the net rents to be received was less than the Company’s lease commitments for these properties over the remaining term of the leases. Accordingly, the Company recognized a loss on these subleases of $6.2 million.
For fiscal 2013, net interest expense decreased to $14.5 million, compared to $15.5 million in fiscal 2012, reflecting lower interest rates and borrowings.
- 25-
The Company’s provision for income taxes with respect to continuing operations resulted in an effective tax rate of 33.0% and 36.3% for fiscal 2013 and 2012, respectively. The decrease in the effective tax rate for fiscal 2013 was primarily due to the reversal of valuation allowances based on higher profitability in the UK and uncertain tax positions. These valuation allowances were established in fiscal 2011 and prior years.
Earnings from continuing operations for fiscal 2013 decreased by $72.3 million to $35.8 million compared to $108.1 million in fiscal 2012. The basic and diluted earnings from continuing operations per share of Class A Stock and Common Stock were $1.12 and $1.10, respectively, in fiscal 2013 and $3.45 and $3.39, respectively, in fiscal 2012.
Loss from discontinued operations, net of tax, for fiscal 2013 was $4.7 million, compared to $5.7 million for fiscal 2012. The loss in the current fiscal year was principally comprised of closure costs and asset impairments totaling $4.0 million. The loss in fiscal 2012 included an impairment of the Company’s Maumelle facility of $2.2 million, which was sold in fiscal 2013, and operational losses from the Company’s discontinued Back to Basics business of $2.1 million. In addition, in fiscal 2012 the Company recognized a liability for the present value of future lease payments due on multiple leases in a discontinued UK business as there is no opportunity for subleasing.
The resulting net income for fiscal 2013 was $31.1 million, or $0.97 and $0.95 per basic and diluted share, respectively, compared to net income of $102.4 million, or $3.27 and $3.21 per basic and diluted share, respectively, in fiscal 2012.
Results of Operations – Segments
CHILDREN’S BOOK PUBLISHING AND DISTRIBUTION
($ amounts in millions) | 2014 compared to 2013 | 2013 compared to 2012 | |||||||||||||||||||||||
2014 | 2013 | 2012 | $ change | % change | $ change | % change | |||||||||||||||||||
Revenues | $ | 873.5 | $ | 846.9 | $ | 1,111.3 | $ | 26.6 | 3.1 | % | $ | (264.4 | ) | (23.8 | )% | ||||||||||
Cost of goods sold | 377.0 | 359.4 | 466.7 | 17.6 | 4.9 | (107.3 | ) | (23.0 | ) | ||||||||||||||||
Other operating expenses * | 445.7 | 463.0 | 491.9 | (17.3 | ) | (3.7 | ) | (28.9 | ) | (5.9 | ) | ||||||||||||||
Asset impairments | 28.0 | — | 0.5 | 28.0 | 100.0 | (0.5 | ) | (100.0 | ) | ||||||||||||||||
Operating income (loss) | $ | 22.8 | $ | 24.5 | $ | 152.2 | $ | (1.7 | ) | (6.9 | )% | $ | (127.7 | ) | (83.9 | )% | |||||||||
Operating margin | 2.6 | % | 2.9 | % | 13.7 | % | |||||||||||||||||||
* Other operating expenses include selling, general and administrative expenses, bad debt expenses, depreciation and amortization.
Fiscal 2014 compared to fiscal 2013
Revenues for the fiscal year ended May 31, 2014 increased by $26.6 million to $873.5 million, compared to $846.9 million in the prior fiscal year. The Company started to realize benefits from its marketing efforts to improve book clubs performance during the spring promotional period which included sponsor targeted promotions, more kid friendly offerings and better integration of the on-line and off-line ordering experiences. As a result, revenues from book clubs increased by $24.7 million in fiscal 2014 compared to the prior fiscal year, with the improvement occurring in the second half of fiscal 2014. The Company’s book fair revenues increased $14.1 million, primarily due to higher revenue per fair. The Company continues to direct greater book fair resources and support to schools that generate higher revenue per fair. As a result of this focus, revenue per fair in fiscal 2014 increased 4.0% compared to the prior fiscal year. Revenues in the trade channel decreased by $12.2 million in fiscal 2014 compared to the prior fiscal year. The prior fiscal year benefited from higher sales of Hunger Games trilogy titles of $9.8 million and the impact of favorable Hunger Games returns experience of $8.8 million compared to the current fiscal year. Partially offsetting the trade channel declines were sales of new cover artwork Harry Potter titles of $8.1 million and higher sales of other front list titles of $6.4 million, including Star Wars: Jedi Academy by Jeffrey Brown, Spirit Animals™ #1: Wild Born by Brandon Mull and Spirit Animals™ #2 : Hunted by Maggie Stiefvater, The Finisher by David Baldacci, Tui Sutherland’s Wings of Fire #4: The Dark Secrets and Minecraft: Essential Handbook and Mincraft: Redstone Handbook.
Cost of goods sold for the fiscal year ended May 31, 2014 was $377.0 million, or 43% of revenues, compared to $359.4 million, or 42% of revenues, in the prior fiscal year. Cost of goods sold as percentage of revenue remained relatively flat for this segment, with modest improvements in the book fairs channel reflecting higher revenue per fair being offset by modest declines in the trade channel. Trade channel gross margins can vary from period to period based upon the mix and volume of products
- 26-
sold. Royalty expenses in fiscal 2014 include $2.4 million related to Storia operating system-specific apps that will no longer be supported due to the planned transition to a Storia streaming model.
Other operating expenses were $445.7 million for the fiscal year ended May 31, 2014, compared to $463.0 million in the prior fiscal year, as lower expenses of $19.7 million in the book club operations, driven by cost reduction efforts and lower digital initiative costs, were partially offset by modestly higher salary and other costs in the book fair operations of $8.6 million. Selling, general and administrative expenses for fiscal 2014 include $1.0 million related to Storia operating system-specific apps that will no longer be supported due to the planned transition to a Storia streaming model.
Segment operating income for the fiscal year ended May 31, 2014 was $22.8 million compared to $24.5 million in the prior fiscal year. Results in fiscal year 2014 include charges of $18.0 million (inclusive of $14.6 million of asset impairments) related to Storia operating system-specific apps that will no longer be supported due to the planned transition to a Storia streaming model. and a $13.4 million goodwill impairment. The increase in operating income, when the impairment charges are excluded, was a result of higher revenues and profitability in the book clubs channel, as the Company stabilized its sponsor base in this channel during fiscal 2014, as well as higher revenues and profitability in the book fairs channel. Additionally, the Company’s trade publishing efforts continue to produce popular new titles for the trade and other channels.
Fiscal 2013 compared to fiscal 2012
Revenues for fiscal 2013 decreased by $264.4 million to $846.9 million, compared to $1,111.3 million in fiscal 2012. Lower net revenues in the Company’s trade channel of $213.0 million reflected decreased sales of the Hunger Games trilogy compared to the trilogy’s strong results in fiscal 2012. Revenues from the Company’s book clubs channel declined $57.5 million, related to lower revenue per event and decreased sponsorship. These decreases were partially offset by an increase in the Company’s book fairs channel of $6.1 million in fiscal year 2013 over the prior fiscal year, driven by modest increases in the number of fairs and revenue per fair.
Cost of goods sold for fiscal 2013 was $359.4 million, or 42% of revenues, compared to $466.7 million, or 42% of revenues, in fiscal 2012. The absolute decrease in cost of goods sold of $107.3 million was due predominantly to the lower level of Hunger Games trilogy sales in fiscal 2013. Cost of goods sold as a percentage of revenue remained flat, with higher relative costs for free books and related fulfillment costs of $3.2 million in the book clubs channel and lower volumes in the trade channel being offset by improved margins, primarily from the book fairs channel, but also the book clubs channel, driven by lower inventory obsolescence in fiscal 2013.
Other operating expenses decreased by $28.9 million to $463.0 million in fiscal 2013, compared to $491.9 million in fiscal 2012. The decrease was primarily related to the presence of additional sales tax expense of $19.7 million in fiscal 2012 relating to sales tax assessments in two jurisdictions in the Company’s book clubs channel, as well as the higher fiscal 2012 employee-related expenses for incentive compensation, favorability in collections in the Company’s trade channel customer accounts in fiscal 2013, and higher amortization expense of $4.9 million in fiscal 2012 for impairment of certain publishing and trademark rights. These decreases were partially offset by higher promotional expense of $5.7 million in the book clubs channel in fiscal 2013.
Segment operating income for fiscal 2013 decreased by $127.7 million to $24.5 million, compared to $152.2 million in the prior fiscal year. Fiscal 2012 benefited from the success of the Hunger Games trilogy, while fiscal 2013 experienced strong results from the book fairs channel, offset by lower revenues and higher promotional expenses in the book clubs channel. Operating income from trade channel sales was lower in fiscal 2013 compared to fiscal 2012 due to Hunger Games related revenues, but remained strong from titles such as The 39 Clues® series and the Harry Potter series, as well as other titles, such as Drama by Raina Telgemeier, The Raven Boys by Maggie Stiefvater, and Captain Underpants and the Revolting Revenge of the Radioactive Robo-Boxers by Dav Pilkey.
- 27-
EDUCATIONAL TECHNOLOGY AND SERVICES
($ amounts in millions) | 2014 compared to 2013 | 2013 compared to 2012 | |||||||||||||||||||||||
2014 | 2013 | 2012 | $ change | % change | $ change | % change | |||||||||||||||||||
Revenues | $ | 248.7 | $ | 227.7 | $ | 254.7 | $ | 21.0 | 9.2 | % | $ | (27.0 | ) | (10.6 | )% | ||||||||||
Cost of goods sold | 96.2 | 88.7 | 90.5 | 7.5 | 8.5 | (1.8 | ) | (2.0 | ) | ||||||||||||||||
Other operating expenses * | 112.9 | 109.5 | 115.0 | 3.4 | 3.1 | (5.5 | ) | (4.8 | ) | ||||||||||||||||
Operating income (loss) | $ | 39.6 | $ | 29.5 | $ | 49.2 | $ | 10.1 | 34.2 | % | $ | (19.7 | ) | (40.0 | )% | ||||||||||
Operating margin | 15.9 | % | 13.0 | % | 19.3 | % | |||||||||||||||||||
* Other operating expenses include selling, general and administrative expenses, bad debt expenses and depreciation and amortization.
Fiscal 2014 compared to fiscal 2013
Revenues for the fiscal year ended May 31, 2014 increased by $21.0 million to $248.7 million, compared to $227.7 million in the prior fiscal year. Fiscal 2014 segment activity was highlighted by the successful launch of new products, including MATH 180®, iRead™ and Common Core Code X®. which accounted for $28.3 million of increased revenues. Most of these revenues were recognized in the first half of fiscal 2014, as customer implementation of these new solutions coincided with the start of the school year. Revenues from the Company’s established curriculum technology reading programs and services decreased $1.2 million for fiscal 2014, as increased revenues from sales of System 44®Next Generation were largely offset by revenue declines for Read 180®. During third quarter of fiscal 2014, a sales force realignment temporarily impacted the efforts of the sales force, resulting in lower segment revenues for the third quarter, but revenues from product sales largely recovered in the fourth quarter. Revenues from consulting services declined by $4.8 million in fiscal 2014 compared to fiscal 2013, primarily due to lower renewals experience in fiscal 2014.
Cost of goods sold increased to $96.2 million, or 39% of revenues, in the fiscal year ended May 31, 2014, compared to $88.7 million, or 39% of revenues, in the prior fiscal year. Higher amortization of prepublication costs of $6.7 million for newly launched products drove the absolute increase.
Other operating expenses for the fiscal year ended May 31, 2014 increased to $112.9 million, compared to $109.5 million in fiscal 2013. The increase resulted from higher travel expenses of $2.4 million, most of which was associated with the sales force realignment activities.
Segment operating income for the fiscal year ended May 31, 2014 increased by $10.1 million to $39.6 million, compared to $29.5 million in the prior fiscal year. The segment benefited from the strong sales of the new products mentioned above, which expanded the segment’s product offerings into areas such as math intervention and digital reading programs, complimenting and leveraging the segment’s established market presence in reading intervention.
Fiscal 2013 compared to fiscal 2012
Revenues for the fiscal year ended May 31, 2013 decreased by $27.0 million, or 10.6%, to $227.7 million, compared to $254.7 million in the prior fiscal year, primarily related to decreased sales of curriculum educational technology products of $32.9 million, due to lower spending by school districts, as well as a significant sale of adoption product in Texas in fiscal 2012. In addition, fiscal 2012 benefited from higher revenues related to the launch of READ 180® Next Generation. The decrease was partially offset by higher revenues of $7.8 million for products and services provided by the Math Solutions business and by the consulting business associated with training for the Common Core State Standards.
Cost of goods sold decreased to $88.7 million, or 39% of revenues, in fiscal 2013, compared to $90.5 million, or 36% of revenues, for fiscal 2012. The increase in Cost of goods sold as a percentage of revenue was primarily due to a shift in revenues from higher margin product sales to lower margin service revenues. The Company’s service revenues as a percentage of total Educational Technology and Services revenue was 38% for fiscal 2013, compared to 31% for fiscal 2012. Fiscal 2013 included accelerated prepublication costs of $2.0 million, while fiscal 2012 included accelerated amortization of $0.8 million.
Other operating expenses for fiscal 2013 decreased by $5.5 million, or 4.8%, to $109.5 million, compared to $115.0 million in the prior fiscal year. The decrease was partially related to lower commission expense of $2.4 million, resulting from the lower revenue, as well as higher incentive compensation costs in the prior fiscal year.
- 28-
Segment operating income for fiscal 2013 decreased by $19.7 million, or 40.0%, to $29.5 million, compared to $49.2 million in the prior fiscal year. In fiscal 2012, this segment benefited from the launch of READ 180 Next Generation, but did not have similar new product launches in fiscal 2013.
CLASSROOM AND SUPPLEMENTAL MATERIALS PUBLISHING
($ amounts in millions) | 2014 compared to 2013 | 2013 compared to 2012 | |||||||||||||||||||||||
2014 | 2013 | 2012 | $ change | % change | $ change | % change | |||||||||||||||||||
Revenues | $ | 229.6 | $ | 218.0 | $ | 208.2 | $ | 11.6 | 5.3 | % | $ | 9.8 | 4.7 | % | |||||||||||
Cost of goods sold | 83.6 | 83.9 | 86.2 | (0.3 | ) | (0.4 | ) | (2.3 | ) | (2.7 | ) | ||||||||||||||
Other operating expenses * | 108.5 | 104.5 | 103.7 | 4.0 | 3.8 | 0.8 | 0.8 | ||||||||||||||||||
Operating income (loss) | $ | 37.5 | $ | 29.6 | $ | 18.3 | $ | 7.9 | 26.7 | % | $ | 11.3 | 61.7 | % | |||||||||||
Operating margin | 16.3 | % | 13.6 | % | 8.8 | % | |||||||||||||||||||
* Other operating expenses include selling, general and administrative expenses, bad debt expenses and depreciation and amortization.
Fiscal 2014 compared to fiscal 2013
Revenues for the fiscal year ended May 31, 2014 increased $11.6 million to $229.6 million, compared to $218.0 million in the prior fiscal year. This increase partially resulted from higher circulation revenues of classroom magazines of $6.6 million, increased sales of digital and customized print packages of $4.1 million, including increased revenues from Summer reading programs of approximately $2.5 million, and modest increases in sales of teaching resource products of $1.2 million. While sales of collections to classrooms were relatively flat to the prior fiscal year, the Company has enhanced its online store for teachers, providing teachers and schools greater access to the Company’s offerings, resulting in improved ecommerce activity from this source, and streamlining the segment’s distribution process. The success of the classroom magazines business continues to reflect the increased classroom demand for current non-fiction content and the segment’s ability to deliver this content in both print and digital formats.
Cost of goods sold for the fiscal year ended May 31, 2014 was $83.6 million, or 36% of revenue, compared to $83.9 million, or 38% of revenue, in the prior fiscal year, primarily due to higher volumes of classroom magazines, which carry relatively low variable costs, and improved postage, freight and handling costs.
Other operating expenses increased by $4.0 million for the fiscal year ended May 31, 2014, due predominantly to higher information technology costs for digital magazines, offset by cost savings in the teaching resource business.
Segment operating income for the fiscal year ended May 31, 2014 improved by $7.9 million. The classroom magazines business continues to experience improved circulation, driving $4.6 million of this improvement, as customers seek supplemental current content to meet Common Core State Standards. Reduced costs in the teaching resource business also added to the improved results.
Fiscal 2013 compared to fiscal 2012
Revenues for fiscal 2013 increased by $9.8 million to $218.0 million, compared to $208.2 million in the prior fiscal year. This increase was due to higher revenues from sales of classroom magazines of $16.8 million. Circulation improved in the classroom magazines business, as the Company experienced increased demand for non-fiction content to meet the requirements of the Common Core State Standards, as well as strong interest for digital magazine content. Partially offsetting this increase were decreased sales of classroom libraries.
Cost of goods sold for the fiscal year ended May 31, 2013 was $83.9 million, or 38% of revenue, compared to $86.2 million, or 41% of revenue, in fiscal 2012. The absolute decrease in Cost of goods sold was the result of the lower sales volume of classroom libraries. The improvement as a percentage of sales was the result of higher circulation in the classroom magazines business, as much of the content cost in this business is fixed and does not vary with increased circulation. Other operating expenses for fiscal 2013 were relatively consistent at $104.5 million, compared to $103.7 million in fiscal 2012.
Segment operating income for fiscal 2013 improved significantly to $29.6 million, compared to $18.3 million in fiscal 2012, primarily due to growth in the classroom magazines business.
- 29-
MEDIA, LICENSING AND ADVERTISING
($ amounts in millions) | 2014 compared to 2013 | 2013 compared to 2012 | |||||||||||||||||||||||
2014 | 2013 | 2012 | $ change | % change | $ change | % change | |||||||||||||||||||
Revenues | $ | 56.2 | $ | 58.7 | $ | 75.3 | $ | (2.5 | ) | (4.3 | )% | $ | (16.6 | ) | (22.0 | )% | |||||||||
Cost of goods sold | 23.4 | 22.0 | 40.6 | 1.4 | 6.4 | (18.6 | ) | (45.8 | ) | ||||||||||||||||
Other operating expenses * | 33.5 | 32.0 | 39.6 | 1.5 | 4.7 | (7.6 | ) | (19.2 | ) | ||||||||||||||||
Operating income (loss) | $ | (0.7 | ) | $ | 4.7 | $ | (4.9 | ) | $ | (5.4 | ) | ** | $ | 9.6 | ** | ||||||||||
Operating margin | — | 8.0 | % | — | |||||||||||||||||||||
* Other operating expenses include selling, general and administrative expenses, bad debt expenses and depreciation and amortization.
** Not meaningful.
Fiscal 2014 compared to fiscal 2013
Revenues for the fiscal year ended May 31, 2014 decreased by $2.5 million to $56.2 million, compared to $58.7 million in the prior fiscal year. This decrease was due to lower sales of the Hunger Games trilogy audio books of $3.7 million, lower sales of Leapster products of $2.1 million and decreased advertising revenues of $1.0 million. The strong prior year results of the Hunger Games trilogy audio books corresponded to the same period success experienced in the trade channel of the Children’s Book Publishing and Distribution segment. Revenues for Company programming increased by $4.6 million in fiscal 2014, driven by the Company's agreement with Netflix for internet distribution rights of Clifford® and The Magic School Bus programming, and an agreement with PBS for WordGirl programming.
Cost of goods sold increased to $23.4 million, or 42% of revenue, for the fiscal year ended May 31, 2014, compared to $22.0 million, or 37% of revenue, for the prior fiscal year. Higher amortization of production costs of $2.3 million and the higher sales volumes of Hunger Games audio books in fiscal 2013, which carry a relatively low cost of goods sold, were responsible for the increase as a percentage of sales.
Other operating expenses were $33.5 million for the fiscal year ended May 31, 2014, compared to $32.0 million for the prior fiscal year. The prior fiscal year included $1.3 million of settlement income received from a former programming partner.
Segment operating loss for the fiscal year ended May 31, 2014 was $0.7 million, compared to operating income of $4.7 million in the prior fiscal year. The decline in profitability was due to the substantially lower volumes of Hunger Games audio book sales, combined with lower Leapster sales, and the prior year inclusion of settlement income from a former programming partner, partially offset by the improvements in programming revenues. The segment is now focusing its efforts on repurposing proprietary content for digital platforms, both internally and through distributors such as Netflix.
Fiscal 2013 compared to fiscal 2012
Revenues for fiscal 2013 decreased by $16.6 million to $58.7 million, compared to $75.3 million in fiscal 2012. This decrease was primarily related to the absence of $9.9 million of revenues from sales of console games, as the Company reduced its focus on interactive console products. Lower production revenues of $6.1 million, principally of Word Girl®, and lower advertising and consumer magazine revenues of $1.3 million also contributed to the decline. Partially offsetting these declines were increased sales of audio books, primarily of the Hunger Games trilogy, of $2.0 million.
Cost of goods sold was $22.0 million, or 37% of revenue, for fiscal 2013, compared to $40.6 million, or 54% of revenue, for fiscal 2012. The improvement as a percentage of revenue was driven by the decrease in low-margin console game sales. Contributing to the improvement was the prior year acceleration of amortization on certain owned properties.
Other operating expenses for fiscal 2013 decreased by $7.6 million to $32.0 million, compared to $39.6 million in the prior fiscal year. The decrease was related to settlement income received from a former programming partner of $1.3 million, as well as lower promotional, employee and other operating expenses in the Company’s consumer magazine business and Scholastic Entertainment, Inc.
- 30-
Segment operating income for fiscal 2013 was $4.7 million, compared to a loss of $4.9 million in the prior fiscal year. The absence of accelerated amortization in the production business in fiscal 2012, and the success of the audio book business and the return of the consumer magazines business to a profitable position in fiscal 2013, were responsible for the improvements in fiscal 2013.
INTERNATIONAL
($ amounts in millions) | 2014 compared to 2013 | 2013 compared to 2012 | |||||||||||||||||||||||
2014 | 2013 | 2012 | $ change | % change | $ change | % change | |||||||||||||||||||
Revenues | $ | 414.3 | $ | 441.1 | $ | 489.6 | $ | (26.8 | ) | (6.1 | )% | $ | (48.5 | ) | (9.9 | )% | |||||||||
Cost of goods sold | 202.8 | 213.6 | 242.5 | (10.8 | ) | (5.1 | ) | (28.9 | ) | (11.9 | ) | ||||||||||||||
Other operating expenses * | 180.7 | 187.7 | 189.2 | (7.0 | ) | (3.7 | ) | (1.5 | ) | (0.8 | ) | ||||||||||||||
Asset impairments | — | — | 0.3 | — | — | (0.3 | ) | (100.0 | ) | ||||||||||||||||
Operating income (loss) | $ | 30.8 | $ | 39.8 | $ | 57.6 | $ | (9.0 | ) | (22.6 | )% | $ | (17.8 | ) | (30.9 | )% | |||||||||
Operating margin | 7.4 | % | 9.0 | % | 11.8 | % | |||||||||||||||||||
* Other operating expenses include selling, general and administrative expenses, bad debt expenses, severance and depreciation and amortization.
Fiscal 2014 compared to fiscal 2013
Revenues for the fiscal year ended May 31, 2014 decreased by $26.8 million to $414.3 million, compared to $441.1 million in the prior fiscal year. This decrease was due to the adverse impact of foreign exchange rates of $24.2 million and a decrease of $8.0 million in an Australian low margin software business, as well as lower trade sales in the United Kingdom of $4.3 million primarily due to a decline in the sales of Hunger Games titles. Decreased export sales of $1.8 million also contributed to the segment’s decline in revenues. Partially offsetting these decreases were improved revenues from Asian markets of $10.0 million, as operations in India, Malaysia, the Philippines and Thailand all experienced improved revenues, mostly from the Company’s direct sales of English language reference products, and the Company’s growing educational business in the region, where it has established educational publishing operations locally in Singapore to serve the regional need for English language materials and educational programs. Also, the Company's operations in Canada and the United Kingdom had higher revenues from book fairs of $1.4 million and $1.0 million, respectively, as well as higher education-related revenues in the United Kingdom of $1.5 million, compared to the prior fiscal year.
Cost of goods sold for the fiscal year ended May 31, 2014 was $202.8 million, or 49% of sales, compared to $213.6 million, or 48% of sales, in the prior fiscal year. The absolute decreases in both periods were attributable to the effect of foreign exchange. No single factor was responsible for the increase of cost of goods sold as a percent of revenues.
For the fiscal year ended May 31, 2014, other operating expenses declined by $7.0 million, as increased costs paid by the U.S. operations on behalf of foreign subsidiaries of $3.5 million and increased bad debt expense of $0.6 million were more than offset by currency exchange and the impact of cost savings initiatives.
Segment operating income for fiscal 2014 decreased by $9.0 million to $30.8 million, compared to $39.8 million in the prior fiscal year. Lower trade channel sales in major markets for the fiscal year ended May 31, 2014 were primarily due to the high level of Hunger Games trilogy sales in the prior fiscal year, and had a corresponding impact on earnings. The decrease in sales from the Australian software business did not significantly impact earnings, as these sales were low margin sales. The Company continues to focus on English language educational businesses, based in Singapore, which it views as a future growth driver. Demand from the Asian region continues to grow, and the Company is well positioned to meet this demand.
Fiscal 2013 compared to fiscal 2012
Revenues for fiscal 2013 decreased by $48.5 million to $441.1 million, compared to $489.6 million in the prior fiscal year. This decrease was primarily related to lower revenues in Canada of $27.4 million, primarily in the trade and book clubs channels, as well as lower revenues in Australia of $13.4 million, primarily in the new media and trade businesses. In both cases, the lower revenues in the trade channel resulted from lower sales of the Hunger Games trilogy, as well as the negative impact of foreign currency exchange rates of $3.9 million, all of which were partially offset by higher revenues in the
- 31-
Company’s export business of $2.0 million and increases in the Company’s businesses in Asia of $2.8 million, where the Company is focused on educational products.
Cost of goods sold decreased to $213.6 million in fiscal 2013 from $242.5 million in fiscal 2012, commensurate with the revenue decline, but remained relatively consistent at 48% as a percentage of revenue, compared to 50% of revenue in fiscal 2012.
Other operating expenses decreased slightly to $187.7 million in fiscal 2013 from $189.2 million in fiscal 2012.
Segment operating income for fiscal 2013 decreased by $17.8 million to $39.8 million, compared to $57.6 million in the prior fiscal year. The decrease is primarily due to unfavorable results in the Company’s Australia and Canada operations of $5.4 million and $5.6 million, respectively, and a $1.1 million decrease in its operating income in Asia. Lower results in Asia reflect the Company’s continuing investment in English language educational businesses.
Overhead
Corporate overhead for fiscal 2014 increased by $6.7 million to $66.9 million, compared to $60.2 million in the prior fiscal year, primarily due to reinstated bonus and higher stock compensation. Corporate overhead for fiscal 2013 decreased by $26.9 million to $60.2 million, compared to $87.1 million in the prior fiscal year, primarily due to lower employee-related expenses and incentive compensation in fiscal 2013 compared to the prior year.
Liquidity and Capital Resources
Fiscal 2014 compared to fiscal 2013
The Company’s cash and cash equivalents totaled $20.9 million at May 31, 2014 and $87.4 million at May 31, 2013. Cash and cash equivalents held by the Company’s U.S. operations totaled $2.1 million at May 31, 2014 and $60.0 million at May 31, 2013.
Cash provided by operating activities was $156.8 million for the fiscal year ended May 31, 2014, compared to cash provided by operating activities of $189.1 million for the prior fiscal year, representing a decrease in cash provided by operating activities of $32.3 million. In the fourth quarter of fiscal 2012, the Company experienced strong sales of the Hunger Games trilogy titles, and subsequently collected significant cash from these customers in the first quarter of fiscal 2013. In fiscal 2014, the Company experienced strong sales in its education and book fairs operations late in the fourth quarter, resulting in higher receivable balances from these operations as of May 31, 2014. Partially offsetting this disparity in collections between the two fiscal years were higher royalty payments in fiscal 2013 associated with the Hunger Games success, and higher payouts for incentive compensation of $28.7 million in the first quarter of fiscal 2013. Lower net income tax payments of $28.0 million in fiscal 2014 compared to fiscal 2013 also partially offset the decline.
Cash used in investing activities was $345.7 million for the fiscal year ended May 31, 2014, compared to $124.0 million in fiscal 2013. In fiscal 2014, the Company purchased the land and building comprising the leased portion of the Company’s New York City corporate headquarters, located in SoHo, for $253.9 million. In fiscal 2014, the Company also invested $1.0 million for a 20% interest in a software development entity, and collected $1.3 million of proceeds from a sold asset. In fiscal 2013, the Company incurred higher spending on technology assets of $19.9 million.
Cash provided by financing activities was $122.5 million for the fiscal year ended May 31, 2014, compared to cash used in financing activities of $172.7 million for the prior fiscal year. To finance the purchase of the SoHo land and building in the third quarter of fiscal 2014, the Company used existing cash and incurred borrowings under its Loan Agreement of $175.0 million. Other fiscal 2014 net short-term repayments totaled $41.1 million, which includes a fourth quarter repayment of $55.0 million under the Loan Agreement, compared to net repayments of $4.3 million in the prior fiscal year. Proceeds pursuant to employee stock plans declined $2.7 million in the fiscal year ended May 31, 2014 compared to the prior fiscal year, while dividend payments increased by $1.9 million due to an increase in the Company's quarterly dividend.
Fiscal 2013 compared to fiscal 2012
Cash provided by operating activities was $189.1 million for fiscal 2013, compared to $260.2 million for fiscal 2012, representing a decrease in cash provided by operating activities of $71.1 million. The key driver of the decrease was the lower operating profitability of $71.3 million, driven by the prior year’s strong Hunger Games sales. Working capital balances
- 32-
shifted, but the net impact from changes in the total working capital was modest, as collections of receivables in fiscal 2013 were offset by royalty payments and higher payments of employee bonuses of $31.4 million in fiscal 2013 related to fiscal 2012 performance.
Cash used in investing activities was $124.0 million for fiscal 2013, compared to $121.3 million in the prior fiscal year. In fiscal 2013, the Company sold a vacant facility in Maumelle, Arkansas, receiving $5.0 million in cash, while in the prior year the Company made strategic acquisitions totaling $9.5 million in cash expenditures.
Cash used in financing activities was $172.7 million for fiscal 2013, compared to $47.4 million for the prior fiscal year. In fiscal 2013, the Company’s 5% Notes due April 2013 matured and were fully repaid for $153.0 million. In fiscal 2012, the Company paid $50.2 million in scheduled payments on the 5% Notes. Dividend payouts increased by $2.7 million, as the Company implemented a higher per share dividend rate. Contributing to the higher use of cash were lower net borrowings under lines of credit of $12.9 million and a decrease in proceeds pursuant to stock-based compensation plans of $8.5 million in fiscal 2013 compared to the prior fiscal year.
Due to the seasonal nature of its business as discussed under “Seasonality” above, the Company usually experiences negative cash flows in the June through October time period. As a result of the Company’s business cycle, borrowings have historically increased during June, July and August, have generally peaked in September or October, and have been at their lowest point in May. In recent years, the Company had fixed debt in the form of the 5% Notes, which, while providing liquidity, resulted in high cash balances throughout the year.
The Company’s operating philosophy is to use cash provided by operating activities to create value by paying down debt, reinvesting in existing businesses and, from time to time, making acquisitions that will complement its portfolio of businesses or acquiring other strategic assets, as well as engaging in shareholder enhancement initiatives, such as share repurchases or dividend declarations. During the fiscal year ended May 31, 2014, the Company purchased $6.2 million of Company shares on the open market compared to $11.8 million of share purchases in the prior fiscal year.
The Company has maintained, and expects to maintain for the foreseeable future, sufficient liquidity to fund ongoing operations, including working capital requirements, pension contributions, dividends, currently authorized common share repurchases, debt service, planned capital expenditures and other investments. As of May 31, 2014, the Company’s primary sources of liquidity consisted of cash and cash equivalents of $20.9 million, cash from operations, and funding available under the Loan Agreement totaling approximately $305.0 million. Additionally, the Company has short-term credit facilities of $33.9 million, net of current borrowings of $15.8 million. The Company may at any time, but in any event not more than once in any calendar year, request that the aggregate availability of credit under the Loan Agreement be increased by an amount of $10.0 million or an integral multiple of $10.0 million (but not to exceed $150.0 million). Accordingly, the Company believes these sources of liquidity are sufficient to finance its ongoing operating needs, as well as its financing and investing activities.
- 33-
The following table summarizes, as of May 31, 2014, the Company’s contractual cash obligations by future period (see Notes 5, 6 and 12 of Notes to Consolidated Financial Statements in Item 8, “Consolidated Financial Statements and Supplementary Data”):
$ amounts in millions | |||||||||||||||||||
Payments Due By Period | |||||||||||||||||||
Contractual Obligations | 1 Year or Less | Years 2-3 | Years 4-5 | After Year 5 | Total | ||||||||||||||
Minimum print quantities | $ | 47.6 | $ | 93.1 | $ | 91.8 | $ | 143.4 | $ | 375.9 | |||||||||
Royalty advances | 10.4 | 3.6 | 0.8 | — | 14.8 | ||||||||||||||
Lines of credit and short-term debt | 15.8 | — | — | — | 15.8 | ||||||||||||||
Debt | — | — | 120.0 | — | 120.0 | ||||||||||||||
Capital leases (1) | 0.0 | — | — | — | 0.0 | ||||||||||||||
Pension and post-retirement plans (2) | 18.4 | 28.5 | 27.1 | 63.2 | 137.2 | ||||||||||||||
Operating leases | 32.1 | 44.9 | 22.6 | 14.1 | 113.7 | ||||||||||||||
Total | $ | 124.3 | $ | 170.1 | $ | 262.3 | $ | 220.7 | $ | 777.4 | |||||||||
(1) | Includes principal and interest. |
(2) | Excludes expected Medicare Part D subsidy receipts. |
Financing
Loan Agreement
The Company is party to the Loan Agreement with various banks as described in Note 5 of Notes to Consolidated Financial Statements in Item 8, “Consolidated Financial Statements and Supplementary Data.” Outstanding borrowings under the Loan Agreement were $120.0 million as of May 31, 2014. For a more complete description of the Loan Agreement, as well as the Company's other debt obligations, reference is made to Note 5 of Notes to Consolidated Financial Statements in Item 8, “Consolidated Financial Statements and Supplementary Data.”
Acquisitions
In the ordinary course of business, the Company explores domestic and international expansion opportunities, including potential niche and strategic acquisitions. As part of this process, the Company engages with interested parties in discussions concerning possible transactions. On January 3, 2012, the Company acquired Learners Publishing, a Singapore-based publisher of supplemental learning materials for English-Language Learners. The Company has integrated this business into its International segment. On February 8, 2012, the Company acquired the business and certain assets of Weekly Reader, a publisher of weekly educational classroom magazines designed for children in grades pre-K – 12. The Company has fully integrated this business in its Classroom and Supplemental Materials Publishing segment (see Note 2 of Notes to Consolidated Financial Statements in Item 8, “Consolidated Financial Statements and Supplementary Data”). The Company will continue to evaluate such expansion opportunities and prospects.
Item 7A | Quantitative and Qualitative Disclosures about Market Risk
The Company conducts its business in various foreign countries, and as such, its cash flows and earnings are subject to fluctuations from changes in foreign currency exchange rates. The Company sells products from its domestic operations to its foreign subsidiaries, creating additional currency risk. The Company manages its exposures to this market risk through internally established procedures and, when deemed appropriate, through the use of short-term forward exchange contracts which were not significant as of May 31, 2014. The Company does not enter into derivative transactions or use other financial instruments for trading or speculative purposes.
Market risks relating to the Company’s operations result primarily from changes in interest rates in its variable-rate borrowings. The Company is subject to the risk that market interest rates and its cost of borrowing will increase and thereby increase the interest charged under its variable-rate debt.
- 34-
Additional information relating to the Company’s outstanding financial instruments is included in Note 5 of Notes to Consolidated Financial Statements in Item 8, “Consolidated Financial Statements and Supplementary Data,” which is included herein.
The following table sets forth information about the Company’s debt instruments as of May 31, 2014 (see Note 5 of Notes to Consolidated Financial Statements in Item 8, “Consolidated Financial Statements and Supplementary Data”):
$ amounts in millions | |||||||||||||||||||||||||||||||
Fiscal Year Maturity | Fair Value | ||||||||||||||||||||||||||||||
2015 | 2016 | 2017 | 2018 | 2019 | Thereafter | Total | 2014 | ||||||||||||||||||||||||
Debt Obligations | |||||||||||||||||||||||||||||||
Lines of credit and current portion of long-term debt | $ | 15.8 | $ | — | $ | — | $ | — | $ | — | $ | — | $ | 15.8 | $ | 15.8 | |||||||||||||||
Average interest rate | 2.3 | % | — | — | — | — | — | ||||||||||||||||||||||||
Long-term debt | $ | — | $ | — | $ | — | $ | 120.0 | $ | — | $ | — | $ | 120.0 | $ | 120.0 | |||||||||||||||
Average interest rate | various (1) | ||||||||||||||||||||||||||||||
(1)The average rate is variable and is anticipated to be that under the Company’s Loan Agreement as discussed in Note 5 of Notes to Consolidated Financial Statements in Item 8, “Consolidated Financial Statements and Supplementary Data."
- 35-
this page intentionally left blank
- 36-
Item 8 | Consolidated Financial Statements and Supplementary Data
Page | ||
The following consolidated financial statement schedule for the years ended May 31, 2014, 2013 and 2012 is filed with this annual report on Form 10-K: | ||
All other schedules have been omitted since the required information is not present or is not present in amounts sufficient to require submission of the schedule, or because the information required is included in the Consolidated Financial Statements or the Notes thereto.
- 37-
Consolidated Statements of Operations
(Amounts in millions, except per share data) For fiscal years ended May 31, | |||||||||||
2014 | 2013 | 2012 | |||||||||
Revenues | $ | 1,822.3 | $ | 1,792.4 | $ | 2,139.1 | |||||
Operating costs and expenses: | |||||||||||
Cost of goods sold | 846.0 | 829.6 | 984.6 | ||||||||
Selling, general and administrative expenses | 812.5 | 815.0 | 878.5 | ||||||||
Depreciation and amortization | 61.4 | 66.5 | 68.8 | ||||||||
Severance | 11.3 | 13.4 | 14.9 | ||||||||
Loss on leases and asset impairments | 28.0 | 0.0 | 7.0 | ||||||||
Total operating costs and expenses | 1,759.2 | 1,724.5 | 1,953.8 | ||||||||
Operating income | 63.1 | 67.9 | 185.3 | ||||||||
Interest income | 0.6 | 1.2 | 1.0 | ||||||||
Interest expense | (7.5 | ) | (15.7 | ) | (16.5 | ) | |||||
Loss on investments and other | (5.8 | ) | 0.0 | (0.1 | ) | ||||||
Earnings (loss) from continuing operations before income taxes | 50.4 | 53.4 | 169.7 | ||||||||
Provision (benefit) for income taxes | 6.1 | 17.6 | 61.6 | ||||||||
Earnings (loss) from continuing operations | 44.3 | 35.8 | 108.1 | ||||||||
Earnings (loss) from discontinued operations, net of tax | 0.1 | (4.7 | ) | (5.7 | ) | ||||||
Net income (loss) | $ | 44.4 | $ | 31.1 | $ | 102.4 | |||||
Basic and diluted earnings (loss) per share of Class A and Common Stock | |||||||||||
Basic: | |||||||||||
Earnings (loss) from continuing operations | $ | 1.38 | $ | 1.12 | $ | 3.45 | |||||
Earnings (loss) from discontinued operations | $ | 0.01 | $ | (0.15 | ) | $ | (0.18 | ) | |||
Net income (loss) | $ | 1.39 | $ | 0.97 | $ | 3.27 | |||||
Diluted: | |||||||||||
Earnings (loss) from continuing operations | $ | 1.36 | $ | 1.10 | $ | 3.39 | |||||
Earnings (loss) from discontinued operations | $ | 0.00 | $ | (0.15 | ) | $ | (0.18 | ) | |||
Net income (loss) | $ | 1.36 | $ | 0.95 | $ | 3.21 | |||||
Dividends declared per common share | $ | 0.575 | $ | 0.50 | $ | 0.45 | |||||
See accompanying notes
- 38-
Consolidated Statements of Comprehensive Income (Loss)
(Amounts in millions, except per share data) For fiscal years ended May 31, | |||||||||||
2014 | 2013 | 2012 | |||||||||
Net income (loss) | $ | 44.4 | $ | 31.1 | $ | 102.4 | |||||
Other comprehensive income (loss), net: | |||||||||||
Foreign currency translation adjustments | (3.1 | ) | (2.6 | ) | (8.2 | ) | |||||
Pension and post-retirement adjustments: | |||||||||||
Amortization of prior service credit | (0.2 | ) | (0.4 | ) | (0.6 | ) | |||||
Amortization of unrecognized gains and losses included in net periodic cost | 13.5 | 11.8 | (11.5 | ) | |||||||
Total other comprehensive income (loss) | $ | 10.2 | $ | 8.8 | $ | (20.3 | ) | ||||
Comprehensive income (loss) | $ | 54.6 | $ | 39.9 | $ | 82.1 | |||||
See accompanying notes
- 39-
Consolidated Balance Sheets
(Amounts in millions, except share data) Balances at May 31, | |||||||
ASSETS | 2014 | 2013 | |||||
Current Assets: | |||||||
Cash and cash equivalents | $ | 20.9 | $ | 87.4 | |||
Accounts receivable (less allowance for doubtful accounts of $17.3 at May 31, 2014 and $19.3 at May 31, 2013) | 253.3 | 214.9 | |||||
Inventories | 272.7 | 278.1 | |||||
Deferred income taxes | 81.0 | 79.2 | |||||
Prepaid expenses and other current assets | 35.1 | 61.2 | |||||
Current assets of discontinued operations | 0.4 | 0.4 | |||||
Total current assets | 663.4 | 721.2 | |||||
Property, Plant and Equipment | |||||||
Land | 77.4 | 37.3 | |||||
Buildings | 243.3 | 100.7 | |||||
Capitalized software | 214.0 | 239.9 | |||||
Furniture, fixtures and equipment | 225.1 | 241.4 | |||||
Leasehold improvements | 171.6 | 172.4 | |||||
931.4 | 791.7 | ||||||
Less accumulated depreciation and amortization | (464.4 | ) | (480.1 | ) | |||
Net property, plant and equipment | 467.0 | 311.6 | |||||
Other Assets and Deferred Charges: | |||||||
Prepublication costs | 143.1 | 147.3 | |||||
Royalty advances (less allowance for reserves of $87.0 at May 31, 2014 and $81.5 at May 31, 2013) | 38.5 | 37.0 | |||||
Production costs | 4.5 | 1.7 | |||||
Goodwill | 144.5 | 157.9 | |||||
Other intangibles | 12.2 | 14.6 | |||||
Noncurrent deferred income taxes | 4.1 | 14.9 | |||||
Other assets and deferred charges | 51.2 | 34.8 | |||||
Total other assets and deferred charges | 398.1 | 408.2 | |||||
Total assets | $ | 1,528.5 | $ | 1,441.0 | |||
See accompanying notes
- 40-
(Amounts in millions, except share data) Balances at May 31, | |||||||
LIABILITIES AND STOCKHOLDERS’ EQUITY | 2014 | 2013 | |||||
Current Liabilities: | |||||||
Lines of credit and current portion of long-term debt | $ | 15.8 | $ | 2.0 | |||
Capital lease obligations | 0.0 | 0.2 | |||||
Accounts payable | 145.3 | 156.2 | |||||
Accrued royalties | 34.1 | 34.4 | |||||
Deferred revenue | 48.7 | 48.1 | |||||
Other accrued expenses | 184.7 | 179.5 | |||||
Current liabilities of discontinued operations | 1.1 | 1.3 | |||||
Total current liabilities | 429.7 | 421.7 | |||||
Noncurrent Liabilities: | |||||||
Long-term debt | 120.0 | — | |||||
Capital lease obligations | 0.0 | 57.5 | |||||
Other noncurrent liabilities | 63.4 | 97.4 | |||||
Total noncurrent liabilities | 183.4 | 154.9 | |||||
Commitments and Contingencies: | — | — | |||||
Stockholders’ Equity: | |||||||
Preferred Stock, $1.00 par value Authorized - 2,000,000; Issued - None | — | — | |||||
Class A Stock, $.01 par value Authorized - 4,000,000; Issued and Outstanding - 1,656,200 shares | 0.0 | 0.0 | |||||
Common Stock, $.01 par value Authorized - 70,000,000; Issued - 42,911,624 shares; Outstanding - 30,605,978 shares at May 31, 2014 (42,911,624 shares issued and 30,105,479 shares outstanding at May 31, 2013) | 0.4 | 0.4 | |||||
Additional paid-in capital | 580.8 | 582.9 | |||||
Accumulated other comprehensive income (loss) | (55.2 | ) | (65.4 | ) | |||
Retained earnings | 765.1 | 738.9 | |||||
Treasury stock at cost | (375.7 | ) | (392.4 | ) | |||
Total stockholders’ equity | 915.4 | 864.4 | |||||
Total liabilities and stockholders’ equity | $ | 1,528.5 | $ | 1,441.0 | |||
See accompanying notes
- 41-
Consolidated Statement of Changes in Stockholders’ Equity
(Amounts in millions, except share data) | |||||||||||||||||
Class A Stock | Common Stock | Additional Paid-in | |||||||||||||||
Shares | Amount | Shares | Amount | Capital | |||||||||||||
Balance at May 31, 2011 | 1,656,200 | $ | 0.0 | 29,316,691 | $ | 0.4 | $ | 576.6 | |||||||||
Net Income (loss) | — | — | — | — | — | ||||||||||||
Foreign currency translation adjustment | — | — | — | — | — | ||||||||||||
Pension and postretirement adjustments (net of tax of $(6.5)) | — | — | — | — | — | ||||||||||||
Stock-based compensation | — | — | — | — | 12.2 | ||||||||||||
Proceeds from issuance of common stock pursuant to stock-based compensation plans | — | — | 724,613 | — | 22.4 | ||||||||||||
Purchases of treasury stock at cost | — | — | (475,672 | ) | — | — | |||||||||||
Treasury stock issued pursuant to stock purchase plans | — | — | 230,279 | — | (28.2 | ) | |||||||||||
Dividends | — | — | — | — | — | ||||||||||||
Balance at May 31, 2012 | 1,656,200 | $ | 0.0 | 29,795,911 | $ | 0.4 | $ | 583.0 | |||||||||
Net Income (loss) | — | — | — | — | — | ||||||||||||
Foreign currency translation adjustment | — | — | — | — | — | ||||||||||||
Pension and postretirement adjustments (net of tax of $8.4) | — | — | — | — | — | ||||||||||||
Stock-based compensation | — | — | — | — | 7.3 | ||||||||||||
Proceeds from issuance of common stock pursuant to stock-based compensation plans | — | — | 507,197 | — | 14.7 | ||||||||||||
Purchases of treasury stock at cost | — | — | (432,330 | ) | — | — | |||||||||||
Treasury stock issued pursuant to stock purchase plans | — | — | 234,701 | — | (22.1 | ) | |||||||||||
Dividends | — | — | — | — | — | ||||||||||||
Balance at May 31, 2013 | 1,656,200 | $ | 0.0 | 30,105,479 | $ | 0.4 | $ | 582.9 | |||||||||
Net Income (loss) | — | — | — | — | — | ||||||||||||
Foreign currency translation adjustment | — | — | — | — | — | ||||||||||||
Pension and postretirement adjustments (net of tax of $5.0) | — | — | — | — | — | ||||||||||||
Stock-based compensation | — | — | — | — | 9.3 | ||||||||||||
Proceeds from issuance of common stock pursuant to stock-based compensation plans | — | — | 473,827 | — | 12.9 | ||||||||||||
Purchases of treasury stock at cost | — | — | (215,484 | ) | — | — | |||||||||||
Treasury stock issued pursuant to stock purchase plans | — | — | 242,156 | — | (24.3 | ) | |||||||||||
Dividends | — | — | — | — | — | ||||||||||||
Balance at May 31, 2014 | 1,656,200 | $ | 0.0 | 30,605,978 | $ | 0.4 | $ | 580.8 | |||||||||
See accompanying notes
- 42-
Accumulated Other Comprehensive Income (Loss) | Retained Earnings | Treasury Stock At Cost | Total Stockholders' Equity | ||||||||||||
Balance at May 31, 2011 | $ | (53.9 | ) | $ | 635.8 | $ | (418.9 | ) | $ | 740.0 | |||||
Net Income (loss) | — | 102.4 | — | 102.4 | |||||||||||
Foreign currency translation adjustment | (8.2 | ) | — | — | (8.2 | ) | |||||||||
Pension and postretirement adjustments (net of tax of $(6.5)) | (12.1 | ) | — | — | (12.1 | ) | |||||||||
Stock-based compensation | — | — | — | 12.2 | |||||||||||
Proceeds from issuance of common stock pursuant to stock-based compensation plans | — | — | — | 22.4 | |||||||||||
Purchases of treasury stock at cost | — | — | (13.1 | ) | (13.1 | ) | |||||||||
Treasury stock issued pursuant to stock purchase plans | — | — | 29.2 | 1.0 | |||||||||||
Dividends | — | (14.3 | ) | — | (14.3 | ) | |||||||||
Balance at May 31, 2012 | $ | (74.2 | ) | $ | 723.9 | $ | (402.8 | ) | $ | 830.3 | |||||
Net Income (loss) | — | 31.1 | — | 31.1 | |||||||||||
Foreign currency translation adjustment | (2.6 | ) | — | — | (2.6 | ) | |||||||||
Pension and postretirement adjustments (net of tax of $8.4) | 11.4 | — | — | 11.4 | |||||||||||
Stock-based compensation | — | — | — | 7.3 | |||||||||||
Proceeds from issuance of common stock pursuant to stock-based compensation plans | — | — | — | 14.7 | |||||||||||
Purchases of treasury stock at cost | — | — | (11.8 | ) | (11.8 | ) | |||||||||
Treasury stock issued pursuant to stock purchase plans | — | — | 22.2 | 0.1 | |||||||||||
Dividends | — | (16.1 | ) | — | (16.1 | ) | |||||||||
Balance at May 31, 2013 | $ | (65.4 | ) | $ | 738.9 | $ | (392.4 | ) | $ | 864.4 | |||||
Net Income (loss) | — | 44.4 | — | 44.4 | |||||||||||
Foreign currency translation adjustment | (3.1 | ) | — | — | (3.1 | ) | |||||||||
Pension and postretirement adjustments (net of tax of $5.0) | 13.3 | — | — | 13.3 | |||||||||||
Stock-based compensation | — | — | — | 9.3 | |||||||||||
Proceeds from issuance of common stock pursuant to stock-based compensation plans | — | — | — | 12.9 | |||||||||||
Purchases of treasury stock at cost | — | — | (6.2 | ) | (6.2 | ) | |||||||||
Treasury stock issued pursuant to stock purchase plans | — | — | 22.9 | (1.4 | ) | ||||||||||
Dividends | — | (18.2 | ) | — | (18.2 | ) | |||||||||
Balance at May 31, 2014 | $ | (55.2 | ) | $ | 765.1 | $ | (375.7 | ) | $ | 915.4 | |||||
See accompanying notes
- 43-
Consolidated Statements of Cash Flows
(Amounts in millions) Years ended May 31, | |||||||||||
2014 | 2013 | 2012 | |||||||||
Cash flows - operating activities: | |||||||||||
Net income (loss) | $ | 44.4 | $ | 31.1 | $ | 102.4 | |||||
Earnings (loss) from discontinued operations, net of tax | 0.1 | (4.7 | ) | (5.7 | ) | ||||||
Earnings (loss) from continuing operations | 44.3 | 35.8 | 108.1 | ||||||||
Adjustments to reconcile earnings (loss) from continuing operations to net cash provided by (used in) operating activities of continuing operations: | |||||||||||
Provision for losses on accounts receivable | 8.2 | 6.8 | 12.3 | ||||||||
Provision for losses on inventory | 25.1 | 27.2 | 48.1 | ||||||||
Provision for losses on royalty advances | 6.5 | 4.7 | 6.5 | ||||||||
Loss on subleases | — | — | 6.2 | ||||||||
Amortization of prepublication and production costs | 60.4 | 48.9 | 55.1 | ||||||||
Depreciation and amortization | 62.7 | 68.6 | 68.8 | ||||||||
Amortization of pension and post-retirement actuarial gains and losses | 5.6 | 4.8 | 4.6 | ||||||||
Deferred income taxes | 8.9 | 19.6 | (37.5 | ) | |||||||
Stock-based compensation | 9.3 | 6.3 | 12.2 | ||||||||
Income from equity investments | (2.6 | ) | (2.3 | ) | (1.3 | ) | |||||
Non cash write off related to asset impairment | 28.0 | 7.2 | 0.8 | ||||||||
Unrealized loss on investments | 5.8 | — | — | ||||||||
Changes in assets and liabilities, net of amounts acquired: | |||||||||||
Accounts receivable | (48.5 | ) | 94.4 | (108.7 | ) | ||||||
Inventories | (21.3 | ) | (9.9 | ) | (40.4 | ) | |||||
Prepaid expenses and other current assets | 24.9 | (14.2 | ) | 10.1 | |||||||
Deferred promotion costs | (0.1 | ) | 0.3 | (0.0 | ) | ||||||
Royalty advances | (7.6 | ) | (7.0 | ) | (6.2 | ) | |||||
Accounts payable | (11.2 | ) | 35.6 | (0.3 | ) | ||||||
Other accrued expenses | 7.6 | (53.4 | ) | 64.7 | |||||||
Accrued royalties | (0.3 | ) | (58.5 | ) | 58.2 | ||||||
Deferred revenue | 0.7 | 1.1 | (1.7 | ) | |||||||
Pension and post-retirement liabilities | (16.2 | ) | (20.8 | ) | (7.0 | ) | |||||
Other noncurrent liabilities | (29.4 | ) | (3.6 | ) | 5.9 | ||||||
Other, net | (3.9 | ) | 0.4 | 3.2 | |||||||
Total adjustments | 112.6 | 156.2 | 153.6 | ||||||||
Net cash provided by (used in) operating activities of continuing operations | 156.9 | 192.0 | 261.7 | ||||||||
Net cash provided by (used in) operating activities of discontinued operations | (0.1 | ) | (2.9 | ) | (1.5 | ) | |||||
Net cash provided by (used in) operating activities | 156.8 | 189.1 | 260.2 | ||||||||
Cash flows - investing activities: | |||||||||||
Prepublication and production expenditures | (66.1 | ) | (73.8 | ) | (58.8 | ) | |||||
Additions to property, plant and equipment | (27.0 | ) | (54.6 | ) | (53.7 | ) | |||||
Acquisition related payments | (1.0 | ) | (0.3 | ) | (9.5 | ) | |||||
Purchase of Building - 555 Broadway | (253.9 | ) | — | — | |||||||
Other | 2.3 | 0.8 | 0.8 | ||||||||
Net cash provided by (used in) investing activities of continuing operations | (345.7 | ) | (127.9 | ) | (121.2 | ) | |||||
Net cash provided by (used in) investing activities of discontinued operations | — | 3.9 | (0.1 | ) | |||||||
Net cash provided by (used in) investing activities | (345.7 | ) | (124.0 | ) | (121.3 | ) | |||||
See accompanying notes
- 44-
Consolidated Statements of Cash Flows
(Amounts in millions) Years ended May 31, | |||||||||||
2014 | 2013 | 2012 | |||||||||
Cash flows - financing activities: | |||||||||||
Net borrowings under credit agreement and revolving loan | 120.0 | — | — | ||||||||
Repayment of term loan | — | — | (50.2 | ) | |||||||
Repayment of 5.00% notes | — | (153.0 | ) | — | |||||||
Borrowings under lines of credit | 207.4 | 23.2 | 89.2 | ||||||||
Repayments of lines of credit | (193.5 | ) | (27.5 | ) | (80.6 | ) | |||||
Repayment of capital lease obligations | (0.2 | ) | (1.0 | ) | (0.7 | ) | |||||
Reacquisition of common stock | (6.2 | ) | (11.8 | ) | (13.1 | ) | |||||
Proceeds pursuant to stock-based compensation plans | 11.2 | 13.9 | 22.4 | ||||||||
Payment of dividends | (17.8 | ) | (15.9 | ) | (13.2 | ) | |||||
Other | 1.6 | (0.6 | ) | (1.2 | ) | ||||||
Net cash provided by (used in) financing activities | 122.5 | (172.7 | ) | (47.4 | ) | ||||||
Effect of exchange rate changes on cash and cash equivalents | (0.1 | ) | 0.1 | (1.9 | ) | ||||||
Net increase (decrease) in cash and cash equivalents | (66.5 | ) | (107.5 | ) | 89.6 | ||||||
Cash and cash equivalents at beginning of period | 87.4 | 194.9 | 105.3 | ||||||||
Cash and cash equivalents at end of period | $ | 20.9 | $ | 87.4 | $ | 194.9 | |||||
2014 | 2013 | 2012 | |||||||||
Supplemental Information: | |||||||||||
Income taxes payments (refunds), net | $ | 2.0 | $ | 30.0 | $ | 61.0 | |||||
Interest paid | 7.1 | 15.1 | 15.3 | ||||||||
See accompanying notes
- 45-
Notes to Consolidated Financial Statements
(Amounts in millions, except share and per share data)
1. DESCRIPTION OF THE BUSINESS, BASIS OF PRESENTATION AND SUMMARY OF SIGNIFICANT ACCOUNTING POLICIES
Description of the business
Scholastic Corporation (the “Corporation” and together with its subsidiaries, “Scholastic” or the “Company”) is a global children’s publishing, education and media company. Since its founding in 1920, Scholastic has emphasized quality products and a dedication to reading and learning. The Company is the world’s largest publisher and distributor of children’s books. It is also a leading developer of educational technology products and ebooks for children. Scholastic also creates quality educational and entertainment materials and products for use in school and at home, including magazines, ebooks, children’s reference and non-fiction materials, teacher materials, television programming and film. The Company is the leading operator of school-based book clubs and book fairs in the United States. It distributes its products and services through these proprietary channels, as well as directly to schools and libraries, through retail stores and through the internet. The Company’s website, scholastic.com, is a leading site for teachers, classrooms and parents and an award-winning destination for children. In addition to its operations in the United States, Scholastic has operations in Canada, the United Kingdom, Australia, New Zealand, Ireland, India, China, Singapore and other parts of Asia, and, through its export business, sells products in more than 150 countries.
Basis of presentation
Principles of consolidation
The Consolidated Financial Statements include the accounts of the Corporation and all wholly-owned and majority-owned subsidiaries. All significant intercompany transactions are eliminated in consolidation.
Discontinued Operations
The Company closed or sold several operations during fiscal 2010, 2012 and 2013. During the first quarter of fiscal 2012, the Company ceased operations in its direct-to-home catalog business specializing in toys. In the fourth quarter of fiscal 2013, the Company sold a facility that was previously classified as held for sale and also discontinued a computer club business which was previously included in the Children’s Book Publishing and Distribution segment and a subscription-based business which was previously reported in the Media, Licensing and Advertising segment. All of these businesses are classified as discontinued operations in the Company’s financial statements for all periods presented.
Use of estimates
The Company’s Consolidated Financial Statements have been prepared in accordance with accounting principles generally accepted in the United States. The preparation of these financial statements involves the use of estimates and assumptions by management, which affects the amounts reported in the Consolidated Financial Statements and accompanying notes. The Company bases its estimates on historical experience, current business factors, and various other assumptions believed to be reasonable under the circumstances, all of which are necessary in order to form a basis for determining the carrying values of assets and liabilities. Actual results may differ from those estimates and assumptions.
The Company’s significant estimates include those developed for:
• | Accounts receivable, returns and allowances |
• | Pension and post-retirement obligations |
• | Uncertain tax positions |
• | Inventory reserves |
• | Gross profits for book fair operations during interim periods |
• | Sales taxes |
• | Royalty advance reserves |
• | Customer reward programs |
• | Impairment testing for goodwill for assessment and measurement, intangibles and other long-lived |
assets and investments
- 46-
Summary of Significant Accounting Policies
Revenue recognition
The Company’s revenue recognition policies for its principal businesses are as follows:
School-Based Book Clubs – Revenue from school-based book clubs is recognized upon shipment of the products. For ebooks, revenue is recognized upon electronic delivery to the customer.
School-Based Book Fairs – Revenues associated with school-based book fairs are related to sales of product. Book fairs are typically run by schools and/or parent teacher organizations over a five business-day period. The amount of revenue recognized for each fair represents the net amount of cash collected at the fair. Revenue is fully recognized at the completion of the fair. At the end of reporting periods, the Company defers estimated revenue for those fairs that have not been completed as of the period end based on the number of fair days occurring after period end on a straight-line calculation of the full fair’s revenue.
Trade –Revenue from the sale of children’s books for distribution in the retail channel is primarily recognized when risks and benefits transfer to the customer, or when the product is on sale and available to the public. For newly published titles, the Company, on occasion, contractually agrees with its customers when the publication may be first offered for sale to the public, or an agreed upon “Strict Laydown Date.” For such titles, the risks and benefits of the publication are not deemed to be transferred to the customer until such time that the publication can contractually be sold to the public, and the Company defers revenue on sales of such titles until such time as the customer is permitted to sell the product to the public. Revenue for ebooks, which is the net amount received from the retailer, is recognized upon electronic delivery to the customer by the retailer.
A reserve for estimated returns is established at the time of sale and recorded as a reduction to revenue. Actual returns are charged to the reserve as received. The calculation of the reserve for estimated returns is based on historical return rates, sales patterns, type of product and expectations. Actual returns could differ from the Company’s estimate. A reserve for estimated bad debts is established at the time of sale and is based on the aging of accounts receivable and specific reserves on a customer-by-customer basis, where applicable.
Educational Technology and Services – For shipments to schools, revenue is recognized when risks and benefits transfer to the customer. Shipments to depositories are on consignment and revenue is recognized based on actual shipments from the depositories to the schools. For certain software-based products, the Company offers new customers installation, maintenance and training with these products and, in such cases, revenue is deferred and recognized as services are delivered or over the life of the contract. Revenues from contracts with multiple deliverables are recognized as each deliverable is earned, based on the relative selling price of each deliverable, provided the deliverable has value to customers on a standalone basis, the customer has full use of the deliverable and there is no further obligation from the Company. If there is a right of return, revenue is recognized if delivery of the undelivered items or services is probable and substantially in control of the Company.
Classroom and Supplemental Materials Publishing – Revenue from the sale of classroom and supplemental materials is recognized upon shipment of the products.
Film Production and Licensing – Revenue from the sale of film rights, principally for the home video and domestic and foreign television markets, is recognized when the film has been delivered and is available for showing or exploitation. Licensing revenue is recorded in accordance with royalty agreements at the time the licensed materials are available to the licensee and collections are reasonably assured.
Magazines – Revenue is deferred and recognized ratably over the subscription period, as the magazines are delivered.
Magazine Advertising – Revenue is recognized when the magazine is for sale and available to the subscribers.
Scholastic In-School Marketing – Revenue is recognized when the Company has satisfied its obligations under the program and the customer has acknowledged acceptance of the product or service. Certain revenues may be deferred pending future deliverables.
- 47-
Cash equivalents
Cash equivalents consist of short-term investments with original maturities of three months or less. The Consolidated Balance Sheets include restricted cash of $0.3 at May 31, 2014 and $1.0 at May 31, 2013, which is reported in “Other current assets.”
Accounts receivable
Accounts receivable are recorded net of allowances for doubtful accounts and reserves for returns. In the normal course of business, the Company extends credit to customers that satisfy predefined credit criteria. The Company is required to estimate the collectability of its receivables. Reserves for returns are based on historical return rates and sales patterns. In order to develop the estimate of returns that will be received subsequent to fiscal year end, management considers patterns of sales and returns in the months preceding the fiscal year end, as well as actual returns received subsequent to year end, available sell-through information and other return rate information that management believes is relevant. Allowances for doubtful accounts are established through the evaluation of accounts receivable aging and prior collection experience to estimate the ultimate collectability of these receivables. At the time the Company determines that a receivable balance, or any portion thereof, is deemed to be permanently uncollectible, the balance is then written off.
Inventories
Inventories, consisting principally of books, are stated at the lower of cost, using the first-in, first-out method, or market. The Company records a reserve for excess and obsolete inventory based upon a calculation using the historical usage rates, sales patterns of its products and specifically identified obsolete inventory.
Property, plant and equipment
Property, plant and equipment are stated at cost. Depreciation and amortization are recorded on a straight-line basis, over the estimated useful lives of the assets. Buildings have an estimated useful life, for purposes of depreciation, of forty years. Capitalized software, net of accumulated amortization, was $33.4 and $50.7 at May 31, 2014 and 2013, respectively. Capitalized software is depreciated over a period of three to seven years. Amortization expense for capitalized software was $28.8, $31.2 and $27.6 for the fiscal years ended May 31, 2014, 2013 and 2012, respectively. Furniture, fixtures and equipment are depreciated over periods not exceeding ten years. Leasehold improvements are amortized over the life of the lease or the life of the assets, whichever is shorter. The Company evaluates the depreciation periods of property, plant and equipment to determine whether events or circumstances indicate that the asset’s carrying value is not recoverable or warrant revised estimates of useful lives. In fiscal 2014, the Company recognized an impairment charge of $7.6 for assets related to Storia operating system-specific apps that will no longer be supported due to the planned transition to a Storia streaming model.
The Company acquired its headquarters space (including land, building, fixtures and related personal property and leases) at 555 Broadway, New York, NY (the "Property") from its landlord, ISE 555 Broadway, LLC ("Landlord") under a Purchase and Sale Agreement (the "Purchase Agreement") on February 28, 2014. The acquisition price under the Purchase Agreement was consideration of $255.7 (net $253.9 in cash), including closing costs. Prior to the acquisition, the Property was recorded by the Company as a capital lease. The Company recorded the difference between the purchase price and the carrying amount of the capital lease obligation as an adjustment to the carrying amount of the asset.
Leases
Lease agreements are evaluated to determine whether they are capital or operating leases. When substantially all of the risks and benefits of property ownership have been transferred to the Company, as determined by the test criteria in the current authoritative guidance, the lease is recognized as a capital lease.
Capital leases are capitalized at the lower of the net present value of the total amount of rent payable under the leasing agreement (excluding finance charges) or the fair market value of the leased asset. Capital lease assets are depreciated on a straight-line basis, over a period consistent with the Company’s normal depreciation policy for tangible fixed assets, but not exceeding the lease term. Interest charges are expensed over the period of the lease in relation to the carrying value of the capital lease obligation.
Rent expense for operating leases, which may include free rent or fixed escalation amounts in addition to minimum lease payments, is recognized on a straight-line basis over the duration of each lease term. Sublease income is recognized on a
- 48-
straight-line basis over the duration of each lease term. To the extent expected sublease income is less than expected rental payments the Company recognizes a current loss on the difference between the fair values of the sublease and the rental payments.
Prepublication costs
Prepublication costs are incurred in all of the Company’s reportable segments. Prepublication costs include costs incurred to create and develop the art, prepress, editorial, digital conversion and other content required for the creation of the master copy of a book or other media. While prepublication costs in the Children’s Book Publishing and Distribution segment are relatively modest amounts for each individual title, there are a large number of separate titles published annually. Prepublication costs in the Educational Technology and Services segment are often in excess of $1 for an individual program, as the development of intellectual property or content for complex intervention and educational programs requires significant resources and investment.
Prepublication costs are amortized on a straight-line basis over a three-to-seven-year period based on expected future revenues. The Company regularly reviews the recoverability of the capitalized costs based on expected future revenues.
Royalty advances
Royalty advances are incurred in all of the Company’s reportable segments, but are most prevalent in the Children’s Book Publishing and Distribution segment and enable the Company to obtain contractual commitments from authors to produce content. The Company regularly provides authors with advances against expected future royalty payments, often before the books are written. Upon publication and sale of the books or other media, the authors generally will not receive further royalty payments until the contractual royalties earned from sales of such books or other media exceed such advances.
Royalty advances are initially capitalized and subsequently expensed as related revenues are earned or when the Company determines future recovery through earndowns is not probable. The Company has a long history of providing authors with royalty advances, and it tracks each advance earned with respect to the sale of the related publication. The royalties earned are applied first against the remaining unearned portion of the advance. Historically, the longer the unearned portion of the advance remains outstanding, the less likely it is that the Company will recover the advance through the sale of the publication. The Company applies this historical experience to its existing outstanding royalty advances to estimate the likelihood of recoveries through earndowns. Additionally, the Company’s editorial staff regularly reviews its portfolio of royalty advances to determine if individual royalty advances are not recoverable through earndowns for discrete reasons, such as the death of an author prior to completion of a title or titles, a Company decision to not publish a title, poor market demand or other relevant factors that could impact recoverability.
Goodwill and intangible assets
Goodwill and other intangible assets with indefinite lives are not amortized and are reviewed for impairment annually or more frequently if impairment indicators arise.
With regard to goodwill, the Company compares the estimated fair values of its identified reporting units to the carrying values of their net assets. The Company first performs a qualitative assessment to determine whether it is more likely than not that the fair values of its identified reporting units are less than their carrying value. If it is more likely than not that the fair value of a reporting unit is less than its carrying amount the Company performs the two-step test. For each of the reporting units, the estimated fair value is determined utilizing the expected present value of the projected future cash flows of the units, in addition to comparisons to similar companies. The Company reviews its definition of reporting units annually or more frequently if conditions indicate that the reporting units may change. The Company evaluates its operating segments to determine if there are components one level below the operating segment. A component is present if discrete financial information is available, and segment management regularly reviews the operating results of the business. If an operating segment only contains a single component, that component is determined to be a reporting unit for goodwill impairment testing purposes. If an operating segment contains multiple components, the Company evaluates the economic characteristics of these components. Any components within an operating segment that share similar economic characteristics are aggregated and deemed to be a reporting unit for goodwill impairment testing purposes. Components within the same operating segment that do not share similar economic characteristics are deemed to be individual reporting units for goodwill impairment testing purposes. The Company has identified twelve separate reporting units for goodwill impairment testing purposes.
- 49-
With regard to other intangibles with indefinite lives, the Company determines the fair value by asset, which is then compared to its carrying value. The Company first performs a qualitative assessment to determine whether it is more likely than not that the fair value of its identified reporting unit is less than its carrying value. If it is more likely than not that the fair value of a reporting unit is less than its carrying amount the Company performs a quantitative test. The estimated fair value is determined utilizing the expected present value of the projected future cash flows of the asset, market comparables for similar businesses and other relevant information.
Intangible assets with definite lives consist principally of customer lists, covenants not to compete, and certain other intellectual property assets and are amortized over their expected useful lives. Customer lists are amortized on a straight-line basis over a five-year period, while covenants not to compete are amortized on a straight-line basis over their contractual term. Other intellectual property assets are amortized over their remaining useful lives, which range from five to twenty years.
Income taxes
The Company uses the asset and liability method of accounting for income taxes. Under this method, deferred tax assets and liabilities are determined based on differences between the financial reporting and the tax basis of assets and liabilities and are measured using enacted tax rates and laws that will be in effect when the differences are expected to enter into the determination of taxable income.
The Company believes that its taxable earnings, during the periods when the temporary differences giving rise to deferred tax assets become deductible or when tax benefit carryforwards may be utilized, should be sufficient to realize the related future income tax benefits. For those jurisdictions where the expiration date of the tax benefit carryforwards or the projected taxable earnings indicates that realization is not likely, the Company establishes a valuation allowance.
In assessing the need for a valuation allowance, the Company estimates future taxable earnings, with consideration for the feasibility of on-going tax planning strategies and the realizability of tax benefit carryforwards, to determine which deferred tax assets are more likely than not to be realized in the future. Valuation allowances related to deferred tax assets can be impacted by changes to tax laws, changes to statutory tax rates and future taxable earnings. In the event that actual results differ from these estimates in future periods, the Company may need to adjust the valuation allowance.
The Company accounts for uncertain tax positions using a two-step method. Recognition occurs when an entity concludes that a tax position, based solely on technical merits, is more likely than not to be sustained upon examination. If a tax position is more likely than not to be sustained upon examination, the amount recognized is the largest amount of benefit, determined on a cumulative probability basis, which is more likely than not to be realized upon settlement. The Company assesses all income tax positions and adjusts its reserves against these positions periodically based upon these criteria. The Company also assesses potential penalties and interest associated with these tax positions, and includes these amounts as a component of income tax expense.
In calculating the provision for income taxes on an interim basis, the Company uses an estimate of the annual effective tax rate based upon the facts and circumstances known. The Company’s effective tax rate is based on expected income and statutory tax rates and permanent differences between financial statement and tax return income applicable to the Company in the various jurisdictions in which the Company operates.
The Company assesses foreign investment levels periodically to determine if all or a portion of the Company’s investments in foreign subsidiaries are indefinitely invested. If foreign investments are not expected to be indefinitely invested, the Company provides for income taxes on the portion that is not indefinitely invested.
Non-income Taxes
The Company is subject to tax examinations for sales-based taxes. A number of these examinations are ongoing and, in certain cases, have resulted in assessments from taxing authorities. Where a sales tax liability in respect to a jurisdiction is probable and can be reliably estimated, the Company has made accruals for these matters which are reflected in the Company’s Consolidated Financial Statements. These amounts are included in the Consolidated Financial Statements in Selling, general and administrative expenses. Future developments relating to the foregoing could result in adjustments being made to these accruals. In fiscal 2012, the Company recorded accruals of $19.7 based on assessments related to sales tax audits in two jurisdictions, which resulted in payments of $15.3 in fiscal 2013.
- 50-
Unredeemed incentive credits
The Company employs incentive programs to encourage sponsor participation in its book clubs and book fairs. These programs allow the sponsors to accumulate credits which can then be redeemed for Company products or other items offered by the Company. The Company recognizes a liability for the estimated costs of providing these credits at the time of the recognition of revenue for the underlying purchases of Company product that resulted in the granting of the credits. As the credits are redeemed, such liability is reduced.
Other noncurrent liabilities
All of the rate assumptions discussed below impact the Company’s calculations of its pension and post-retirement obligations. The rates applied by the Company are based on the portfolios’ past average rates of return, discount rates and actuarial information. Any change in market performance, interest rate performance, assumed health care costs trend rate or compensation rates could result in significant changes in the Company’s pension and post-retirement obligations.
Pension obligations – Scholastic Corporation and certain of its subsidiaries have defined benefit pension plans covering the majority of their employees who meet certain eligibility requirements. The Company’s pension plans and other post-retirement benefits are accounted for using actuarial valuations.
The Company’s pension calculations are based on three primary actuarial assumptions: the discount rate, the long-term expected rate of return on plan assets, and the anticipated rate of compensation increases. The discount rate is used in the measurement of the projected, accumulated and vested benefit obligations and the interest cost component of net periodic pension costs. The long-term expected return on plan assets is used to calculate the expected earnings from the investment or reinvestment of plan assets. The anticipated rate of compensation increase is used to estimate the increase in compensation for participants of the plan from their current age to their assumed retirement age. The estimated compensation amounts are used to determine the benefit obligations and the service cost. Pension benefits in the cash balance plan for employees located in the United States are based on formulas in which the employees’ balances are credited monthly with interest based on the average rate for one-year United States Treasury Bills plus 1%. Contribution credits are based on employees’ years of service and compensation levels during their employment periods for the periods prior to June 1, 2009. In fiscal year 2014, the Company recorded a pretax settlement charge of $1.7 related to lump sum benefits paid for certain US pension obligations.
Other post-retirement benefits – The Company provides post-retirement benefits, consisting of healthcare and life insurance benefits, to eligible retired United States-based employees. The post-retirement medical plan benefits are funded on a pay-as-you-go basis, with the Company paying a portion of the premium and the employee paying the remainder. The Company calculates the existing benefit obligation, based on the discount rate and the assumed health care cost trend rate. The discount rate is used in the measurement of the projected and accumulated benefit obligations and the interest cost component of net periodic post-retirement benefit cost. The assumed health care cost trend rate is used in the measurement of the long-term expected increase in medical claims.
Foreign currency translation
The Company’s non-United States dollar-denominated assets and liabilities are translated into United States dollars at prevailing rates at the balance sheet date and the revenues, costs and expenses are translated at the weighted average rates prevailing during each reporting period. Net gains or losses resulting from the translation of the foreign financial statements and the effect of exchange rate changes on long-term intercompany balances are accumulated and charged directly to the foreign currency translation adjustment component of stockholders’ equity until such time as the operations are substantially liquidated or sold. The Company assesses foreign investment levels periodically to determine if all or a portion of the Company’s investments in foreign subsidiaries are indefinitely invested.
Shipping and handling costs
Amounts billed to customers for shipping and handling are classified as revenue. Costs incurred in shipping and handling are recognized in Cost of goods sold.
- 51-
Advertising costs
The Company incurs costs for both direct-response and non-direct-response advertising. The Company capitalizes direct-response advertising costs for expenditures, primarily in its Classroom Magazines division. The asset is amortized on a cost-pool-by-cost-pool basis over the period during which the future benefits are expected to be received. Included in Prepaid expenses and other current assets on the balance sheet is $4.6 and $4.5 of capitalized advertising costs as of May 31, 2014 and 2013, respectively. The Company expenses non-direct-response advertising costs as incurred.
Stock-based compensation
The Company recognizes the cost of services received in exchange for any stock-based awards. The Company recognizes the cost on a straight-line basis over an award’s requisite service period, which is generally the vesting period, based on the award’s fair value at the date of grant.
The fair values of stock options granted by the Company are estimated at the date of grant using the Black-Scholes option-pricing model. The Company’s determination of the fair value of stock-based payment awards using this option-pricing model is affected by the price of the Common Stock as well as by assumptions regarding highly complex and subjective variables, including, but not limited to, the expected price volatility of the Common Stock over the terms of the awards, the risk-free interest rate, and actual and projected employee stock option exercise behaviors. Estimates of fair value are not intended to predict actual future events or the value that may ultimately be realized by those who receive these awards.
Forfeitures are estimated at the time of grant and revised, if necessary, in subsequent periods, if actual forfeitures differ from those estimates, in order to derive the Company’s best estimate of awards ultimately expected to vest. In determining the estimated forfeiture rates for stock-based awards, the Company annually conducts an assessment of the actual number of equity awards that have been forfeited previously. When estimating expected forfeitures, the Company considers factors such as the type of award, the employee class and historical experience. The estimate of stock-based awards that will ultimately be forfeited requires significant judgment and, to the extent that actual results or updated estimates differ from current estimates, such amounts will be recorded as a cumulative adjustment in the period such estimates are revised.
The table set forth below provides the estimated fair value of options granted by the Company during fiscal years 2014, 2013 and 2012 and the significant weighted average assumptions used in determining such fair value under the Black-Scholes option pricing model. The average expected life represents an estimate of the period of time stock options are expected to remain outstanding based on the historical exercise behavior of the option grantees. The risk-free interest rate was based on the U.S. Treasury yield curve corresponding to the expected life in effect at the time of the grant. The volatility was estimated based on historical volatility corresponding to the expected life.
2014 | 2013 | 2012 | |||||||||
Estimated fair value of stock options granted | $ | 10.37 | $ | 9.77 | $ | 9.30 | |||||
Assumptions: | |||||||||||
Expected dividend yield | 1.7 | % | 1.6 | % | 1.4 | % | |||||
Expected stock price volatility | 38.6 | % | 37.5 | % | 36.7 | % | |||||
Risk-free interest rate | 2.2 | % | 0.9 | % | 1.6 | % | |||||
Expected life of options | 6 years | 6 years | 7 years | ||||||||
NEW ACCOUNTING PRONOUNCEMENTS
In June 2014, the Financial Accounting Standards Board (the "FASB") issued an update to the authoritative guidance related to stock compensation to resolve diverse accounting treatments of awards linked to performance targets and how to account for share-based payment awards that require a specific performance target to be achieved for employees to become eligible to vest in the awards.
The amendments require that a performance target that affects vesting, and that could be achieved after the requisite service period, be treated as a performance condition. A reporting entity should apply existing guidance as it relates to awards with performance conditions that affect vesting to account for such awards. The performance target should not be reflected in estimating the grant-date fair value of the award. Compensation cost should be recognized in the period in which it becomes probable that the performance target will be achieved and should represent the compensation cost attributable to the periods for
- 52-
which the service has already been rendered. If it becomes probable that the performance target will be achieved before the end of the requisite service period, the remaining unrecognized compensation cost should be recognized prospectively over the remaining requisite service period. The total amount of compensation should reflect the number of awards that are expected to vest and should be adjusted to reflect those awards that ultimately vest. The requisite service period ends when the employee can cease rendering service and still be eligible to vest in the award if the performance target is achieved.
The amendments in this update are effective for annual periods and interim periods within those annual periods beginning after December 15, 2015. Earlier adoption is permitted. The Company is evaluating the impact that this update will have on its consolidated financial position, results of operations and cash flows.
In May 2014, the FASB announced that it is amending the FASB Accounting Standards Codification by issuing Topic 606, Revenue from Contracts with Customers, at the same time as the International Accounting Standards Board (the "IASB") is issuing International Financial Reporting Standards 15, Revenue from Contracts with Customers. The issuance of this authoritative guidance completes the joint effort by the FASB and the IASB to clarify the principles for recognizing revenue and improve financial reporting by creating common revenue recognition guidance.
The authoritative guidance provides that an entity should recognize revenue to depict the transfer of promised goods or services to customers in an amount that reflects the consideration to which the entity expects to be entitled in exchange for those goods or services.
To achieve that core principle, an entity should apply the following steps:
• | Step 1: Identify the contract(s) with a customer. |
• | Step 2: Identify the performance obligations in the contract. |
• | Step 3: Determine the transaction price. |
• | Step 4: Allocate the transaction price to the performance obligations in the contract. |
• | Step 5: Recognize revenue when (or as) the entity satisfies a performance obligation. |
Additionally, the guidance requires improved disclosures to help users of financial statements better understand the nature, amount, timing, and uncertainty of revenue that is recognized. The update provides guidance for transactions that are not otherwise addressed comprehensively in authoritative guidance (for example, service revenue, contract modifications, and licenses of intellectual property). The amendments in this update are to be applied on a retrospective basis, utilizing one of two different methodologies. The amendments in this update are effective for annual reporting periods beginning after December 15, 2016, including interim periods within that reporting period. Early application is not permitted. The Company is evaluating the impact of this update on its consolidated financial position, results of operations and cash flows.
In April 2014, the FASB issued an update to the authoritative guidance related to the reporting of discontinued operations. The amendments in this update address the criteria for reporting discontinued operations and enhance convergence of the FASB’s and the IASB's reporting requirements for discontinued operations. The amendments revise the definition of discontinued operations by limiting discontinued operations reporting to disposals of components of an entity that represent strategic shifts that have (or will have) a major effect on an entity’s operations and financial results. The amendments also require expanded disclosures for discontinued operations. The amendments are to be applied prospectively to all disposals (or classifications as held for sale) of components of an entity that occur within annual periods beginning on or after December 15, 2014, and interim periods within those years. Early adoption is permitted, but only for disposals (or classifications as held for sale) that have not been reported in financial statements previously issued or available for issuance. The Company is evaluating the impact of this update on its consolidated financial position, results of operations and cash flows.
In July 2013, the FASB issued an update to the authoritative guidance related to the financial statement presentation of an unrecognized tax benefit when a net operating loss carryforward, a similar tax loss, or a tax credit carryforward exists to address diversity in practice in the presentation of unrecognized tax benefits. An unrecognized tax benefit, or a portion of an unrecognized tax benefit, should generally be presented in the financial statements as a reduction to a deferred tax asset for a net operating loss carryforward, a similar tax loss, or a tax credit carryforward.
2. ACQUISITIONS
On January 3, 2012, the Company acquired Learners Publishing, a Singapore-based publisher of supplemental learning materials for English-Language Learners, for $3.0, net of cash acquired. As a result of this transaction, the Company recorded
- 53-
$1.5 of goodwill. The results of operations of this business subsequent to the acquisition date are included in the International segment.
On February 8, 2012, the Company acquired the business and certain assets of Weekly Reader, a publisher of weekly educational classroom magazines designed for children in grades pre-K–12, for $2.0 in cash and $4.8 in assumed liabilities, which were fulfilled by the Company as of May 31, 2012. The Company utilized internally-developed discounted cash flow forecasts and market comparisons of royalty rates to determine the fair value of the assets acquired and the amount to be allocated to goodwill. As a result, the Company recognized $1.4 of goodwill and $5.4 of intangible assets. The results of operations of this business subsequent to the acquisition date are included in the Classroom and Supplemental Materials Publishing segment, and certain assets will benefit the Children’s Book Publishing and Distribution segment.
3. DISCONTINUED OPERATIONS
The Company continuously evaluates its portfolio of businesses for both impairment and economic viability. The Company monitors the expected cash proceeds to be realized from the disposition of discontinued operations’ assets, and adjusts asset values accordingly.
In the first quarter of fiscal 2012, the Company ceased operations in its direct-to-home catalog business specializing in toys. This business was a separate reporting unit included in the Media, Licensing and Advertising segment. The prior fiscal year loss before income taxes includes lease costs associated with a vacant facility which formerly served the Company’s direct-to-home toy catalog business.
In the fourth quarter of fiscal 2012, the Company reviewed the estimate of the fair value less cost to sell of its Maumelle facility and recognized an additional charge of $2.2. The Company used market value estimates of the property and an estimate of the anticipated costs to sell the asset. The Company subsequently sold the Maumelle facility during the fourth quarter of fiscal 2013 for approximately $5.0, recognizing a loss on the sale in the amount of $1.1.
In the fourth quarter of fiscal 2013, the Company discontinued a computer club business which was included in the Children’s Book Publishing and Distribution segment. In addition, the Company discontinued a subscription-based business which was previously reported in the Media, Licensing and Advertising segment. All of these businesses are classified as discontinued operations in the Company’s Consolidated Financial Statements.
The following table summarizes the operating results of the discontinued operations for the fiscal years ended May 31:
2014 | 2013 | 2012 | |||||||||
Revenues | $ | 0.0 | $ | 6.2 | $ | 9.8 | |||||
Gain (loss) on sale | — | (1.1 | ) | — | |||||||
Earnings (loss) before income taxes | 0.2 | (7.2 | ) | (7.2 | ) | ||||||
Income tax benefit (provision) | (0.1 | ) | 2.5 | 1.5 | |||||||
Earnings (loss) from discontinued operations, net of tax | $ | 0.1 | $ | (4.7 | ) | $ | (5.7 | ) | |||
The following table sets forth the assets and liabilities of the discontinued operations included in the Consolidated Balance Sheets of the Company as of May 31:
2014 | 2013 | ||||||
Accounts receivable, net | $ | — | $ | 0.0 | |||
Other assets | 0.4 | 0.4 | |||||
Current assets of discontinued operations | $ | 0.4 | $ | 0.4 | |||
Accrued expenses and other current liabilities | 1.1 | 1.3 | |||||
Current liabilities of discontinued operations | $ | 1.1 | $ | 1.3 | |||
- 54-
4. SEGMENT INFORMATION
The Company categorizes its businesses into five reportable segments: Children’s Book Publishing and Distribution; Educational Technology and Services; Classroom and Supplemental Materials Publishing; Media, Licensing and Advertising; and International. This classification reflects the nature of products and services consistent with the method by which the Company’s chief operating decision-maker assesses operating performance and allocates resources.
• | Children’s Book Publishing and Distribution operates as an integrated business which includes the publication and distribution of children’s books, media and interactive products in the United States through school-based book clubs and book fairs and the trade channel. This segment is comprised of three operating segments. |
• | Educational Technology and Services includes the production and distribution to schools of curriculum-based learning technology and materials for grades pre-kindergarten to 12 in the United States, together with related implementation and assessment services and school consulting services. This segment is comprised of one operating segment. |
• | Classroom and Supplemental Materials Publishing includes the publication and distribution to schools and libraries of children’s books, classroom magazines, supplemental classroom materials and print and on-line reference and non-fiction products for grades pre-kindergarten to 12 in the United States. This segment is comprised of two operating segments. |
• | Media, Licensing and Advertising includes the production and/or distribution of digital media, consumer promotions and merchandising and advertising revenue, including sponsorship programs. This segment is comprised of two operating segments. |
• | International includes the publication and distribution of products and services outside the United States by the Company’s international operations, and its export and foreign rights businesses. This segment is comprised of three operating segments. |
- 55-
The following table sets forth information for the Company’s segments for the three fiscal years ended May 31:
Children's Book Publishing & Distribution (1) | Educational Technology & Services | Classroom & Supplemental Materials Publishing | Media, Licensing & Advertising (1) | Overhead (1) (2) | Total Domestic | International | Total | ||||||||||||||||||||||||
2014 | |||||||||||||||||||||||||||||||
Revenues | $ | 873.5 | $ | 248.7 | $ | 229.6 | $ | 56.2 | $ | — | $ | 1,408.0 | $ | 414.3 | $ | 1,822.3 | |||||||||||||||
Bad debts | 2.6 | 0.9 | 1.6 | 0.1 | — | 5.2 | 3.0 | 8.2 | |||||||||||||||||||||||
Depreciation and amortization (3) | 31.9 | 28.0 | 10.5 | 5.3 | 39.0 | 114.7 | 7.1 | 121.8 | |||||||||||||||||||||||
Asset Impairments | 28.0 | — | — | — | — | 28.0 | — | 28.0 | |||||||||||||||||||||||
Segment operating income (loss) | 22.8 | 39.6 | 37.5 | (0.7 | ) | (66.9 | ) | 32.3 | 30.8 | 63.1 | |||||||||||||||||||||
Segment assets at May 31, 2014 | 371.3 | 173.7 | 166.8 | 30.7 | 532.9 | 1,275.4 | 252.7 | 1,528.1 | |||||||||||||||||||||||
Goodwill at May 31, 2014 | 40.9 | 22.7 | 65.4 | 5.4 | — | 134.4 | 10.1 | 144.5 | |||||||||||||||||||||||
Expenditures for long-lived assets including royalty advances | 43.4 | 30.7 | 10.2 | 8.1 | 269.6 | 362.0 | 11.7 | 373.7 | |||||||||||||||||||||||
Long-lived assets at May 31, 2014 | 135.3 | 119.0 | 90.1 | 14.1 | 406.1 | 764.6 | 63.6 | 828.2 | |||||||||||||||||||||||
2013 | |||||||||||||||||||||||||||||||
Revenues | $ | 846.9 | $ | 227.7 | $ | 218.0 | $ | 58.7 | $ | — | $ | 1,351.3 | $ | 441.1 | $ | 1,792.4 | |||||||||||||||
Bad debts | 1.8 | 1.1 | 1.4 | 0.1 | — | 4.4 | 2.4 | 6.8 | |||||||||||||||||||||||
Depreciation and amortization (3) | 31.5 | 22.7 | 9.4 | 3.0 | 41.6 | 108.2 | 7.2 | 115.4 | |||||||||||||||||||||||
Segment operating income (loss) | 24.5 | 29.5 | 29.6 | 4.7 | (60.2 | ) | 28.1 | 39.8 | 67.9 | ||||||||||||||||||||||
Segment assets at May 31, 2013 | 407.5 | 170.8 | 168.6 | 26.9 | 402.1 | 1,175.9 | 264.7 | 1,440.6 | |||||||||||||||||||||||
Goodwill at May 31, 2013 | 54.3 | 22.7 | 65.4 | 5.4 | — | 147.8 | 10.1 | 157.9 | |||||||||||||||||||||||
Expenditures for long-lived assets including royalty advances | 52.3 | 40.3 | 10.9 | 3.7 | 33.3 | 140.5 | 13.4 | 153.9 | |||||||||||||||||||||||
Long-lived assets at May 31, 2013 | 165.3 | 116.5 | 91.4 | 12.0 | 236.5 | 621.7 | 68.0 | 689.7 | |||||||||||||||||||||||
2012 | |||||||||||||||||||||||||||||||
Revenues | $ | 1,111.3 | $ | 254.7 | $ | 208.2 | $ | 75.3 | $ | — | $ | 1,649.5 | $ | 489.6 | $ | 2,139.1 | |||||||||||||||
Bad debts | 6.4 | 0.7 | 1.9 | 0.1 | — | 9.1 | 3.2 | 12.3 | |||||||||||||||||||||||
Depreciation and amortization (3) | 33.1 | 22.2 | 7.7 | 12.8 | 39.0 | 114.8 | 9.1 | 123.9 | |||||||||||||||||||||||
Asset Impairments | 0.5 | — | — | — | 6.2 | 6.7 | 0.3 | 7.0 | |||||||||||||||||||||||
Segment operating income (loss) | 152.2 | 49.2 | 18.3 | (4.9 | ) | (87.1 | ) | 127.7 | 57.6 | 185.3 | |||||||||||||||||||||
Segment assets at May 31, 2012 | 543.5 | 168.5 | 163.6 | 38.1 | 438.6 | 1,352.3 | 310.3 | 1,662.6 | |||||||||||||||||||||||
Goodwill at May 31, 2012 | 54.3 | 22.7 | 65.4 | 5.4 | — | 147.8 | 9.9 | 157.7 | |||||||||||||||||||||||
Expenditures for long-lived assets including royalty advances | 44.4 | 26.2 | 17.9 | 6.3 | 37.9 | 132.7 | 13.2 | 145.9 | |||||||||||||||||||||||
Long-lived assets at May 31, 2012 | 167.5 | 101.1 | 90.3 | 11.6 | 246.7 | 617.2 | 67.1 | 684.3 | |||||||||||||||||||||||
(1) | As discussed in Note 3, “Discontinued Operations,” the Company closed or sold several operations during the first quarter of fiscal 2012 and the fourth quarter of fiscal 2013. All of these businesses are classified as discontinued operations in the Company’s financial statements and, as such, are not reflected in this table. |
(2) | Overhead includes all domestic corporate amounts not allocated to segments, including expenses and costs related to the management of corporate assets. Unallocated assets are principally comprised of deferred income taxes and property, plant and equipment related to the Company’s headquarters in the metropolitan New York area, its fulfillment and distribution facilities located in Missouri and its facility located in Connecticut. Overhead also includes amounts previously allocated to the Media, Licensing and Advertising segment for the Company’s direct-to-home toy catalog business that was discontinued in the first quarter of fiscal 2012 and amounts previously allocated to |
- 56-
the Children’s Book Publishing and Distribution segment for the computer club business that was discontinued in the fourth quarter of fiscal 2013.
(3) | Includes depreciation of property, plant and equipment and amortization of intangible assets and prepublication and production costs. |
5. DEBT
The following table summarizes debt as of May 31:
Carrying Value | Fair Value | Carrying Value | Fair Value | ||||||||||||
2014 | 2013 | ||||||||||||||
Loan Agreement: | |||||||||||||||
Revolving Loan (interest rate of 1.3%) | $ | 120.0 | $ | 120.0 | $ | — | $ | — | |||||||
Unsecured Lines of Credit (weighted average interest rates of 2.3% and 9.0%, respectively) | $ | 15.8 | $ | 15.8 | $ | 2.0 | $ | 2.0 | |||||||
Total debt | $ | 135.8 | $ | 135.8 | $ | 2.0 | $ | 2.0 | |||||||
Less lines of credit and current portion of long-term debt | (15.8 | ) | (15.8 | ) | (2.0 | ) | (2.0 | ) | |||||||
Total long-term debt | $ | 120.0 | $ | 120.0 | $ | — | $ | — | |||||||
The short-term debt’s carrying value approximates its fair value. The fair values of the 5% Notes were estimated based on market quotes, where available, or dealer quotes.
The following table sets forth the maturities of the carrying values of the Company’s debt obligations as of May 31, 2014 for the fiscal years ending May 31:
2015 | $ | 15.8 | |
2016 | — | ||
2017 | — | ||
2018 | 120.0 | ||
2019 | — | ||
Thereafter | — | ||
Total debt | $ | 135.8 | |
Loan Agreement
Scholastic Corporation and Scholastic Inc. (each, a “Borrower” and together, the “Borrowers”) are parties to a $425.0 credit facility with certain banks (as amended, the “Loan Agreement”), which allows the Company to borrow, repay or prepay and reborrow at any time prior to the December 5, 2017 maturity date. Under the Loan Agreement, interest on amounts borrowed thereunder is due and payable in arrears on the last day of the interest period (defined as the period commencing on the date of the advance and ending on the last day of the period selected by the Borrower at the time each advance is made). The interest pricing under the Loan Agreement is dependent upon the Borrower’s election of a rate that is either:
• | A Base Rate equal to the higher of (i) the prime rate, (ii) the prevailing Federal Funds rate plus 0.500% or (iii) the Eurodollar Rate for a one month interest period plus 1% plus, in each case, an applicable spread ranging from 0.18% to 0.60%, as determined by the Company’s prevailing consolidated debt to total capital ratio. |
-or-
• | A Eurodollar Rate equal to the London interbank offered rate (LIBOR) plus an applicable spread ranging from 1.18% to 1.60%, as determined by the Company’s prevailing consolidated debt to total capital ratio. |
As of May 31, 2014, the indicated spread on Base Rate Advances was 0.18% and the indicated spread on Eurodollar Rate Advances was 1.18%, both based on the Company’s prevailing consolidated debt to total capital ratio.
- 57-
The Loan Agreement also provides for the payment of a facility fee ranging from 0.20% to 0.40% per annum based upon the Company’s prevailing consolidated debt to total capital ratio. At May 31, 2014, the facility fee rate was 0.20%.
As of May 31, 2014, the Company’s outstanding borrowings under the Loan Agreement totaled $120.0. The Company incurred this obligation in the third quarter of fiscal 2014 to partially finance the purchase of the land and building comprising a previously leased property at 555 Broadway in New York City. While this obligation is not due until the December 5, 2017 maturity date, the Company may, from time to time, make payments to reduce this obligation when cash from operations becomes available for this purpose.
No borrowings were outstanding under the Loan Agreement as of May 31, 2013.
At May 31, 2014, the Company had open standby letters of credit totaling $5.3 issued under certain credit lines, including $0.4 under the Loan Agreement discussed above and $4.9 under the domestic credit lines discussed below. A $1.0 standby letter of credit under the Loan Agreement was canceled on February 28, 2014 due to the purchase of the building mentioned above. These letters of credit are scheduled to expire within one year; however, the Company expects that substantially all of these letters of credit will be renewed, at similar terms, prior to expiration.
The Loan Agreement contains certain covenants, including interest coverage and leverage ratio tests and certain limitations on the amount of dividends and other distributions, and at May 31, 2014, the Company was in compliance with these covenants.
Lines of Credit
As of May 31, 2014, the Company’s domestic credit lines available under unsecured money market bid rate credit lines totaled $5.1. There was $10.0 of outstanding borrowings under these credit lines at May 31, 2014, and no outstanding borrowings as of May 31, 2013. The weighted average interest rate on these outstanding borrowings is 1.2%. All loans made under these credit lines are at the sole discretion of the lender and at an interest rate and term agreed to at the time each loan is made, but not to exceed 365 days. These credit lines may be renewed, if requested by the Company, at the option of the lender.
As of May 31, 2014, the Company had various local currency credit lines, with maximum available borrowings in amounts equivalent to $34.6, underwritten by banks primarily in the United States, Canada and the United Kingdom. These credit lines are typically available for overdraft borrowings or loans up to 364 days and may be renewed, if requested by the Company, at the sole option of the lender. There were borrowings outstanding under these facilities equivalent to $5.8 at May 31, 2014 at a weighted average interest rate of 4.3%, compared to borrowings outstanding equivalent to $2.0 at May 31, 2013 at a weighted average interest rate of 9.0%.
5% Notes due 2013
In April 2003, Scholastic Corporation issued $175.0 of 5% Notes due April 2013 (the “5% Notes”). The Company amended its existing Loan Agreement, which was scheduled to mature on June 1, 2014, to extend the maturity date to December 5, 2017, and on April 15, 2013, the Company drew under the Loan Agreement to satisfy its obligations to fully repay the 5% Notes. As of May 31, 2013, the Company had fully paid down its borrowing under the Loan Agreement.
6. COMMITMENTS AND CONTINGENCIES
Lease obligations
The Company leases warehouse space, office space and equipment under various capital and operating leases over periods ranging from one to forty years. Certain of these leases provide for scheduled rent increases based on price-level factors. The Company generally does not enter into leases that call for contingent rent. In most cases, the Company expects that, in the normal course of business, leases will be renewed or replaced. Net rent expense relating to the Company’s non-cancelable operating leases for the three fiscal years ended May 31, 2014, 2013 and 2012 was $27.6, $32.9 and $38.9, respectively.
Amortization of assets under capital leases covering land, buildings and equipment was $0.8, $1.1 and $1.1 for the fiscal years ended May 31, 2014, 2013 and 2012, respectively, and is included in Depreciation and amortization expense.
- 58-
The following table sets forth the composition of capital leases reflected as Property, plant and equipment in the Consolidated Balance Sheets at May 31:
2014 | 2013 | ||||||
Land | $ | — | $ | — | |||
Buildings | — | 39.0 | |||||
Equipment | 0.0 | 1.0 | |||||
0.0 | 40.0 | ||||||
Accumulated amortization | 0.0 | (13.4 | ) | ||||
Total | $ | 0.0 | $ | 26.6 | |||
The following table sets forth the aggregate minimum future annual rental commitments at May 31, 2014 under all non-cancelable leases for the fiscal years ending May 31:
Operating Leases | Capital Leases | ||||||
2015 | $ | 32.1 | $ | 0.0 | |||
2016 | 25.7 | — | |||||
2017 | 19.2 | — | |||||
2018 | 14.5 | — | |||||
2019 | 8.1 | — | |||||
Thereafter | 14.1 | — | |||||
Total minimum lease payments | $ | 113.7 | $ | 0.0 | |||
Less minimum sublease income to be received | $ | 69.9 | $ | — | |||
Minimum lease payments, net of sublease income | $ | 43.8 | $ | 0.0 | |||
Less amount representing interest | 0.0 | ||||||
Present value of net minimum capital lease payments | 0.0 | ||||||
Less current maturities of capital lease obligations | — | ||||||
Long-term capital lease obligations | $ | 0.0 | |||||
Other Commitments
The following table sets forth the aggregate minimum future contractual commitments at May 31, 2014 relating to royalty advances and minimum print quantities for the fiscal years ending May 31:
Royalty Advances | Minimum Print Quantities | ||||||
2015 | $ | 10.4 | $ | 47.6 | |||
2016 | 2.7 | 48.3 | |||||
2017 | 0.9 | 44.8 | |||||
2018 | 0.8 | 45.5 | |||||
2019 | 0.0 | 46.3 | |||||
Thereafter | — | 143.4 | |||||
Total commitments | $ | 14.8 | $ | 375.9 | |||
The Company had open standby letters of credit of $5.3 and $6.6 issued under certain credit lines as of May 31, 2014 and 2013, respectively. These letters of credit are scheduled to expire within one year; however, the Company expects that substantially all of these letters of credit will be renewed, at similar terms, prior to expiration.
Contingencies
Various claims and lawsuits arising in the normal course of business are pending against the Company. The Company accrues a liability for such matters when it is probable that a liability has occurred and the amount of such liability can be reasonably estimated. When only a range can be estimated, the most probable amount in the range is accrued unless no amount within the range is a better estimate than any other amount, in which case the minimum amount in the range is accrued. Legal costs associated with litigation loss contingencies are expensed in the period in which they are incurred. The Company does not
- 59-
expect, in the case of those various claims and lawsuits arising in the normal course of business where a loss is considered probable or reasonably possible, that the reasonably possible losses from such claims and lawsuits (either individually or in the aggregate) would have a material adverse effect on the Company’s consolidated financial position or results of operations.
Grolier Limited is an indirect subsidiary of Scholastic Corporation, located in the United Kingdom, which ceased operations in fiscal 2008 and the operations of which are included in discontinued operations. The Company is currently in the process of settling a Grolier Limited pension plan in effect at the time it ceased operations and is evaluating the potential pension liabilities under the plan relating to the status of the plan as a defined contribution or a defined benefit plan in the context of the conversion of the plan from a defined benefit to a defined contribution plan in 1986. Based on the information currently available to it, the Company does not expect to incur any additional material liability in resolving this issue and settling the plan.
7. INVESTMENTS
Included in the Other assets and deferred charges section of the Company’s Consolidated Balance Sheets were investments of $18.4 and $19.6 at May 31, 2014 and May 31, 2013, respectively.
In the first quarter of fiscal 2014, the Company acquired a 20% interest in a software development business for $1.0 in cash,
which was accounted for using the equity method of accounting. The investment was determined to be other than temporarily impaired in the fourth quarter of fiscal 2014, and the Company recognized a loss of $1.0.
The Company owns a 15.0% non-controlling interest in a book distribution business located in the UK, which is accounted for as a cost-basis investment. A decline in results for this operation in the last quarter of the fiscal year ended December 31, 2013
led management to determine that this investment was other than temporarily impaired as of February 28, 2014. Accordingly, the Company recognized a loss of $4.8 in respect of this investment in the fiscal year ended May 31, 2014.
The Company’s 26.2% non-controlling interest in a children’s book publishing business located in the UK is accounted for using the equity method of accounting. The net value of this investment at May 31, 2014 was $18.3. The Company received $1.0 of dividends in fiscal 2014 from this investment.
Income from equity investments totaled $2.6 for the year ended May 31, 2014, $2.3 for the year ended May 31, 2013 and $2.6 for the year ended May 31, 2012.
The following table summarizes the Company’s investments as of May 31:
2014 | 2013 | ||||||
Cost method investments: | |||||||
UK-based | $ | — | $ | 5.0 | |||
Total cost method investments | $ | — | $ | 5.0 | |||
Equity method investments: | |||||||
UK-based | $ | 18.3 | $ | 14.6 | |||
Other | 0.1 | 0.0 | |||||
Total equity method investments | $ | 18.4 | $ | 14.6 | |||
Total | $ | 18.4 | $ | 19.6 | |||
8. GOODWILL AND OTHER INTANGIBLES
In fiscal 2014, the Company recognized an impairment of $13.4 of goodwill associated with the book clubs reporting unit in the Children’s Book Publishing and Distribution segment. In the second quarter of fiscal 2014, expected revenues for the reporting unit declined, resulting in an impairment indicator. Revenues in the first quarter were not significant for this reporting unit as schools are not in session. As of November 30, 2013, the fair value of the reporting unit was approximately $13.0 less than the carrying value of $66.9. The Company used forecasted cash flows, which were adjusted from those used in the latest annual valuation to reflect the revised outlook for the reporting unit, in determining its fair value. Management revised its outlook for the reporting unit as revenues did not meet expectations during the period, and future revenue expectations were revised consistent with the current period decline. A discount rate of 15.5% and a perpetual growth rate of 3.0% were employed for the discounted cash flow analysis . The reporting unit is dependent upon internally developed intangible assets including trade
- 60-
names and customer lists which have no carrying value, but have substantial fair value. In the third quarter of fiscal 2014, the Company completed step two of the goodwill impairment process, and determined that the fair value of the reporting unit's inventory and internally developed intangible assets rendered 100% of the goodwill impaired, consistent with the Company's initial estimates.
The following table summarizes the activity in Goodwill for the fiscal years ended May 31:
2014 | 2013 | ||||||
Gross beginning balance | $ | 178.7 | $ | 178.5 | |||
Accumulated impairment | (20.8 | ) | (20.8 | ) | |||
Beginning balance | 157.9 | 157.7 | |||||
Impairment charge | (13.4 | ) | — | ||||
Foreign currency translation | 0.0 | 0.0 | |||||
Other | — | 0.2 | |||||
Gross ending balance | 178.7 | 178.7 | |||||
Accumulated impairment | (34.2 | ) | (20.8 | ) | |||
Ending balance | $ | 144.5 | $ | 157.9 | |||
The following table summarizes Other intangibles as of May 31:
2014 | 2013 | ||||||
Beginning balance-Customer lists | $ | 3.4 | $ | 4.3 | |||
Additions due to acquisition | — | 0.1 | |||||
Amortization expense | (1.0 | ) | (1.0 | ) | |||
Foreign currency translation | 0.0 | 0.0 | |||||
Customer lists, net of accumulated amortization of $3.3 and $2.3, respectively | $ | 2.4 | $ | 3.4 | |||
Beginning balance-Other intangibles | $ | 9.2 | $ | 10.4 | |||
Additions due to acquisition | — | 0.2 | |||||
Amortization expense | (1.4 | ) | (1.5 | ) | |||
Other | (0.2 | ) | 0.1 | ||||
Other intangibles, net of accumulated amortization of $13.4 and $12.0, respectively | $ | 7.6 | $ | 9.2 | |||
Total other intangibles subject to amortization | $ | 10.0 | $ | 12.6 | |||
Trademarks and other | $ | 2.2 | $ | 2.0 | |||
Total other intangibles not subject to amortization | $ | 2.2 | $ | 2.0 | |||
Total other intangibles | $ | 12.2 | $ | 14.6 | |||
Amortization expense for Other intangibles totaled $2.4, $2.5 and $6.5 for the fiscal years ended May 31, 2014, 2013 and 2012, respectively.
The following table reflects the estimated amortization expense for intangibles for the next five fiscal years ending May 31:
2015 | $ | 2.3 | |
2016 | 2.2 | ||
2017 | 2.2 | ||
2018 | 0.5 | ||
2019 | 0.4 | ||
Intangible assets with definite lives consist principally of customer lists, covenants not to compete and trademarks. Intangible assets with definite lives are amortized over their estimated useful lives. The weighted-average remaining useful lives of all amortizable intangible assets is approximately 7 years.
- 61-
9. TAXES
The components of earnings from continuing operations before income taxes for the fiscal years ended May 31 are:
2014 | 2013 | 2012 | |||||||||
United States | $ | 43.5 | $ | 34.6 | $ | 145.4 | |||||
Non-United States | 6.9 | 18.8 | 24.3 | ||||||||
Total | $ | 50.4 | $ | 53.4 | $ | 169.7 | |||||
The provision for income taxes from continuing operations for the fiscal years ended May 31 consists of the following components:
2014 | 2013 | 2012 | |||||||||
Federal | |||||||||||
Current | $ | 6.5 | $ | 4.5 | $ | 49.1 | |||||
Deferred | (8.2 | ) | 2.4 | (8.2 | ) | ||||||
$ | (1.7 | ) | $ | 6.9 | $ | 40.9 | |||||
State and local | |||||||||||
Current | $ | 6.8 | $ | 0.5 | $ | 12.0 | |||||
Deferred | (2.6 | ) | 2.2 | (0.7 | ) | ||||||
$ | 4.2 | $ | 2.7 | $ | 11.3 | ||||||
Non-United States | |||||||||||
Current | $ | 5.8 | $ | 7.8 | $ | 12.8 | |||||
Deferred | (2.2 | ) | 0.2 | (3.4 | ) | ||||||
$ | 3.6 | $ | 8.0 | $ | 9.4 | ||||||
Total | |||||||||||
Current | $ | 19.1 | $ | 12.8 | $ | 73.9 | |||||
Deferred | (13.0 | ) | 4.8 | (12.3 | ) | ||||||
$ | 6.1 | $ | 17.6 | $ | 61.6 | ||||||
Effective Tax Rate Reconciliation
A reconciliation of the significant differences between the effective income tax rate and the federal statutory rate on earnings from continuing operations before income taxes for the fiscal years ended May 31 is as follows:
2014 | 2013 | 2012 | |||||||||
Computed federal statutory provision | 35.0 | % | 35.0 | % | 35.0 | % | |||||
State income tax provision, net of federal income tax benefit | 3.6 | % | 3.3 | % | 4.3 | % | |||||
Difference in effective tax rates on earnings of foreign subsidiaries | 3.7 | % | 0.3 | % | 0.2 | % | |||||
Charitable contributions | -1.1 | % | -4.4 | % | -0.7 | % | |||||
Tax credits | -0.3 | % | -0.4 | % | -0.1 | % | |||||
Valuation allowances | 0.7 | % | 2.4 | % | -1.4 | % | |||||
Uncertain Positions | -27.1 | % | — | % | — | % | |||||
Other - net | -2.4 | % | -3.2 | % | -1.0 | % | |||||
Effective tax rates | 12.1 | % | 33.0 | % | 36.3 | % | |||||
Total provision for income taxes | $ | 6.1 | $ | 17.6 | $ | 61.6 | |||||
The tax provision for the fiscal year ended May 31, 2014 was favorably impacted by a settlement with the Internal Revenue Service. During the third quarter of fiscal 2014, the Company reached a settlement with the Internal Revenue Service for fiscal years ended May 31, 2007, 2008 and 2009, and the Company recognized previously unrecognized tax benefits of $13.8, inclusive of interest, as a result of this settlement.
- 62-
Unremitted Earnings
At May 31, 2014, the Company had not provided U.S. income taxes on accumulated but undistributed earnings of its non-U.S. subsidiaries of approximately $73.6 to the extent that such earnings are expected to be indefinitely reinvested. In the current fiscal year, the Company provided U.S. deferred income taxes on $2.0 of undistributed earnings. However, if any portion were to be distributed, the related U.S. tax liability may be reduced by foreign income taxes paid on those earnings. Determining the unrecognized deferred tax liability related to those investments in these non-U.S. subsidiaries is not practicable. The Company assesses foreign investment levels periodically to determine if all or a portion of the Company’s investments in foreign subsidiaries are indefinitely invested.
Deferred Taxes
The significant components for deferred income taxes for the fiscal years ended May 31, including deferred income taxes related to discontinued operations, are as follows:
2014 | 2013 | ||||||
Deferred tax assets | |||||||
Tax uniform capitalization | $ | 26.6 | $ | 25.8 | |||
Inventory reserves | 29.5 | 29.2 | |||||
Allowance for doubtful accounts | 4.9 | 5.4 | |||||
Other reserves | 26.4 | 26.3 | |||||
Post-retirement, post-employment and pension obligations | 15.5 | 12.6 | |||||
Tax carryforwards | 33.4 | 47.8 | |||||
Lease accounting | (0.3 | ) | 11.7 | ||||
Other - net | 20.4 | 32.7 | |||||
Gross deferred tax assets | 156.4 | 191.5 | |||||
Valuation allowance | (30.0 | ) | (31.9 | ) | |||
Total deferred tax assets | $ | 126.4 | $ | 159.6 | |||
Deferred tax liabilities | |||||||
Prepaid expenses | (1.0 | ) | (0.5 | ) | |||
Depreciation and amortization | (40.3 | ) | (65.0 | ) | |||
Total deferred tax liability | $ | (41.3 | ) | $ | (65.5 | ) | |
Total net deferred tax assets | $ | 85.1 | $ | 94.1 | |||
Total net deferred tax assets of $85.1 at May 31, 2014 and $94.1 at May 31, 2013 include $81.0 and $79.2, respectively, in current assets. Total noncurrent deferred tax assets of $4.1 and $14.9 are reflected in noncurrent assets at May 31, 2014 and 2013, respectively.
For the year ended May 31, 2014, the valuation allowance decreased by $1.9 and for the year ended May 31, 2013, the valuation allowance decreased by $2.5. The valuation allowance is based on the Company’s assessment that it is more likely than not that certain deferred tax assets will not be realized in the foreseeable future. The valuation allowance at May 31, 2014 primarily relates to foreign operating loss carryforwards of $109.6, principally in the UK, which do not expire. The benefits of uncertain tax positions are recorded in the financial statements only after determining a more likely-than-not probability that the uncertain tax positions will withstand challenge, if any, from taxing authorities, in which case such benefits are included in long-term income taxes payable, reduced by the associated federal deduction for state taxes and non-U.S. tax credits, and may also include other long-term tax liabilities that are not uncertain but have not yet been paid. The interest and penalties related to these uncertain tax positions are recorded as part of the Company’s income tax expense and constitute part of the income tax liability on the Company’s Consolidated Balance Sheets.
The total amount of unrecognized tax benefits at May 31, 2014, 2013 and 2012 were $14.4, excluding $1.1 accrued for interest and penalties, $35.5, excluding $6.5 accrued for interest and penalties, and $38.7, excluding $7.1 for accrued interest and penalties, respectively. Of the total amount of unrecognized tax benefits at May 31, 2014, 2013 and 2012, $11.7, $21.8 and $18.1, respectively, would impact the Company’s effective tax rate.
- 63-
During the years presented, the Company recognized interest and penalties related to unrecognized tax benefits in the provision for taxes in the Consolidated Financial Statements. The Company recognized benefits of $5.3 and $0.5 and an expense of $2.4 for the years ended May 31, 2014, 2013 and 2012, respectively.
A reconciliation of the unrecognized tax benefits for the fiscal years ended May 31 is as follows:
Gross unrecognized benefits at May 31, 2011 | $ | 30.8 | |
Decreases related to prior year tax positions | (0.8 | ) | |
Increase related to prior year tax positions | 9.5 | ||
Increases related to current year tax positions | 1.7 | ||
Settlements during the period | (2.4 | ) | |
Lapse of statute of limitation | (0.1 | ) | |
Gross unrecognized benefits at May 31, 2012 | $ | 38.7 | |
Decreases related to prior year tax positions | (7.2 | ) | |
Increase related to prior year tax positions | 3.5 | ||
Increases related to current year tax positions | 1.0 | ||
Settlements during the period | (0.5 | ) | |
Lapse of statute of limitation | — | ||
Gross unrecognized benefits at May 31, 2013 | $ | 35.5 | |
Decreases related to prior year tax positions | (20.4 | ) | |
Increase related to prior year tax positions | 2.8 | ||
Increases related to current year tax positions | 2.6 | ||
Settlements during the period | (1.8 | ) | |
Lapse of statute of limitation | (4.3 | ) | |
Gross unrecognized benefits at May 31, 2014 | $ | 14.4 | |
Unrecognized tax benefits for the Company decreased by $21.1 and $3.2 for the years ended May 31, 2014 and 2013, respectively. Although the timing of the resolution and/or closure on audits is highly uncertain, it is reasonably possible that the balance of gross unrecognized tax benefits could significantly change in the next twelve months. However, given the number of years remaining subject to examination and the number of matters being examined, the Company is unable to estimate the full range of possible adjustments to the balance of gross unrecognized tax benefits.
The Company, including subsidiaries, files income tax returns in the U.S., various states and various foreign jurisdictions. The Company is routinely audited by various tax authorities. The Company is currently under audit by the Internal Revenue Service for its fiscal years ended May 31, 2011 and 2012. The Company is currently under audit by New York State for its fiscal years ended May 31, 2009, 2010, 2011, and 2012 and New York City for its fiscal years ended May 31, 2008, 2009 and 2010. If any of these tax examinations are concluded within the next twelve months, the Company will make any necessary adjustments to its unrecognized tax benefits.
Non-income Taxes
The Company is subject to tax examinations for sales-based taxes. A number of these examinations are ongoing and, in certain cases, have resulted in assessments from taxing authorities. Where a sales tax liability in respect to a jurisdiction is probable and can be reliably estimated for such jurisdiction, the Company has made accruals for these matters which are reflected in the Company’s Consolidated Financial Statements. These amounts are included in the Consolidated Financial Statements in Selling, general and administrative expenses. Future developments relating to the foregoing could result in adjustments being made to these accruals.
- 64-
10. CAPITAL STOCK AND STOCK-BASED AWARDS
Class A Stock and Common Stock
Capital stock consisted of the following as of May 31, 2014:
Class A Stock | Common Stock | Preferred Stock | ||||||
Authorized | 4,000,000 | 70,000,000 | 2,000,000 | |||||
Reserved for Issuance | 1,499,000 | 7,245,021 | — | |||||
Outstanding | 1,656,200 | 30,605,978 | — | |||||
The only voting rights vested in the holders of Common Stock, except as required by law, are the election of such number of directors as shall equal at least one-fifth of the members of the Board. The Class A Stockholders are entitled to elect all other directors and to vote on all other matters. The Class A Stockholders and the holders of Common Stock are entitled to one vote per share on matters on which they are entitled to vote. The Class A Stockholders have the right, at their option, to convert shares of Class A Stock into shares of Common Stock on a share-for-share basis. With the exception of voting rights and conversion rights, and as to any rights of holders of Preferred Stock if issued, the Class A Stock and the Common Stock are equal in rank and are entitled to dividends and distributions, when and if declared by the Board.
Preferred Stock
The Preferred Stock may be issued in one or more series, with the rights of each series, including voting rights, to be determined by the Board before each issuance. To date, no shares of Preferred Stock have been issued.
Stock-based awards
At May 31, 2014, the Company maintained three stockholder-approved stock-based compensation plans with regard to the Common Stock: the Scholastic Corporation 1995 Stock Option Plan (the “1995 Plan”), under which no further awards can be made; the Scholastic Corporation 2001 Stock Incentive Plan (the “2001 Plan”), under which no further awards can be made; and the Scholastic Corporation 2011 Stock Incentive Plan (the “2011 Plan”). The 2011 Plan was adopted in July 2011 and provides for the issuance of incentive stock options; options that are not so qualified, called non-qualified stock options; restricted stock; and other stock-based awards.
The Company’s stock-based compensation vests over periods not exceeding four years. Provisions in the Company’s stock-based compensation plans allow for the acceleration of vesting for certain retirement-eligible employees, as well as in certain other events.
Stock Options – At May 31, 2014, non-qualified stock options to purchase 161,500 shares, 1,135,360 shares and 1,300,640 shares of Common Stock were outstanding under the 1995 Plan, the 2001 Plan and the 2011 Plan, respectively. During fiscal 2014, 753,720 options were granted under the 2011 Plan at a weighted average exercise price of $30.11.
At May 31, 2014, 464,873 shares of Common Stock were available for additional awards under the 2011 Plan.
The Company also maintains the 1997 Outside Directors Stock Option Plan (the “1997 Directors Plan”), a stockholder-approved stock option plan for outside directors under which no further awards may be made. The 1997 Directors Plan, as amended, provided for the automatic grant to each non-employee director on the date of each annual stockholders’ meeting of non-qualified stock options to purchase 6,000 shares of Common Stock. At May 31, 2014, options to purchase 96,000 shares of Common Stock were outstanding under the 1997 Directors Plan.
In September 2007, the Corporation adopted the stockholder-approved Scholastic Corporation 2007 Outside Directors Stock Incentive Plan (the “2007 Directors Plan”). From September 2007 through September 2011, the 2007 Directors Plan provided for the automatic grant to each non-employee director, on the date of each annual meeting of stockholders, of non-qualified stock options to purchase 3,000 shares of Common Stock at a purchase price per share equal to the fair market value of a share of Common Stock on the date of grant and 1,200 restricted stock units. In July 2012, the Board approved an amended and restated 2007 Outside Directors stock incentive Plan (the “Amended 2007 Directors Plan”), which was approved by the stockholders in September 2012. The Amended 2007 Directors Plan provides for the automatic grant to each non-employee director, on the date of each annual meeting of stockholders, of stock options and restricted stock units with a value equal to a
- 65-
fixed dollar amount. Such dollar amount, as well as the split of such amount between stock options and restricted stock units, will be determined annually by the Board (or committee designated by the Board) in advance of the grant date. The value of the stock option portion of the annual grant is determined based on the Black-Scholes option pricing method, with the exercise price being the fair market value of the Common Stock on the grant date, and the value of the restricted stock unit portion is the fair market value of the Common Stock on the grant date. In September 2013, stock options and restricted stock units with a value of $70,000 for each non-employee director, with 40% of such value in the form of options and 60% in the form of restricted stock units, were approved, and an aggregate of 24,714 options at an exercise price of $30.56 per share and 12,366 restricted stock units were granted to the non-employee directors under the amended 2007 Directors Plan.
As of May 31, 2014, 162,867 options were outstanding under the Amended 2007 Directors Plan and 274,391 shares of Common Stock remained available for additional awards under the Amended 2007 Directors Plan.
The Scholastic Corporation 2004 Class A Stock Incentive Plan (the “Class A Plan”) provided for the grant to Richard Robinson, the Chief Executive Officer of the Corporation as of the effective date of the Class A Plan, of options to purchase Class A Stock (the “Class A Options”). As of May 31, 2014, there were 1,499,000 Class A Options granted to Mr. Robinson outstanding under the Class A Plan, and no shares of Class A Stock remained available for additional awards under the Class A Plan.
Generally, options granted under the various plans may not be exercised for a minimum of one year after the date of grant and expire approximately ten years after the date of grant. The intrinsic value of these stock options is deductible by the Company for tax purposes upon exercise. The Company amortizes the fair value of stock options as stock-based compensation expense over the requisite service period on a straight-line basis, or sooner if the employee effectively vests upon termination of employment under certain circumstances.
The following table sets forth the intrinsic value of stock options exercised, pretax stock-based compensation cost and related tax benefits for the Class A Stock and Common Stock plans for the fiscal years ended May 31:
2014 | 2013 | 2012 | |||||||||
Total intrinsic value of stock options exercised | $ | 4.6 | $ | 2.3 | $ | 5.0 | |||||
Stock-based compensation cost (pretax) | $ | 9.3 | $ | 6.3 | $ | 12.2 | |||||
Tax benefits related to stock-based compensation cost | $ | 1.7 | $ | 0.8 | $ | 1.8 | |||||
Weighted average grant date fair value per option | $ | 10.37 | $ | 9.77 | $ | 9.30 | |||||
As of May 31, 2014, the total pretax compensation cost not yet recognized by the Company with regard to outstanding unvested stock options was $3.3. The weighted average period over which this compensation cost is expected to be recognized is 2.3 years.
The following table sets forth the stock option activity for the Class A Stock and Common Stock plans for the fiscal year ended May 31, 2014:
Options | Weighted Average Exercise Price | Average Remaining Contractual Term (in years) | Aggregate Intrinsic Value | |||||||||
Outstanding at May 31, 2013 | 4,185,480 | $ | 29.49 | |||||||||
Granted | 778,434 | $ | 30.12 | |||||||||
Exercised | (506,380 | ) | $ | 23.94 | ||||||||
Expired | (41,000 | ) | $ | 31.43 | ||||||||
Cancellations and forfeitures | (61,167 | ) | $ | 28.82 | ||||||||
Outstanding at May 31, 2014 | 4,355,367 | $ | 30.23 | 4.8 | $ | 12.3 | ||||||
Exercisable at May 31, 2014 | 3,156,844 | $ | 30.70 | 3.3 | $ | 8.8 | ||||||
Restricted Stock Units – In addition to stock options, the Company has issued restricted stock units to certain officers and key executives under the 2011 Plan (“RSUs”). The RSUs automatically convert to shares of Common Stock on a one-for-one basis as the award vests, which is typically over a four-year period beginning thirteen months from the grant date and thereafter annually on the anniversary of the grant date. There were 121,860 shares of Common Stock issued upon vesting of RSUs during fiscal 2014. The Company measures the value of RSUs at fair value based on the number of RSUs granted and the price of the underlying Common Stock on the grant date. The Company amortizes the fair value of outstanding Stock Units as stock-
- 66-
based compensation expense over the requisite service period on a straight-line basis, or sooner if the employee effectively vests upon termination of employment under certain circumstances.
The following table sets forth the RSU award activity for the fiscal years ended May 31:
2014 | 2013 | 2012 | |||||||||
RSUs granted | 67,670 | 125,584 | 205,620 | ||||||||
Weighted average grant date price per unit | $ | 30.34 | $ | 23.05 | $ | 27.92 | |||||
As of May 31, 2014, the total pretax compensation cost not yet recognized by the Company with regard to unvested RSUs was $2.5. The weighted average period over which this compensation cost is expected to be recognized is 1.9 years.
Management Stock Purchase Plan - The Company maintains a Management Stock Purchase Plan (“MSPP”), which allows certain members of senior management to defer up to 100% of their annual cash bonus payments in the form of restricted stock units (“MSPP Stock Units”) which are purchased by the employee at a 25% discount from the lowest closing price of the Common Stock on NASDAQ on any day during the fiscal quarter in which such bonuses are payable. The MSPP Stock Units are converted into shares of Common Stock on a one-for-one basis at the end of the applicable deferral period. The Company measures the value of MSPP Stock Units based on the number of awards granted and the price of the underlying Common Stock on the grant date, giving effect to the 25% discount. The Company amortizes this discount as stock-based compensation expense over the vesting term on a straight-line basis, or sooner if the employee effectively vests upon termination of employment under certain circumstances.
The following table sets forth the MSPP Stock Unit activity for the fiscal years ended May 31:
2014 | 2013 | ||||||
MSPP Stock Units allocated | 827 | 87,317 | |||||
Purchase price per unit | $ | 21.15 | $ | 19.73 | |||
At May 31, 2014, there were 331,453 shares of Common Stock remaining authorized for issuance under the MSPP.
As of May 31, 2014, the total pretax compensation cost not yet recognized by the Company with regard to unvested MSPP Stock Units under the MSPP was $0.1. The weighted average period over which this compensation cost is expected to be recognized is 1.2 years.
The following table sets forth the RSU and MSPP Stock Unit activity for the year ended May 31, 2014:
Stock Units/RSUs | Weighted Average grant date fair value | |||||
Nonvested as of May 31, 2013 | 559,403 | $ | 29.98 | |||
Granted | 68,497 | $ | 30.07 | |||
Vested | (295,572 | ) | $ | 16.84 | ||
Forfeited | (9,834 | ) | $ | 28.90 | ||
Nonvested as of May 31, 2014 | 322,494 | $ | 21.33 | |||
The total fair value of shares vested during the fiscal years ended May 31, 2014, 2013 and 2012 was $5.0, $6.4 and $6.0, respectively.
Employee Stock Purchase Plan
The Company maintains an Employee Stock Purchase Plan (the “ESPP”), which is offered to eligible United States employees. The ESPP permits participating employees to purchase Common Stock, with after-tax payroll deductions, on a quarterly basis at a 15% discount from the closing price of the Common Stock on NASDAQ. In fiscal 2012, the ESPP was amended to provide that the purchase of Common Stock occurs on the last business day of the calendar quarter. The Company recognizes the discount on the Common Stock issued under the ESPP as stock-based compensation expense in the quarter in which the employees participated in the plan.
- 67-
The following table sets forth the ESPP share activity for the fiscal years ended May 31:
2014 | 2013 | ||||||
Shares issued | 57,835 | 68,228 | |||||
Weighted average purchase price per share | $ | 26.92 | $ | 24.78 | |||
At May 31, 2014, there were 161,910 shares of Common Stock remaining authorized for issuance under the ESPP.
11. TREASURY STOCK
The Company has authorizations from the Board of Directors to repurchase Common Stock, from time to time as conditions allow, on the open market or through negotiated private transactions, as summarized in the table below:
Authorization | Amount | |||
September 2010 | $44.0 | (a) | ||
Less repurchases | (30.6 | ) | ||
Remaining Board authorization at May 31, 2014 | $ | 13.4 | ||
(a) | Represents the remainder of a $200.0 authorization after giving effect to the purchase of 5,199,699 shares at $30.00 per share pursuant to a large share repurchase in the form of a modified Dutch auction tender offer that was completed by the Company on November 3, 2010 for a total cost of $156.0, excluding related fees and expenses. |
During the twelve months ended May 31, 2014, the Company repurchased approximately 0.2 million shares on the open market for approximately $6.2 at an average cost of $28.65 per share.
The Company’s repurchase program may be suspended at any time without prior notice.
12. EMPLOYEE BENEFIT PLANS
Pension Plans
The Company has a cash balance retirement plan (the “Pension Plan”), which covers the majority of United States employees who meet certain eligibility requirements. The Company funds all of the contributions for the Pension Plan. Benefits generally are based on the Company’s contributions and interest credits allocated to participants’ accounts based on years of benefit service and annual pensionable earnings. The Pension Plan is a defined benefit plan. It is the Company’s policy to fund the minimum amount required by the Employee Retirement Income Security Act of 1974, as amended. Effective June 1, 2009, no further benefits will accrue to employees under the Pension Plan.
Scholastic Ltd., an indirect subsidiary of Scholastic Corporation located in the United Kingdom, has a defined benefit pension plan (the “UK Pension Plan”) that covers its employees who meet various eligibility requirements. Benefits are based on years of service and on a percentage of compensation near retirement. The UK Pension Plan is funded by contributions from Scholastic Ltd. and its employees.
The Company’s pension plans have a measurement date of May 31.
Post-Retirement Benefits
The Company provides post-retirement benefits to eligible retired United States-based employees (the “Post-Retirement Benefits”) consisting of certain healthcare and life insurance benefits. Employees may become eligible for these benefits after completing certain minimum age and service requirements. Effective June 1, 2009, the Company modified the terms of the Post-Retirement Benefits, effectively excluding a large percentage of employees from the plan. At May 31, 2014, the unrecognized prior service credit remaining was $0.3.
The Medicare Prescription Drug, Improvement and Modernization Act (the “Medicare Act”) introduced a prescription drug benefit under Medicare (“Medicare Part D”) as well as a Federal subsidy of 28% to sponsors of retiree health care benefit plans providing a benefit that is at least actuarially equivalent to Medicare Part D. The Company has determined that the Post-
- 68-
Retirement Benefits provided to its retiree population are in aggregate the actuarial equivalent of the benefits under Medicare Part D. As a result, in fiscal 2014, 2013 and 2012, the Company recognized a cumulative reduction of its accumulated post-retirement benefit obligation of $3.1, $3.1 and $2.9, respectively, due to the Federal subsidy under the Medicare Act.
The following table sets forth the weighted average actuarial assumptions utilized to determine the benefit obligations for the Pension Plan and the UK Pension Plan (collectively the “Pension Plans”), including the Post-Retirement Benefits, at May 31:
Pension Plans | Post-Retirement Benefits | ||||||||||||||||
2014 | 2013 | 2012 | 2014 | 2013 | 2012 | ||||||||||||
Weighted average assumptions used to determine benefit obligations: | |||||||||||||||||
Discount rate | 4.1 | % | 4.0 | % | 4.0 | % | 4.0 | % | 3.9 | % | 3.9 | % | |||||
Rate of compensation increase | 4.2 | % | 4.4 | % | 3.3 | % | — | — | — | ||||||||
Weighted average assumptions used to determine net periodic benefit cost: | |||||||||||||||||
Discount rate | 4.0 | % | 4.0 | % | 5.1 | % | 3.9 | % | 3.9 | % | 5.0 | % | |||||
Expected long-term return on plan assets | 7.5 | % | 7.3 | % | 7.7 | % | — | — | — | ||||||||
Rate of compensation increase | 4.4 | % | 3.3 | % | 4.3 | % | — | — | — | ||||||||
To develop the expected long-term rate of return on assets assumption for the Pension Plans, the Company considers historical returns and future expectations. Considering this information and the potential for lower future returns due to a generally lower interest rate environment, the Company selected an assumed weighted average long-term rate of return of 7.5%.
The following table sets forth the change in benefit obligation for the Pension Plans and Post-Retirement Benefits at May 31:
Pension Plans | Post-Retirement Benefits | ||||||||||||||
2014 | 2013 | 2014 | 2013 | ||||||||||||
Change in benefit obligation: | |||||||||||||||
Benefit obligation at beginning of year | $ | 185.6 | $ | 182.2 | $ | 36.2 | $ | 39.6 | |||||||
Service cost | — | — | 0.0 | 0.0 | |||||||||||
Interest cost | 7.2 | 6.9 | 1.3 | 1.4 | |||||||||||
Plan participants’ contributions | — | — | 0.4 | 0.4 | |||||||||||
Actuarial losses (gains) | (2.5 | ) | 7.4 | (1.9 | ) | (2.8 | ) | ||||||||
Foreign currency translation | 3.7 | (0.8 | ) | — | — | ||||||||||
Settlement | (6.4 | ) | — | — | — | ||||||||||
Benefits paid, including expenses | (7.1 | ) | (10.1 | ) | (2.6 | ) | (2.4 | ) | |||||||
Benefit obligation at end of year | $ | 180.5 | $ | 185.6 | $ | 33.4 | $ | 36.2 | |||||||
- 69-
The following table sets forth the change in plan assets for the Pension Plans and Post-Retirement Benefits at May 31:
Pension Plans | Post-Retirement Benefits | ||||||||||||||
2014 | 2013 | 2014 | 2013 | ||||||||||||
Change in plan assets: | |||||||||||||||
Fair value of plan assets at beginning of year | $ | 173.8 | $ | 145.8 | $ | — | $ | — | |||||||
Actual return on plan assets | 21.1 | 29.9 | — | — | |||||||||||
Employer contributions | 4.6 | 8.8 | 2.2 | 2.0 | |||||||||||
Settlement | (6.4 | ) | — | — | — | ||||||||||
Benefits paid, including expenses | (7.1 | ) | (10.1 | ) | (2.6 | ) | (2.4 | ) | |||||||
Plan participants’ contributions | — | — | 0.4 | 0.4 | |||||||||||
Foreign currency translation | 2.6 | (0.6 | ) | — | — | ||||||||||
Fair value of plan assets at end of year | $ | 188.6 | $ | 173.8 | $ | — | $ | — | |||||||
In fiscal 2014, the Company recorded a pretax charge of $1.7 related to the lump sump settlement of certain US pension obligations.
The following table sets forth the net funded status of the Pension Plans and Post-Retirement Benefits and the related amounts
recognized on the Company’s Consolidated Balance Sheets at May 31:
Pension Plans | Post-Retirement Benefits | ||||||||||||||
2014 | 2013 | 2014 | 2013 | ||||||||||||
Non-current assets | $ | 19.4 | $ | — | $ | — | $ | — | |||||||
Current liabilities | — | — | (2.6 | ) | (2.7 | ) | |||||||||
Non-current liabilities | (11.4 | ) | (11.8 | ) | (30.8 | ) | (33.5 | ) | |||||||
Net funded balance | $ | 8.0 | $ | (11.8 | ) | $ | (33.4 | ) | $ | (36.2 | ) | ||||
The following amounts were recognized in Accumulated other comprehensive loss for the Pension Plans and Post-Retirement Benefits in the Company’s Consolidated Balance Sheets at May 31:
2014 | 2013 | ||||||||||||||||||||||
Pension Plans | Post - Retirement Benefits | Total | Pension Plans | Post - Retirement Benefits | Total | ||||||||||||||||||
Net actuarial gain (loss) | $ | (47.6 | ) | $ | (9.3 | ) | $ | (56.9 | ) | $ | (62.1 | ) | $ | (13.4 | ) | $ | (75.5 | ) | |||||
Net prior service credit | — | 0.3 | 0.3 | — | 0.5 | 0.5 | |||||||||||||||||
Net amount recognized in Accumulated other comprehensive income (loss) | $ | (47.6 | ) | $ | (9.0 | ) | $ | (56.6 | ) | $ | (62.1 | ) | $ | (12.9 | ) | $ | (75.0 | ) | |||||
The estimated net loss for the Pension Plans that will be amortized from Accumulated other comprehensive loss into net periodic benefit cost over the Company’s fiscal year ending May 31, 2015 is $1.4. The estimated net loss and prior service credit for the Post-Retirement Benefits that will be amortized from Accumulated other comprehensive loss into net periodic benefit cost over the fiscal year ending May 31, 2015 are $1.6 and $0.2, respectively. Income tax expense of $5.0 and income tax expense of $8.4 were recognized in Accumulated other comprehensive loss at May 31, 2014 and 2013, respectively.
- 70-
The following table sets forth information with respect to the Pension Plans with accumulated benefit obligations in excess of plan assets for the fiscal years ended May 31:
2014 | 2013 | ||||||
Projected benefit obligations | $ | 180.5 | $ | 185.6 | |||
Accumulated benefit obligations | 179.5 | 184.6 | |||||
Fair value of plan assets | 188.6 | 173.8 | |||||
The following table sets forth the net periodic (benefit) cost for the Pension Plans and Post-Retirement Benefits for the fiscal years ended May 31:
Pension Plans | Post - Retirement Benefits | ||||||||||||||||||||||
2014 | 2013 | 2012 | 2014 | 2013 | 2012 | ||||||||||||||||||
Components of net periodic (benefit) cost: | |||||||||||||||||||||||
Service cost | $ | — | $ | — | $ | — | $ | 0.0 | $ | 0.0 | $ | 0.0 | |||||||||||
Interest cost | 7.2 | 6.9 | 8.4 | 1.3 | 1.4 | 1.7 | |||||||||||||||||
Expected return on assets | (12.7 | ) | (10.5 | ) | (10.8 | ) | — | — | — | ||||||||||||||
Net amortization and deferrals | — | — | — | (0.2 | ) | (0.4 | ) | (0.6 | ) | ||||||||||||||
Lump sum settlement charge | 1.7 | — | — | — | — | — | |||||||||||||||||
Recognized net actuarial loss | 1.8 | 2.2 | 1.4 | 2.2 | 3.0 | 3.8 | |||||||||||||||||
Net periodic (benefit) cost | $ | (2.0 | ) | $ | (1.4 | ) | $ | (1.0 | ) | $ | 3.3 | $ | 4.0 | $ | 4.9 | ||||||||
Plan Assets
The Company’s investment policy with regard to the assets in the Pension Plans is to actively manage, within acceptable risk parameters, certain asset classes where the potential exists to outperform the broader market.
The following table sets forth the total weighted average asset allocations for the Pension Plans by asset category at May 31:
2014 | 2013 | ||||
Equity securities | 33.0 | % | 69.5 | % | |
Debt securities | 58.8 | % | 24.0 | % | |
Real estate | 1.1 | % | 1.0 | % | |
Other | 7.1 | % | 5.5 | % | |
100.0 | % | 100.0 | % | ||
The following table sets forth the targeted weighted average asset allocations for the Pension Plans included in the Company’s investment policy:
US Pension Plan | UK Pension Plan | ||||
Equity | 30 | % | 40 | % | |
Debt and cash equivalents | 70 | % | 30 | % | |
Real estate and other | 0 | % | 30 | % | |
100 | % | 100 | % | ||
The fair values of the Company’s Pension Plans’ assets are measured using Level 1, Level 2 and Level 3 fair value measurements. For a more complete description of fair value measurements see Note 18, “Fair Value Measurements.”
- 71-
The following table sets forth the measurement of the Company’s Pension Plans’ assets at fair value by asset category at the respective dates:
Assets at Fair Value as of May 31, 2014 | |||||||||||||||
Level 1 | Level 2 | Level 3 | Total | ||||||||||||
Cash and cash equivalents | $ | 7.1 | $ | — | $ | — | $ | 7.1 | |||||||
Equity securities: | |||||||||||||||
U.S. (1) | 39.8 | 101.3 | — | 141.1 | |||||||||||
International (2) | 10.3 | 12.1 | — | 22.4 | |||||||||||
Fixed Income (3) | — | 9.7 | — | 9.7 | |||||||||||
Annuities | — | — | 6.2 | 6.2 | |||||||||||
Real estate (4) | — | 2.1 | — | 2.1 | |||||||||||
Total | $ | 57.2 | $ | 125.2 | $ | 6.2 | $ | 188.6 | |||||||
Assets at Fair Value as of May 31, 2013 | |||||||||||||||
Level 1 | Level 2 | Level 3 | Total | ||||||||||||
Cash and cash equivalents | $ | 3.5 | $ | — | $ | — | $ | 3.5 | |||||||
Equity securities: | |||||||||||||||
U.S. (1) | 94.0 | — | — | 94.0 | |||||||||||
International (2) | 16.3 | 10.4 | — | 26.7 | |||||||||||
Fixed Income (3) | 34.4 | 7.4 | — | 41.8 | |||||||||||
Annuities | — | — | 6.1 | 6.1 | |||||||||||
Real estate (4) | — | 1.7 | — | 1.7 | |||||||||||
Total | $ | 148.2 | $ | 19.5 | $ | 6.1 | $ | 173.8 | |||||||
(1) | Funds which invest in a diversified portfolio of publicly traded U.S. common stocks of large-cap, medium-cap and small-cap companies. There are no restrictions on these investments. |
(2) | Funds which invest in a diversified portfolio of publicly traded common stock of non-U.S. companies, primarily in Europe and Asia. There are no restrictions on these investments. |
(3) | Funds which invest in a diversified portfolio of publicly traded government bonds, corporate bonds and mortgage-backed securities. There are no restrictions on these investments. |
(4) | Represents assets of a non-U.S. entity plan invested in a fund whose underlying investments are comprised of properties. The fund has publicly available quoted market prices and there are no restrictions on these investments. |
The Company has purchased annuities to service fixed payments to certain retired plan participants in the UK. These annuities are purchased from investment grade counterparties. These annuities are not traded on open markets, and are therefore valued based upon the actuarial determined valuation, and related assumptions, of the underlying projected benefit obligation, a Level 3 valuation technique. The fair value of these assets was $6.2 and $6.1 at May 31, 2014 and May 31, 2013, respectively.
- 72-
The following table summarizes the changes in fair value of these Level 3 assets for the fiscal years ended May 31, 2014 and 2013:
Balance at May 31, 2012 | $ | 5.8 | |
Actual Return on Plan Assets: | |||
Relating to assets still held at May 31, 2013 | 0.7 | ||
Relating to assets sold during the year | — | ||
Purchases, sales and settlements, net | (0.3 | ) | |
Transfers in and/or out of Level 3 | — | ||
Foreign currency translation | (0.1 | ) | |
Balance at May 31, 2013 | $ | 6.1 | |
Actual Return on Plan Assets: | |||
Relating to assets still held at May 31, 2014 | (0.1 | ) | |
Relating to assets sold during the year | — | ||
Purchases, sales and settlements, net | (0.3 | ) | |
Transfers in and/or out of Level 3 | — | ||
Foreign currency translation | 0.5 | ||
Balance at May 31, 2014 | $ | 6.2 | |
Contributions
In fiscal 2015, the Company expects to contribute $1.4 to the Pension Plans.
Estimated future benefit payments
The following table sets forth the expected future benefit payments under the Pension Plans and the Post-Retirement Benefits by fiscal year:
Post - Retirement | |||||||||||
Pension Benefits | Benefit Payments | Medicare Subsidy Receipts | |||||||||
2015 | $ | 15.5 | $ | 2.9 | $ | 0.3 | |||||
2016 | 11.8 | 2.8 | 0.3 | ||||||||
2017 | 11.1 | 2.8 | 0.3 | ||||||||
2018 | 10.8 | 2.7 | 0.3 | ||||||||
2019 | 11.0 | 2.6 | 0.3 | ||||||||
2020-2024 | 50.7 | 12.5 | 1.6 | ||||||||
Assumed health care cost trend rates at May 31:
2014 | 2013 | ||||
Health care cost trend rate assumed for the next fiscal year | 7.0 | % | 7.5 | % | |
Rate to which the cost trend is assumed to decline (the ultimate trend rate) | 5.0 | % | 5.0 | % | |
Year that the rate reaches the ultimate trend rate | 2021 | 2021 | |||
- 73-
Assumed health care cost trend rates could have a significant effect on the amounts reported for the post-retirement health care plan. A one percentage point change in assumed health care cost trend rates would have the following effects:
2014 | 2013 | ||||||
Total service and interest cost - 1% increase | $ | 0.1 | $ | 0.2 | |||
Total service and interest cost - 1% decrease | (0.1 | ) | (0.1 | ) | |||
Post-retirement benefit obligation - 1% increase | 3.6 | 4.0 | |||||
Post-retirement benefit obligation - 1% decrease | (3.1 | ) | (3.4 | ) | |||
Defined contribution plans
The Company also provides defined contribution plans for certain eligible employees. In the United States, the Company sponsors a 401(k) retirement plan and has contributed $7.5, $8.0 and $7.4 for fiscal 2014, 2013 and 2012, respectively.
13. ACCRUED SEVERANCE
The table below provides information regarding Accrued severance, which is included in “Other accrued expenses” on the Company’s Consolidated Balance Sheets.
2014 | 2013 | ||||||
Beginning balance | $ | 3.3 | $ | 2.7 | |||
Accruals | 11.3 | 13.4 | |||||
Payments | (13.4 | ) | (12.8 | ) | |||
Ending balance | $ | 1.2 | $ | 3.3 | |||
The Company implemented cost saving initiatives in fiscal 2014, recognizing severance expense of $10.8. The Company also implemented cost saving initiatives in fiscal 2013, recognizing severance expense of $9.6.
- 74-
14. EARNINGS (LOSS) PER SHARE
The following table summarizes the reconciliation of the numerators and denominators for the Basic and Diluted earnings (loss) per share computation for the fiscal years ended May 31:
2014 | 2013 | 2012 | |||||||||
Earnings (loss) from continuing operations attributable to Class A and Common Shares | $ | 44.2 | $ | 35.7 | $ | 107.6 | |||||
Earnings (loss) from discontinued operations attributable to Class A and Common Shares, net of tax | 0.1 | (4.7 | ) | (5.7 | ) | ||||||
Net income (loss) attributable to Class A and Common Shares | 44.3 | 31.0 | 101.9 | ||||||||
Weighted average Shares of Class A Stock and Common Stock outstanding for basic earnings (loss) per share (in millions) | 32.0 | 31.8 | 31.2 | ||||||||
Dilutive effect of Class A Stock and Common Stock potentially issuable pursuant to stock-based compensation plans (in millions) | 0.5 | 0.6 | 0.5 | ||||||||
Adjusted weighted average Shares of Class A Stock and Common Stock outstanding for diluted earnings (loss) per share (in millions) | 32.5 | 32.4 | 31.7 | ||||||||
Earnings (loss) per share of Class A Stock and Common Stock | |||||||||||
Basic earnings (loss) per share: | |||||||||||
Earnings (loss) from continuing operations | $ | 1.38 | $ | 1.12 | $ | 3.45 | |||||
Earnings (loss) from discontinued operations, net of tax | $ | 0.01 | $ | (0.15 | ) | $ | (0.18 | ) | |||
Net income (loss) | $ | 1.39 | $ | 0.97 | $ | 3.27 | |||||
Diluted earnings (loss) per share: | |||||||||||
Earnings (loss) from continuing operations | $ | 1.36 | $ | 1.10 | $ | 3.39 | |||||
Earnings (loss) from discontinued operations, net of tax | $ | 0.00 | $ | (0.15 | ) | $ | (0.18 | ) | |||
Net income (loss) | $ | 1.36 | $ | 0.95 | $ | 3.21 | |||||
Earnings from continuing operations exclude earnings of $0.1, $0.1 and $0.5 for the years ended May 31, 2014, 2013 and 2012, respectively, for earnings attributable to participating RSUs.
In a period in which the Company reports a discontinued operation, Earnings (loss) from continuing operations is used as the “control number” in determining whether potentially dilutive common shares are dilutive or anti-dilutive. Potentially dilutive shares outstanding pursuant to compensation plans that were not included in the diluted earnings per share calculation because they were anti-dilutive were 1.3 million as of May 31, 2014.
A portion of the Company’s RSUs granted to employees participates in earnings through cumulative non-forfeitable dividends payable to the employees upon vesting of the RSUs. Accordingly, the Company measures earnings per share based upon
the lower of the Two-class method or the Treasury Stock method.
Options outstanding pursuant to compensation plans were 4.4 million and 4.2 million as of May 31, 2014 and 2013, respectively.
As of May 31, 2014, $13.4 remains available for future purchases of common shares under the current repurchase authorization of the Board of Directors.
See Note 11, “Treasury Stock,” for a more complete description of the Company’s share buy-back program.
- 75-
15. OTHER ACCRUED EXPENSES
Other accrued expenses consist of the following at May 31:
2014 | 2013 | ||||||
Accrued payroll, payroll taxes and benefits | $ | 41.7 | $ | 45.8 | |||
Accrued bonus and commissions | 36.9 | 22.0 | |||||
Accrued other taxes | 27.5 | 29.3 | |||||
Accrued advertising and promotions | 35.6 | 38.2 | |||||
Accrued income taxes | 4.7 | 5.5 | |||||
Accrued insurance | 8.3 | 8.7 | |||||
Other accrued expenses | 30.0 | 30.0 | |||||
Total accrued expenses | $ | 184.7 | $ | 179.5 | |||
16. OTHER FINANCIAL DATA
Other financial data consisted of the following for the fiscal years ended May 31:
2014 | 2013 | 2012 | |||||||||
Advertising expense | $ | 133.1 | $ | 146.4 | $ | 145.0 | |||||
Prepublication and production costs | 147.6 | 149.0 | 127.3 | ||||||||
Amortization of prepublication and production costs | 60.4 | 48.9 | 55.1 | ||||||||
Foreign currency transaction gain (loss) | (1.0 | ) | (0.5 | ) | 0.7 | ||||||
Purchases related to contractual commitments for minimum print quantities | 62.8 | 54.8 | 61.1 | ||||||||
2014 | 2013 | ||||||
Unredeemed credits issued in conjunction with the Company’s school-based book club and book fair operations (included in other accrued expenses) | $ | 10.4 | $ | 9.5 | |||
2014 | 2013 | ||||||
Components of Accumulated other comprehensive income (loss): | |||||||
Foreign Currency Translation | (16.6 | ) | (13.5 | ) | |||
Pension Obligations (net of tax of $18.1 and $23.1) | (38.6 | ) | (51.9 | ) | |||
Accumulated other comprehensive income (loss) | $ | (55.2 | ) | $ | (65.4 | ) | |
17. DERIVATIVES AND HEDGING
The Company enters into foreign currency derivative contracts to economically hedge the exposure to foreign currency fluctuations associated with the forecasted purchase of inventory and the foreign exchange risk associated with certain receivables denominated in foreign currencies. These derivative contracts are economic hedges and are not designated as cash flow hedges. The Company marks-to-market these instruments and records the changes in the fair value of these items in current earnings, and it recognizes the unrealized gain or loss in other current assets or liabilities. Unrealized losses of $0.3 and unrealized gains of $0.5 were recognized at May 31, 2014 and at May 31, 2013, respectively.
18. FAIR VALUE MEASUREMENTS
The Company determines the appropriate level in the fair value hierarchy for each fair value measurement of assets and liabilities carried at fair value on a recurring basis in the Company’s financial statements. The fair value hierarchy prioritizes the inputs, which refer to assumptions that market participants would use in pricing an asset or liability, based upon the highest and best use, into three levels as follows:
• | Level 1 Unadjusted quoted prices in active markets for identical assets or liabilities at the measurement date. |
- 76-
• | Level 2 Observable inputs other than unadjusted quoted prices in active markets for identical assets or liabilities such as |
◦ | Quoted prices for similar assets or liabilities in active markets |
◦ | Quoted prices for identical or similar assets or liabilities in inactive markets |
◦ | Inputs other than quoted prices that are observable for the asset or liability |
◦ | Inputs that are derived principally from or corroborated by observable market data by correlation or other means |
• | Level 3 Unobservable inputs in which there is little or no market data available, which are significant to the fair value measurement and require the Company to develop its own assumptions. |
The Company’s financial assets and liabilities measured at fair value consisted of cash and cash equivalents, debt and foreign currency forward contracts. Cash and cash equivalents are comprised of bank deposits and short-term investments, such as money market funds, the fair value of which is based on quoted market prices, a Level 1 fair value measure. The Company employs Level 2 fair value measurements for the disclosure of the fair value of its 5% Notes and its various lines of credit. For a more complete description of fair value measurements employed, see Note 5, “Debt.” The fair values of foreign currency forward contracts, used by the Company to manage the impact of foreign exchange rate changes to the financial statements, are based on quotations from financial institutions, a Level 2 fair value measure.
Non-financial assets and liabilities for which the Company employs fair value measures on a non-recurring basis include:
• | Long-lived assets |
• | Investments |
• | Assets acquired in a business combination |
• | Goodwill and indefinite-lived intangible assets |
• | Long-lived assets held for sale |
Level 2 and Level 3 inputs are employed by the Company in the fair value measurement of these assets and liabilities. The following tables present non-financial assets that were measured and recorded at fair value on a non-recurring basis and the total impairment losses and additions recognized on those assets:
Net carrying value as of | Fair value measured and recorded using | Impairment losses for fiscal year ended | |||||||||||||||||||||
May 31, 2014 | Level 1 | Level 2 | Level 3 | May 31, 2014 | Additions due to acquisitions | ||||||||||||||||||
Investments | $ | — | $ | — | $ | — | $ | — | $ | 5.8 | $ | 1.0 | |||||||||||
Property, plant and equipment, net | — | — | — | — | 7.6 | — | |||||||||||||||||
Goodwill | — | — | — | — | 13.4 | — | |||||||||||||||||
Prepublication assets | — | — | — | — | 5.7 | — | |||||||||||||||||
Net carrying value as of | Fair value measured and recorded using | Impairment losses for fiscal year ended | |||||||||||||||||||||
May 31, 2013 | Level 1 | Level 2 | Level 3 | May 31, 2013 | Additions due to acquisitions | ||||||||||||||||||
Other intangible assets | $ | 0.3 | $ | — | $ | — | $ | 0.3 | $ | — | $ | 0.3 | |||||||||||
Property, plant and equipment, net | — | — | — | — | 5.2 | — | |||||||||||||||||
Prepublication assets | — | — | — | — | 2.0 | — | |||||||||||||||||
- 77-
Net carrying value as of | Fair value measured and recorded using | Impairment losses for fiscal year ended | |||||||||||||||||||||
May 31, 2012 | Level 1 | Level 2 | Level 3 | May 31, 2012 | Additions due to acquisitions | ||||||||||||||||||
Goodwill | $ | 2.7 | $ | — | $ | — | $ | 2.7 | $ | — | $ | 2.7 | |||||||||||
Other intangible assets impairment | 4.9 | — | — | 4.9 | 6.8 | — | |||||||||||||||||
Other intangibles | 5.4 | — | — | 5.4 | — | 5.4 | |||||||||||||||||
Production assets | 0.6 | — | — | 0.6 | 4.0 | — | |||||||||||||||||
Prepublication assets | — | — | — | — | 0.8 | — | |||||||||||||||||
Investments | — | — | — | — | 1.3 | — | |||||||||||||||||
19. SUBSEQUENT EVENTS
On July 23, 2014, the Board of Directors declared a regular cash dividend of $0.150 per Class A and Common share in respect of the first quarter of fiscal 2015. The dividend is payable on September15, 2014 to shareholders of record on August 29, 2014.
- 78-
Report of Independent Registered Public Accounting Firm
THE BOARD OF DIRECTORS AND STOCKHOLDERS
OF SCHOLASTIC CORPORATION
We have audited the accompanying consolidated balance sheets of Scholastic Corporation as of May 31, 2014 and 2013, and the related consolidated statements of operations, comprehensive income (loss), changes in stockholders’ equity and cash flows for each of the three years in the period ended May 31, 2014. Our audits also included the financial statement schedule included in the Index at Item 15(a). These financial statements and the schedule are the responsibility of the Company’s management. Our responsibility is to express an opinion on these financial statements and the schedule based on our audits.
We conducted our audits in accordance with the standards of the Public Company Accounting Oversight Board (United States). Those standards require that we plan and perform the audit to obtain reasonable assurance about whether the financial statements are free of material misstatement. An audit includes examining, on a test basis, evidence supporting the amounts and disclosures in the financial statements. An audit also includes assessing the accounting principles used and significant estimates made by management, as well as evaluating the overall financial statement presentation. We believe that our audits provide a reasonable basis for our opinion.
In our opinion, the financial statements referred to above present fairly, in all material respects, the consolidated financial position of Scholastic Corporation at May 31, 2014 and 2013, and the consolidated results of its operations and its cash flows for each of the three years in the period ended May 31, 2014, in conformity with U.S. generally accepted accounting principles. Also, in our opinion, the related financial statement schedule, when considered in relation to the basic financial statements taken as a whole, presents fairly in all material respects the information set forth therein.
We also have audited, in accordance with the standards of the Public Company Accounting Oversight Board (United States), Scholastic Corporation’s internal control over financial reporting as of May 31, 2014, based on criteria established in Internal Control-Integrated Framework issued by the Committee of Sponsoring Organizations of the Treadway Commission (1992 framework), and our report dated July 29, 2014 expressed an unqualified opinion thereon.
/s/ Ernst & Young LLP
New York, New York
July 29, 2014
- 79-
Report of Independent Registered Public Accounting Firm
THE BOARD OF DIRECTORS AND STOCKHOLDERS
OF SCHOLASTIC CORPORATION
We have audited Scholastic Corporation’s internal control over financial reporting as of May 31, 2014, based on criteria established in Internal Control-Integrated Framework issued by the Committee of Sponsoring Organizations of the Treadway Commission (1992 framework) (the COSO criteria). Scholastic Corporation’s management is responsible for maintaining effective internal control over financial reporting, and for its assessment of the effectiveness of internal control over financial reporting included in the accompanying Management’s Report on Internal Control over Financial Reporting. Our responsibility is to express an opinion on the company’s internal control over financial reporting based on our audit.
We conducted our audit in accordance with the standards of the Public Company Accounting Oversight Board (United States). Those standards require that we plan and perform the audit to obtain reasonable assurance about whether effective internal control over financial reporting was maintained in all material respects. Our audit included obtaining an understanding of internal control over financial reporting, assessing the risk that a material weakness exists, testing and evaluating the design and operating effectiveness of internal control based on the assessed risk, and performing such other procedures as we considered necessary in the circumstances. We believe that our audit provides a reasonable basis for our opinion.
A company’s internal control over financial reporting is a process designed to provide reasonable assurance regarding the reliability of financial reporting and the preparation of financial statements for external purposes in accordance with generally accepted accounting principles. A company’s internal control over financial reporting includes those policies and procedures that (1) pertain to the maintenance of records that, in reasonable detail, accurately and fairly reflect the transactions and dispositions of the assets of the company; (2) provide reasonable assurance that transactions are recorded as necessary to permit preparation of financial statements in accordance with generally accepted accounting principles, and that receipts and expenditures of the company are being made only in accordance with authorizations of management and directors of the company; and (3) provide reasonable assurance regarding prevention or timely detection of unauthorized acquisition, use, or disposition of the company’s assets that could have a material effect on the financial statements.
Because of its inherent limitations, internal control over financial reporting may not prevent or detect misstatements. Also, projections of any evaluation of effectiveness to future periods are subject to the risk that controls may become inadequate because of changes in conditions, or that the degree of compliance with the policies or procedures may deteriorate.
In our opinion, Scholastic Corporation maintained, in all material respects, effective internal control over financial reporting as of May 31, 2014, based on the COSO criteria.
We also have audited, in accordance with the standards of the Public Company Accounting Oversight Board (United States), the consolidated balance sheets of Scholastic Corporation as of May 31, 2014 and 2013, and the related consolidated statements of operations, comprehensive income (loss), changes in stockholders’ equity and cash flows for each of the three years in the period ended May 31, 2014, and our report dated July 29, 2014 expressed an unqualified opinion thereon.
/s/ Ernst & Young LLP
New York, New York
July 29, 2014
- 80-
Supplementary Financial Information
Summary of Quarterly Results of Operations
(Unaudited, amounts in millions except per share data)
First Quarter | Second Quarter | Third Quarter | Fourth Quarter | Fiscal Year Ended May 31, | |||||||||||||||
2014 | |||||||||||||||||||
Revenues | $ | 276.3 | $ | 623.2 | $ | 373.5 | $ | 549.3 | $ | 1,822.3 | |||||||||
Cost of goods sold | 137.9 | 264.8 | 190.7 | 252.6 | 846.0 | ||||||||||||||
Earnings (loss) from continuing operations | (30.1 | ) | 58.3 | (12.1 | ) | 28.2 | 44.3 | ||||||||||||
Earnings (loss) from discontinued operations, net of tax | 0.2 | 0.0 | 0.0 | (0.1 | ) | 0.1 | |||||||||||||
Net income (loss) | (29.9 | ) | 58.3 | (12.1 | ) | 28.1 | 44.4 | ||||||||||||
Earnings (loss) per share of Class A and Common Stock: | |||||||||||||||||||
Basic: | |||||||||||||||||||
Earnings (loss) from continuing operations (1) | (0.94 | ) | 1.82 | (0.38 | ) | 0.87 | 1.38 | ||||||||||||
Earnings (loss) from discontinued operations, net of tax (1) | 0.00 | 0.00 | 0.00 | (0.00 | ) | 0.01 | |||||||||||||
Net income (loss) (1) | (0.94 | ) | 1.82 | (0.38 | ) | 0.87 | 1.39 | ||||||||||||
Diluted: | |||||||||||||||||||
Earnings (loss) from continuing operations (1) | (0.94 | ) | 1.80 | (0.38 | ) | 0.86 | 1.36 | ||||||||||||
Earnings (loss) from discontinued operations, net of tax (1) | 0.00 | 0.00 | 0.00 | (0.01 | ) | 0.00 | |||||||||||||
Net income (loss) (1) | (0.94 | ) | 1.80 | (0.38 | ) | 0.85 | 1.36 | ||||||||||||
2013 | |||||||||||||||||||
Revenues | $ | 293.4 | $ | 613.5 | $ | 378.6 | $ | 506.9 | $ | 1,792.4 | |||||||||
Cost of goods sold | 150.8 | 262.0 | 190.0 | 226.8 | 829.6 | ||||||||||||||
Earnings (loss) from continuing operations | (31.7 | ) | 62.6 | (19.9 | ) | 24.8 | 35.8 | ||||||||||||
Earnings (loss) from discontinued operations, net of tax | (0.4 | ) | (0.8 | ) | (0.2 | ) | (3.3 | ) | (4.7 | ) | |||||||||
Net income (loss) | (32.1 | ) | 61.8 | (20.1 | ) | 21.5 | 31.1 | ||||||||||||
Earnings (loss) per share of Class A and Common Stock: | |||||||||||||||||||
Basic: | |||||||||||||||||||
Earnings (loss) from continuing operations (1) | (1.01 | ) | 1.95 | (0.62 | ) | 0.78 | 1.12 | ||||||||||||
Earnings (loss) from discontinued operations, net of tax (1) | (0.01 | ) | (0.02 | ) | (0.01 | ) | (0.11 | ) | (0.15 | ) | |||||||||
Net income (loss) (1) | (1.02 | ) | 1.93 | (0.63 | ) | 0.67 | 0.97 | ||||||||||||
Diluted: | |||||||||||||||||||
Earnings (loss) from continuing operations (1) | (1.01 | ) | 1.91 | (0.62 | ) | 0.76 | 1.10 | ||||||||||||
Earnings (loss) from discontinued operations, net of tax (1) | (0.01 | ) | (0.02 | ) | (0.01 | ) | (0.10 | ) | (0.15 | ) | |||||||||
Net income (loss) (1) | (1.02 | ) | 1.89 | (0.63 | ) | 0.66 | 0.95 | ||||||||||||
(1) The sum of the quarters may not equal the full year basic and diluted earnings per share since each quarter is calculated separately.
- 81-
Item 9 | Changes in and Disagreements with Accountants on Accounting and Financial Disclosure
None.
Item 9A | Controls and Procedures
Evaluation of Disclosure Controls and Procedures
The Chief Executive Officer and Chief Financial Officer of the Corporation, after conducting an evaluation, together with other members of the Company’s management, of the effectiveness of the design and operation of the Corporation’s disclosure controls and procedures as of May 31, 2014, have concluded that the Corporation’s disclosure controls and procedures were effective to ensure that information required to be disclosed by the Corporation in its reports filed or submitted under the Securities Exchange Act of 1934 (the “Exchange Act”) is recorded, processed, summarized, and reported within the time periods specified in the rules and forms of the SEC and accumulated and communicated to members of the Corporation’s management, including the Chief Executive Officer and Chief Financial Officer, to allow timely decisions regarding required disclosure.
Management’s Report on Internal Control over Financial Reporting
The management of the Corporation is responsible for establishing and maintaining adequate internal control over financial reporting for the Corporation. A corporation’s internal control over financial reporting is a process designed to provide reasonable assurance regarding the reliability of financial reporting and the preparation of financial statements for external purposes in accordance with generally accepted accounting principles. Because of its inherent limitations, internal control over financial reporting may not prevent or detect misstatements. Also, projections of any evaluation of effectiveness to future periods are subject to the risk that controls may become inadequate because of changes in conditions, or that the degree of compliance with the policies or procedures may deteriorate. The Company’s management (with the participation of the Corporation’s Chief Executive Officer and Chief Financial Officer), after conducting an evaluation of the effectiveness of the Corporation’s internal control over financial reporting based on the framework in Internal Control-Integrated Framework issued by the Committee of Sponsoring Organizations of the Treadway Commission (1992), concluded that the Corporation’s internal control over financial reporting was effective as of May 31, 2014.
Ernst & Young LLP, an independent registered public accounting firm, has issued an attestation report on the Corporation’s internal control over financial reporting as of May 31, 2014, which is included herein. There was no change in the Corporation’s internal control over financial reporting that occurred during the quarter ended May 31, 2014 that materially affected, or is reasonably likely to materially affect, the Corporation’s internal control over financial reporting.
Item 9B | Other Information
None.
- 82-
Part III
Item 10 | Directors, Executive Officers and Corporate Governance
Information required by this item is incorporated herein by reference from the Corporation’s definitive proxy statement for the Annual Meeting of Stockholders to be held September 24, 2014 to be filed with the SEC pursuant to Regulation 14A under the Exchange Act. Certain information regarding the Corporation’s Executive Officers is set forth in Part I - Item 1 - Business.
Item 11 | Executive Compensation
Incorporated herein by reference from the Corporation’s definitive proxy statement for the Annual Meeting of Stockholders to be held September 24, 2014 to be filed pursuant to Regulation 14A under the Exchange Act.
Item 12 | Security Ownership of Certain Beneficial Owners and Management and Related Stockholder Matters
Incorporated herein by reference from the Corporation’s definitive proxy statement for the Annual Meeting of Stockholders to be held September 24, 2014 to be filed pursuant to Regulation 14A under the Exchange Act.
Item 13 | Certain Relationships and Related Transactions, and Director Independence
Incorporated herein by reference from the Corporation’s definitive proxy statement for the Annual Meeting of Stockholders to be held September 24, 2014 to be filed pursuant to Regulation 14A under the Exchange Act.
Item 14 | Principal Accounting Fees and Services
Incorporated herein by reference from the Corporation’s definitive proxy statement for the Annual Meeting of Stockholders to be held September 24, 2014 to be filed pursuant to Regulation 14A under the Exchange Act.
- 83-
Part IV
Item 15 | Exhibits, Financial Statement Schedules
(a)(1) | Financial Statements: |
The following Consolidated Financial Statements are included in Part II, Item 8, “Consolidated Financial Statements and Supplementary Data”: | |
Consolidated Statements of Operations for the years ended May 31, 2014, 2013 and 2012 | |
Consolidated Statements of Comprehensive Income (Loss) for the years ended May 31, 2014, 2013 and 2012 | |
Consolidated Balance Sheets at May 31, 2014 and 2013 | |
Consolidated Statement of Changes in Stockholders’ Equity for the years ended May 31, 2014, 2013 and 2012 | |
Consolidated Statements of Cash Flows for the years ended May 31, 2014, 2013 and 2012 | |
Notes to Consolidated Financial Statements | |
(a)(2) | Supplementary Financial Information - Summary of Quarterly Results of Operations Financial Statement Schedule. |
and (c) | |
The following consolidated financial statement schedule is included with this report: Schedule II-Valuation and Qualifying Accounts and Reserves. | |
All other schedules have been omitted since the required information is not present or is not present in amounts sufficient to require submission of the schedule, or because the information required is included in the Consolidated Financial Statements or the Notes thereto. | |
(a)(3) and (b) | |
Exhibits: | |
3.1 | Amended and Restated Certificate of Incorporation of the Corporation, as amended to date (incorporated by reference to the Corporation’s Quarterly Report on Form 10-Q as filed with the SEC on October 5, 2006, SEC File No. 000-19860) (the “August 31, 2006 10-Q”). |
3.2 | Bylaws of the Corporation, amended and restated as of December 12, 2007 (incorporated by reference to the Corporation’s Current Report on Form 8-K as filed with the SEC on December 14, 2007, SEC File No. 000-19860). |
- 84-
4.1 | Credit Agreement, dated as of June 1, 2007, among the Corporation and Scholastic Inc., as borrowers, the Initial Lenders named therein, JP Morgan Chase Bank, N.A., as administrative agent, J.P. Morgan Securities Inc. and Bank of America Securities LLC., as joint lead arrangers and joint bookrunners, Bank of America, N. A. and Wachovia Bank, N. A., as syndication agents, and SunTrust Bank and The Royal Bank of Scotland, plc, as Documentation Agents (incorporated by reference to the Corporation’s Annual Report on Form 10-K as filed with the SEC on July 30, 2007, SEC File No. 000-19860) (the “2007 10-K”). |
4.2 | Amendment No. 1, dated as of August 16, 2010, to the Credit Agreement, dated as of June 1, 2007 (incorporated by reference to the Corporation’s Quarterly Report on Form 10-Q as filed with the SEC on October 1, 2010, SEC file No. 000-19860) (the “August 30, 2010 10-Q”). |
4.3 | Amendment No. 2, dated as of October 25, 2011, to the Credit Agreement, dated as of June 1, 2007 (incorporated by reference to the Corporation’s Quarterly Report on Form 10-Q as filed with the SEC on December 22, 2011, SEC file No. 000-19860) (the “November 30, 2011 10-Q”). |
4.4 | Amendment No. 3, dated as of December 5, 2012, to the Credit Agreement, dated as of June 1, 2007 (incorporated by reference to the Corporation’s Quarterly Report on Form 10-Q as filed with the SEC on March 29, 2013, SEC File No. 000-19860) (the “February 28, 2013 10-Q”). |
10.1* | Scholastic Corporation 1995 Stock Option Plan, effective as of September 21, 1995 (incorporated by reference to the Corporation’s Registration Statement on Form S-8 (Registration No. 33-98186), as filed with the SEC on October 16, 1995, SEC File No. 000-19860), together with Amendment No. 1, effective September 16, 1998 (incorporated by reference to the Corporation’s Quarterly Report on Form 10-Q as filed with the SEC on October 15, 1998, SEC File No. 000-19860), Amendment No. 2, effective as of July 18, 2001 (incorporated by reference to the Corporation’s Annual Report on Form 10-K as filed with the SEC on August 24, 2001, SEC File No. 000-19860), Amendment No. 3, effective as of May 25, 2006 (incorporated by reference to the Corporation’s Annual Report on Form 10-K as filed with the SEC on August 9, 2006, SEC File No. 000-19860) (the “2006 10-K”), Amendment No. 4, dated as of March 21, 2007 (incorporated by reference to the Corporation’s Quarterly Report on Form 10-Q as filed with the SEC on March 30, 2007, SEC File No. 000-19860) (the “February 28, 2007 10-Q”) and Amendment No. 5, dated as of May 20, 2008 (incorporated by reference to the Corporation’s Annual Report on Form 10-K as filed with the SEC on July 30, 2008, SEC file No. 000-19860). |
10.2* | Scholastic Corporation Management Stock Purchase Plan, amended and restated effective as of September 23, 2008 (incorporated by reference to the Corporation’s Annual Report on Form 10-K as filed with the SEC on July 30, 2009, SEC File No. 000-19860) (the “2009 10-K”), together with Amendment No. 1 to the Scholastic Corporation Management Stock Purchase Plan, effective as of September 21, 2011 (incorporated by reference to Appendix B to the Corporation’s definitive Proxy Statement as filed with the SEC on August 9, 2011, SEC File No. 000-19860). |
10.3* | Scholastic Corporation 1997 Outside Directors’ Stock Option Plan, amended and restated as of May 25, 1999 (incorporated by reference to the Corporation’s Annual Report on Form 10-K as filed with the SEC on August 23, 1999, SEC File No. 000-19860) (the “1999 10-K”), together with Amendment No. 1, dated September 20, 2001 (incorporated by reference to the Corporation’s Quarterly Report on Form 10-Q as filed with the SEC on January 14, 2002, SEC File No. 000-19860), Amendment No. 2, effective as of September 23, 2003 (incorporated by reference to Appendix B to the Corporation’s definitive Proxy Statement as filed with the SEC on August 19, 2003, SEC File No. 000-19860), and Amendment No. 3, effective as of May 25, 2006 (incorporated by reference to the 2006 10-K) and Amendment No. 4, effective as of May 21, 2013, (incorporated by reference to the Corporation’s Annual Report on Form 10-K as filed with the SEC on July 29, 2013, SEC File No. 000-19860) (the “2013 10-K”). |
10.4* | Scholastic Corporation Director’s Deferred Compensation Plan, amended and restated effective as of September 23, 2008 (incorporated by reference to the 2009 10-K). |
10.5* | Scholastic Corporation 2007 Outside Directors Stock Incentive Plan (the “2007 Directors’ Plan”) effective as of September 23, 2008 (incorporated by reference to the 2009 10-K) and the Amended and Restated Scholastic Corporation 2007 Outside Directors Stock Incentive Plan (incorporated by reference to the Corporation’s Quarterly Report on Form 10-Q as filed with the SEC on January 2, 2013, SEC File No. 000-19860) (“the November 30, 2012 10-Q”), and Amendment No. 4, effective as of May 21, 2013 (incorporated by reference to the 2013 10-K). |
- 85-
10.6* | Form of Stock Option Agreement under the 2007 Directors’ Plan (incorporated by reference to the Corporation’s Quarterly Report on Form 10-Q as filed with the SEC on January 9, 2008, SEC File No. 000-19860) (the “November 30, 2007 10-Q”) and the Form of Stock Option Agreement under the 2007 Directors’ Plan, effective as of September 19, 2012 (incorporated by reference to the November 30, 2012 10-Q). |
10.7* | Form of Restricted Stock Unit Agreement under the 2007 Directors’ Plan effective as of September 23, 2008 (incorporated by reference to the 2009 10-K) and the Form of Restricted Stock Unit Agreement, effective as of September 19, 2012 (incorporated by reference to the November 30, 2012 10-Q). |
10.8* | Scholastic Corporation Executive Performance Incentive Plan, effective as of May 21, 2008 (incorporated by reference to Appendix B to the Corporation’s definitive Proxy Statement as filed with the SEC on August 15, 2008, SEC File No. 000-19860). |
10.9* | Scholastic Corporation 2001 Stock Incentive Plan, amended and restated as of July 21, 2009 (the “2001 Plan”) (incorporated by reference to the Corporation’s Quarterly Report on Form 10-Q as filed with the SEC on October 10, 2009, SEC File No. 000-19860) (the “August 31, 2009 10-Q”), and Amendment No. 1 to the Amended and Restated Scholastic Corporation 2001 Stock Incentive Plan (incorporated by reference to the 2013 10-K). |
10.10* | Form of Stock Unit Agreement under the 2001 Plan (incorporated by reference to the August 31, 2009 10-Q). |
10.11* | Amended and Restated Guidelines for Stock Units granted under the 2001 Plan, amended and restated as of July 21, 2009 (incorporated by reference to the August 31, 2009 10-Q). |
10.12* | Form of Non-Qualified Stock Option Agreement under the 2001 Plan (incorporated by reference to the August 31, 2009 10-Q). |
10.13* | Scholastic Corporation 2004 Class A Stock Incentive Plan (the “Class A Plan”) (incorporated by reference to Appendix A to the Corporation’s definitive Proxy Statement as filed with the SEC on August 2, 2004, SEC File No. 000-19860), Amendment No. 1, effective as of May 25, 2006 (incorporated by reference to the 2006 10-K), Amendment No. 2, dated July 18, 2006 (incorporated by reference to Appendix C to the Corporation’s definitive Proxy Statement as filed with the SEC on August 1, 2006, SEC File No. 000-19860), and Amendment No. 3, dated as of March 20, 2007 (incorporated by reference to the February 28, 2007 10-Q). |
10.14* | Form of Class A Option Agreement under the Class A Plan (incorporated by reference to the Corporation’s Annual Report on Form 10-K as filed with the SEC on August 8, 2005, SEC File No. 000-19860). |
10.15* | Scholastic Corporation 2011 Stock Incentive Plan (incorporated by reference to the November 30, 2011 10-Q) and Amendment No. 1 to the Scholastic Corporation 2011 Stock Incentive Plan (incorporated by reference to the 2013 10-K). |
10.16* | Form of Restricted Stock Unit Agreement under the Scholastic Corporation 2011 Stock Incentive Plan (incorporated by reference to the November 30, 2011 10-Q). |
10.17* | Form of Stock Option Agreement under the Scholastic Corporation 2011 Stock Incentive Plan (incorporated by reference to the November 30, 2011 10-Q). |
10.18* | Severance Agreement, dated September 26, 2013, between Scholastic Corporation and Maureen O’Connell(incorporated by reference to the Corporation’s Form 10-Q as filed with the SEC on December 19, 2013, SEC File No. 000-19860)(the “November 30, 2013 Form 10-Q”). |
10.19* | Scholastic Corporation 2013 Executive Performance Incentive Plan (incorporated by reference to the November 30, 2013 Form 10-Q). |
10.20 | Landlord’s Offer Notice dated October 16, 2013 and Company’s Acceptance Letter dated December 13, 2013 (incorporated by reference to the Corporation’s Current Report on Form 8-K as filed with the SEC on December 19, 2013, SEC File No. 000-19860). |
10.21 | Purchase and Sale Agreement between ISE 555 Broadway, LLC (as Seller) and Scholastic Inc. (as Purchaser) dated January 21, 2014 (incorporated by reference to the Corporation’s Form 10-Q as filed with the SEC on March 27, 2014, SEC File No. 000-19860). |
21 | Subsidiaries of the Corporation, as of July 22, 2014. |
23 | Consent of Ernst & Young LLP. |
31.1 | Certification of the Chief Executive Officer of the Corporation filed pursuant to Section 302 of the Sarbanes-Oxley Act of 2002. |
31.2 | Certification of the Chief Financial Officer of the Corporation filed pursuant to Section 302 of the Sarbanes-Oxley Act of 2002. |
32 | Certifications of the Chief Executive Officer and the Chief Financial Officer of the Corporation pursuant to Section 906 of the Sarbanes-Oxley Act of 2002. |
101.INS | XBRL Instance Document ** |
101.SCH | XBRL Taxonomy Extension Schema Document ** |
101.CAL | XBRL Taxonomy Extension Calculation Document ** |
101.DEF | XBRL Taxonomy Extension Definitions Document ** |
101.LAB | XBRL Taxonomy Extension Labels Document ** |
101.PRE | XBRL Taxonomy Extension Presentation Document ** |
- 86-
* | The referenced exhibit is a management contract or compensation plan or arrangement described in Item 601(b) (10) (iii) of Regulation S-K. |
** | In accordance with Regulation S-T, the XBRL-related information in Exhibit 101 to this Annual Report on Form 10-K shall be deemed to be “furnished” and not “filed.” |
- 87-
Signatures
Pursuant to the requirements of Section 13 or 15(d) of the Securities Exchange Act of 1934, the Registrant has duly caused this report to be signed on its behalf by the undersigned, thereunto duly authorized.
Dated: | July 29, 2014 | SCHOLASTIC CORPORATION |
By: /s/ Richard Robinson | ||
Richard Robinson, Chairman of the Board, President and Chief Executive Officer | ||
Power of Attorney
KNOW ALL MEN BY THESE PRESENTS, that each person whose signature appears below constitutes and appoints Richard Robinson his or her true and lawful attorney-in-fact and agent, with power of substitution and resubstitution, for him or her and in his or her name, place and stead, in any and all capacities, to sign any and all amendments to this Annual Report on Form 10-K, and to file the same, with all exhibits thereto, and other documents in connection therewith, with the Securities and Exchange Commission, granting unto said attorney-in-fact and agent full power and authority to do and perform each and every act and thing necessary and requisite to be done, as fully and to all the intents and purposes as he might or could do in person, hereby ratifying and confirming all that said attorney-in-fact and agent may lawfully do or cause to be done by virtue hereof.
Pursuant to the requirements of the Securities Exchange Act of 1934, this report has been signed below by the following persons on behalf of the Registrant and in the capacities and on the dates indicated.
Signature | Title | Date | ||
/s/ Richard Robinson | Chairman of the Board, President and Chief Executive Officer and Director (principal executive officer) | July 29, 2014 | ||
Richard Robinson | ||||
/s/ Maureen O’Connell | Executive Vice President, Chief Administrative Officer and Chief Financial Officer (principal financial officer) | July 29, 2014 | ||
Maureen O’Connell | ||||
/s/ Robert M. Gibney | Senior Vice President, Chief Accounting Officer (principal accounting officer) | July 29, 2014 | ||
Robert M. Gibney | ||||
/s/ James W. Barge | Director | July 29, 2014 | ||
James W. Barge | ||||
/s/ Marianne Caponnetto | Director | July 29, 2014 | ||
Marianne Caponnetto | ||||
/s/ John L. Davies | Director | July 29, 2014 | ||
John L. Davies | ||||
/s/ Andrew S. Hedden | Director | July 29, 2014 | ||
Andrew S. Hedden | ||||
- 88-
Signature | Title | Date | ||
/s/ Mae C. Jemison | Director | July 29, 2014 | ||
Mae C. Jemison | ||||
/s/ Peter M. Mayer | Director | July 29, 2014 | ||
Peter M. Mayer | ||||
/s/ John G. McDonald | Director | July 29, 2014 | ||
John G. McDonald | ||||
/s/ Augustus K. Oliver | Director | July 29, 2014 | ||
Augustus K. Oliver | ||||
/s/ Richard M. Spaulding | Director | July 29, 2014 | ||
Richard M. Spaulding | ||||
/s/ Margaret A. Williams | Director | July 29, 2014 | ||
Margaret A. Williams | ||||
- 89-
Scholastic Corporation
Financial Statement Schedule
ANNUAL REPORT ON FORM 10-K
YEAR ENDED MAY 31, 2014
ITEM 15(c)
S-1
Schedule II
Valuation and Qualifying Accounts and Reserves
(Amounts in millions) Years ended May 31, | ||||||||||||||||
Balance at Beginning of Year | Expensed | Write-Offs and Other | Balance at End of Year | |||||||||||||
2014 | ||||||||||||||||
Allowance for doubtful accounts | $ | 19.3 | $ | 8.2 | $ | 10.2 | $ | 17.3 | ||||||||
Reserve for returns | 26.4 | 58.0 | 57.0 | (1) | 27.4 | |||||||||||
Reserves for obsolescence | 90.3 | 25.1 | 28.3 | 87.1 | ||||||||||||
Reserve for royalty advances | 81.5 | 6.5 | 1.0 | 87.0 | ||||||||||||
2013 | ||||||||||||||||
Allowance for doubtful accounts | $ | 25.9 | $ | 6.8 | $ | 13.4 | $ | 19.3 | ||||||||
Reserve for returns | 57.5 | 50.2 | 81.3 | (1) | 26.4 | |||||||||||
Reserves for obsolescence | 90.8 | 27.2 | 27.7 | 90.3 | ||||||||||||
Reserve for royalty advances | 77.8 | 4.7 | 1.0 | 81.5 | ||||||||||||
2012 | ||||||||||||||||
Allowance for doubtful accounts | $ | 22.3 | $ | 12.3 | $ | 8.7 | $ | 25.9 | ||||||||
Reserve for returns | 33.0 | 81.8 | 57.3 | (1) | 57.5 | |||||||||||
Reserves for obsolescence | 82.2 | 48.1 | 39.5 | 90.8 | ||||||||||||
Reserve for royalty advances | 71.8 | 6.5 | 0.5 | 77.8 | ||||||||||||
(1) | Represents actual returns charged to the reserve |
S-2