Attached files
UNITED STATES
SECURITIES AND EXCHANGE COMMISSION
Washington, D.C. 20549
FORM 10-K
ANNUAL REPORT PURSUANT TO SECTION 13 OR 15(d) OF THE
SECURITIES EXCHANGE ACT OF 1934
For the fiscal year ended May 31, 2014
OR
TRANSITION REPORT PURSUANT TO SECTION 13 OR 15(d) OF THE
SECURITIES EXCHANGE ACT OF 1934
For the transition period from to
Commission File No. 001-16111

GLOBAL PAYMENTS INC.
(Exact name of registrant as specified in charter)
Georgia | 58-2567903 | |
(State or other jurisdiction of incorporation or organization) | (I.R.S. Employer Identification No.) | |
10 Glenlake Parkway, North Tower, Atlanta, Georgia | 30328-3473 | |
(Address of principal executive offices) | (Zip Code) | |
Registrant's telephone number, including area code: 770-829-8000
Securities registered pursuant to Section 12(b) of the Act:
Title of each class | Name of each exchange on which registered | |
Common Stock, No Par Value | New York Stock Exchange | |
Securities registered pursuant to Section 12(g) of the Act:
NONE
(Title of Class)
Indicate by check mark if the registrant is a well-known seasoned issuer, as defined in Rule 405 of the Securities Act. Yes x No o
Indicate by check mark if the registrant is not required to file reports pursuant to Section 13 or 15(d) of the Act. Yes o No x
Indicate by check mark whether the registrant (1) has filed all reports required to be filed by Section 13 or 15(d) of the Securities Exchange Act of 1934 during the preceding 12 months (or for such shorter period that the registrant was required to file such reports), and (2) has been subject to such filing requirements for the past 90 days. Yes x No o
Indicate by check mark whether the registrant has submitted electronically and posted on its corporate web site, if any, every Interactive Data File required to be submitted and posted pursuant to Rule 405 of Regulation S-T (§ 232.405 of this chapter) during the preceding 12 months (or for such shorter period that the registrant was required to submit and post such files). Yes x No o
Indicate by check mark if disclosure of delinquent filers pursuant to Item 405 of Regulation S-K (§ 229.405 of this chapter) is not contained herein, and will not be contained, to the best of registrant's knowledge, in definitive proxy or information statements incorporated by reference in Part III of this Form 10-K or any amendment to this Form 10-K. Yes o No x
Indicate by check mark whether the registrant is a large accelerated filer, an accelerated filer, a non-accelerated filer, or a smaller reporting company. See the definitions of “large accelerated filer,” “accelerated filer” and “smaller reporting company” in Rule 12b-2 of the Exchange Act.
Large accelerated filer x Accelerated filer o
Non-accelerated filer o Smaller reporting company o
(Do not check if a smaller reporting company)
Indicate by check mark whether the registrant is a shell company (as defined in Rule 12b-2 of the Act). Yes o No x
The aggregate market value of the voting and non-voting common equity held by non-affiliates computed by reference to the price at which the common equity was last sold, or the average bid and asked price of such common equity, as of the last business day of the registrant's most recently completed second fiscal quarter was $4,432,452,060.
The number of shares of the registrant's common stock outstanding at July 25, 2014 was 68,184,530 shares.
DOCUMENTS INCORPORATED BY REFERENCE
Specifically identified portions of the registrant's proxy statement for the 2014 annual meeting of shareholders are incorporated by reference in Part III.
GLOBAL PAYMENTS INC.
2014 FORM 10-K ANNUAL REPORT
Page | |||
PART I | |||
ITEM 1. | |||
ITEM 1A. | |||
ITEM 2. | |||
ITEM 3. | |||
PART II | |||
ITEM 5. | |||
ITEM 6. | |||
ITEM 7. | |||
ITEM 7A. | |||
ITEM 8. | |||
ITEM 9. | |||
ITEM 9A. | |||
ITEM 9B. | |||
PART III | |||
ITEM 10. | |||
ITEM 11. | |||
ITEM 12. | |||
ITEM 13. | |||
ITEM 14. | |||
PART IV | |||
ITEM 15. | |||
2
CAUTIONARY NOTICE REGARDING
FORWARD-LOOKING STATEMENTS
Unless the context requires otherwise, references in this report to "Global Payments," the "Company," "we," "our" or "us," refer to Global Payments Inc. its subsidiaries.
We believe that it is important to communicate our plans for and expectations about the future to our shareholders and to the public. Some of the statements we use in this report, and in some of the documents we incorporate by reference in this report, contain forward-looking statements concerning our business operations, economic performance and financial condition, including in particular: our business strategy and means to implement the strategy; measures of future results of operations, such as revenue, expenses, operating margins, income tax rates, and earnings per share; other operating metrics such as shares outstanding and capital expenditures; our success and timing in developing and introducing new products or services and expanding our business; and the successful integration of future acquisitions. You can sometimes identify forward looking-statements by our use of the words "believes," "anticipates," "expects," "intends," "plan," "forecast," "guidance" and similar expressions. For these statements, we claim the protection of the safe harbor for forward-looking statements contained in the Private Securities Litigation Reform Act of 1995.
Although we believe that the plans and expectations reflected in or suggested by our forward-looking statements are reasonable, those statements are based on a number of assumptions, estimates, projections or plans that are inherently subject to significant risks, uncertainties and contingencies, many of which are beyond our control, cannot be foreseen and reflect future business decisions that are subject to change. Accordingly, we cannot guarantee you that our plans and expectations will be achieved. Our actual revenues, revenue growth rates and margins, other results of operations and shareholder values could differ materially from those anticipated in our forward-looking statements as a result of many known and unknown factors, many of which are beyond our ability to predict or control. Important factors that may cause actual events or results to differ materially from those anticipated by our forward-looking statements include our ability to safeguard our data; increased competition from non-traditional competitors; our ability to update our products and services in a timely manner; potential systems interruptions or failures; software defects or undetected errors; our ability to maintain Visa and MasterCard registration and financial institution sponsorship; our reliance on financial institutions to provide clearing services in connection with our settlement activities; our potential failure to comply with card network requirements; increased attrition of merchants, referral partners or independent sales organizations; our ability to increase our share of existing markets and expand into new markets; unanticipated increases in chargeback liability; increases in credit card network fees; changes in laws, regulations or network rules or interpretations thereof; foreign currency exchange and interest rate risks; political, economic and regulatory changes in the foreign countries in which we operate; future performance, integration and conversion of acquired operations; loss of key personnel; and other risk factors presented in Item 1A - Risk Factors of this Annual Report on Form 10‑K, which we advise you to review. These cautionary statements qualify all of our forward-looking statements, and you are cautioned not to place undue reliance on these forward-looking statements.
Our forward-looking statements speak only as of the date they are made and should not be relied upon as representing our plans and expectations as of any subsequent date. While we may elect to update or revise forward-looking statements at some time in the future, we specifically disclaim any obligation to publicly release the results of any revisions to our forward-looking statements.
3
PART I
ITEM 1- BUSINESS
Recent Developments
Financial Highlights
In the year ended May 31, 2014, or fiscal 2014, our revenue increased 7.5% to $2,554.2 million from $2,375.9 million in the year ended May 31, 2013, or fiscal 2013. This increase in revenue was due to growth driven by our U.S. direct channels, including the addition of recently acquired Payment Processing, Inc. ("PayPros"), as well as growth in Canada, our European markets and the Asia Pacific region.
Consolidated operating income was $405.5 million for fiscal 2014, compared to $357.2 million for fiscal 2013. Consolidated operating income includes a processing system intrusion credit of $7.0 million for fiscal 2014 and a charge of $36.8 million for fiscal 2013. Net income attributable to Global Payments increased $29.2 million, or 13.5%, to $245.3 million in fiscal 2014 from $216.1 million in the prior year, resulting in a $0.61 increase in diluted earnings per share to $3.37 in fiscal 2014 from $2.76 in fiscal 2013.
North America merchant services segment revenue increased $103.3 million, or 6.1%, to $1,809.0 million in fiscal 2014 from $1,705.7 million in fiscal 2013. North America merchant services segment operating income increased to $272.3 million in fiscal 2014 from $258.9 million in fiscal 2013, with operating margins of 15.0% and 15.2% for fiscal 2014 and 2013, respectively.
International merchant services segment revenue increased $75.0 million, or 11.2%, to $745.2 million in fiscal 2014 from $670.2 million in fiscal 2013. International merchant services segment operating income also increased to $240.2 million in fiscal 2014 from $211.2 million in fiscal 2013, with operating margins of 32.2% and 31.5% for fiscal 2014 and 2013, respectively.
On February 28, 2014, we closed a five-year senior unsecured $1,250.0 million term loan and a $1,000.0 million revolving credit facility with a syndicate of financial institutions. The proceeds from the term loan were used to repay the outstanding balance of the previously existing term loan and credit facility and to partially fund the acquisition of PayPros on March 4, 2014.
See “Item 7 - Management's Discussion and Analysis of Financial Condition and Results of Operations” for a detailed explanation of our operating results.
Acquisition of PayPros
On March 4, 2014, we completed the acquisition of PayPros for $420.0 million in cash plus $7.7 million in cash for working capital, subject to adjustment based on a final determination of working capital. We funded the acquisition with a combination of cash on hand and proceeds from our new debt facilities discussed above. PayPros, based in California, is a provider of fully-integrated payment solutions for small-to-medium sized merchants in the United States. PayPros delivers its products and services through a network of technology-based enterprise software partners to vertical markets that are complementary to the markets served by Accelerated Payment Technologies ("APT"), which we acquired on October 1, 2012. See Note 4 - Business and Intangible Asset Acquisitions and Joint Ventures in the notes to consolidated financial statements for further discussion.
Business Description
Global Payments is one of the largest worldwide providers of payment solutions for merchants, value-added resellers, enterprise software providers, financial institutions, government agencies, multi-national corporations and independent sales organizations ("ISOs") located throughout North America, Europe and the Asia-Pacific region and in Brazil. We provide payment and digital commerce solutions and operate in two business segments, North America merchant services and International merchant services. We were incorporated in Georgia as Global Payments Inc. in September 2000, and we spun-off from our former parent company on January 31, 2001. Including our time as part of our former parent company, we have been in the payments business since 1967.
4
Our North America merchant services and International merchant services segments target customers in many vertical industries including financial institutions, gaming, government, health care, professional services, restaurants, retail, universities, nonprofit organizations and utilities. See Note 14 - Segment Information in the notes to consolidated financial statements for additional segment information and “Item 1A - Risk Factors” for a discussion of risks involved with our operations.
Merchant Services Overview
Our merchant acquiring services are similar around the world in that we enable our merchant customers to accept check, card, electronic and digital-based payments at the point of sale. Our primary business model provides payment products and services directly to merchants as our end customers. We also provide similar products and services to financial institutions and a limited number of ISOs that, in turn, resell our products and services, in which case the financial institutions and select ISOs are our end customers.
The term “merchant” generally refers to any organization that accepts credit or debit cards for the payment of goods and services. We sell our services through multiple sales channels around the world and target customers in many vertical industries. Card-based payment forms consist of credit, debit, gift, stored value and electronic benefits transfer cards. Credit and debit card transaction processing includes the processing of the world's major international card brands, including American Express, China UnionPay ("CUP"), Discover Card (“Discover”), JCB, MasterCard, Visa and non-traditional payment methods, as well as certain domestic debit networks, such as Interac in Canada. Electronic and digital-based payment processing involves a consumer or cardholder acquiring goods or services from a merchant and using a credit or debit card or other electronic or digital method as the form of payment. Our comprehensive offerings include terminal sales and deployment, authorization processing, settlement and funding processing, full customer support and help desk functions, chargeback resolution, industry compliance, Payment Card Industry ("PCI") security, consolidated billing and statements and on-line reporting. Our value proposition is to provide high quality, responsive, secure and full end-to-end service to all of our customers. Currently, we focus on merchant customers in the United States, Canada, Brazil, the United Kingdom, Spain, the Republic of Malta, the Czech Republic, the Russian Federation and the Asia-Pacific region.
The majority of merchant services revenue is generated on services priced as a percentage of transaction value or a specified fee per transaction, depending on card type. We also charge other fees based on specific services that are unrelated to the number or value of transactions.
Credit and Debit Card Transaction Processing
Credit and debit networks establish uniform regulations that govern much of the payment card industry. During a typical payment transaction, the merchant and the card issuer do not interface directly with each other, but instead rely on merchant acquirers like Global Payments to facilitate transaction processing. We perform a series of services including authorization, electronic draft capture, file transfers to facilitate funds settlement and certain exception-based, back office support services such as chargeback and retrieval resolution.
We process funds settlement under two models, a sponsorship model and a direct membership model. Under the sponsorship model, we are designated as a Merchant Service Provider by MasterCard and an ISO by Visa. To be designated as a certified processor, member clearing banks ("Member") sponsor us and require our adherence to the standards of the networks. In certain markets, we have sponsorship or depository and clearing agreements with financial institution sponsors. These agreements allow us to route transactions under the Members' control and identification numbers to clear credit card transactions through MasterCard and Visa. In this model, the standards of the card networks restrict us from performing funds settlement or accessing merchant settlement funds, and, instead, require that these funds be in the possession of the Member until the merchant is funded.
Under the direct membership model, we are direct members in various payment networks, allowing us to process and fund transactions without third-party sponsorship. In this model, we route and clear transactions directly through the card brand’s network and are not restricted from performing funds settlement. Otherwise, we process these transactions similarly to how we process transactions in the sponsorship model. We are required to adhere to the standards of the various networks in which we are direct members. We maintain relationships with financial institutions, which may also serve as our Member sponsors for other card brands or in other markets, to assist with funds settlement. In fiscal 2014, we increased the number of markets in which we are Members in certain of the payment networks, and we intend to continue to pursue membership in additional markets in the future.
5
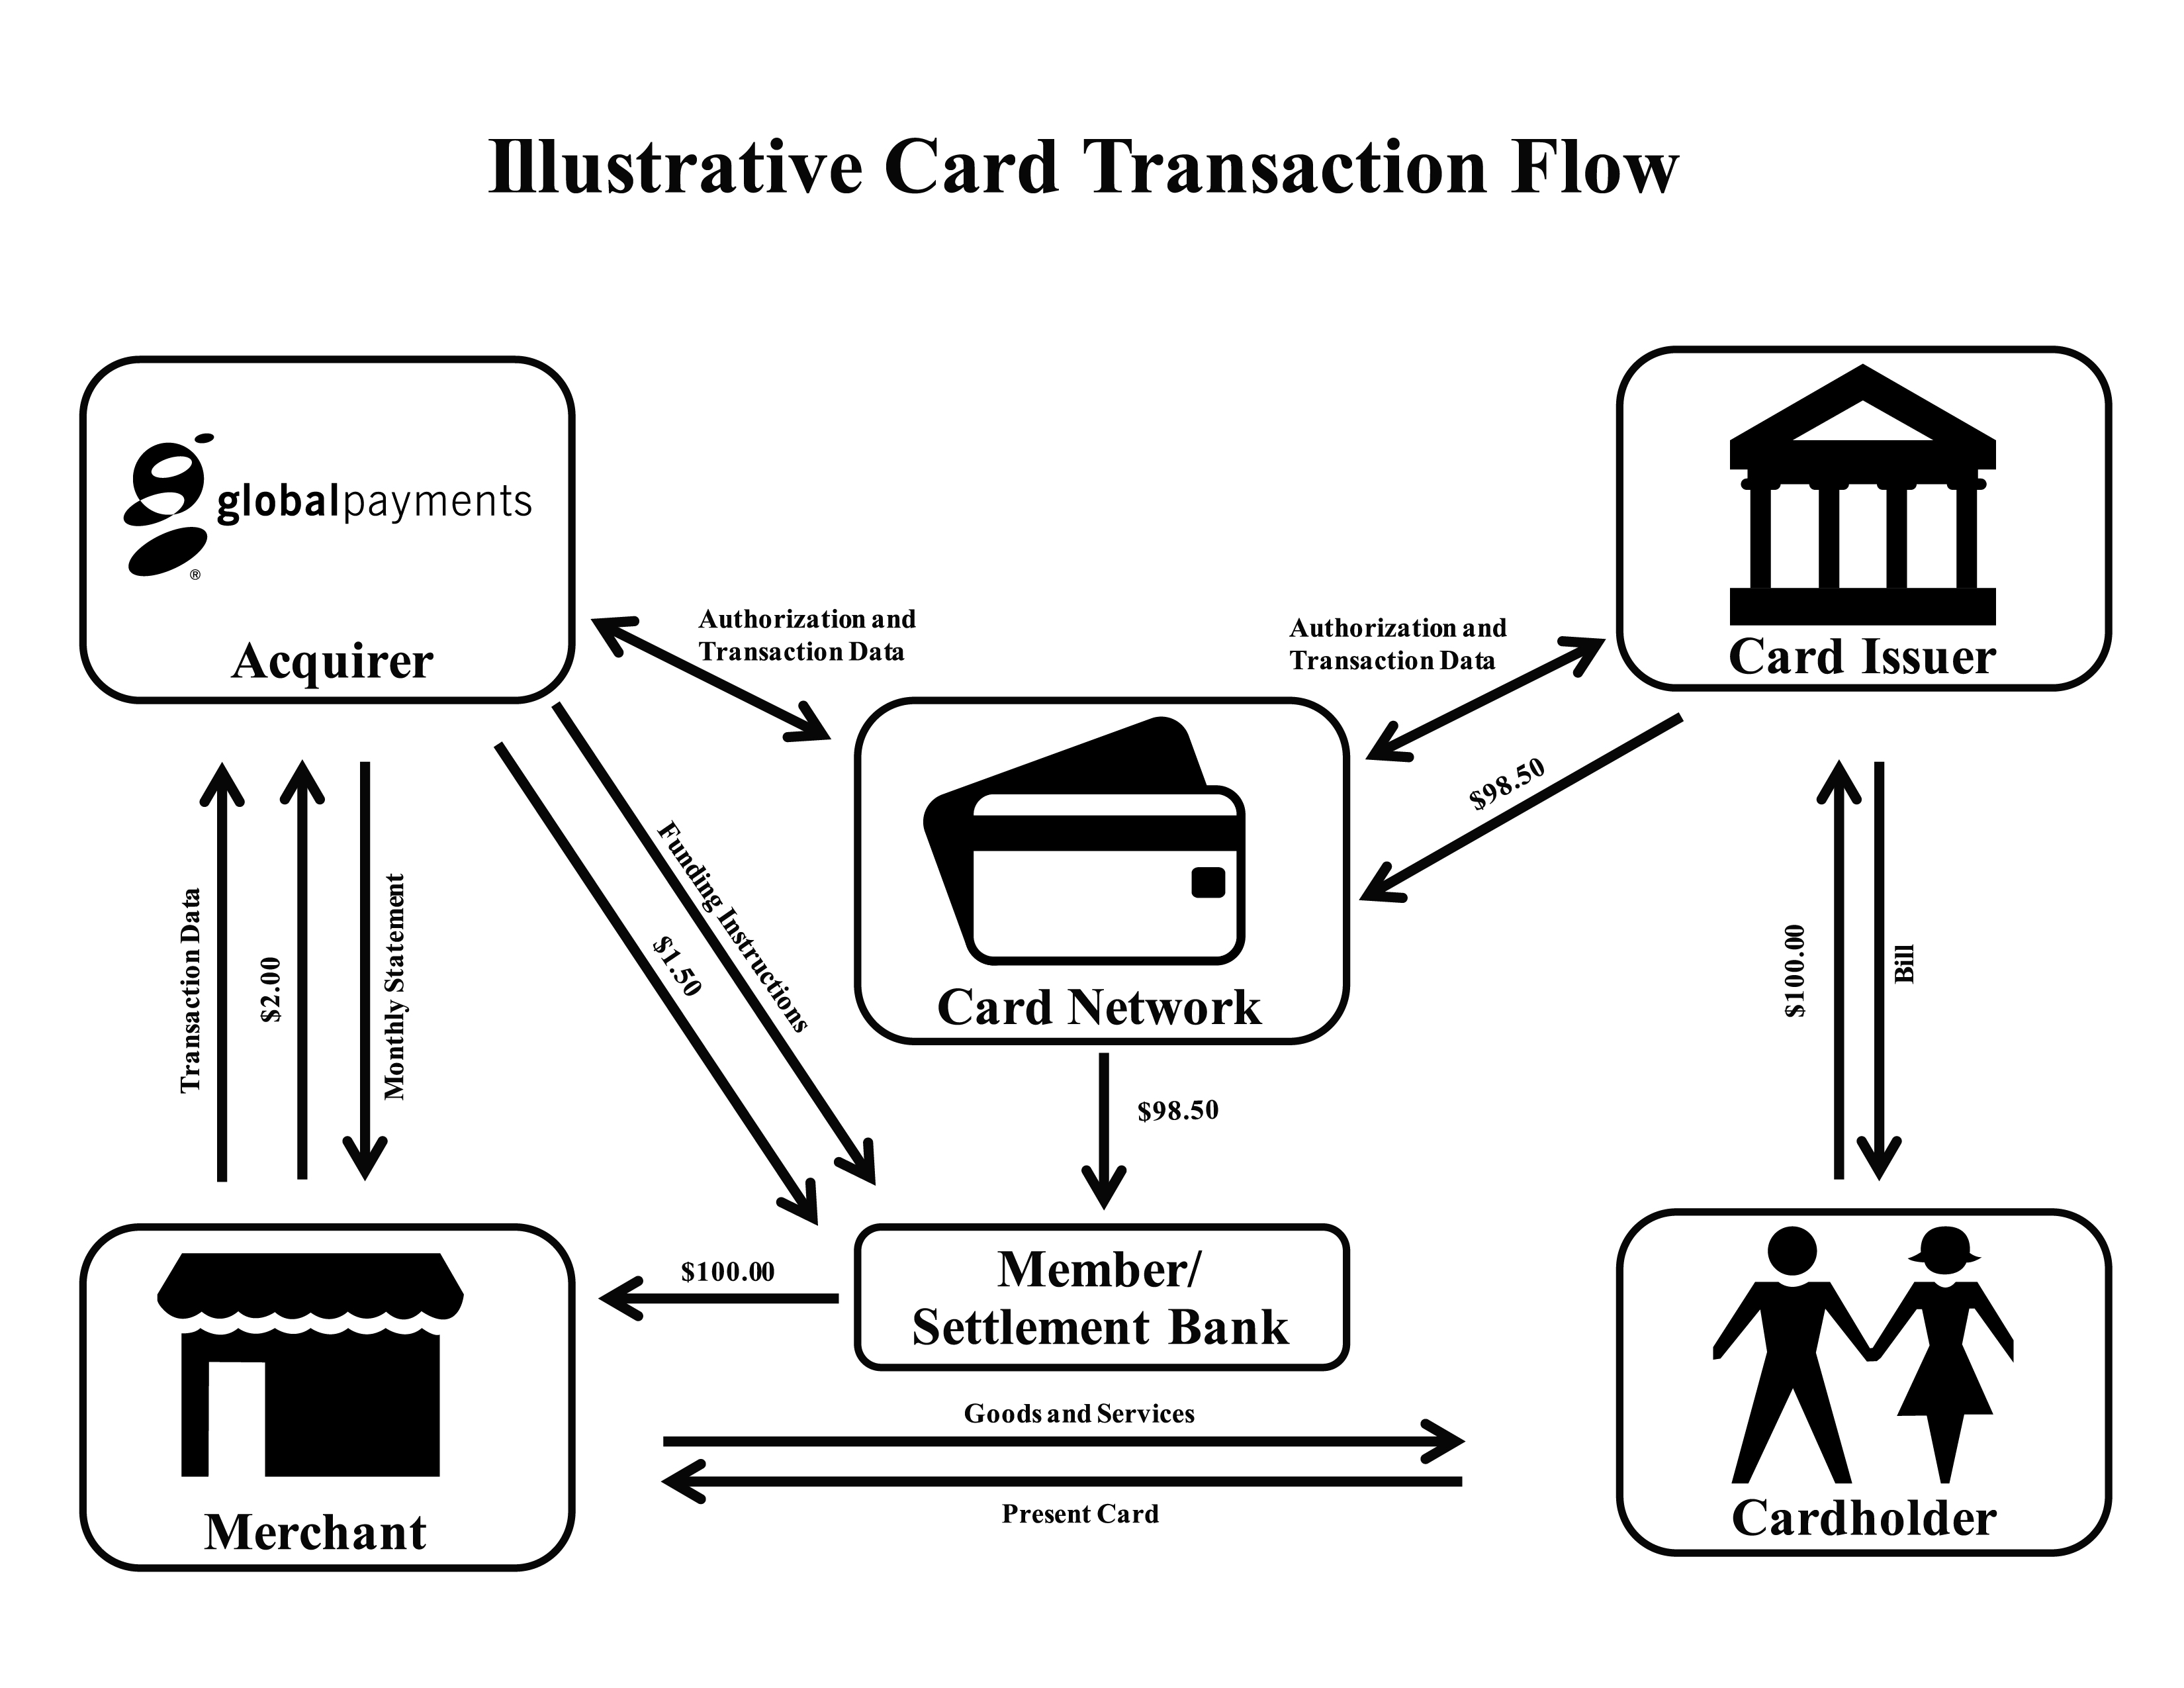
How a Card Transaction Works
A typical payment transaction begins when a cardholder presents a card for payment at a merchant location where the card information is captured by a point of sale ("POS") terminal card reader or mobile device card reader, which may be sold, leased, or rented, and serviced by Global Payments. Alternatively, card and transaction information may be captured and transmitted to our network through a POS device by one of a number of products that we offer directly or through a value added reseller (“VAR”). The terminal electronically records sales draft information, such as the card identification number, transaction date and value of the goods or services purchased.
After the card and transaction information is captured by the POS device, the terminal automatically connects to our network through the internet or other communication channels in order to receive authorization of the transaction. For a credit card transaction, authorization services generally refer to the process in which the card issuer indicates whether a particular credit card is authentic and whether the impending transaction value will cause the cardholder to exceed defined credit limits. In a debit card transaction, the Company obtains authorization for the transaction from the card issuer through the payment network verifying that the cardholder has sufficient funds for the transaction.
As an illustration, shown below, on a $100.00 credit card transaction, the card issuer may fund the Member (indirectly through the card network) $98.50 after retaining approximately $1.50 referred to as an interchange fee or interchange expense. The card issuer seeks reimbursement of $100.00 from the cardholder in the cardholder's monthly credit card bill. The Member would, in turn, pay the merchant $100.00. The net settlement after this transaction would require Global Payments to advance the Member $1.50. After the end of the month, we would bill the merchant a percentage of the transaction, or discount, to cover the full amount of the interchange fee and our net revenue from the transaction. If our discount rate for the merchant in the above example was 2.00%, we would bill the merchant $2.00 at the end of the month for the transaction, reimburse ourselves for approximately $1.50 in interchange fees and retain $0.50 or 0.50% as our net revenue for the transaction. Discount rates vary based on negotiations with merchants and the economic characteristics of transactions. Interchange rates also vary based on the economic characteristics of individual transactions. Accordingly, our net revenue per transaction varies across our merchant base and is subject to change based on changes in discount rates and interchange rates. Our profit on the transaction reflects the net revenue less operating expenses, including assessments and other network fees, systems cost to process the transaction and commissions paid to our sales force or ISO. Assessments are fees charged by Visa and MasterCard based on the dollar value of transactions processed through their networks.
6
Business Segments
North America Merchant Services Segment
North America merchant services revenues represent 70.8% of our total consolidated fiscal 2014 revenues and include operations in the United States and Canada. In the United States, we sell our services via a direct sales force utilizing referral partners of agent banks and trade associations, integrated payment technology, agent and enterprise software providers and VAR referral arrangements, ISOs, as well as proprietary telesales groups.
Direct Sales. Our direct sales channel receives qualified leads from agent banks and trade association referral partners for a variety of mid-sized to large merchants with annual bankcard volume averaging above $300,000. Our merchant portfolio is also expanded through targeted campaigns and other lead-generating efforts by our direct sales force. Our referral partners are paid referral fees.
Integrated Payment Solutions. Our integrated payment solutions channel, which includes APT and PayPros, sells integrated payment technologies to more than 60 vertical markets, gaining market share by signing new enterprise solution providers and new merchants within existing enterprise solution providers already supported by the Company.
Independent Sales Organizations. Our ISO channel targets a variety of merchant types with typical annual bankcard volumes of $150,000 or less. ISOs contract with Global Payments to provide processing and other services depending on the ISOs' requirements. These contracts are multi-year and priced by service on a per transaction basis. The ISOs act as a third-party sales group selling Global Payments-branded merchant acquiring products and services, with the majority of Global Payments' ISOs marketing direct merchant acquiring. Because Global Payments is a primary party to the merchant contract as a result of our bank sponsor relationship or card network membership, the full amount of fees collected from the merchant, net of interchange fees, is recorded as revenue. The excess of revenue earned over our cost to process the transaction plus the ISO contractual transaction fee is remitted to the ISO in the form of a residual payment on a monthly basis and is recorded in sales, general and administrative expenses.
Gaming and Check Services. Our U.S. revenue also includes gaming and check services. As part of our direct merchant service offering, we offer a comprehensive suite of cash access solutions to the gaming vertical market. These solutions include both traditional and electronic check cashing, credit and debit card cash advance and other services specific this market. Our VIP LightSpeed proprietary software platform allows customers of casinos in U.S. and Canada fast access to cash with high limits so that gaming establishments can increase the flow of money to their gaming floors and reduce risk. We derive revenue from our gaming products primarily based on a percentage of the transaction value.
We also offer our merchant customers check verification and guarantee service. The majority of check services involve providing check guarantee services for checks received by merchants. Under the guarantee service, when a merchant receives a check in payment for goods and services, the transaction is submitted and analyzed by the Company. The Company either approves or declines the check for warranty coverage under its guarantee service. If the Company approves the check for warranty coverage and the merchant accepts the check, the merchant will either deposit the check in its bank account or, as in the majority of instances, process it for settlement through the Company's electronic check acceptance service. When an approved check or electronic debit is returned unpaid by the merchant's bank, the Company pays the merchant the face value of the check and, as the assignee of the check, the Company pursues collection of the amount of the check from the checkwriter. As a result, the Company bears the risk of loss if the Company is unable to collect the returned check from the checkwriter. We earn a fee for each guaranteed check, which generally is determined as a percentage of the check amount.
Indirect Merchant Services. In the indirect merchant services channel, we provide merchant services to financial institutions and a limited number of ISOs that, in turn, resell our products and services.
International Merchant Services Segment
International merchant services revenues represent 29.2% of our total consolidated fiscal 2014 revenues and are derived from operations in Europe and the Asia-Pacific region. Our business in Europe is primarily located in the United Kingdom, Spain, the Republic of Malta, the Czech Republic and the Russian Federation. Our Asia-Pacific region includes the following eleven countries and territories: Brunei, China, Hong Kong, India, Macau, Malaysia, Maldives, the Philippines, Singapore, Sri Lanka and Taiwan. We have a direct sales force in the United Kingdom, Spain, the Republic of Malta, the Russian Federation and the Asia-Pacific region through which we primarily sell our direct merchant acquiring services while leveraging our bank referral relationships. In the Czech Republic and the Russian Federation, we also provide indirect merchant acquiring services.
7
See Note 14 - Segment Information in the notes to our consolidated financial statements for information about each segment's operating income and assets.
Total revenues from our segments, by region, are as follows (in thousands):
Year Ended May 31, | |||||||||||
2014 | 2013 | 2012 | |||||||||
Revenues: | |||||||||||
United States | $ | 1,488,659 | $ | 1,394,675 | $ | 1,234,818 | |||||
Canada | 320,333 | 311,000 | 332,434 | ||||||||
North America merchant services | 1,808,992 | 1,705,675 | 1,567,252 | ||||||||
Europe | 587,463 | 522,593 | 489,300 | ||||||||
Asia-Pacific | 157,781 | 147,655 | 147,295 | ||||||||
International merchant services | 745,244 | 670,248 | 636,595 | ||||||||
Consolidated revenues | $ | 2,554,236 | $ | 2,375,923 | $ | 2,203,847 | |||||
Our foreign operations subject us to various risks, including, without limitation, currency exchange risks and political, economic and regulatory risks. See Item 1A - Risk Factors for additional information about these risks.
Industry Overview
Competition
We are a leading mid-market and small-market merchant acquirer in the United States, where we compete primarily with Bank of America Merchant Services, Chase Paymentech, Elavon, First Data Corporation, Heartland Payment Systems, Vantiv, and Wells Fargo.
We have significant market share in Canada, where we compete primarily with Chase Paymentech Solutions, Moneris Solutions, and TD Merchant Services. Moneris Solutions is a joint venture between the Bank of Montreal and the Royal Bank of Canada.
In the Europe and the Asia-Pacific regions, financial institutions remain the primary providers of payment processing services to merchants, although the outsourcing of merchant processing services to third-party service providers is becoming more prevalent. Processing services have become increasingly complex, requiring significant capital commitments to develop, maintain and update the systems necessary to provide these advanced services at a competitive price.
In the United Kingdom, we believe we hold the number three market position compared to our primary competitors Barclays and WorldPay. In Spain, where we hold the number one market share position, our primary competitors are Banco Bilbao Vizcaya Argentaria, S.A., Banco Popular, Caja Madrid, and Santander. We believe we hold the number one market share position among nonbank processors in the Russian Federation, which is a highly fragmented payments market. Our competitors include various financial institutions, such as Raiffeisen Bank, Russian Standard Bank, Sberbank, and VTB. In the Czech Republic, our primary competitors are Euronet, First Data Corporation, and SiNSYS. In the Asia-Pacific region, our primary competitors include financial institutions that offer merchant acquiring services in each of our eleven markets.
Emerging Trends
As a result of continued growth in our industry, several large merchant acquirers, including us, have expanded operations both domestically and internationally in the form of acquisitions and the creation of alliances and joint ventures. We believe that the electronic payment transaction processing industry will continue to consolidate as banks and independent processors that lack the necessary infrastructure may look to exit the business.
We believe that electronic and digital-based payment transactions will continue to grow in the future and that an increasing percentage of these transactions will be processed through emerging technologies. To help reduce transaction costs and accelerate the transaction approval process, we have integrated new technologies into our service offerings, such as internet protocol communications and check truncation or conversion at the point of sale. In order to support and integrate payments into our merchants' various business solutions utilized through VARs, we created a developer portal simplifying the payment enablement
8
process with multiple VARs. We are also able to offer our customers integrated e-commerce solutions. Through our VAR relationships, we have several products that support radio frequency identification for contactless payment cards as well as near field communication enabled smartphones that contain mobile wallet software, which position us to participate in mobile payments. We also offer customers the ability to accept payments utilizing a mobile device as a point of sale terminal. As mobile payments continue to evolve and are desired by merchants and consumers, we intend to continue partnering and developing new products and services that will leverage the benefits that these new technologies can offer our customers. We also believe that new markets will continue to develop in areas that have been previously dominated by paper-based transactions. We expect industries such as e-commerce, healthcare, education, government, recurring payments and business-to-business to continue to see transaction volumes migrate to more electronic-based settlement solutions. We believe that the continued development of new products and services and the emergence of new vertical markets will be a factor in the growth of our business for the foreseeable future.
Strategy
We seek to leverage the adoption of, and transition to, card, electronic and digital-based payments by expanding market share in our existing markets through our distribution channels and through acquisitions while also seeking to enter new markets through acquisitions around the world. We intend to continue to invest in and leverage our technology infrastructure and our people to increase our penetration in existing markets.
Our objectives include the following:
• | Grow and control our direct distribution by adding new merchants and partners; |
• | Deliver innovative products and services by developing value-added applications, enhancing existing products and developing new systems and services to blend technology with customer needs; |
• | Leverage technology and operational advantages throughout our global footprint; |
• | Continue to develop seamless multinational solutions for leading global customers; |
• | Provide customer service at levels that exceed our competition, while investing in technology, training and product enhancements; and |
• | Pursue potential domestic and international acquisitions of, investments in, and alliances with companies that have high growth potential or significant market presence. |
Safeguarding Our Business
Privacy and security are central to our service. We work with information security and forensics firms and employ advanced technologies to investigate and address issues related to processing system security. We also work with industry third parties, regulators and law enforcement to resolve security incidents and assist in efforts to prevent unauthorized access to our processing system.
In early March 2012, we identified and self-reported unauthorized access into a limited portion of our North America card processing system and potential unauthorized access to servers containing personal information collected from U.S. merchants who applied for processing services. As a result of this event, certain card networks temporarily removed us from their lists of Payment Card Industry Data Security Standards (“PCI DSS”) compliant service providers. After remediating our processes and systems, we returned to the lists of PCI DSS compliant service providers in the third quarter of fiscal 2013, and we have received reports on compliance covering all of our systems. We did not experience any material loss of revenue that we can confirm was related to this event. However, any future intrusion could potentially have a negative impact on future revenues. See Note 2 - Processing System Intrusion in the notes to consolidated financial statements for additional processing system intrusion information.
Employees
As of May 31, 2014, we had 4,135 employees. Many of our employees are highly skilled in technical areas specific to electronic transaction payment processing. We believe that our current and future operations depend substantially on retaining our key employees.
9
Regulation
Various aspects of our business are subject to regulation and supervision under federal, state and local laws in the United States, as well as foreign laws and regulations. In addition, we are subject to rules promulgated by the various payment networks, including Visa, MasterCard, Discover, American Express, CUP and Interac; the Payment Services Directive in Europe; as well as a variety of other regulations, including escheat laws and applicable privacy and information security regulations. Because we provide data processing services to banks and other financial institutions, we are subject to examination by the Federal Financial Institutions Examination Council (the "FFIEC"). Set forth below is a brief summary of some of the significant laws and regulations that apply to us. These descriptions are not exhaustive and are qualified in their entirety by reference to the particular statutory or regulatory provision.
The Dodd-Frank Act
In July 2010, President Obama signed into law the Dodd-Frank Wall Street Reform and Consumer Protection Act of 2010 (the “Dodd-Frank Act”), which resulted in significant structural and other changes to the regulation of the financial services industry. The Dodd-Frank Act directed the Board of Governors of the Federal Reserve (the “Federal Reserve Board”) to regulate the debit interchange transaction fees that a card issuer or payment card network receives or charges for an electronic debit transaction. Pursuant to Section 1075 of the Dodd-Frank Act (commonly referred to as the “Durbin Amendment”), these fees must be “reasonable and proportional” to the cost incurred by the card issuer in authorizing, clearing and settling the transaction. Effective in October 2011, pursuant to regulations promulgated by the Federal Reserve Board, debit interchange rates for card issuers with assets of $10 billion or more are capped at $0.21 per transaction and an ad valorem component of 5 basis points to reflect a portion of the issuer's fraud losses plus, for qualifying issuers, an additional $0.01 per transaction in debit interchange for fraud prevention costs. The cap on interchange fees has not had a material direct impact on the Company’s results of operations.
In addition, the rules contain prohibitions on network exclusivity and merchant routing restrictions that require a card issuer to enable at least two unaffiliated networks on each debit card, prohibit card networks from entering into exclusivity arrangements, and restrict the ability of issuers or networks to mandate transaction routing requirements. The prohibition on network exclusivity arrangements took effect in October 2011 for payment card networks and in April 2012 for most debit card issuers. The prohibition on network exclusivity arrangements was effective for certain health and benefit cards and general-use prepaid cards in April 2013. We do not expect the prohibition on network exclusivity to significantly impact our ability to pass on network fees and other costs to our customers.
The Dodd-Frank Act also created the Financial Stability Oversight Council (the “FSOC”), which was established to, among other things, identify risks to the stability of the U.S. financial system. The FSOC has the authority to require supervision and regulation of nonbank financial companies that the FSOC determines pose a systemic risk to the U.S. financial system. At this point, it is unclear whether the Company would be subject to additional systemic risk-related oversight.
Payment Network Rules
We are subject to the rules of MasterCard, Visa, Discover, CUP, Interac and other payment networks. In order to provide our transaction processing services, several of our subsidiaries are registered with MasterCard and Visa as service providers for member institutions and with other networks. Accordingly, we are subject to card association and network rules that could subject us to a variety of fines or penalties that may be levied by the card networks for certain acts or omissions.
Banking Laws and Regulations
The FFIEC is an interagency body comprised of the federal bank and credit union regulators (i.e. the Federal Reserve Board, the Federal Deposit Insurance Corporation, the National Credit Union Administration, the Office of the Comptroller of the Currency and the Bureau of Consumer Financial Protection). The FFIEC examines large data processors in order to identify and mitigate risks associated with systemically significant service providers, including specifically the risks they may pose to the banking industry. In addition, we are subject to Directive 2007/64/EC in the European Union (the “Payment Services Directive”), which was implemented in most European Union member states through national legislation. As a result of this legislation, we are subject to regulation and oversight in certain European Union member nations, including the requirement that we maintain specified regulatory capital; however, these regulatory capital requirements are generally insignificant to our total assets and total equity and have no material effect on our liquidity.
10
Privacy and Information Security Laws
We provide services that may be subject to various state, federal and foreign privacy laws and regulations. These laws and regulations include the federal Gramm-Leach-Bliley Act of 1999, which applies to a broad range of financial institutions and to companies that provide services to financial institutions, including the check and gaming portion of our business. We are also subject to a variety of foreign data protection and privacy laws, including, without limitation, Directive 95/46/EC, as implemented in each member state of the European Union. Among other things, these foreign and domestic laws, and their implementing regulations, restrict the collection, processing, storage, use and disclosure of personal information, require notice to individuals of privacy practices, and provide individuals with certain rights to prevent use and disclosure of protected information. These laws also impose requirements for safeguarding and removal or elimination of personal information. Certain state laws also restrict our ability to collect and utilize certain types of information such as Social Security and driver's license numbers.
Anti-money Laundering and Counter Terrorist Requirements
Certain portions of our business are subject to anti-money laundering laws and regulations, including the Bank Secrecy Act, as amended by the USA PATRIOT Act of 2001 (collectively, the “BSA”). The BSA, among other things, requires money services businesses to develop and implement risk-based anti-money laundering programs, report large cash transactions and suspicious activity and maintain transaction records. Regulations issued by the Office of Foreign Assets Control (“OFAC”) of the U.S. Department of Treasury place prohibitions and restrictions on all U.S. citizens and entities, including the Company, with respect to transactions by U.S. persons with specified countries and individuals and entities identified on OFAC's Specially Designated Nationals list (for example, individuals and companies owned or controlled by, or acting for or on behalf of, countries subject to certain economic and trade sanctions, as well as terrorists, terrorist organizations and narcotics traffickers identified by OFAC under programs that are not country specific). Similar requirements apply to transactions and dealings with persons and entities specified in lists maintained in other countries. We have developed procedures and controls that are designed to monitor and address legal and regulatory requirements and developments and that allow our customers to protect against having direct business dealings with such prohibited countries, individuals or entities.
Debt Collection Laws
The check and gaming portion of our business is subject to the Fair Debt Collection Practices Act and similar state laws in connection with our check guarantee and recovery services, which guarantee the payment of checks or collection of returned checks on behalf of certain merchants. These laws are designed to eliminate abusive, deceptive and unfair debt collection practices and require licensing at the state level. We have procedures in place to comply with the requirements of these laws and are licensed in a number of states in order to engage in collection in those states.
Escheat Laws
We are subject to unclaimed or abandoned property laws in the United States and in foreign countries that require us to transfer to certain government authorities the unclaimed property of others that we hold when that property has been unclaimed for a certain period of time. Moreover, we are subject to audit by state regulatory authorities with regard to our escheatment practices.
Foreign Laws and Regulations
We are subject to foreign laws and regulations that affect the electronic payments industry in each of the foreign countries in which we operate. Some of these countries, such as the Russian Federation and Spain, have undergone significant political, economic and social change in recent years. In these countries, there is a greater risk of new, unforeseen changes that could result from, among other things, instability or changes in a country’s or region’s economic conditions; changes in laws or regulations or in the interpretation of existing laws or regulations, whether caused by a change in government or otherwise; increased difficulty of conducting business in a country or region due to actual or potential political or military conflict; or action by the European Union or the United States, Canada or other governments that may restrict our ability to transact business in a foreign country or with certain foreign individuals or entities, such as sanctions by or against the Russian Federation.
Where to Find More Information
We file annual and quarterly reports, proxy statements and other information with the U.S. Securities and Exchange Commission (the "SEC"). You may read and print materials that we have filed with the SEC from its website at www.sec.gov. In addition, certain of our SEC filings, including our annual reports on Form 10-K, our quarterly reports on Form 10-Q, our current reports on Form 8-K and amendments to them can be viewed and printed from the investor information section of our
11
website at www.globalpaymentsinc.com free of charge. Certain materials relating to our corporate governance, including our codes of ethics applicable to our directors, senior financial officers and other employees, are also available in the investor information section of our website. Copies of our filings, specified exhibits and corporate governance materials are also available, free of charge, by writing us using the address on the cover of this Annual Report on Form 10-K. You may also telephone our investor relations office directly at (770) 829-8234. We are not including the information on our website as a part of, or incorporating it by reference into, this report.
Our SEC filings may also be viewed and copied at the following SEC public reference room and at the offices of the New York Stock Exchange, where our common stock is quoted under the symbol “GPN.”
SEC Public Reference Room
100 F Street, N.E.
Washington, DC 20549
(You may call the SEC at 1-800-SEC-0330 for further information on the public reference room.)
NYSE Euronext
20 Broad Street
New York, NY 10005
12
ITEM 1A- RISK FACTORS
An investment in our common stock involves a high degree of risk. You should consider carefully the following risks and other information contained in this Annual Report on Form 10-K and other SEC filings before you decide whether to buy our common stock. The risks identified below are not all encompassing but should be considered in establishing an opinion of our future operations. If any of the events contemplated by the following discussion of risks should occur, our business, results of operations and financial condition could suffer significantly. As a result, the market price of our common stock could decline and you may lose all or part of the money you paid to buy our common stock.
Risks Related to Our Business and Operations
Inability to safeguard our data from continually evolving cybersecurity risks or other technological risks could affect our reputation among our merchant clients and cardholders and may expose us to penalties, fines, liabilities and legal claims.
Under the card network rules and various national and state laws, we are responsible for information provided to us by merchants, ISOs, third-party service providers and other agents (all of which we refer to as “associated third parties”), which we require in order to approve merchant accounts, process transactions and for the purpose of fraud prevention. This information includes confidential data such as: bankcard numbers, names, addresses, Social Security numbers, driver's license numbers and bank account numbers. We process the data and deliver our products and services by utilizing computer systems and telecommunications networks which are operated both by us and by third-party service providers. We have the ultimate liability to the card networks and their member financial institutions for our failure or the failure of our associated third parties to protect this information. While plans and procedures are in place to protect this sensitive data, we cannot be certain that these measures will be successful and will be sufficient to counter all current and emerging technology threats which are designed to breach our systems in order to gain access to confidential information.
Our computer systems have been, and could be in the future, subject to penetration, and our data protection measures may not prevent unauthorized access. Threats to our systems and our associated third parties’ systems can derive from human error, fraud or malice on the part of employees or third parties, or may result from accidental technological failure. Computer viruses can be distributed and could infiltrate our systems or those of our associated third parties. In addition, denial of service or other attacks could be launched against us for a variety of purposes, including to interfere with our services or create a diversion for other malicious activities.
Our defensive measures may not prevent unauthorized access or use of sensitive data. While we maintain first- and third-party insurance coverage that may cover certain aspects of cyber risks, such insurance coverage may be insufficient to cover all losses.
We could also be subject to liability for claims relating to misuse of personal information, such as unauthorized marketing purposes and violation of data privacy laws. We generally require that our agreements with service providers who have access to merchant and customer data include confidentiality obligations but we cannot be certain that these contractual requirements are always followed or that they will always prevent the unauthorized use or disclosure of data. In addition, we have agreed in certain agreements to take certain protective measures to ensure the confidentiality of merchant and consumer data. The costs of systems and procedures associated with such protective measures may increase and could adversely affect our ability to compete effectively. Any failure to adequately enforce or provide these protective measures could result in liability, protracted and costly litigation and, with respect to misuse of personal information of our merchants and consumers, lost revenue and reputational harm.
Any type of security breach or other misuse of data described above or otherwise could harm our reputation and deter existing and prospective customers from using our products and services or from making electronic payments generally, increase our operating expenses in order to contain and remediate the breach, expose us to unbudgeted or uninsured liability, disrupt our operations (including potential service interruptions), distract our management, increase our risk of regulatory scrutiny, result in the imposition of penalties and fines under state, federal and foreign laws or by the card networks, and adversely affect our continued card network registration and financial institution sponsorship. Our removal from networks' lists of PCI DSS compliant service providers could mean that existing merchant customers, sales partners or other third parties may cease using or referring our products and services. Also, prospective merchant customers, sales partners or other third parties may choose to terminate negotiations with us, or delay or choose not to consider us for their processing needs. In addition, the card networks could refuse to allow us to process through their networks.
For example, in March 2012, we identified and self-reported unauthorized access into a limited portion of our North America card processing system and potential unauthorized access to servers containing personal information collected from U.S. merchants who applied for processing services. As a result of this event, certain card networks temporarily removed us from their lists of
13
PCI DSS compliant service providers. After remediating our processes and systems, we returned to the lists of PCI DSS compliant service providers in the third quarter of fiscal 2013. We incurred approximately $114.2 million of cumulative expenses, net of insurance recoveries, relating to the incident. The impact on revenue of terminations that we can confirm related to our temporary removal from the lists was immaterial. Also, the impact on revenue of merchants, sales partners or other third parties who have failed to renew, terminated negotiations or informed us they are not considering us at all, where we can confirm it is due to our removal from the lists, was immaterial. This event has resulted in inquiries from governmental entities and investigation by the Federal Trade Commission ("FTC").
The payment processing industry is highly competitive, and some of our competitors are larger and have greater financial and operational resources than we do, which may give them an advantage in our market with respect to the pricing of products and services offered to our customers and the ability to develop new technologies.
We operate in the electronic payments market, which is highly competitive. In this market, our primary competitors include other independent payment processors, as well as financial institutions, ISOs and, potentially, card networks. Many of our competitors are companies that are larger than we are, with greater financial and operational resources than we have. Our competitors that are financial institutions or subsidiaries of financial institutions do not incur the costs associated with being sponsored by a direct member for participation in the card networks and may be able to settle transactions more quickly for merchants than we can. These financial institutions may also provide payment processing services to merchants at a loss in order to generate banking fees from the merchants. It is also possible that larger financial institutions could decide to perform in-house some or all of the services which we currently provide or could provide. These attributes may provide them with a competitive advantage in the market. Higher than expected attrition could negatively affect our results, which could have a material adverse effect on our business, financial condition and results of operations.
Furthermore, we are facing increasing competition from non-traditional competitors who offer certain innovations in payment methods. Some of these competitors utilize proprietary software and service solutions. Others partner with traditional merchant acquirers to provide tablet-based solutions with payment processing services. Some of these non-traditional competitors have significant financial resources and robust networks and are highly regarded by consumers. In addition, some non-traditional competitors, such as private companies or startup companies, may be less risk averse than we are and, therefore, may be able to respond more quickly to market demands. If these non-traditional competitors gain a greater share of total electronic payments transactions, it could have a material adverse effect on our business, financial condition and results of operations. These competitors may compete in ways that minimize or remove the role of traditional card networks, processors and/or point-of-sale software in the electronic payments process.
In order to remain competitive and to continue to increase our revenues and earnings, we must continually and quickly update our products and services, a process which could result in increased costs and the loss of revenues, earnings and customers if the new products and services do not perform as intended or are not accepted in the marketplace.
The electronic payments markets in which we compete are characterized by rapid technological change, new product introductions, evolving industry standards and changing customer needs. In order to remain competitive, we are continually involved in a number of projects, including the development of a new authorization platform, mobile payment applications, e-commerce services and other new offerings emerging in the electronic payments industry. These projects carry the risks associated with any development effort, including cost overruns, delays in delivery and performance problems. In the electronic payments markets, these risks are even more acute. Any delay in the delivery of new products or services or the failure to differentiate our products and services could render them less desirable to our customers, or possibly even obsolete. Furthermore, as the market for alternative payment processing products and services evolves, it may develop too rapidly or not rapidly enough for us to recover the costs we have incurred in developing new products and services targeted at this market.
In addition, the products and services we deliver to the electronic payments markets are designed to process very complex transactions and deliver reports and other information on those transactions, all at very high volumes and processing speeds. Any failure to deliver an effective and secure product or any performance issue that arises with a new product or service could result in significant processing or reporting errors or other losses. As a result of these factors, our development efforts could result in increased costs that could reduce our earnings in addition to a loss of revenue and earnings if promised new products are not timely delivered to our customers or do not perform as anticipated. We rely in part on third parties, including some of our competitors and potential competitors, for the development of and access to new technologies.
Our future success will depend in part on our ability to develop or adapt to technological changes and evolving industry standards, and our failure to do so could have a material adverse effect on our business, operating results, and financial condition. For example, “EMV” is a credit and debit card authentication methodology using integrated circuit cards (or “chip cards”) that Visa, MasterCard, American Express and Discover mandated that U.S. processors be able to support as of April 2013 and that
14
merchants be able to support by October 2015. We have invested, and may continue to invest, significant resources to develop and implement support for EMV before the applicable deadlines. We are not certain if or when our merchants will use or accept the methodology, or if and when issuers will provide EMV cards to consumers in significant volumes.
Our revenues from the sale of services to merchants that accept Visa cards and MasterCard cards are dependent upon our continued Visa and MasterCard registration and financial institution sponsorship and, in some cases, continued membership in certain card networks.
In order to provide our Visa and MasterCard transaction processing services, we must be either a direct participant or be registered as a merchant processor or service provider of Visa and MasterCard. Registration as a merchant processor or service provider is dependent upon our being sponsored by Members of both organizations. If our sponsor banks should stop providing sponsorship for us, we would need to find another financial institution to provide those services or we would need to attain direct membership with the card networks, either of which could prove to be difficult and expensive. If we are unable to find a replacement financial institution to provide sponsorship or attain direct membership, we may no longer be able to provide processing services to affected customers, which would negatively impact our revenues and earnings. Furthermore, some agreements with our bank sponsors give them substantial discretion in approving certain aspects of our business practices, including our solicitation, application and qualification procedures for merchants and the terms of our agreements with merchants. Our bank sponsors' discretionary actions under these agreements could have a material adverse effect on our business, financial condition and results of operations. In connection with direct membership, the rules and regulations of various card associations and networks prescribe certain capital requirements. Any increase in the capital level required would limit our use of capital for other purposes.
We rely on various financial institutions to provide clearing services in connection with our settlement activities. If we are unable to maintain clearing services with these financial institutions and are unable to find a replacement, our business may be adversely affected.
We rely on various financial institutions to provide clearing services in connection with our settlement activities. If such financial institutions should stop providing clearing services, we must find other financial institutions to provide those services. If we are unable to find a replacement financial institution we may no longer be able to provide processing services to certain customers, which could negatively impact our revenue and earnings.
If we fail to comply with the applicable requirements of the card networks, they could seek to fine us, suspend us or terminate our registrations. If our merchants or ISOs incur fines or penalties that we cannot collect from them, we could end up bearing the cost of such fines or penalties.
We are subject to card association and network rules that could subject us to a variety of fines or penalties that may be levied by the card networks for certain acts or omissions. The rules of the card networks are set by their boards, which may be influenced by card issuers, and some of those issuers are our competitors with respect to these processing services. Many banks directly or indirectly sell processing services to merchants in direct competition with us. These banks could attempt, by virtue of their influence on the networks, to alter the networks' rules or policies to the detriment of non-members like us. The termination of our registrations or our status as a service provider or a merchant processor, or any changes in card association or other network rules or standards, including interpretation and implementation of the rules or standards, that increase the cost of doing business or limit our ability to provide transaction processing services to our customers, could have a material adverse effect on our business, operating results and financial condition. If a merchant or an ISO fails to comply with the applicable requirements of the card associations and networks, it could be subject to a variety of fines or penalties that may be levied by the card associations or networks. If we cannot collect such amounts from the applicable merchant or ISO, we could end up bearing such fines or penalties, resulting in lower earnings for us. The termination of our registration, or any changes in the Visa or MasterCard rules that would impair our registration, could require us to stop providing Visa and MasterCard payment processing services, which would make it impossible for us to conduct our business on its current scale.
Our systems and our third-party providers' systems may fail, which could interrupt our service, cause us to lose business, increase our costs and expose us to liability.
We depend on the efficient and uninterrupted operation of our computer systems, software, data centers and telecommunications networks, as well as the systems and services of third parties. In addition, we have undertaken the relocation of our primary data center. We have entered into agreements related to this relocation and for the ongoing management of the data center.
A system outage or data loss could have a material adverse effect on our business, financial condition and results of operations. Not only would we suffer damage to our reputation in the event of a system outage or data loss, but we may also be liable to third
15
parties. Our systems and operations or those of our third-party providers could be exposed to damage or interruption from, among other things, fire, natural disaster, power loss, telecommunications failure, terrorist acts, war, unauthorized entry, human error, and computer viruses or other defects. Defects in our systems or those of third parties, errors or delays in the processing of payment transactions, telecommunications failures, or other difficulties (including those related to system relocation) could result in loss of revenue, loss of customers, loss of merchant and cardholder data, harm to our business or reputation, exposure to fraud losses or other liabilities, negative publicity, additional operating and development costs, fines and other sanctions imposed by card networks, and/or diversion of technical and other resources.
We may experience software defects, undetected errors, and development delays, which could damage customer relations, decrease our potential profitability and expose us to liability.
Our products are based on sophisticated software and computing systems that often encounter development delays and the underlying software may contain undetected errors, viruses or defects. Defects in our software products and errors or delays in our processing of electronic transactions could result in additional development costs, diversion of technical and other resources from our other development efforts, loss of credibility with current or potential customers, harm to our reputation and exposure to liability claims.
In addition, we rely on technologies and software supplied by third parties that may also contain undetected errors, viruses or defects that could have a material adverse effect on our business, financial condition and results of operations.
Increased merchant, referral partner or ISO attrition could cause our financial results to decline.
We experience attrition in merchant credit and debit card processing volume resulting from several factors, including business closures, transfers of merchants' accounts to our competitors, unsuccessful contract renewal negotiation and account closures that we initiate for various reasons, such as heightened credit risks or contract breaches by merchants. If an ISO partner switches to another transaction processor, terminates our services, internalizes payment processing functions that we perform, merges with or is acquired by one of our competitors, or shuts down or becomes insolvent, we may no longer receive new merchant referrals from the ISO, and we risk losing existing merchants that were originally enrolled by the ISO. We cannot predict the level of attrition in the future and it could increase. Our referral partners are a significant source of new business. Higher than expected attrition could negatively affect our results, which could have a material adverse effect on our business, financial condition and results of operations.
In order for us to continue to grow and increase our profitability, we must continue to expand our share of the existing electronic payments markets and also expand into new markets.
Our future growth and profitability depend upon our continued expansion within the markets in which we currently operate, the further expansion of these markets, the emergence of other markets for electronic transaction payment processing and our ability to penetrate these markets. As part of our strategy to achieve this expansion, we look for acquisition opportunities, investments and alliance relationships with other businesses that will allow us to increase our market penetration, technological capabilities, product offerings and distribution capabilities. We may not be able to successfully identify suitable acquisition, investment and alliance candidates in the future, and if we do, they may not provide us with the value and benefits we anticipate.
Our expansion into new markets is also dependent upon our ability to apply our existing technology or to develop new applications to meet the particular service needs of each new market. We may not have adequate financial or technological resources to develop effective and secure products and distribution channels that will satisfy the demands of these new markets. If we fail to expand into new and existing electronic payments markets, we may not be able to continue to grow our revenues and earnings.
There may be a decline in the use of cards as a payment mechanism for consumers or adverse developments with respect to the card industry in general.
If consumers do not continue to use credit or debit cards as a payment mechanism for their transactions or if there is a change in the mix of payments between cash, credit cards, and debit cards, which is adverse to us, it could have a material adverse effect on our business, financial condition, and results of operations. Consumer credit risk may make it more difficult or expensive for consumers to gain access to credit facilities such as credit cards. Regulatory changes may result in financial institutions seeking to charge their customers additional fees for use of credit or debit cards. Such fees may result in decreased use of credit or debit cards by cardholders. In each case, our business, financial condition and results of operations may be adversely affected. We believe future growth in the use of credit and debit cards and other electronic payments will be driven by the cost, ease-of-use, and quality of products and services offered to consumers and businesses. In order to consistently increase and maintain our
16
profitability, consumers and businesses must continue to use electronic payment methods that we process, including credit and debit cards.
We incur chargeback liability when our merchants refuse or cannot reimburse chargebacks resolved in favor of their customers. We cannot accurately anticipate these liabilities, which may adversely affect our results of operations and financial condition.
In the event a dispute between a cardholder and a merchant is not resolved in favor of the merchant, the transaction is normally “charged back” to the merchant and the purchase price is credited or otherwise refunded to the cardholder. If we are unable to collect such amounts from the merchant's account or reserve account (if applicable), or if the merchant refuses or is unable, due to closure, bankruptcy or other reasons, to reimburse us for a chargeback, we bear the loss for the amount of the refund paid to the cardholder. The risk of chargebacks is typically greater with those merchants that promise future delivery of goods and services rather than delivering goods or rendering services at the time of payment. We may experience significant losses from chargebacks in the future. Any increase in chargebacks not paid by our merchants could have a material adverse effect on our business, financial condition and results of operations. We have policies to manage merchant-related credit risk and often mitigate such risk by requiring collateral and monitoring transaction activity. Notwithstanding our programs and policies for managing credit risk, it is possible that a default on such obligations by one or more of our merchants could have a material adverse effect on our business.
Fraud by merchants or others could have an adverse effect on our operating results and financial condition.
We have potential liability for fraudulent electronic payment transactions or credits initiated by merchants or others. Examples of merchant fraud include when a merchant or other party knowingly uses a stolen or counterfeit credit or debit card, card number, or other credentials to record a false sales or credit transaction, processes an invalid card, or intentionally fails to deliver the merchandise or services sold in an otherwise valid transaction. Criminals are using increasingly sophisticated methods to engage in illegal activities such as counterfeiting and fraud. Failure to effectively manage risk and prevent fraud could increase our chargeback liability or cause us to incur other liabilities. It is possible that incidents of fraud could increase in the future. Increases in chargebacks or other liabilities could have a material adverse effect on our operating results and financial condition.
We are subject to economic and political risk, the business cycles and credit risk of our customers and the overall level of consumer, business and government spending, which could negatively impact our business, financial condition and results of operations.
The global electronic payments industry depends heavily on the overall level of consumer, business and government spending. We are exposed to general economic conditions that affect consumer confidence, consumer spending, consumer discretionary income or changes in consumer purchasing habits. A sustained deterioration in general economic conditions in the markets in which we operate or increases in interest rates may adversely affect our financial performance by reducing the number or average purchase amount of transactions made using electronic payments. A reduction in the amount of consumer spending could result in a decrease in our revenue and profits. If our merchants make fewer sales of their products and services using electronic payments or people spend less money per transaction, we will have fewer transactions to process at lower dollar amounts, resulting in lower revenue.
A downturn in the economy could force retailers to close, resulting in exposure to potential credit losses and future transaction declines. Furthermore, credit card issuers may reduce credit limits and be more selective with respect to whom they issue credit cards. We also have a certain amount of fixed and other costs, including rent, debt service, and salaries, which could limit our ability to quickly adjust costs and respond to changes in our business and the economy. Changes in economic conditions could also adversely impact our future revenues and profits and cause a materially adverse effect on our business, financial condition and results of operations.
In addition, a recessionary economic environment could affect our merchants through a higher rate of bankruptcy filings, resulting in lower revenues and earnings for us. Our merchants are liable for any charges properly reversed by the card issuer on behalf of the cardholder. Our associated third parties are also liable for any fines or penalties that may be assessed by any card networks. In the event that we are not able to collect such amounts from our merchants or the associated third parties, due to fraud, breach of contract, insolvency, bankruptcy or any other reason, we may be liable for any such charges.
Reject losses arise from the fact that, in most markets, we collect our fees from our merchants on the first day after the monthly billing period. This results in the build-up of a substantial receivable from our customers. If a merchant has gone out of business during the billing period, we may be unable to collect such fees, which could negatively impact our business, financial condition and results of operations.
17
Increases in credit card network fees may result in the loss of customers or a reduction in our earnings.
From time-to-time, the card networks, including Visa and MasterCard, increase the fees that they charge processors. We could attempt to pass these increases along to our merchant customers, but this strategy might result in the loss of customers to our competitors who do not pass along the increases. If competitive practices prevent us from passing along such increased fees to our merchant customers in the future, we may have to absorb all or a portion of such increases, thereby reducing our net revenues, increasing our operating costs and reducing our earnings.
Any new implementation of or changes made to laws, regulations, card network rules or other industry standards affecting our business in any of the geographic regions in which we operate may require significant development efforts or have an unfavorable impact to our financial results.
Our business is impacted by laws and regulations that affect our industry in the countries in which we operate. Regulation and proposed regulation of the payments industry has increased significantly in recent years. Failure to comply with regulations or guidelines may result in the suspension or revocation of a license or registration, the limitation, suspension or termination of service, and the imposition of civil and criminal penalties, including fines, or may cause customers or potential customers to be reluctant to do business with us, any of which could have an adverse effect on our financial condition. For example, we are subject to the card network rules of Visa, MasterCard and other card networks, Interac, and various debit networks; applicable privacy and information security regulations in the regions where we operate and of the card networks; the Payment Services Directive in Europe; The Code of Conduct for the Credit and Debit Card Industry in Canada (issued by Canada's Department of Finance); Housing Assistance Tax Act of 2008 in the United States, which requires information returns to be made for each calendar year by merchant acquiring entities, along with a myriad of consumer protection laws and escheat regulations. We are also subject to examination by the FFIEC as a result of our provision of data processing services to financial institutions.
Interchange fees (which are typically paid by the acquirer to the issuer in connection with transactions) are subject to increasingly intense legal, regulatory and legislative scrutiny worldwide. For instance, the Dodd-Frank Wall Street Reform and Consumer Protection Act of 2010 (the “Dodd-Frank Act”), which was signed into law in July 2010, significantly changed the U.S. financial regulatory system. Changes affecting the payment processing industry include restricting amounts of debit card fees that certain issuing institutions can charge merchants and allowing merchants to set minimum dollar amounts for the acceptance of credit cards and to offer discounts for different payment methods. These restrictions could negatively affect the number of debit transactions, which would adversely affect our business. The Dodd-Frank Act also created the Consumer Financial Protection Bureau (the “CFPB”), which has assumed responsibility for most federal consumer protection laws, and the Financial Stability Oversight Council, which has the authority to determine whether any nonbank financial company, such as us, should be supervised by the Board of Governors of the Federal Reserve System (the “Federal Reserve”) because it is systemically important to the U.S. financial system. Any such designation would result in increased regulatory burdens on our business, which increases our risk profile and may have an adverse impact on our business, financial condition and results of operations.
In addition, since October 2011, (i) a card payment network may not prohibit a card issuer from contracting with any other card payment network for the processing of electronic debit transactions involving the issuer’s debit cards and (ii) card issuing financial institutions and card payment networks may not inhibit the ability of merchants to direct the routing of debit card transactions over any card payment networks that can process the transactions. Since April 2012, most debit card issuers have been required to enable at least two unaffiliated card payment networks on each debit card. The interchange fee cap has the potential to alter the type or volume of card-based transactions that we process on behalf of our merchants. These new regulations could result in the need for us to make capital investments to modify our services to facilitate our existing merchants’ and potential merchants’ compliance and reduce the fees we are able to charge our merchants. These new regulations also could result in greater pricing transparency and increased price-based competition leading to lower margins and higher rates of merchant attrition. The requirements of the new regulations and the timing of their effective dates could result in changes in our merchants’ business practices that may alter their delivery of their products and services to consumers and the timing of their investment decisions, which could change the demand for our services and alter the type or volume of transactions that we process on behalf of our merchants. Any new rules or regulations implemented by the CFPB or the FSOC or in connection with the Dodd-Frank Act that are applicable to us, or any changes that are adverse to us resulting from litigation brought by third parties challenging such rules and regulations, could increase our cost of doing business or limit permissible activities.
All persons engaged in commerce, including, but not limited to, us and our merchant and financial institution customers, are subject to Section 5 of the FTC Act prohibiting unfair or deceptive acts or practices (“UDAP”). In addition, there are other laws, rules and or regulations, including the Telemarketing Sales Act, that may directly impact the activities of our merchant customers and in some cases may subject us, as the merchant's payment processor, to investigations, fees, fines and disgorgement of funds in the event we are deemed to have aided and abetted or otherwise provided the means and instrumentalities to facilitate the illegal activities of the merchant through our payment processing services. Various federal and state regulatory enforcement
18
agencies, including FTC and the states’ attorneys general have the authority to take action against nonbanks that engage in UDAP or violate other laws, rules or regulations and, to the extent we are processing payments for a merchant that may be in violation of these laws, rules or regulations, we may be subject to enforcement actions and as a result may incur losses and liabilities.
Changes to legal rules and regulations, or interpretation or enforcement thereof, even if not directed at us, may require significant efforts to change our systems and products and may require changes to how we price our services to customers, adversely affecting our business. Even an inadvertent failure to comply with laws and regulations, as well as rapidly evolving social expectations of corporate fairness, could damage our business or our reputation. Furthermore, we are subject to tax laws in each jurisdiction where we conduct business. Changes in such laws or their interpretations could decrease the value of revenues we receive, the value of tax losses and tax credit carry forwards recorded on our balance sheet and have a material adverse effect on our operating results and financial condition.
We are subject to risks associated with changes in interest rates or currency exchange rates, which could adversely affect our business, financial position and results of operations, and we may not effectively hedge against these risks.
We have incurred significant indebtedness that accrues interest at a variable rate, and we may incur additional variable-rate indebtedness in the future. Increases in interest rates will reduce our operating cash flows and could hinder our ability to fund our operations, capital expenditures, acquisitions, share repurchases or dividends. We are also subject to risks related to the changes in currency exchange rates as a result of our investments in foreign operations and from revenues generated in currencies other than the U.S. dollar. Revenue and profit generated by international operations will increase or decrease compared to prior periods as a result of changes in foreign currency exchange rates. Volatility in currency exchange rates has affected and may continue to affect our financial results. For example, for fiscal 2014, currency rate fluctuations decreased our revenues by $10.8 million and our diluted earnings per share by $0.05 as compared to the prior year, calculated by converting our fiscal 2014 actual revenues and expenses at fiscal 2013 rates.
In addition, in certain of the jurisdictions in which we operate, we may become subject to exchange control regulations that might restrict or prohibit the conversion of our foreign currency into U.S. dollars or limit our ability to freely move currency in or out of particular jurisdictions. The occurrence of any of these factors could decrease the value of revenues we receive from our international operations and have a material adverse impact on our business.
We may seek to reduce our exposure to fluctuations in interest rates or foreign currency exchange rates through the use of hedging arrangements. To the extent that we hedge our interest rate or foreign currency exchange rate exposures, we forgo the benefits we would otherwise experience if interest rates or foreign currency exchange rates were to change in our favor. Developing an effective strategy for dealing with movements in interest rates and foreign exchange rates is complex, and no strategy can completely insulate us from risks associated with such fluctuations. In addition, a counterparty to the arrangement could default on its obligation, thereby exposing us to credit risk. We may have to repay certain costs, such as transaction fees or breakage costs, if we terminate these arrangements. Finally, our interest rate and foreign exchange rate risk management activities could expose us to substantial losses if such rates move materially differently from our expectations. As a result, we cannot provide any assurance that our hedging arrangements, if any, will effectively manage our interest rate or foreign currency exchange rate sensitivity or have the desired beneficial impact on our results of operations or financial condition.
We conduct a portion of our business in various European and Asia-Pacific countries, including the Russian Federation, where the risk of continued political, economic and regulatory change that could impact our operating results is greater than in the United States.
We expect to continue to expand our operations into various countries in Europe and the Asia-Pacific region. Some of these countries, and other foreign countries in which we operate, such as the Russian Federation, have undergone significant political, economic and social change in recent years, and the risk of new, unforeseen changes in these countries remains greater than in the United States. Our business, growth, financial condition or results of operations could be materially adversely affected by instability or changes in a country’s or region’s economic conditions; changes in laws or regulations or in the interpretation of existing laws or regulations, whether caused by a change in government or otherwise; increased difficulty of conducting business in a country or region due to actual or potential political or military conflict; or action by the European Union or the United States, Canada or other governments that may restrict our ability to transact business in a foreign country or with certain foreign individuals or entities, such as sanctions by or against the Russian Federation.
In addition, transmittal of data by electronic means and telecommunications is subject to specific regulation in many countries. Although these regulations have not had a material impact on us to date, changes in these regulations, including taxation or limitations on transfers of data between countries, could have a material adverse effect on our business, growth, financial condition or results of operations.
19
The integration and conversion of our acquired operations, or other future acquisitions, if any, could result in increased operating costs if the anticipated synergies of operating both businesses as one are not achieved, a loss of strategic opportunities if management is distracted by the integration process, and a loss of customers if our service levels drop during or following the integration process.
The acquisition, integration, and conversion of businesses involve a number of risks. Core risks are in the area of valuation (negotiating a fair price for the business based on inherently limited diligence) and integration and conversion (managing the complex process of integrating the acquired company's people, products, technology and other assets to realize the projected value of the acquired company and the synergies projected to be realized in connection with the acquisition). In addition, international acquisitions often involve additional or increased risks including, for example: managing geographically separated organizations, systems, and facilities; integrating personnel with diverse business backgrounds and organizational cultures; complying with foreign regulatory requirements; fluctuations in currency exchange rates; enforcement of intellectual property rights in some foreign countries; difficulty entering new foreign markets due to, among other things, customer acceptance and business knowledge of those new markets; and general economic and political conditions.
If the integration and conversion process does not proceed smoothly, the following factors, among others, could reduce our revenues and earnings, increase our operating costs, and result in a loss of projected synergies:
• | If we are unable to successfully integrate the benefits plans, duties and responsibilities, and other factors of interest to the management and employees of the acquired business, we could lose employees to our competitors in the region, which could significantly affect our ability to operate the business and complete the integration; |
• | If the integration process causes any delays with the delivery of our services, or the quality of those services, we could lose customers to our competitors, which would reduce our revenues and earnings; and |
• | The acquisition and the related integration could divert the attention of our management from other strategic matters including possible acquisitions and alliances and planning for new product development or expansion into new electronic payments markets. |
The costs and effects of pending and future litigation, investigations or similar matters, or adverse facts and developments related thereto, could materially affect our business, financial position and results of operations.
We are from time-to-time involved in various litigation matters and governmental or regulatory investigations or similar matters arising out of our current or future business. Our insurance or indemnities may not cover all claims that may be asserted against us, and any claims asserted against us, regardless of merit or eventual outcome, may harm our reputation. Furthermore, there is no guarantee that we will be successful in defending ourselves in pending or future litigation or similar matters under various laws. Should the ultimate judgments or settlements in any pending litigation or future litigation or investigation significantly exceed our insurance coverage, they could have a material adverse effect on our business, financial condition and results of operations.
We may not be able to successfully manage our intellectual property and may be subject to infringement claims.
In our rapidly developing legal framework, we rely on a combination of contractual rights and copyright, trademark, patent and trade secret laws to establish and protect our proprietary technology. Despite our efforts to protect our intellectual property, third parties may infringe or misappropriate our intellectual property or may develop software or technology competitive to us. Our competitors may independently develop similar technology, duplicate our products or services or design around our intellectual property rights. We may have to litigate to enforce and protect our intellectual property rights, trade secrets and know-how or to determine their scope, validity or enforceability, which is expensive and could cause a diversion of resources and may not prove successful. The loss of intellectual property protection or the inability to secure or enforce intellectual property protection could harm our business and ability to compete.
We may also be subject to costly litigation in the event our products and technology infringe upon another party’s proprietary rights. Third parties may have, or may eventually be issued, patents that would be infringed by our products or technology. Any of these third parties could make a claim of infringement against us with respect to our products or technology. We may also be subject to claims by third parties for breach of copyright, trademark or license usage rights. Any such claims and any resulting litigation could subject us to significant liability for damages. An adverse determination in any litigation of this type could limit our ability to use the intellectual property subject to these claims and require us to design around a third party’s patent, which may not be possible, or to license alternative technology from another party, which may be costly. In addition, litigation is time consuming and expensive to defend and could result in the diversion of the time and attention of our management and employees.
20
Continued consolidation in the banking and retail industries could adversely affect our growth.
Historically, the banking industry has been the subject of consolidation, regardless of overall economic conditions, while the retail industry has been the subject of consolidation due to cyclical economic events. Since 2008, there have been multiple bank failures and government-encouraged consolidation. Larger banks and larger merchants with greater transaction volumes may demand lower fees which could result in lower revenues and earnings for us. Our bank alliances and other strategies could also be negatively impacted as a result of consolidations, especially where the banks involved operate competing merchant processing businesses.
Unfavorable resolution of tax contingencies or changes to enacted tax rates could adversely affect our tax expense.
Our tax returns and positions are subject to review and audit by federal, state, local and international taxing authorities. An unfavorable outcome to a tax audit could result in higher tax expense, thereby negatively impacting our results of operations. We have established contingent liabilities for material known tax exposures relating to deductions, transactions and other matters involving some uncertainty as to the proper tax treatment of the item. These liabilities reflect what we believe to be reasonable assumptions as to the likely final resolution of each issue if raised by a taxing authority. While we believe that the liabilities are adequate to cover reasonably expected tax risks, there can be no assurance that, in all instances, an issue raised by a tax authority will be finally resolved at a financial cost less than any related liability. An unfavorable resolution, therefore, could negatively impact our financial position, results of operations and cash flows in the current and/or future periods.
We record deferred income taxes to reflect the impact of temporary differences between the amounts of assets and liabilities for financial accounting and income tax purposes. Deferred income taxes are determined using enacted tax rates. Changes in enacted tax rates may negatively impact our results of operations.
We may become subject to additional U.S., state or foreign taxes that cannot be passed through to our merchant services customers, in which case our earnings could be adversely affected.
Payment processing companies like us may be subject to taxation by various jurisdictions on our net income or certain portions of our fees charged to customers for our services. Application of these taxes is an emerging issue in our industry and the taxing authorities have not yet all adopted uniform regulations on this topic. If we are required to pay such taxes and are not able to pass the tax expense through to our merchant customers, our costs will increase, reducing our earnings.
We have structured our business in accordance with existing tax laws and interpretations of such laws which have been confirmed through either tax rulings or opinions obtained in various jurisdictions, including those related to value added taxes in Europe. Changes in tax laws or their interpretations could decrease the value of revenues we receive and the amount of our cash flow and have a material adverse impact on our business.
Risks Related to Our Organizational and Capital Structure
If we lose key personnel or are unable to attract additional qualified personnel as we grow, our business could be adversely affected.
All of our businesses function at the intersection of rapidly changing technological, social, economic and regulatory developments that requires a wide ranging set of expertise and intellectual capital. To successfully compete and grow, we must recruit, develop and retain the necessary personnel who can provide the needed expertise across the entire spectrum of intellectual capital needs. In addition, we must develop our personnel to fulfill succession plans capable of maintaining continuity in the midst of the inevitable unpredictability of human capital. However, the market for qualified personnel is competitive and we may not succeed in recruiting additional personnel or may fail to effectively replace current personnel who depart with qualified or effective successors. Our efforts to retain and develop personnel may also result in significant additional expenses, which could negatively affect our profitability. We cannot assure that key personnel, including executive officers, will continue to be employed or that we will be able to attract and retain qualified personnel in the future. Failure to retain or attract key personnel could have a material adverse effect on our business, financial condition and results of operations.
21
The Company's debt agreements contain restrictions that will limit the Company's flexibility in operating its business.
Our credit facilities contain various covenants that limit our ability and the ability of our subsidiaries to engage in specified types of transactions. These covenants limit our ability in certain circumstances to, among other things:
• | incur additional indebtedness; |
• | create liens; |
• | consolidate, merge, sell or otherwise dispose of all or substantially all of the Company's assets; |
• | enter into certain lines of business; and |
• | enter into certain transactions with the Company's affiliates. |
Our credit facilities also contain customary financial covenants based on our leverage ratio and our fixed charge coverage ratio.
A breach of any of these covenants could result in a default under one or more of these agreements, including as a result of cross default provisions and, in the case of the revolving credit facility, permit the lenders to cease making loans to us. Upon the occurrence of an event of default under our credit facilities, the lenders could elect to declare all amounts outstanding under our credit facilities to be immediately due and payable and terminate all commitments to extend further credit. Such actions by those lenders could cause cross defaults under certain of our other indebtedness. If we are unable to repay those amounts, the lenders under our credit facilities could accelerate the repayment of borrowings, and we may not have sufficient assets to repay our credit facilities as well as the Company's other indebtedness.
Our balance sheet includes significant amounts of goodwill and intangible assets. The impairment of a significant portion of these assets would negatively affect our business, financial condition, and results of operations.
As a result of our acquisitions, a significant portion of our total assets consist of intangible assets (including goodwill). Goodwill and intangible assets, net of amortization, together accounted for approximately 46.6% and 46.2% of the total assets on our balance sheet as of May 31, 2014 and May 31, 2013, respectively. We may not realize the full value of our intangible assets and goodwill. We expect to engage in additional acquisitions, which may result in our recognition of additional intangible assets and goodwill. We evaluate on a regular basis whether all or a portion of our goodwill and other intangible assets may be impaired. Under current accounting rules, any determination that impairment has occurred would require us to write-off the impaired portion of goodwill and such intangible assets, resulting in a charge to our earnings. An impairment of a significant portion of goodwill or intangible assets could have a material adverse effect on our business, financial condition, and results of operations.
We may not be able to or we may decide not to pay dividends or repurchase shares at a level anticipated by shareholders of our common stock, which could reduce shareholder returns.
The extent to which we pay dividends on our common stock and repurchase our common stock in the future is at the discretion of our Board of Directors and will depend on, among other factors, our earnings, shareholders' equity, cash position, and financial condition. No assurance can be given that we will be able to or will choose to pay any dividends or repurchase any shares in the foreseeable future.
Our risk management policies and procedures may not be fully effective in mitigating our risk exposure in all market environments or against all types of risk.
We operate in a rapidly changing industry. Accordingly, our risk management policies and procedures may not be fully effective to identify, monitor and manage our risks. If our policies and procedures are not fully effective or we are not always successful in capturing all risks to which we are or may be exposed, we may suffer uninsured liability, harm to our reputation or be subject to litigation or regulatory actions that could have a material adverse effect on our business, financial condition and results of operations.
Failure to maintain effective internal controls in accordance with Section 404 of the Sarbanes-Oxley Act could have a material adverse effect on our business and stock price.
Section 404 of the Sarbanes-Oxley Act requires us to evaluate annually the effectiveness of our internal control over financial reporting as of the end of each fiscal year and to include a management report assessing the effectiveness of our internal control over financial reporting in our annual report. If we fail to maintain the adequacy of our internal controls, we may not be able to ensure that we can conclude on an ongoing basis that we have effective internal control over financial reporting in accordance with Section 404 of the Sarbanes-Oxley Act.
22
Further, this assessment may be complicated by any acquisitions we may complete. In certain markets, including, without limitation, China, the Republic of Malta and Spain, our member sponsors perform payment processing operations and related support services pursuant to services agreements. We expect that the member sponsors will continue to provide these services until such time as we may integrate these functions into our operations. Accordingly, we rely on our member sponsors to provide financial data, such as revenue billed to merchants, to assist us with compiling our accounting records. As such, our internal controls over financial reporting could be materially affected, or are reasonably likely to be materially affected, by the internal controls and procedures of our member sponsors in these markets. In order to mitigate this risk, we have implemented internal controls over financial reporting which monitor the accuracy of the financial data being provided by our member sponsors.
While we continue to dedicate resources and management time to ensuring that we have effective internal controls over financial reporting, failure to achieve and maintain an effective internal control environment could have a material adverse effect on the market's perception of our business and our stock price.
Anti-takeover provisions of our articles of incorporation and by-laws and provisions of Georgia law could delay or prevent a change of control that individual shareholders favor.
Provisions of our articles of incorporation and by-laws and provisions of applicable Georgia law may discourage, delay or prevent a merger or other change of control that shareholders may consider favorable. The provisions of our articles and by-laws, among other things:
• | divide our Board of Directors into three classes, with members of each class to be elected in staggered three-year terms; |
• | limit the right of shareholders to remove directors; |
• | regulate how shareholders may present proposals or nominate directors for election at annual meetings of shareholders; and |
• | authorize our Board of Directors to issue preferred shares in one or more series, without shareholder approval. |
ITEM 2- PROPERTIES
The following summarizes by segment the type and number of facilities we use to operate our business as of May 31, 2014:
Type of Facility | Leased | Owned | |||
North America merchant services: | |||||
Multi-purpose (operations, sales, administrative) offices | 13 | — | |||
Sales offices | 1 | — | |||
14 | — | ||||
International merchant services: | |||||
Multi-purpose (operations, sales, administrative) offices | 19 | 3 | |||
Sales offices | 12 | — | |||
31 | 3 | ||||
Total | 45 | 3 | |||
Our principal facilities in the United States are located in Atlanta, Georgia and Owings Mills, Maryland. Our principal international facilities are located in Toronto, Canada; Prague, Czech Republic; Leicester, England; London, England; Hong Kong Special Administrative Region, China; Manila, Philippines; Moscow, Russia; and Barcelona, Spain.
We believe that all of our facilities and equipment are suitable and adequate for our business as presently conducted.
ITEM 3- LEGAL PROCEEDINGS
We are party to a number of claims and lawsuits incidental to our business. In our opinion, the liabilities, if any, which may ultimately result from the outcome of such matters, individually or in the aggregate, are not expected to have a material adverse impact on our financial position, liquidity or results of operations.
23
Part II
ITEM 5- MARKET FOR REGISTRANT'S COMMON EQUITY, RELATED STOCKHOLDER MATTERS AND ISSUER PURCHASES OF EQUITY SECURITIES
Our common stock trades on the New York Stock Exchange under the ticker symbol “GPN.” The table set forth below provides the intraday high and low sales prices and dividends paid per share of our common stock for the four quarters during fiscal 2014 and 2013. We expect to continue to pay our shareholders a dividend per share, on a quarterly basis, in an amount comparable to the dividends indicated in the table. However, any future determination to pay cash dividends will be at the discretion of our Board of Directors and will depend upon our results of operations, financial condition, capital requirements and such other factors as the Board of Directors deems relevant.
High | Low | Dividend Per Share | |||||||||
Fiscal 2014: | |||||||||||
First Quarter | $ | 49.75 | $ | 44.84 | $ | 0.02 | |||||
Second Quarter | 64.41 | 47.35 | 0.02 | ||||||||
Third Quarter | 70.77 | 61.22 | 0.02 | ||||||||
Fourth Quarter | 73.84 | 64.66 | 0.02 | ||||||||
Fiscal 2013: | |||||||||||
First Quarter | $ | 45.10 | $ | 39.37 | $ | 0.02 | |||||
Second Quarter | 44.43 | 41.01 | 0.02 | ||||||||
Third Quarter | 51.24 | 42.99 | 0.02 | ||||||||
Fourth Quarter | 49.90 | 43.37 | 0.02 | ||||||||
As of July 23, 2014, there were 2,162 shareholders of record.
Equity Compensation Plan Information
The information regarding our compensation plans under which equity securities are authorized for issuance is set forth in “Item 12- Security Ownership of Certain Beneficial Owners and Management and Related Stockholder Matters” of this Report.
Sale of Unregistered Securities
We did not issue any unregistered securities during our fiscal year ended May 31, 2014.
24
Stock Performance Graph
The following graph compares our cumulative shareholder returns with the Standard & Poor's Information Technology Index and the Standard & Poor's 500 Index for the five years ended May 31, 2014. The line graph assumes the investment of $100 in our common stock, the Standard & Poor's Information Technology Index and the Standard & Poor's 500 Index on May 31, 2009 and assumes reinvestment of all dividends.
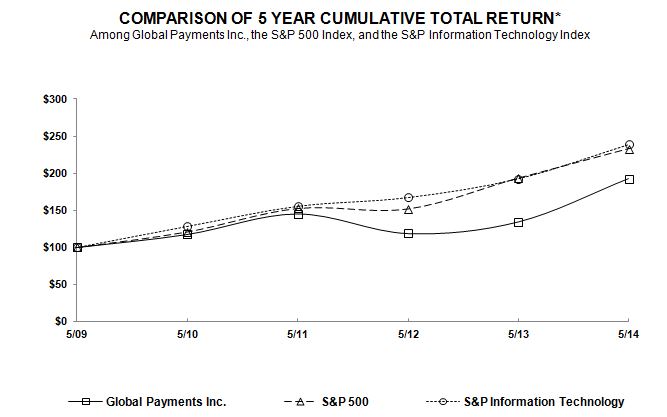
*$100 of 5/31/09 in stock or index, including reinvestment of dividends. Fiscal year ending May 31.
Copyright© 2013 S&P, a division of The McGraw-Hill Companies Inc. All rights reserved.
Global Payments | S&P 500 | S&P Information Technology | |||||||||
May 31, 2009 | $ | 100.00 | $ | 100.00 | $ | 100.00 | |||||
May 31, 2010 | 117.53 | 120.99 | 128.47 | ||||||||
May 31, 2011 | 145.01 | 152.39 | 155.62 | ||||||||
May 31, 2012 | 118.76 | 151.76 | 167.40 | ||||||||
May 31, 2013 | 134.32 | 193.15 | 192.71 | ||||||||
May 31, 2014 | 192.27 | 232.64 | 238.76 | ||||||||
Issuer Purchases of Equity Securities
During the fiscal year ended May 31, 2014, our Board of Directors authorized the repurchase of up to an additional $500.0 million of our common stock. Under these authorizations, we repurchased and retired 7.8 million shares of our common stock at a cost of $455.0 million, including commissions, or an average price of $58.06 per share, during the fiscal year ended May 31, 2014.
25
Information about the shares of our common stock that we repurchased during the quarter ended May 31, 2014 is set forth below (in millions, except share data):
Month | Number of Shares Purchased | Average Price per Share | Number of Shares Purchased as Part of Publicly Announced Plans or Programs | Dollar Value of Shares that May Yet Be Purchased Under the Plans or Programs | ||||||||||
March 2014 | 205,391 | $ | 71.56 | 205,391 | ||||||||||
April 2014 | 1,317,517 | 66.71 | 1,317,517 | |||||||||||
May 2014 | 1,353,477 | 67.86 | 1,353,477 | |||||||||||
2,876,385 | $ | 67.60 | 2,876,385 | $ | 169.6 | |||||||||
In addition to the shares we repurchased on the open market, during the quarter ended May 31, 2014, pursuant to our employee incentive plans, we repurchased 283,050 shares at an average price per share of $68.58 in order to satisfy employees’ tax withholding and payment obligations in connection with the vesting of awards of restricted stock, which we repurchased at fair market value on the vesting date.
ITEM 6- SELECTED FINANCIAL DATA
You should read the selected financial data set forth below in conjunction with “Item 7 ‑ Management's Discussion and Analysis of Financial Condition and Results of Operations” and “Item 8 ‑ Financial Statements and Supplementary Data” included elsewhere in this annual report. The income statement data for fiscal years ended May 31, 2014, 2013, and 2012 and the balance sheet data as of May 31, 2014 and 2013 are derived from the audited consolidated financial statements included elsewhere in this annual report. The income statement data for fiscal years 2011 and 2010 and the balance sheet data as of May 31, 2012 and 2011 were derived from consolidated financial statements included in our annual report on Form 10-K for the fiscal year ended May 31, 2012. The balance sheet data as of May 31, 2010 was derived from audited consolidated financial statements included in our Form 10-K for the fiscal year ended May 31, 2011. Amounts related to our discontinued operations in our statements of income for fiscal years 2011 and 2010 were reclassified in fiscal year 2012 to conform to the current presentation.
Year Ended May 31, | |||||||||||||||||||
2014 | 2013 | 2012 | 2011 | 2010 | |||||||||||||||
(in thousands, except per share data) | |||||||||||||||||||
Income statement data: | |||||||||||||||||||
Revenue | $ | 2,554,236 | $ | 2,375,923 | $ | 2,203,847 | $ | 1,859,802 | $ | 1,642,468 | |||||||||
Operating income(1) | 405,499 | 357,213 | 307,349 | 331,594 | 323,279 | ||||||||||||||
Net income(1) | 269,952 | 238,713 | 217,566 | 229,131 | 223,010 | ||||||||||||||
Net income attributable to Global Payments(1) | 245,286 | 216,125 | 188,161 | 209,238 | 203,317 | ||||||||||||||
Per share data: | |||||||||||||||||||
Basic earnings per share(1) | $ | 3.40 | $ | 2.78 | $ | 2.39 | $ | 2.62 | $ | 2.51 | |||||||||
Diluted earnings per share(1) | 3.37 | 2.76 | 2.37 | 2.60 | 2.48 | ||||||||||||||
Dividends per share | 0.08 | 0.08 | 0.08 | 0.08 | 0.08 | ||||||||||||||
Balance sheet data (at year end): | |||||||||||||||||||
Total assets | $ | 4,018,650 | $ | 3,125,056 | $ | 2,688,143 | $ | 3,350,531 | $ | 2,039,326 | |||||||||
Borrowings under short-term lines of credit | 440,128 | 187,461 | 215,391 | 270,745 | 79,187 | ||||||||||||||
Borrowings under long-term debt agreements | 1,393,679 | 963,469 | 312,985 | 354,019 | 421,134 | ||||||||||||||
Total equity(2) | 1,132,799 | 1,286,607 | 1,300,921 | 1,337,817 | 871,517 | ||||||||||||||
(1) | Includes a processing system intrusion credit of $7.0 million in fiscal 2014 and charges of $36.8 million and $84.4 million in fiscal 2013 and 2012, respectively. Also includes impairment, restructuring and other charges of $2.6 million in fiscal 2010. |
(2) | Includes the impact of the retrospective adoption of new accounting guidance concerning noncontrolling interests adopted in fiscal year 2010. |
26
ITEM 7- MANAGEMENT'S DISCUSSION AND ANALYSIS OF FINANCIAL CONDITION AND RESULTS OF OPERATIONS
The following discussion and analysis contains forward-looking statements about our plans and expectations of what may happen in the future. Forward-looking statements are based on a number of assumptions and estimates that are inherently subject to significant risks and uncertainties, and our results could differ materially from the results anticipated by our forward-looking statements as a result of many known and unknown factors, including but not limited to those discussed in "Item 1A - Risk Factors" of this report. See "Cautionary Notice Regarding Forward-Looking Statements" located above "Item 1 - Business."
You should read the following discussion and analysis in conjunction with “Item 6 - Selected Financial Data” and “Item 8 - Financial Statements and Supplementary Data” appearing elsewhere in this annual report.
General
We are one of the largest worldwide providers of payment solutions for merchants, value-added resellers, enterprise software providers, financial institutions, government agencies, multi-national corporations and independent sales organizations ("ISOs") located throughout North America, Europe and the Asia-Pacific region and in Brazil. We provide payment and digital commerce solutions and operate in two business segments, North America Merchant Services and International Merchant Services. We were incorporated in Georgia as Global Payments Inc. in September 2000 and spun-off from our former parent company on January 31, 2001. Including our time as part of our former parent company, we have been in the payments business since 1967. Global Payments Inc. and its consolidated subsidiaries are referred to collectively as "Global Payments," the "Company," "we," "our" or "us," unless the context requires otherwise.
Our North America merchant services and International merchant services segments target customers in many vertical industries including financial services, gaming, government, health care, professional services, restaurants, retail, universities, nonprofit organizations and utilities.
Our offerings enable merchants to accept check, card, electronic and digital-based payments at the point of sale. Our primary business model provides payment products and services directly to merchants as our end customers. We also provide similar products and services to financial institutions and a limited number of ISOs that, in turn, resell our products and services, in which case the financial institutions and select ISOs are our end customers. These particular services are marketed in the United States, Canada and parts of Europe.
The majority of merchant services revenue is generated on services priced as a percentage of transaction value or a specified fee per transaction, depending on card type. We also charge other fees based on specific services that are unrelated to the number of transactions or the transaction value. Revenue from credit cards and signature debit cards is generally based on a percentage of transaction value along with other related fees, while revenue from PIN-based debit cards is typically based on a fee per transaction.
Our products and services are marketed through a variety of sales channels that include a direct sales force, trade associations, integrated payment technology, agent and enterprise software providers and VAR referral arrangements, ISOs, as well as proprietary telesales groups. We seek to leverage the continued shift to electronic payments by expanding market share in our existing markets through our distribution channels or through acquisitions in North America, the Asia-Pacific region and Europe, and investing in and leveraging technology and people, thereby maximizing shareholder value. We also seek to enter new markets through acquisitions in Europe and the Asia-Pacific and Latin America regions.
Our business does not have pronounced seasonality in which more than 30% of our revenues occur in one fiscal quarter. However, each geographic channel has somewhat higher and lower quarters given the nature of the portfolio. While there is some variation in seasonality across markets, the first and fourth quarters are generally the strongest, and the third quarter tends to be the weakest due to lower volumes processed in the months of January and February.
Executive Overview
In fiscal 2014, revenues increased 7.5% to $2,554.2 million from $2,375.9 million in fiscal 2013, reflecting growth in all of our markets.
27
Consolidated operating income was $405.5 million for fiscal 2014, compared to $357.2 million for fiscal 2013. Consolidated operating income includes a processing system intrusion credit of $7.0 million for fiscal 2014 and a charge of $36.8 million for fiscal 2013. Net income attributable to Global Payments increased $29.2 million, or 13.5%, to $245.3 million in fiscal 2014 from $216.1 million in the prior year, resulting in a $0.61 increase in diluted earnings per share to $3.37 in fiscal 2014 from $2.76 in fiscal 2013.
North America merchant services segment revenue increased $103.3 million, or 6.1%, to $1,809.0 million in fiscal 2014 from $1,705.7 million in fiscal 2013. North America merchant services segment operating income increased to $272.3 million in fiscal 2014 from $258.9 million in fiscal 2013, with operating margins of 15.0% and 15.2% for fiscal 2014 and 2013, respectively. The growth in the North America merchant services segment is primarily due to growth in our U.S. direct channels, including the addition of recently acquired PayPros, and growth in Canada, which was partially offset by the impact of changes in exchange rates.
International merchant services segment revenue increased $75.0 million, or 11.2%, to $745.2 million in fiscal 2014 from $670.2 million in fiscal 2013. International merchant services operating income also increased to $240.2 million in fiscal 2014 from $211.2 million in fiscal 2013, with operating margins of 32.2% and 31.5% for fiscal 2014 and 2013, respectively. The growth in the International merchant services segment is due to growth across our European markets and in the Asia-Pacific region.
On February 28, 2014, we closed a five-year senior unsecured $1,250.0 million term loan and $1,000.0 million revolving credit facility with a syndicate of financial institutions. The proceeds from the term loan were used to repay the outstanding balance of the previously existing term loan and credit facilities and to partially fund the acquisition of Payment Processing, Inc. ("PayPros") on March 4, 2014. We have used and will continue to use the remaining capacity to support strategic growth initiatives, including acquisitions and ongoing share repurchases.
On March 4, 2014, we completed the acquisition of PayPros for $420.0 million in cash plus $7.7 million in cash for working capital, subject to adjustment based on a final determination of working capital. We funded the acquisition with a combination of cash on hand and proceeds from our new debt facilities discussed above. PayPros, based in California, is a provider of fully-integrated payment solutions for small-to-medium sized merchants in the United States. PayPros delivers its products and services through a network of technology-based enterprise software partners to vertical markets that are complementary to the markets served by Accelerated Payment Technologies ("APT"), which we acquired on October 1, 2012. See Note 4 - Business and Intangible Asset Acquisitions and Joint Ventures in the notes to consolidated financial statements for further discussion.
Results of Operations
Revenues
We derive our revenues from four primary sources: charges based on volumes and fees for services; charges based on transaction quantity; service fees; and equipment sales and rentals. Revenues generated by these areas depend upon a number of factors, such as demand for and price of our services, the technological competitiveness of our product offerings, our reputation for providing timely and reliable service, competition within our industry and general economic conditions.
Operating Expenses
Cost of Service
Cost of service consists primarily of the following costs: salaries, wages and related expenses paid to operations and technology-related personnel, including those who monitor our transaction processing systems and settlement functions; assessments and other fees paid to card networks; transaction processing systems, including third-party services; network telecommunications capability; depreciation and occupancy costs associated with the facilities performing these functions; amortization of intangible assets and provisions for operating losses.
28
Sales, General and Administrative Expenses
Sales, general and administrative expenses consist primarily of salaries, wages and related expenses paid to sales personnel; non-revenue producing customer support functions and administrative employees and management; commissions paid to ISOs, independent contractors, and other third parties; advertising costs; other selling expenses; share-based compensation expense and occupancy of leased space directly related to these functions.
Processing System Intrusion
In March 2012, we identified and self-reported unauthorized access into a limited portion of our North America card processing system and potential unauthorized access to servers containing personal information collected from U.S. merchants who applied for processing services. As a result of this event, we incurred approximately $114.2 million of cumulative expenses, net of insurance recoveries, relating to the incident (including a credit of $7.0 million in fiscal 2014 and a charge of $36.8 million and $84.4 million in fiscal 2013 and 2012, respectively), and certain card networks temporarily removed us from their lists of PCI DSS compliant service providers. After remediating our processes and systems, we returned to the lists of PCI DSS compliant service providers in the third quarter of fiscal 2013. The impact on revenue of terminations that we can confirm related to our temporary removal from the lists was immaterial. Also, the impact on revenue of merchants, sales partners or other third parties who have failed to renew, terminated negotiations or informed us they are not considering us at all, where we can confirm it is due to our removal from the lists, was immaterial. We currently maintain first- and third-party insurance coverage that may cover certain aspects of cyber risks. However, in the event of a future system intrusion, we cannot provide any assurances that our insurance coverage will be sufficient to cover our losses.
Operating Income and Operating Margin
For the purpose of discussing segment operations, we refer to operating income as calculated by subtracting segment direct expenses from segment revenue. Overhead and shared expenses, including share-based compensation, are not allocated to segment operations; they are reported in the caption “Corporate.” Similarly, references to operating margin regarding segment operations mean segment operating income divided by segment revenue. We also consider costs associated with the processing system intrusion to be a corporate expense.
29
Fiscal Year Ended May 31, 2014 Compared to Fiscal Year Ended May 31, 2013
The following table shows key selected financial data for the fiscal years ended May 31, 2014 and 2013, this data as a percentage of total revenues, and the changes between fiscal years in dollars and as a percentage of fiscal 2013.
(dollar amounts in thousands) | 2014 | % of Revenue(1) | 2013 | % of Revenue(1) | Change | % Change | ||||||||||||||
Revenues: | ||||||||||||||||||||
United States | $ | 1,488,659 | 58.3 | % | $ | 1,394,675 | 58.7 | % | $ | 93,984 | 6.7 | % | ||||||||
Canada | 320,333 | 12.5 | % | 311,000 | 13.1 | % | 9,333 | 3.0 | % | |||||||||||
North America merchant services | 1,808,992 | 70.8 | % | 1,705,675 | 71.8 | % | 103,317 | 6.1 | % | |||||||||||
Europe | 587,463 | 23.0 | % | 522,593 | 22.0 | % | 64,870 | 12.4 | % | |||||||||||
Asia-Pacific | 157,781 | 6.2 | % | 147,655 | 6.2 | % | 10,126 | 6.9 | % | |||||||||||
International merchant services | 745,244 | 29.2 | % | 670,248 | 28.2 | % | 74,996 | 11.2 | % | |||||||||||
Total revenues | $ | 2,554,236 | 100 | % | $ | 2,375,923 | 100 | % | $ | 178,313 | 7.5 | % | ||||||||
Consolidated operating expenses: | ||||||||||||||||||||
Cost of service | $ | 952,225 | 37.3 | % | $ | 862,075 | 36.3 | % | $ | 90,150 | 10.5 | % | ||||||||
Sales, general and administrative | 1,203,512 | 47.1 | % | 1,119,860 | 47.1 | % | 83,652 | 7.5 | % | |||||||||||
Processing system intrusion | (7,000 | ) | (0.3 | )% | 36,775 | 1.5 | % | (43,775 | ) | (119.0 | )% | |||||||||
Operating income | $ | 405,499 | 15.9 | % | $ | 357,213 | 15.0 | % | $ | 48,286 | 13.5 | % | ||||||||
Operating income (loss) for segments: | ||||||||||||||||||||
North America merchant services | $ | 272,251 | $ | 258,910 | $ | 13,341 | 5.2 | % | ||||||||||||
International merchant services | 240,179 | 211,242 | 28,937 | 13.7 | % | |||||||||||||||
Corporate(2) | (106,931 | ) | (112,939 | ) | 6,008 | (5.3 | )% | |||||||||||||
Operating income | $ | 405,499 | $ | 357,213 | $ | 48,286 | 13.5 | % | ||||||||||||
Operating margin for segments: | ||||||||||||||||||||
North America merchant services | 15.0 | % | 15.2 | % | (0.2 | )% | ||||||||||||||
International merchant services | 32.2 | % | 31.5 | % | 0.7 | % | ||||||||||||||
(2) Includes a processing system intrusion credit of $7.0 million in fiscal 2014 and a charge of $36.8 million in fiscal 2013.
Revenues
For fiscal 2014, revenues increased 7.5% to $2,554.2 million compared to the prior year, reflecting growth in all of our markets. Our revenues were affected by fluctuations in foreign currency exchange rates. For the year ended May 31, 2014, currency exchange rate fluctuations decreased our revenues by $10.8 million compared to the prior year, calculated by converting our fiscal 2014 actual revenues at fiscal 2013 rates.
North America Merchant Services Segment. For fiscal 2014, revenue from our North America merchant services segment increased 6.1% to $1,809.0 million compared to the prior year. North America revenue growth was driven by our U.S. direct channels, including recently acquired PayPros, as well as our ISO channels and growth in Canada.
We grow our U.S. revenue primarily by adding small and mid-market merchants in diversified vertical markets. For fiscal 2014, our U.S. credit and debit card processed transactions grew 6.6% compared to the prior year, excluding the impact of PayPros.
30
For fiscal 2014, our Canadian revenue increased 3.0% to $320.3 million primarily due to credit card transaction growth and assessment-based pricing changes, partially offset by the impact of changes in exchange rates. For fiscal 2014, our total Canadian transactions grew 2.5% compared to the prior year, including 4.6% growth in credit card transactions.
In direct merchant acquiring, we provide processing services to merchants and, generally through our relationship with a member sponsor, fund settlement. We market our direct merchant services through a variety of channels, including our ISO channel, whereby the ISO receives a share of the merchant profitability in the form of a monthly residual payment. Revenue for direct merchant services is recognized in the amount of merchant billing net of interchange, and any residual payments to the ISO are reflected as a component of selling, general and administrative expense.
In indirect merchant acquiring, the partner, typically a financial institution or an ISO, is our customer. We provide processing services to the indirect customer’s merchants, but do not provide sponsorship or funds settlement. We bill the indirect customer fees for transactions and various other services, which is recognized as revenue.
International Merchant Services Segment. For fiscal 2014, International merchant services revenue increased 11.2% to $745.2 million compared to the prior year. Our Europe merchant services revenue for fiscal 2014 increased 12.4% to $587.5 million compared to the prior year driven primarily by transaction growth in all markets as well as growth in our e-commerce services. Asia-Pacific merchant services revenue for fiscal 2014 increased 6.9% to $157.8 million compared to the prior year due largely to pricing increases and new assessments.
Operating Expenses
Cost of Service. Cost of service increased 10.5% during fiscal 2014 compared to the prior year, driven primarily by an increase in the variable costs associated with revenue growth and an increase in amortization expense associated with our acquisitions of APT and PayPros. As a percentage of revenue, cost of service increased to 37.3% for fiscal year 2014 from 36.3% in the prior year.
Sales, General and Administrative Expenses. Sales, general and administrative expenses increased 7.5% during fiscal 2014 compared to the prior year primarily due to an increase in commission payments to ISOs, incremental costs related to our acquisitions of APT and PayPros, acceleration of equity awards and other costs associated with the retirement of our former chairman and chief executive officer and charges related to employee termination benefits. As a percentage of revenues, sales, general and administrative expenses remained unchanged at 47.1% for fiscal 2014 compared to fiscal 2013.
Processing system intrusion. During fiscal 2014, we recorded a credit of $7.0 million related to insurance recoveries associated with our processing system intrusion, bringing our total insurance recoveries recognized to date to $27.0 million. We do not expect any additional recoveries. During fiscal 2013, we recorded a $36.8 million charge related to the incident. Since our identification of the intrusion in March 2012, we have incurred approximately $114.2 million of cumulative expenses, net of insurance recoveries, relating to the incident.
Operating Income and Operating Margin for Segments
North America Merchant Services Segment. Operating income in North America merchant services segment increased 5.2% to $272.3 million for fiscal 2014 compared to the prior year. The increase in operating income was primarily due to the increases in transactions and volume in our U.S. direct channels as well as growth in Canada. This increase was partially offset by amortization and other incremental costs associated with our acquisitions of APT and PayPros and foreign currency translation in Canada. The operating margin was 15.0% and 15.2% for the fiscal years 2014 and 2013, respectively.
International Merchant Services Segment. Operating income in International merchant services segment increased 13.7% to $240.2 million for fiscal 2014 compared to the prior year. The increase in operating income was driven primarily by increased transactions and volume in Europe and the Asia-Pacific region as well as pricing increases in the Asia-Pacific region. The operating margin was 32.2% and 31.5% for the fiscal years 2014 and 2013, respectively.
Corporate. Our corporate expenses decreased 5.3% to $106.9 million for fiscal 2014 compared to the prior year primarily due a decrease in one-time costs associated with the processing system intrusion partially offset by higher data security expenses and
31
share-based compensation expense. Corporate operating expenses includes a processing system intrusion credit of $7.0 million for fiscal 2014 and a charge of $36.8 million for fiscal 2013.
Operating Income
During fiscal 2014, our consolidated operating income increased 13.5% to $405.5 million from $357.2 million in the prior year. The increase was primarily due to revenue growth in our North America and International merchant services segments offset by (i) higher variable costs of services associated with revenue growth, (ii) higher amortization and other incremental costs associated with acquisitions, (iii) higher data security expenses and (iv) acceleration of equity awards and other costs associated with the retirement of our former chairman and chief executive officer, and charges related to employee termination benefits. Operating income also reflects the adjustments from the processing system intrusion credit of $7.0 million and charge of $36.8 million for fiscal 2014 and fiscal 2013, respectively.
Other Income/Expense, Net
Other expense, net, increased to $28.1 million for fiscal 2014 compared to $22.9 million in the prior year. The increase is primarily due to a $8.2 million increase in interest expense associated with debt and the loss on extinguishment of debt of $2.1 million that we recorded in connection with the refinancing of our term loan and revolving credit facility; offset by a $5.1 million reduction in the amount of dividends paid to HSBC Asia related to a redeemable noncontrolling interest that HSBC Asia held in Global Payments Asia-Pacific. Such dividends are reflected as interest expense in our consolidated statements of income in accordance with the provisions of ASC 480. Please see Note 4 - Business and Intangible Asset Acquisition and Joint Ventures - Redeemable Noncontrolling Interest Acquisition in the notes to consolidated financial statements for further discussion.
Provision for Income Taxes
Our effective tax rates were 28.5% and 28.6% for the years ended May 31, 2014 and 2013, respectively. The effective tax rates for the years ended May 31, 2014 and 2013 reflect adjustments to our U.K. deferred tax asset due to corporate tax rate reductions in the United Kingdom of 3% and 2%, respectively. Our effective tax rates differ from U.S. statutory rates due to domestic and international tax planning initiatives and income generated in lower tax jurisdictions due to international expansion.
32
Fiscal Year Ended May 31, 2013 Compared to Fiscal Year Ended May 31, 2012
The following table shows key selected financial data for the fiscal years ended May 31, 2013 and 2012, this data as a percentage of total revenues, and the changes between fiscal years in dollars and as a percentage of fiscal 2012.
(dollar amounts in thousands) | 2013 | % of Revenue (1) | 2012 | % of Revenue (1) | Change | % Change | ||||||||||||||
Revenues: | ||||||||||||||||||||
United States | $ | 1,394,675 | 58.7 | % | $ | 1,234,818 | 56.0 | % | $ | 159,857 | 12.9 | % | ||||||||
Canada | 311,000 | 13.1 | % | 332,434 | 15.1 | % | (21,434 | ) | (6.4 | )% | ||||||||||
North America merchant services | 1,705,675 | 71.8 | % | 1,567,252 | 71.1 | % | 138,423 | 8.8 | % | |||||||||||
Europe | 522,593 | 22.0 | % | 489,300 | 22.2 | % | 33,293 | 6.8 | % | |||||||||||
Asia-Pacific | 147,655 | 6.2 | % | 147,295 | 6.7 | % | 360 | 0.2 | % | |||||||||||
International merchant services | 670,248 | 28.2 | % | 636,595 | 28.9 | % | 33,653 | 5.3 | % | |||||||||||
Total revenues | $ | 2,375,923 | 100.0 | % | $ | 2,203,847 | 100.0 | % | $ | 172,076 | 7.8 | % | ||||||||
Consolidated operating expenses: | ||||||||||||||||||||
Cost of service | $ | 862,075 | 36.3 | % | $ | 784,756 | 35.6 | % | $ | 77,319 | 9.9 | % | ||||||||
Sales, general and administrative | 1,119,860 | 47.1 | % | 1,027,304 | 46.6 | % | 92,556 | 9.0 | % | |||||||||||
Processing system intrusion | 36,775 | 1.5 | % | 84,438 | 3.8 | % | (47,663 | ) | (56.4 | )% | ||||||||||
Operating income | $ | 357,213 | 15.0 | % | $ | 307,349 | 13.9 | % | $ | 49,864 | 16.2 | % | ||||||||
Operating income (loss) for segments: | ||||||||||||||||||||
North America merchant services | $ | 258,910 | $ | 281,305 | $ | (22,395 | ) | (8.0 | )% | |||||||||||
International merchant services | 211,242 | 196,137 | 15,105 | 7.7 | % | |||||||||||||||
Corporate(2) | (112,939 | ) | (170,093 | ) | 57,154 | (33.6 | )% | |||||||||||||
Operating income | $ | 357,213 | $ | 307,349 | $ | 49,864 | 16.2 | % | ||||||||||||
Operating margin for segments: | ||||||||||||||||||||
North America merchant services | 15.2 | % | 17.9 | % | (2.7 | )% | ||||||||||||||
International merchant services | 31.5 | % | 30.8 | % | 0.7 | % | ||||||||||||||
(1) Percentage amounts may not sum to the total due to rounding.
(2) Includes processing system intrusion charges of $36.8 million and $84.4 million in fiscal 2013 and 2012, respectively.
Revenues
For fiscal 2013, revenues increased 7.8% to $2,375.9 million compared to the prior year. This growth was primarily driven by our U.S. ISO channel, growth from our direct sales channels and gaming business, and growth in Europe; partially offset by market-based pricing compression in Canada.
North America Merchant Services Segment. For fiscal 2013, revenue from our North America merchant services segment increased 8.8% compared to $1,705.7 million. North America revenue growth was driven by our U.S. ISO channel, strong growth from our direct sales channels, gaming business and reduced interchange expense due to recently enacted legislation.
In fiscal 2013, we grew our U.S. revenue primarily by adding small and mid-market merchants in diversified vertical markets, largely through our ISO channel. For fiscal 2013, our U.S. direct credit and debit card processed transactions grew 11.2% compared to the prior year. Increased spreads offset the impact of a lower average ticket price, which decreased by 0.9% in fiscal 2013. This
33
decline in average ticket was primarily due to a shift toward smaller merchants added through our ISO channel. Smaller merchants tend to have lower average tickets than larger merchants.
For fiscal 2013, our Canadian revenue decreased 6.4% to $311.0 million while our credit and debit card processed transactions grew 3.2% compared to the prior year. The decrease in revenue was due to ongoing market-based pricing compression.
International Merchant Services Segment. For fiscal 2013, International merchant services revenue increased 5.3% to $670.2 million compared to the prior year. Our Europe merchant services revenue for fiscal 2013 increased 6.8% to $522.6 million compared to the prior year, driven primarily by strong transaction growth in all markets. Asia-Pacific merchant services revenue of $147.7 million was flat for fiscal 2013 compared to the prior year resulting from a slight decrease of 0.8% in the number of credit and debit card processed transactions.
Operating Expenses
Cost of Service. Cost of service increased 9.9% during fiscal 2013, compared to the prior year primarily driven by revenue growth. As a percentage of revenue, cost of service increased to 36.3% for fiscal year 2013 from 35.6% in the prior year.
Sales, General and Administrative expenses. Sales, general and administrative expenses increased 9.0% for fiscal 2013 compared to the prior year. In addition, as a percentage of revenues, sales, general and administrative expenses increased to 47.1% for fiscal 2013 from 46.6% in the prior year. These increases were primarily due to an increase in commission payments to ISOs and costs associated with our start up operations in Brazil. These increases were somewhat offset by the elimination of ISO commission payments previously made to APT as a result of our acquisition of APT on October 1, 2012.
Processing System Intrusion. During the fiscal year ended May 31, 2013, we recorded $36.8 million of expense associated with the processing system intrusion described above, bringing the life-to-date total expense to $121.2 million as of May 31, 2013. Of this life-to-date expense, $105.5 million represented costs incurred through May 31, 2013 for professional fees and other costs associated with the investigation and remediation, incentive payments to certain business partners and costs associated with credit monitoring and identity protection insurance. An additional $35.7 million represented total fraud losses, fines and other charges that have been imposed upon us by the card networks. We also recorded $20.0 million of insurance recoveries. During fiscal 2013, we reduced our accrual for fraud losses, fines and other charges by $31.8 million. We based our initial estimate of fraud losses, fines and other charges on our understanding of the rules and operating regulations published by the networks and preliminary communications with the networks. We subsequently reached resolution with and made payments to the networks, resulting in charges that were less than our initial estimates. The primary difference between our initial estimates and the final charges relates to lower fraud related costs attributed to this event than previously expected. As of May 31, 2013, we had received $20.0 million in insurance recoveries related to the intrusion.
Operating Income and Operating Margin for Segments
North America Merchant Services Segment. Operating income in the North America merchant services segment decreased 8.0% for fiscal 2013 compared to the prior year. The decrease in operating income was primarily due to market-based pricing compression in Canada. The operating margin was 15.2% and 17.9% for the fiscal years 2013 and 2012, respectively. The decrease in operating margin was primarily driven by the ISO channel, including the impact of the Durbin amendment, Canadian spread compression and costs associated with our start up operation in Brazil. These increases were somewhat offset by the elimination of ISO commission payments previously made to APT as a result of our acquisition of APT on October 1, 2012. The ISO channel generally has a dilutive effect on our operating margin compared to our other channels due to the ongoing commission payments to the ISOs.
Effective October 1, 2011, the debit interchange legislation capped the amount of interchange that card issuers may charge on transactions. Our interchange expenses decreased as a result of this. We recognize revenue net of interchange expense; therefore, our revenues increased as a result of lower interchange expense with a resulting increase in operating income as well. Increased revenues came primarily through our ISO channel, where reduced interchange fees led to higher revenues and a dollar-for-dollar increase in ISO commission expense, with an associated reduction in our operating margin.
34
International Merchant Services Segment. Operating income in the International merchant services segment increased 7.7% to $211.2 million for fiscal 2013 compared to the prior year. The operating margin was 31.5% and 30.8% for the fiscal years 2013 and 2012, respectively. The increase in operating margin in our International merchant services segment was due to strong results in Europe, partially offset by last year's marketing fee true-up in Spain, whereby CaixaBank compensated us for favorable pricing to certain CaixaBank customers during the initial phase of our marketing alliance agreement.
Corporate. Our corporate costs decreased 33.6% to $112.9 million for fiscal 2013 compared to the prior year. This decrease was primarily due to lower costs associated with the processing system intrusion and charges related to two contractual disputes in fiscal 2012.
Operating Income
During fiscal 2013, our consolidated operating income increased $49.9 million to $357.2 million from $307.3 million in the prior year. The increase in our consolidated operating income was primarily due to solid financial results in North America and Europe and lower costs associated with the processing system intrusion in fiscal 2013 compared to 2012.
Other Income/Expense, Net
Other expense, net, increased to $22.9 million for fiscal 2013 compared to $6.9 million in the prior year period. The increase was due to higher debt balances as well as an $8.4 million distribution to HSBC Asia in fiscal 2013. This distribution was characterized as interest expense in accordance with the provisions of ASC 480. Please see Note 4 - Business and Intangible Asset Acquisition and Joint Ventures - Redeemable Noncontrolling Interest Acquisition in the notes to consolidated financial statements for further discussion.
Provision for Income Taxes
Our effective tax rates were 28.6% and 27.6% for the years ended May 31, 2013 and 2012, respectively. The effective tax rates for the years ended May 31, 2013 and 2012 reflect adjustments to our U.K. deferred tax asset due to enacted corporate tax rate reductions in the United Kingdom of 2% in each year. Our effective tax rates differ from U.S. statutory rates due to domestic and international tax planning initiatives and the increasing amount of income being generated in lower tax jurisdictions due to international expansion.
Noncontrolling Interests, Net of Tax
Noncontrolling interests, net of tax decreased to $22.6 million from $29.4 million for the fiscal years 2013 and 2012, respectively. This decrease was primarily due to the fact that we stopped attributing income to the GPAP redeemable noncontrolling interest subsequent to July 26, 2012, the date of our agreement to purchase HSBC Asia's interest.
Liquidity and Capital Resources
A significant portion of our liquidity comes from operating cash flows. Cash flow from operations is used to make planned capital investments in our business, to pursue acquisitions that meet our corporate objectives, to pay dividends, and to pay down debt and repurchase shares of our common stock at the discretion of our Board of Directors. Accumulated cash balances are invested in high quality and marketable short-term instruments.
Our capital plan objectives are to support the Company’s operational needs and strategic plan for long-term growth while maintaining a low cost of capital. Lines of credit are used in certain of our markets to fund settlement and, along with other bank financing, to fund acquisitions. We regularly evaluate our liquidity and capital position relative to cash requirements, and we may elect to raise additional funds in the future, either through the issuance of debt, equity or otherwise.
At May 31, 2014, we had cash and cash equivalents totaling $581.9 million. Of this amount, we consider $304.3 million to be available cash. Our available cash balance includes $174.7 million of cash held by foreign subsidiaries whose earnings are considered permanently reinvested for U.S. tax purposes. These cash balances reflect our capital investments in these subsidiaries and the accumulation of cash flows generated by each subsidiary's operations, net of cash flows used to service debt locally and fund
35
non-U.S. acquisitions. We believe that we are able to maintain a sufficient level of liquidity for our domestic operations and commitments without repatriation of the earnings of these foreign subsidiaries. If we were to repatriate some or all of the cash held by such foreign subsidiaries, we do not believe that the associated income tax liabilities would have a significant impact on our liquidity.
Available cash excludes settlement related and merchant reserve cash balances. Settlement related cash balances represent funds that we hold on behalf of our member sponsors when the incoming amount from the card networks precedes the member sponsors' funding obligation to the merchant. Settlement related cash balances are not restricted; however, these funds are generally paid out in satisfaction of settlement processing obligations the following day. Merchant reserve cash balances represent funds collected from our merchants that serve as collateral to minimize contingent liabilities associated with any losses that may occur under the merchant agreement ("Merchant Reserves"). At May 31, 2014, our cash and cash equivalents included $124.7 million related to Merchant Reserves. While this cash is not restricted in its use, we believe that designating this cash to collateralize Merchant Reserves strengthens our fiduciary standing with our member sponsors and is in accordance with the guidelines set by the card networks.
Operating activities provided net cash of $194.1 million during fiscal 2014 compared to net cash of $240.5 million during the prior year. The decrease in cash flow from operating activities was primarily due to the change in net settlement processing assets and obligations of $137.4 million, which is generally driven by the timing of month end cut-off, offset by an increase in operating income and favorable changes in prepaid expenses and accrued liabilities resulting from the absence in fiscal 2014 of payments associated with the processing system intrusion.
Net cash used in investing activities decreased from $528.6 million in the prior year to $501.7 million in fiscal 2014, primarily due to a reduction in capital expenditures for data center infrastructure and our authorization platform.
For fiscal 2014, financing activities provided net cash of $218.9 million compared to $183.5 million in the prior year. On February 28, 2014, we closed a five-year senior unsecured $1,250.0 million term loan facility, paid off previously existing debt of 902.5 million and paid fees and expenses of 6.0 million. In connection with the debt refinancing, we entered into a five-year senior unsecured $1,000.0 million revolving credit facility under which we borrowed $140.0 million during the remainder of fiscal 2014. In addition, we made net borrowings of $252.7 million on short-term lines of credit used to fund settlement-related activities, and we spent $447.3 million to repurchase shares of our common stock.
In the prior year, we borrowed $700.0 million under a five-year unsecured term loan facility of which we repaid $52.5 million during fiscal 2013. In addition, we made net payments of $27.9 million on short-term lines of credit used to fund settlement-related activities. Finally, we invested $242.0 million to purchase HSBC Asia's 44% interest in GPAP and $175.3 million to repurchase shares of our common stock during fiscal 2013.
We believe that our current level of cash and borrowing capacity under our lines of credit described below, together with future cash flows from operations, are sufficient to meet the needs of our existing operations and planned requirements for the foreseeable future. During fiscal 2015, we expect capital expenditures to approximate $95.0 million.
36
Long-Term Debt and Credit Facilities
As of May 31, 2014 and 2013, outstanding debt consisted of the following:
2014 | 2013 | ||||||
Lines of credit: | (in thousands) | ||||||
Corporate Credit Facility - long-term | $ | 140,000 | $ | 309,955 | |||
Short-term lines of credit | 440,128 | 187,461 | |||||
Total lines of credit | 580,128 | 497,416 | |||||
Notes payable | 3,679 | 6,014 | |||||
Term loan | 1,250,000 | 647,500 | |||||
Total debt | $ | 1,833,807 | $ | 1,150,930 | |||
Current portion | $ | 457,805 | $ | 259,796 | |||
Long-term debt | 1,376,002 | 891,134 | |||||
Total debt | $ | 1,833,807 | $ | 1,150,930 | |||
Maturity requirements on outstanding debt by fiscal years are as follows (in thousands):
2015 | $ | 457,805 | |
2016 | 63,150 | ||
2017 | 78,776 | ||
2018 | 125,325 | ||
2019 | 1,108,751 | ||
Total | $ | 1,833,807 | |
On February 28, 2014, we entered into an amended and restated term loan agreement ("Term Loan") and an amended and restated credit agreement ("Corporate Credit Facility") with a syndicate of financial institutions. The Term Loan and the Corporate Credit Facility amended and restated the term loan agreement dated September 28, 2012 and the credit agreement dated December 7, 2010, respectively.
The Term Loan is a five-year senior unsecured $1,250.0 million term loan. We used proceeds from the Term Loan to partially fund our acquisition of PayPros on March 4, 2014 and to repay the outstanding balances on our previously existing revolving credit facility and our previously existing term loan.
The Term Loan expires February 28, 2019 and bears interest, at our election, at either LIBOR or a base rate, in each case plus a leverage-based margin. As of May 31, 2014, the interest rate on the Term Loan was 1.62%. Commencing in May 2015 and ending in November 2018, the Term Loan has scheduled quarterly principal payments of 1.25%, increasing up to 2.50%. At maturity, 27.50% of the Term Loan will have been repaid through scheduled amortization and the remaining principal balance will be due. With notice, the Term Loan may be voluntarily prepaid at any time, in whole or in part, without penalty. As of May 31, 2014, the outstanding balance of the Term Loan was $1,250.0 million.
The Corporate Credit Facility is a five-year senior unsecured revolving $1,000.0 million revolving credit facility. The Corporate Credit Facility expires February 28, 2019 and bears interest, at our election, at either LIBOR or a base rate, in each case plus a leverage-based margin. Borrowing under the Corporate Credit Facility is available in various currencies. As of May 31, 2014, the outstanding balance of the Corporate Credit Facility was $140.0 million, and the interest rate was 1.6%. The Corporate Credit Facility is available for general corporate purposes.
The Corporate Credit Facility allows us to issue standby letters of credit of up to $100.0 million in the aggregate. Outstanding letters of credit under the Corporate Credit Facility reduce the amount of borrowings available to us. At May 31, 2014, we had standby
37
letters of credit of $8.1 million. The total available incremental borrowings under our Corporate Credit Facility at May 31, 2014 was $851.9 million. The Corporate Credit Facility is included in long-term debt in the accompanying consolidated balance sheets because we are not contractually obligated to make repayments in the next twelve months.
Upon closing of the Term Loan and the Corporate Credit Facility, which occurred on February 28, 2014, we repaid the outstanding balance of $612.5 million on our previously existing term loan and the outstanding balance of $290.0 million on our previously existing revolving credit facility together with accrued interest and fees on each. In connection with the debt refinancing, we recorded a loss of $2.1 million, representing the write off of debt issuance costs associated with the previously existing term loan. We reported this loss in Interest and other expense in our consolidated statements of income for the fiscal year ended May 31, 2014. We incurred fees and expenses associated with these new arrangements of approximately $6.0 million, which was capitalized as debt issuance costs. Debt issuance costs are included in Other assets in our consolidated balance sheet at May 31, 2014 and are being amortized over the term of these new arrangements.
The agreements contain customary affirmative and restrictive covenants, including, among others, financial covenants based on our leverage and fixed charge coverage ratios. Please see "Compliance with Covenants" below. Each of the agreements includes customary events of default, the occurrence of which, following any applicable cure period, would permit lenders to, among other things, declare the principal, accrued interest and other obligations to be immediately due and payable.
Short-term Lines of Credit
We have short-term lines of credit with banks in the United States and Canada as well as several countries in Europe and Asia in which we do business. The short-term lines of credit, which are primarily used to fund settlement, generally have variable short-term interest rates and are subject to annual review. The credit facilities are generally denominated in local currency but may, in some cases, facilitate borrowings in multiple currencies. For certain of our lines of credit, the line of credit balance is reduced by the amount of cash we have on deposit in specific accounts with the lender when determining compliance with the credit limit. Accordingly, the line of credit balance may exceed the stated credit limit at any given point in time, when in fact the combined position is less than the credit limit.
As of May 31, 2014 and May 31, 2013, respectively, we had $440.1 million and $187.5 million outstanding under these short-term lines of credit, with additional borrowing capacity as of May 31, 2014 of $818.5 million to fund settlement. During the year ended May 31, 2014, the maximum and average borrowings under our lines of credit were $1,000.5 million and $551.6 million, respectively. The weighted-average interest rate on these borrowings was 1.7% and 2.1% at May 31, 2014 and May 31, 2013, respectively. Our maximum borrowed amount was greater than our average and period end borrowings due to the timing of settlement funding.
Notes Payable
United Card Services, our subsidiary in the Russian Federation, had notes payable with a total outstanding balance of approximately $3.7 million at May 31, 2014. These notes had fixed annual interest rates of 8.5% with maturity dates ranging from June 2014 through November 2018.
Compliance with Covenants
There are certain financial and non-financial covenants contained in our various credit facilities and Term Loan. Our Term Loan and Corporate Credit Facility agreements include financial covenants requiring (i) a leverage ratio no greater than 3.50 to 1.00 and (ii) a fixed charge coverage ratio no less than 2.50 to 1.00. We complied with all applicable covenants as of and for the year ended May 31, 2014.
Off-Balance Sheet Arrangements
We have not entered into any transactions with unconsolidated entities whereby we have financial guarantees, subordinated retained interest, derivative instruments, or other contingent arrangements that expose us to material continuing risks, contingent liabilities, or other obligations under a variable interest in an unconsolidated entity that provides us with financing, liquidity, market, or credit risk support other than the guarantee products described under “Critical Accounting Estimates” below.
38
BIN/ICA Agreements
We have entered into sponsorship or depository and processing agreements with certain banks. These agreements allow us to use the banks' identification numbers, referred to as Bank Identification Number ("BIN") for Visa transactions and Interbank Card Association ("ICA") number for MasterCard transactions, to clear credit card transactions through Visa and MasterCard. Certain of such agreements contain financial covenants, and we were in compliance with all such covenants as of May 31, 2014.
Commitments and Contractual Obligations
The following table summarizes our contractual obligations and commitments as of May 31, 2014:
Payments Due by Future Period | |||||||||||||||||||
Total | Less than 1 Year | 1-3 Years | 3-5 Years | 5+ Years | |||||||||||||||
(in thousands) | |||||||||||||||||||
Operating leases and purchase obligations | $ | 177,604 | $ | 50,296 | $ | 80,940 | $ | 31,972 | $ | 14,396 | |||||||||
Total debt, including current portion | 1,833,807 | 457,805 | 141,926 | 1,234,076 | — | ||||||||||||||
Interest on long-term debt(1) | 94,259 | 22,096 | 41,533 | 30,630 | — | ||||||||||||||
(1) Interest on variable rate debt is based on rates effective and amounts borrowed as of May 31, 2014.
The table above excludes other obligations that we may have, such as employee benefit plan obligations, unrecognized tax benefits, and other current and long-term liabilities reflected in our consolidated balance sheet. At this time, we are unable to make a reasonably reliable estimate of the timing of these payments; therefore, such amounts are not included in the above contractual obligation table. We do not have any material purchase commitments as of May 31, 2014.
Critical Accounting Policies
In applying the accounting policies that we use to prepare our consolidated financial statements, we necessarily make accounting estimates that affect our reported amounts of assets, liabilities, revenues and expenses. Some of these accounting estimates require us to make assumptions about matters that are highly uncertain at the time we make the accounting estimates. We base these assumptions and the resulting estimates on historical information and other factors that we believe to be reasonable under the circumstances, and we evaluate these assumptions and estimates on an ongoing basis. In many instances, however, we reasonably could have used different accounting estimates and, in other instances, changes in our accounting estimates could occur from period to period, with the result in each case being a material change in the financial statement presentation of our financial condition or results of operations. We refer to accounting estimates of this type as “critical accounting estimates.” The critical accounting estimates that we discuss below are those that we believe are most important to an understanding of our consolidated financial statements.
Accounting estimates necessarily require subjective determinations about future events and conditions. Therefore, the following descriptions of critical accounting estimates are forward-looking statements, and actual results could differ materially from the results anticipated by these forward-looking statements. You should read the following in conjunction with Note 1 of the notes to consolidated financial statements and the risk factors contained in “Item 1A - Risk Factors” of this annual report.
Reserve for Operating Losses
As a part of our direct merchant credit card and debit card processing services and check guarantee services, we experience merchant losses and check guarantee losses, which we collectively refer to as “operating losses.” Merchant losses occur when we are unable to collect amounts from merchant customers for any charges properly reversed by the issuing bank. Check guarantee losses occur when we are unable to collect the full amount of a guaranteed check from the checkwriter. Please refer to the notes to consolidated financial statements for a further explanation of these operating losses.
We process credit card transactions for direct merchants and recognize revenue based on a percentage of the gross amount charged. Our direct merchant customers have the liability for any charges properly reversed by the issuing bank. In the event,
39
however, that we are not able to collect such amount from the merchants, due to merchant fraud, insolvency, bankruptcy or any other reason, we may be liable for any such reversed charges. We require cash deposits, guarantees, letters of credit and other types of collateral by certain merchants to minimize any such contingent liability, and we also utilize a number of systems and procedures to manage merchant risk. We have, however, historically experienced losses due to merchant defaults.
We record reserves for our estimated liability for operating losses. This estimate of losses is comprised of estimated known losses and estimated incurred but not reported losses. Estimated known losses arise from specific instances of, for example, merchant bankruptcies, closures or fraud of which we are aware at the balance sheet date, but for which the ultimate amount of associated loss will not be determined until after the balance sheet date. Estimated known loss accruals are recorded when it is probable that we have incurred a loss and the loss is reasonably estimable. Estimated known losses are calculated at the merchant level based on chargebacks received to date, processed volume, and historical chargeback ratios. The estimate is reduced for any collateral that we hold. Accruals for estimated known losses are evaluated periodically and adjusted as appropriate based on actual loss experience. Incurred but not reported losses result from transactions that we process before the balance sheet date for which we have not yet received chargeback notification. We estimate incurred but not reported losses by applying historical loss ratios to our direct merchant credit card and signature debit card sales volumes processed, or processed volume. Historically, this estimation process has been materially accurate.
For the years ended May 31, 2014, 2013, and 2012, our processed volume was $201.2 billion, $192.8 billion, and $180.7 billion, respectively. For these same periods, we recorded provisions for merchant losses of $8.7 million, $9.5 million, and $8.8 million, respectively. As a percentage of processed volume, these charges were 0.0043%, 0.0049%, and 0.0049%, respectively, during the above periods. For these same years, we experienced actual losses of $9.3 million, $9.5 million, and $9.6 million, respectively. We believe that our estimation process has been materially accurate on a historical basis. A 10% increase or decrease in our provision for merchant losses as a percentage of processed volume for the year ended May 31, 2014 would have resulted in a decrease or increase in net income of $0.6 million. Further, if our guarantee loss as a percentage of guarantee volume for our fiscal 2014 had equaled our guarantee loss as a percentage of guarantee volume of 0.0049% for the same prior year period, our net income would have decreased by $0.9 million. As of May 31, 2014 and 2013, $1.7 million and $2.3 million respectively has been recorded for guarantees associated with merchant card processing and are included in settlement processing obligations in the accompanying consolidated balance sheets.
In our check guarantee service offering, we charge our merchants a percentage of the gross amount of the check and guarantee payment of the check to the merchant in the event the check is not honored by the checkwriter's bank. We have the right to collect the full amount of the check from the checkwriter but have not historically recovered 100% of the guaranteed checks. Our check guarantee loss reserve is comprised of estimated losses on returned checks and estimated incurred but not reported losses. We estimate the loss on returned checks by applying historical collection rates to our claims receivable balance. We estimate incurred but not reported losses by applying historical loss ratios to the face value of our guaranteed checks. For each of the years ended May 31, 2014, 2013, and 2012, we guaranteed total check face values of $2.6 billion. For those same periods, we recorded provisions for check guarantee losses of $11.9 million, $11.7 million, and $13.4 million, respectively. As a percentage of the total guaranteed check face value, these charges were 0.46%, 0.44%, and 0.51%, respectively. For these same years, we experienced actual losses of $12.1 million, $12.0 million, and $13.8 million, respectively. We believe that our estimation process has been materially accurate on a historical basis. A 10% increase or decrease in our percentage assumption for the year ended May 31, 2014 would have resulted in a decrease or increase in net income of $0.8 million. Further, if our guarantee loss as a percentage of guarantee volume for our fiscal 2014 had equaled our guarantee loss as a percentage of guarantee volume of 0.44% for the same prior year period, our net income would have increased by $0.2 million. As of May 31, 2014 and 2013, we had a check guarantee reserve of $3.0 million and $3.1 million, respectively, which is included in claims receivable in the accompanying consolidated balance sheets.
We derive our projected loss rate assumptions primarily based on a rolling six to twelve month analysis of historic loss activity. These assumptions, however, bear the risk of change, which may occur as a result of several qualitative factors. For merchant losses, these factors include the following: a change in the creditworthiness of our merchant customers; a change in the levels of credit card fraud affecting our merchant customers; and a change in the effectiveness of our internal credit, risk management, and collection departments. For check guarantee losses, these factors include a change in the levels of dishonored consumer checks presented to our guarantee service merchant customers and a change in the effectiveness of our internal check guarantee procedures, customer acceptance and retention policies, or collection protocols. Application of our percentage assumptions involve uncertainty regarding changes in any of the factors above, especially those that are outside of our control, such as the financial health of the economies in
40
the United States, Canada, the United Kingdom, Spain, the Asia-Pacific region and the Russian Federation at a regional or national level and the related impact on our customers.
Goodwill and Long-lived Asset Valuations
Goodwill is tested for impairment at the reporting unit level. We test goodwill for impairment annually as of January 1st and more often if an event occurs or circumstances change that would more likely than not reduce the fair value of a reporting unit below its net carrying value. We have the option of performing a qualitative assessment of impairment to determine whether any further quantitative testing for impairment is necessary. The option of whether or not to perform a qualitative assessment is made from year-to-year and can vary by reporting unit.
As of January 1, 2014, we elected to apply the qualitative goodwill impairment assessment guidance in ASC 350-20, Goodwill, for each of our reporting units. Factors we consider in the qualitative assessment include general macroeconomic conditions, industry and market conditions, cost factors, overall financial performance of our reporting units, events or changes affecting the composition or carrying value of the net assets of our reporting units, sustained decrease in our share price, and other relevant entity specific events. If we elect to bypass the qualitative assessment or if we determine, on the basis of qualitative factors, that the fair value of the reporting unit is more likely than not less than the carrying value, a two-step quantitative test is required. In the first step, the reporting unit's carrying amount, including goodwill, is compared to its fair value. If the carrying amount of the reporting unit is greater than its fair value, goodwill is considered impaired and step two must be performed. Step two measures the impairment loss by comparing the implied fair value of reporting unit goodwill with the carrying amount of that goodwill. The implied fair value of goodwill is determined by allocating the fair value of the reporting unit to all the assets and liabilities of that unit (including unrecognized intangibles) as if the reporting unit had been acquired in a business combination. The excess of the fair value over the amounts allocated to the assets and liabilities of the reporting unit is the implied fair value of the goodwill. The excess of the carrying amount over the implied fair value of the goodwill is the impairment loss.
We have six reporting units: North America Merchant Services, U.K. Merchant Services, Asia-Pacific Merchant Services, Central and Eastern Europe Merchant Services, Russia Merchant Services and Spain Merchant Services. Based on our annual assessment as of January 1, 2014, we determined on the basis of qualitative factors, that the fair values of the reporting units were not more likely than not less than their respective carrying values; and therefore, a two-step quantitative test was not required. We believe that the fair values of our reporting units are substantially in excess of their carrying values.
Our goodwill impairment testing involves the use of estimates and the exercise of judgment on the part of management. Our assessment of the qualitative factors discussed above involves significant judgments about expected future business performance and general market conditions. Significant changes in our assessment of such qualitative factors could affect our assessment of the fair value of one or more of our reporting units and could result in a goodwill impairment charge in a future period.
Other intangible assets primarily represent customer-related intangible assets (such as customer lists and merchant contracts), contract-based intangible assets (such as non-compete agreements, referral agreements and processing rights), acquired technology and trademarks associated with acquisitions. Customer-related intangible assets, contract-based intangible assets and trademarks are amortized over their estimated useful lives of from 5 to 30 years. The useful lives for customer-related intangible assets are determined based primarily on forecasted cash flows, which include estimates for the revenues, expenses, and customer attrition associated with the assets. The useful lives of contract-based intangible assets are equal to the terms of the agreements. The useful lives of amortizable trademarks are based on our plans to phase out the trademarks in the applicable markets. Acquired technology is amortized on a straight-line basis over its estimated useful life.
Amortization for most of our customer-related intangible assets is calculated using an accelerated method. In determining amortization expense under our accelerated method for any given period, we calculate the expected cash flows for that period that were used in determining the acquired value of the asset and divide that amount by the expected total cash flows over the estimated life of the asset. We multiply that percentage by the initial carrying value of the asset to arrive at the amortization expense for that period. If the cash flow patterns that we experience differ significantly from our initial estimates, we will adjust the amortization schedule accordingly. These cash flow patterns are derived using certain assumptions and cost allocations due to a significant amount of asset interdependencies that exist in our business. During fiscal 2014, we did not adjust the amortization schedules.
41
We believe that our accelerated method better approximates the distribution of cash flows generated by our acquired customer relationships. We use the straight-line method of amortization for our contract-based intangibles and amortizable trademarks.
We regularly evaluate whether events and circumstances have occurred that indicate the carrying amount of property and equipment and finite-life intangible assets may not be recoverable. When factors indicate that these long-lived assets should be evaluated for possible impairment, we assess the potential impairment by determining whether the carrying value of such long-lived assets will be recovered through the future undiscounted cash flows expected from use of the asset and its eventual disposition. If the carrying amount of the asset is determined not to be recoverable, a write-down to fair value is recorded. Fair values are determined based on quoted market prices or discounted cash flow analysis as applicable. We regularly evaluate whether events and circumstances have occurred that indicate the useful lives of property and equipment and finite-life intangible assets may warrant revision. In our opinion, the carrying values of our long-lived assets, including property and equipment and finite-life intangible assets, were not impaired at May 31, 2014 and 2013.
Capitalization of Internally Developed Software
We develop software that is used in providing processing services to customers. Capitalization of internally developed software, primarily associated with operating platforms, occurs when we have completed the preliminary project stage, management authorizes the project, management commits to funding the project, it is probable the project will be completed and the project will be used to perform the function intended. The preliminary project stage consists of the conceptual formulation of alternatives, the evaluation of alternatives, the determination of existence of needed technology and the final selection of alternatives. Costs incurred during the preliminary project stage are expensed as incurred. Currently unforeseen circumstances in software development, such as a significant change in the manner in which the software is intended to be used, obsolescence or a significant reduction in revenues due to merchant attrition, could require us to implement alternative plans with respect to a particular effort, which could result in the impairment of previously capitalized software development costs. Such impairment would result in a charge to income. Total software capitalized at May 31, 2014 was $224.8 million. Costs capitalized during fiscal 2014, 2013 and 2012 totaled $39.1 million, $29.2 million, and $31.3 million, respectively. Internally developed software has an amortization period of 5 to 10 years. Internally developed software assets are placed into service when they are ready for their intended use.
As of May 31, 2014, we have placed into service $96.7 million of hardware and software associated with our authorization platform, $6.1 million of which was placed in service during fiscal 2014. The vision for this platform is to serve as a front-end operating environment for merchant processing and is intended to replace a number of legacy platforms that have higher cost structures. Depreciation and amortization associated with these costs is calculated based on transactions expected to be processed over the life of the platform. We believe that this method is more representative of the platform's use than the straight-line method. We are currently processing transactions on this authorization platform in nine markets in our Asia-Pacific region and for a limited number of U.S. merchants. As these markets represent a small percentage of our overall transactions, depreciation and amortization related to this platform for fiscal 2014 was not significant. Depreciation and amortization expense will increase as we complete migrations of other merchants to this authorization platform.
Income Taxes
The determination of our provision for income taxes requires management's judgment in the use of estimates and the interpretation and application of complex tax laws. Judgment is also required in assessing the timing and amounts of deductible and taxable items. We believe our tax return positions are fully supportable; however, we establish liabilities for material tax exposures relating to deductions, transactions and other matters involving some uncertainty as to the proper tax treatment of the item. Issues raised by a tax authority may be finally resolved at an amount different than the related liability. When facts and circumstances change (including a resolution of an issue or statute of limitations expiration), these liabilities are adjusted through the provision for income taxes in the period of change.
Judgment is required to determine whether or not some portion or all of our deferred tax assets will not be realized. To the extent we determine that we will not realize the benefit of some or all of our deferred tax assets, then these deferred tax assets are adjusted through our provision for income taxes in the period in which this determination is made. At May 31, 2014, our consolidated balance sheet includes net deferred tax assets associated with our United Kingdom business of $96.7 million. Our assessment of the recoverability of these deferred tax assets is based, in part, on our projections of future business performance and viable tax planning strategies. If future business performance fails to meet projections, we may determine that some or all of these deferred tax assets
42
will not be realized. In the event of such a determination, we would record a valuation allowance for the amount deemed unrecoverable with a corresponding charge to the provision for income taxes.
New Accounting Pronouncements
From time-to-time, new accounting pronouncements are issued by the Financial Accounting Standards Board ("FASB") or other standards setting bodies that are adopted by us as of the specified effective date. Unless otherwise discussed, our management believes that the impact of recently issued standards that are not yet effective will not have a material impact on our consolidated financial statements upon adoption.
In May 2014, the FASB issued Accounting Standards Update ("ASU") 2014-09, "Revenue from Contracts with Customers(Topic 606)." The core principle of the ASU is that an entity should recognize revenue for the transfer of goods or services equal to the amount that it expects to be entitled to receive for those goods or services. The ASU requires additional disclosure about the nature, amount, timing and uncertainty of revenue and cash flows arising from customer contracts, including significant judgments and changes in judgments. The amendments are effective for annual reporting periods beginning after December 15, 2016, including interim periods within that reporting period. Early application is not permitted. We are evaluating the impact of this ASU on our consolidated financial statements.
In April 2014, the FASB issued ASU 2014-08, "Presentation of Financial Statements (Topic 205) and Property, Plant, and Equipment (Topic 360) Reporting Discontinued Operations and Disclosures of Disposals of Components of an Entity." The amendments in ASU 2014-11change the requirements for reporting discontinued operations in ASC 205-20. The amendments change the definition of discontinued operations by limiting discontinued operations reporting to disposals of components of an entity that represent strategic shifts that have (or will have) a major effect on an entity’s operations and financial results. The amendments require expanded disclosures for discontinued operations and are effective for fiscal years, and interim periods within those years, beginning after December 15, 2014. Early adoption is permitted, but only for disposals (or classifications as "held for sale") that have not been reported in financial statements previously issued or available for issuance.
In July 2013, the FASB issued ASU 2013-11, "Presentation of an Unrecognized Tax Benefit When a Net Operating Loss Carryforward, a Similar Tax Loss, or a Tax Credit Carryforward Exists" ("ASU 2013-11"). The amendments in ASU 2013-11 require an entity to present an unrecognized tax benefit in the financial statements as a reduction to a deferred tax asset for a net operating loss ("NOL") carryforward, a similar tax loss, or a tax credit carryforward except when: (1) A NOL carryforward, a similar tax loss, or a tax credit carryforward is not available as of the reporting date under the governing tax law to settle taxes that would result from the disallowance of the tax position; or (2) the entity does not intend to use the deferred tax asset for this purpose (provided that the tax law permits a choice). If either of these conditions exists, an entity should present an unrecognized tax benefit in the financial statements as a liability and should not net the unrecognized tax benefit with a deferred tax asset. The amendment does not affect the recognition or measurement of uncertain tax positions under ASC 740-5. The amendments in this ASU are effective for fiscal years, and interim periods within those years, beginning after December 15, 2013. The amendments should be applied prospectively to all unrecognized tax benefits that exist at the effective date. Retrospective application is permitted.
In March 2013, the FASB issued ASU 2013-05, "Foreign Currency Matters" ("ASU 2013-05"). The amendments in ASU 2013-05 resolve the diversity in practice about whether current literature applies to the release of the cumulative translation adjustment into net income when a parent either sells a part or all of its investment in a foreign entity or no longer holds a controlling financial interest in a subsidiary or group of assets that is a nonprofit activity or a business within a foreign entity. In addition, the amendments in ASU 2013-05 resolve the diversity in practice for the treatment of business combinations achieved in stages (sometimes also referred to as step acquisitions) involving a foreign entity. ASU 2013-05 is effective prospectively for fiscal years and interim reporting periods within those years, beginning after December 15, 2013.
43
ITEM 7A- QUANTITATIVE AND QUALITATIVE DISCLOSURES ABOUT MARKET RISK
Foreign Currency Risk
A significant amount of our operations is conducted in foreign currencies. Consequently, our revenues and income generated in currencies other than the U.S. dollar are affected by fluctuations in foreign currency exchange rates. For fiscal 2014, currency rate fluctuations decreased our revenues by $10.8 million and our diluted earnings per share by $0.05 as compared to the prior year, calculated by converting our fiscal 2014 actual revenues and expenses at fiscal 2013 rates.
Generally, the functional currency of our various subsidiaries is their local currency. As a result, we are exposed to currency fluctuations on transactions which are not denominated in the functional currency. Gains and losses on such transactions are included in determining net income for the period. We seek to mitigate our foreign currency risk through timely settlement of transactions and cash flow matching, when possible. For the years ended May 31, 2014, 2013 and 2012, our transaction gains and losses were insignificant.
Additionally, we are affected by currency fluctuations in our funds settlement process on merchant payment, chargeback and card network settlement transactions which are not denominated in the currency of the underlying credit or debit card transaction. Gains and losses on these transactions are included in revenue for the period.
We are also impacted by fluctuations in exchange rates on our investments in foreign operations. Relative to our net investment in foreign operations, the assets and liabilities of subsidiaries whose functional currency is a foreign currency are translated at the period-end rate of exchange. The resulting translation adjustment is recorded as a component of other comprehensive income and is included in shareholders' equity. Translation gains and losses on intercompany balances of a long-term investment nature are also recorded as a component of other comprehensive income.
Interest Rate Risk
We are exposed to market risk related to changes in interest rates on our cash investments and debt. We invest our excess cash in securities that we believe are highly liquid and marketable in the short term. These investments earn a floating rate of interest and are not held for trading or other speculative purposes.
We have a term loan and a corporate credit facility that we use for general corporate purposes, as well as various short-term lines of credit that we use to fund settlement in certain of our markets. Interest rates on these debt instruments and short-term lines of credit are based on market rates and fluctuate accordingly. As of May 31, 2014, there was $1,830.1 million outstanding under these variable-rate debt arrangements and short-term lines of credit.
In certain of our credit card transaction processing markets, the Member uses its own funds to fund merchant settlement and charges us cost of funds. Cost of funds is charged at prevailing market rates and fluctuates accordingly.
We did not use interest rate derivative instruments to manage exposure to interest rate changes during fiscal 2014. The interest earned on our cash investments and the interest paid on our debt are based on variable interest rates and, therefore, the exposure of our net income to a change in interest rates is at least partially mitigated as an increase in rates would increase both interest income and interest expense, and a reduction in rates would decrease both interest income and interest expense.
Using the May 31, 2014 balances outstanding under these variable-rate debt arrangements, short-term lines of credit and cash investments, a 10% increase or decrease in short-term interest rates on an annualized basis compared to the interest rates as of May 31, 2014 would not result in a material adverse impact to pre-tax income, cash flows or financial position.
Derivative Financial Instruments
Historically, we have not entered into derivative financial instruments to mitigate interest rate fluctuation risk or foreign currency exchange rate risk. We may use derivative financial instruments in the future if we deem it useful in mitigating our exposure to interest rate or foreign currency exchange rate fluctuations.
44
ITEM 8- FINANCIAL STATEMENTS AND SUPPLEMENTARY DATA
REPORT OF INDEPENDENT REGISTERED PUBLIC ACCOUNTING FIRM
To the Board of Directors and Stockholders of
Global Payments Inc.
Atlanta, Georgia
We have audited the internal control over financial reporting of Global Payments Inc. and subsidiaries (the "Company") as of May 31, 2014, based on criteria established in Internal Control - Integrated Framework (1992) issued by the Committee of Sponsoring Organizations of the Treadway Commission. The Company's management is responsible for maintaining effective internal control over financial reporting and for its assessment of the effectiveness of internal control over financial reporting, included in the accompanying Management Report on Internal Control over Financial Reporting. Our responsibility is to express an opinion on the Company's internal control over financial reporting based on our audit.
We conducted our audit in accordance with the standards of the Public Company Accounting Oversight Board (United States). Those standards require that we plan and perform the audit to obtain reasonable assurance about whether effective internal control over financial reporting was maintained in all material respects. Our audit included obtaining an understanding of internal control over financial reporting, assessing the risk that a material weakness exists, testing and evaluating the design and operating effectiveness of internal control based on the assessed risk, and performing such other procedures as we considered necessary in the circumstances. We believe that our audit provides a reasonable basis for our opinion.
A company's internal control over financial reporting is a process designed by, or under the supervision of, the company's principal executive and principal financial officers, or persons performing similar functions, and effected by the company's board of directors, management, and other personnel to provide reasonable assurance regarding the reliability of financial reporting and the preparation of financial statements for external purposes in accordance with generally accepted accounting principles. A company's internal control over financial reporting includes those policies and procedures that (1) pertain to the maintenance of records that, in reasonable detail, accurately and fairly reflect the transactions and dispositions of the assets of the company; (2) provide reasonable assurance that transactions are recorded as necessary to permit preparation of financial statements in accordance with generally accepted accounting principles, and that receipts and expenditures of the company are being made only in accordance with authorizations of management and directors of the company; and (3) provide reasonable assurance regarding prevention or timely detection of unauthorized acquisition, use, or disposition of the company's assets that could have a material effect on the financial statements.
Because of the inherent limitations of internal control over financial reporting, including the possibility of collusion or improper management override of controls, material misstatements due to error or fraud may not be prevented or detected on a timely basis. Also, projections of any evaluation of the effectiveness of the internal control over financial reporting to future periods are subject to the risk that the controls may become inadequate because of changes in conditions, or that the degree of compliance with the policies or procedures may deteriorate.
In our opinion, the Company maintained, in all material respects, effective internal control over financial reporting as of May 31, 2014, based on the criteria established in Internal Control - Integrated Framework (1992) issued by the Committee of Sponsoring Organizations of the Treadway Commission.
We have also audited, in accordance with the standards of the Public Company Accounting Oversight Board (United States), the consolidated financial statements and financial statement schedule as of and for the year ended May 31, 2014 of the Company and our report dated July 29, 2014 expressed an unqualified opinion on those consolidated financial statements and financial statement schedule.
/s/ DELOITTE & TOUCHE LLP
Atlanta, Georgia
July 29, 2014
45
REPORT OF INDEPENDENT REGISTERED PUBLIC ACCOUNTING FIRM
To the Board of Directors and Stockholders of
Global Payments Inc.
Atlanta, Georgia
We have audited the accompanying consolidated balance sheets of Global Payments Inc. and subsidiaries (the "Company") as of May 31, 2014 and 2013, and the related consolidated statements of income, comprehensive income, changes in equity, and cash flows for each of the three years in the period ended May 31, 2014. Our audits also included the financial statement schedule listed in the Index at Item 15. These financial statements and financial statement schedule are the responsibility of the Company's management. Our responsibility is to express an opinion on the financial statements and financial statement schedule based on our audits.
We conducted our audits in accordance with the standards of the Public Company Accounting Oversight Board (United States). Those standards require that we plan and perform the audit to obtain reasonable assurance about whether the financial statements are free of material misstatement. An audit includes examining, on a test basis, evidence supporting the amounts and disclosures in the financial statements. An audit also includes assessing the accounting principles used and significant estimates made by management, as well as evaluating the overall financial statement presentation. We believe that our audits provide a reasonable basis for our opinion.
In our opinion, such consolidated financial statements present fairly, in all material respects, the financial position of Global Payments Inc. and subsidiaries as of May 31, 2014 and 2013, and the results of their operations and their cash flows for each of the three years in the period ended May 31, 2014, in conformity with accounting principles generally accepted in the United States of America. Also, in our opinion, such financial statement schedule, when considered in relation to the basic consolidated financial statements taken as a whole, presents fairly, in all material respects, the information set forth therein.
We have also audited, in accordance with the standards of the Public Company Accounting Oversight Board (United States), the Company's internal control over financial reporting as of May 31, 2014, based on the criteria established in Internal Control-Integrated Framework (1992) issued by the Committee of Sponsoring Organizations of the Treadway Commission and our report dated July 29, 2014 expressed an unqualified opinion on the Company's internal control over financial reporting.
/s/ DELOITTE & TOUCHE LLP
Atlanta, Georgia
July 29, 2014
46
GLOBAL PAYMENTS INC.
CONSOLIDATED STATEMENTS OF INCOME
(in thousands, except per share data)
Year Ended May 31, | |||||||||||
2014 | 2013 | 2012 | |||||||||
Revenues | $ | 2,554,236 | $2,375,923 | $ | 2,203,847 | ||||||
Operating expenses: | |||||||||||
Cost of service | 952,225 | 862,075 | 784,756 | ||||||||
Sales, general and administrative | 1,203,512 | 1,119,860 | 1,027,304 | ||||||||
Processing system intrusion | (7,000 | ) | 36,775 | 84,438 | |||||||
2,148,737 | 2,018,710 | 1,896,498 | |||||||||
Operating income | 405,499 | 357,213 | 307,349 | ||||||||
Other income (expense): | |||||||||||
Interest and other income | 13,663 | 10,353 | 9,946 | ||||||||
Interest and other expense | (41,812 | ) | (33,282 | ) | (16,848 | ) | |||||
(28,149 | ) | (22,929 | ) | (6,902 | ) | ||||||
Income before income taxes | 377,350 | 334,284 | 300,447 | ||||||||
Provision for income taxes | (107,398 | ) | (95,571 | ) | (82,881 | ) | |||||
Net income | 269,952 | 238,713 | 217,566 | ||||||||
Less: Net income attributable to noncontrolling interests, net of income tax | (24,666 | ) | (22,588 | ) | (29,405 | ) | |||||
Net income attributable to Global Payments | $ | 245,286 | $ | 216,125 | $ | 188,161 | |||||
Earnings per share attributable to Global Payments: | |||||||||||
Basic earnings per share | $ | 3.40 | $ | 2.78 | $ | 2.39 | |||||
Diluted earnings per share | $ | 3.37 | $ | 2.76 | $ | 2.37 | |||||
See Notes to Consolidated Financial Statements.
47
GLOBAL PAYMENTS INC.
CONSOLIDATED STATEMENTS OF COMPREHENSIVE INCOME
(in thousands)
Year End May 31, | |||||||||||
2014 | 2013 | 2012 | |||||||||
Net income | $ | 269,952 | $ | 238,713 | $ | 217,566 | |||||
Other comprehensive income (loss): | |||||||||||
Foreign currency translation adjustments | 17,034 | 20,629 | (139,722 | ) | |||||||
Income tax benefit related to foreign currency translation adjustments | 3,133 | 582 | 6,879 | ||||||||
Changes in unrecognized pension benefit costs | 236 | 2,302 | (3,470 | ) | |||||||
Income tax (expense) benefit related to changes in unrecognized pension benefit costs | (63 | ) | (785 | ) | 1,260 | ||||||
Other comprehensive income (loss), net of tax | 20,340 | 22,728 | (135,053 | ) | |||||||
Comprehensive income | 290,292 | 261,441 | 82,513 | ||||||||
Less: comprehensive income attributable to noncontrolling interests | (31,720 | ) | (30,378 | ) | (3,673 | ) | |||||
Comprehensive income attributable to Global Payments | $ | 258,572 | $ | 231,063 | $ | 78,840 | |||||
See Notes to Consolidated Financial Statements.
48
GLOBAL PAYMENTS INC.
CONSOLIDATED BALANCE SHEETS
(in thousands, except share data)
May 31, 2014 | May 31, 2013 | ||||||
ASSETS | |||||||
Current assets: | |||||||
Cash and cash equivalents | $ | 581,872 | $ | 680,470 | |||
Accounts receivable, net of allowances for doubtful accounts of $401 and $509, respectively | 214,574 | 189,435 | |||||
Claims receivable, net | 809 | 1,156 | |||||
Settlement processing assets | 780,917 | 259,204 | |||||
Inventory | 6,636 | 11,057 | |||||
Deferred income taxes | 12,963 | 6,485 | |||||
Prepaid expenses and other current assets | 45,673 | 66,685 | |||||
Total current assets | 1,643,444 | 1,214,492 | |||||
Goodwill | 1,337,285 | 1,044,222 | |||||
Other intangible assets, net | 535,173 | 400,848 | |||||
Property and equipment, net | 369,753 | 348,064 | |||||
Deferred income taxes | 101,928 | 95,178 | |||||
Other | 31,067 | 22,252 | |||||
Total assets | $ | 4,018,650 | $ | 3,125,056 | |||
LIABILITIES AND EQUITY | |||||||
Current liabilities: | |||||||
Lines of credit | $ | 440,128 | $ | 187,461 | |||
Current portion of long-term debt | 17,677 | 72,335 | |||||
Accounts payable and accrued liabilities | 290,106 | 262,890 | |||||
Settlement processing obligations | 451,317 | 162,558 | |||||
Income taxes payable | 12,390 | 18,870 | |||||
Total current liabilities | 1,211,618 | 704,114 | |||||
Long-term debt | 1,376,002 | 891,134 | |||||
Deferred income taxes | 209,099 | 170,723 | |||||
Other long-term liabilities | 89,132 | 72,478 | |||||
Total liabilities | 2,885,851 | 1,838,449 | |||||
Commitments and contingencies (See Note 15) | |||||||
Equity: | |||||||
Preferred stock, no par value; 5,000,000 shares authorized and none issued | — | — | |||||
Common stock, no par value; 200,000,000 shares authorized; 68,845,643 and 75,426,099 issued and outstanding at May 31, 2014 and 2013, respectively | — | — | |||||
Paid-in capital | 183,023 | 202,396 | |||||
Retained earnings | 815,980 | 958,751 | |||||
Accumulated other comprehensive loss | (1,776 | ) | (15,062 | ) | |||
Total Global Payments shareholders’ equity | 997,227 | 1,146,085 | |||||
Noncontrolling interests | 135,572 | 140,522 | |||||
Total equity | 1,132,799 | 1,286,607 | |||||
Total liabilities and equity | $ | 4,018,650 | $ | 3,125,056 | |||
See Notes to Consolidated Financial Statements.
49
GLOBAL PAYMENTS INC.
CONSOLIDATED STATEMENTS OF CASH FLOWS
(in thousands)
Year Ended May 31, | |||||||||||
2014 | 2013 | 2012 | |||||||||
Cash flows from operating activities: | |||||||||||
Net income | $ | 269,952 | $ | 238,713 | $ | 217,566 | |||||
Adjustments to reconcile net income to net cash provided by (used in) operating activities: | |||||||||||
Depreciation and amortization of property and equipment | 60,124 | 55,023 | 48,403 | ||||||||
Amortization of acquired intangibles | 61,945 | 56,765 | 50,696 | ||||||||
Share-based compensation expense | 29,793 | 18,427 | 16,391 | ||||||||
Provision for operating losses and bad debts | 20,574 | 21,659 | 22,417 | ||||||||
Deferred income taxes | (1,799 | ) | 33,112 | (19,498 | ) | ||||||
Other, net | (1,484 | ) | (4,878 | ) | (2,775 | ) | |||||
Changes in operating assets and liabilities, net of the effects of acquisitions: | |||||||||||
Accounts receivable | (18,539 | ) | (5,458 | ) | (16,422 | ) | |||||
Claims receivable | (11,569 | ) | (11,858 | ) | (13,519 | ) | |||||
Settlement processing assets and obligations, net | (241,431 | ) | (104,007 | ) | (568,335 | ) | |||||
Inventory | 4,793 | (1,187 | ) | (2,394 | ) | ||||||
Prepaid expenses and other assets | 18,995 | (22,978 | ) | 3,511 | |||||||
Accounts payable and other accrued liabilities | 9,224 | (39,374 | ) | 85,875 | |||||||
Income taxes payable | (6,480 | ) | 6,587 | 4,609 | |||||||
Net cash provided by (used in) operating activities | 194,098 | 240,546 | (173,475 | ) | |||||||
Cash flows from investing activities: | |||||||||||
Business, intangible and other asset acquisitions, net of cash acquired | (426,524 | ) | (434,016 | ) | (44,274 | ) | |||||
Capital expenditures | (81,411 | ) | (98,590 | ) | (109,876 | ) | |||||
Principal collections on financing receivables | 2,658 | 2,812 | 2,565 | ||||||||
Net proceeds from sale of investments and business | 3,607 | 1,227 | 1,152 | ||||||||
Net cash used in investing activities | (501,670 | ) | (528,567 | ) | (150,433 | ) | |||||
Cash flows from financing activities: | |||||||||||
Net borrowings (payments) on short-term lines of credit | 252,667 | (27,930 | ) | (55,354 | ) | ||||||
Proceeds from issuance of long-term debt | 2,690,000 | 1,135,327 | 146,374 | ||||||||
Principal payments under long-term debt | (2,260,597 | ) | (482,349 | ) | (184,235 | ) | |||||
Acquisition of redeemable noncontrolling interest | — | (242,000 | ) | — | |||||||
Payment of debt issuance costs | (5,961 | ) | (3,987 | ) | — | ||||||
Repurchase of common stock | (447,307 | ) | (175,297 | ) | (99,604 | ) | |||||
Proceeds from stock issued under share-based compensation plans | 31,727 | 10,543 | 11,446 | ||||||||
Common stock repurchased - share-based compensation plans | (5,681 | ) | (10,244 | ) | (4,861 | ) | |||||
Tax benefit from share-based compensation plans | 6,475 | 1,863 | 1,441 | ||||||||
Distributions to noncontrolling interests | (36,670 | ) | (16,206 | ) | (27,082 | ) | |||||
Dividends paid | (5,757 | ) | (6,198 | ) | (6,311 | ) | |||||
Net cash provided by (used in) financing activities | 218,896 | 183,522 | (218,186 | ) | |||||||
Effect of exchange rate changes on cash | (9,922 | ) | 3,694 | (30,916 | ) | ||||||
Decrease in cash and cash equivalents | (98,598 | ) | (100,805 | ) | (573,010 | ) | |||||
Cash and cash equivalents, beginning of the period | 680,470 | 781,275 | 1,354,285 | ||||||||
Cash and cash equivalents, end of the period | $ | 581,872 | $ | 680,470 | $ | 781,275 | |||||
See Notes to Consolidated Financial Statements.
50
GLOBAL PAYMENTS INC.
CONSOLIDATED STATEMENTS OF CHANGES IN EQUITY
(in thousands, except per share data)
Number of Shares | Paid-in Capital | Retained Earnings | Accumulated Other Comprehensive Income (Loss) | Total Global Payments Shareholders’ Equity | Noncontrolling Interests | Total Equity | |||||||||||||||||||
Balance at May 31, 2013 | 75,426 | $ | 202,396 | $ | 958,751 | $ | (15,062 | ) | $ | 1,146,085 | $ | 140,522 | $ | 1,286,607 | |||||||||||
Net income | 245,286 | 245,286 | 24,666 | 269,952 | |||||||||||||||||||||
Changes in unrecognized pension benefit costs, net of tax of ($63) | 173 | 173 | 173 | ||||||||||||||||||||||
Foreign currency translation adjustment, net of tax of $3,133 | 13,113 | 13,113 | 7,054 | 20,167 | |||||||||||||||||||||
Stock issued under share-based compensation plans | 1,901 | 31,727 | 31,727 | 31,727 | |||||||||||||||||||||
Common stock repurchased - share-based compensation plans | (644 | ) | (14,498 | ) | (14,498 | ) | (14,498 | ) | |||||||||||||||||
Tax benefit from share-based compensation plans, net | 6,351 | 6,351 | 6,351 | ||||||||||||||||||||||
Share-based compensation expense | 29,793 | 29,793 | 29,793 | ||||||||||||||||||||||
Distributions to noncontrolling interests | (36,670 | ) | (36,670 | ) | |||||||||||||||||||||
Repurchase of common stock | (7,837 | ) | (72,746 | ) | (382,300 | ) | (455,046 | ) | (455,046 | ) | |||||||||||||||
Dividends paid ($0.08 per share) | (5,757 | ) | (5,757 | ) | (5,757 | ) | |||||||||||||||||||
Balance at May 31, 2014 | 68,846 | $ | 183,023 | $ | 815,980 | $ | (1,776 | ) | $ | 997,227 | $ | 135,572 | $ | 1,132,799 | |||||||||||
See Notes to Consolidated Financial Statements.
51
GLOBAL PAYMENTS INC.
CONSOLIDATED STATEMENTS OF CHANGES IN EQUITY
(in thousands, except per share data)
Number of Shares | Paid-in Capital | Retained Earnings | Accumulated Other Comprehensive Income (Loss) | Total Global Payments Shareholders’ Equity | Noncontrolling Interests | Total Equity | |||||||||||||||||||
Balance at May 31, 2012 | 78,551 | $ | 358,728 | $ | 843,456 | $ | (30,000 | ) | $ | 1,172,184 | $ | 128,737 | $ | 1,300,921 | |||||||||||
Net income | 216,125 | 216,125 | 20,774 | 236,899 | |||||||||||||||||||||
Changes in unrecognized pension benefit costs, net of tax of ($785) | 1,517 | 1,517 | 1,517 | ||||||||||||||||||||||
Foreign currency translation adjustment, net of tax of $582 | 13,421 | 13,421 | 7,217 | 20,638 | |||||||||||||||||||||
Stock issued under share-based compensation plans | 885 | 10,543 | 10,543 | 10,543 | |||||||||||||||||||||
Common stock repurchased - share-based compensation plans | (335 | ) | (10,244 | ) | (10,244 | ) | (10,244 | ) | |||||||||||||||||
Tax benefit from share-based compensation plans, net | 850 | 850 | 850 | ||||||||||||||||||||||
Share-based compensation expense | 18,427 | 18,427 | 18,427 | ||||||||||||||||||||||
Distributions to noncontrolling interests | (16,206 | ) | (16,206 | ) | |||||||||||||||||||||
Redeemable noncontrolling interest valuation adjustment | 817 | 817 | 817 | ||||||||||||||||||||||
Repurchase of common stock | (3,675 | ) | (79,900 | ) | (95,449 | ) | (175,349 | ) | (175,349 | ) | |||||||||||||||
Purchase of redeemable noncontrolling interest | (96,008 | ) | (96,008 | ) | (96,008 | ) | |||||||||||||||||||
Dividends paid ($0.08 per share) | (6,198 | ) | (6,198 | ) | (6,198 | ) | |||||||||||||||||||
Balance at May 31, 2013 | 75,426 | $ | 202,396 | $ | 958,751 | $ | (15,062 | ) | $ | 1,146,085 | $ | 140,522 | $ | 1,286,607 | |||||||||||
See Notes to Consolidated Financial Statements.
52
GLOBAL PAYMENTS INC.
CONSOLIDATED STATEMENTS OF CHANGES IN EQUITY
(in thousands, except per share data)
Number of Shares | Paid-in Capital | Retained Earnings | Accumulated Other Comprehensive Income (Loss) | Total Global Payments Shareholders' Equity | Noncontrolling Interests | Total Equity | |||||||||||||||||||
Balance at May 31, 2011 | 80,335 | $ | 419,591 | $ | 685,624 | $ | 79,320 | $ | 1,184,535 | $ | 153,282 | $ | 1,337,817 | ||||||||||||
Net income | 188,161 | 188,161 | 17,804 | 205,965 | |||||||||||||||||||||
Changes in unrecognized pension benefit costs, net of tax of $1,260 | (2,210 | ) | (2,210 | ) | (2,210 | ) | |||||||||||||||||||
Foreign currency translation adjustment, net of tax of $6,879 | (107,110 | ) | (107,110 | ) | (22,991 | ) | (130,101 | ) | |||||||||||||||||
Stock issued under share-based compensation plans | 833 | 11,446 | 11,446 | 11,446 | |||||||||||||||||||||
Common stock repurchased - share-based compensation plans | (327 | ) | (4,861 | ) | (4,861 | ) | (4,861 | ) | |||||||||||||||||
Tax benefit from share-based compensation plans, net | 1,176 | 1,176 | 1,176 | ||||||||||||||||||||||
Share-based compensation expense | 16,391 | 16,391 | 16,391 | ||||||||||||||||||||||
Distributions to noncontrolling interests | (19,358 | ) | (19,358 | ) | |||||||||||||||||||||
Redeemable noncontrolling interest valuation adjustment | (9,429 | ) | (9,429 | ) | (9,429 | ) | |||||||||||||||||||
Repurchase of common stock | (2,290 | ) | (85,015 | ) | (14,589 | ) | (99,604 | ) | (99,604 | ) | |||||||||||||||
Dividends paid ($0.08 per share) | (6,311 | ) | (6,311 | ) | (6,311 | ) | |||||||||||||||||||
Balance at May 31, 2012 | 78,551 | $ | 358,728 | $ | 843,456 | $ | (30,000 | ) | $ | 1,172,184 | $ | 128,737 | $ | 1,300,921 | |||||||||||
See Notes to Consolidated Financial Statements.
53
NOTES TO CONSOLIDATED FINANCIAL STATEMENTS
NOTE 1—SUMMARY OF SIGNIFICANT ACCOUNTING POLICIES
Business, Consolidation and Presentation— Global Payments Inc. is a worldwide provider of payment solutions for merchants, value-added resellers, enterprise software providers, financial institutions, government agencies, multi-national corporations and independent sales organizations (“ISOs”) located throughout North America, Europe and the Asia-Pacific region and in Brazil. We provide payment and digital commerce solutions and operate in two business segments, North America Merchant Services and International Merchant Services.
We were incorporated in Georgia as Global Payments Inc. in September 2000 and we spun-off from our former parent company on January 31, 2001. Including our time as part of our former parent company, we have been in the payments business since 1967. Global Payments Inc. and its consolidated subsidiaries are referred to collectively as "Global Payments," the "Company," "we," "our" or "us," unless the context requires otherwise.
These consolidated financial statements include our accounts and those of our majority-owned subsidiaries and all intercompany balances and transactions have been eliminated. These consolidated financial statements have been prepared in accordance with accounting principles generally accepted in the United States ("GAAP") and present our financial position, results of operations, and cash flows.
Use of estimates— The preparation of financial statements in conformity with GAAP requires management to make certain estimates and assumptions that affect the reported amounts of assets and liabilities and disclosures of contingent assets and liabilities at the date of the financial statements, as well as the reported amounts of revenues and expenses during the reported period. Actual results could differ from those estimates.
Revenue recognition— Our two merchant services segments primarily include processing solutions for credit cards, debit cards, electronic payments and check-related services. Revenue is recognized as such services are performed. Revenue for processing services provided directly to merchants is recorded net of interchange fees charged by card issuing banks. Our primary business model provides payment products and services directly to merchants as our end customers. We also provide similar products and services to financial institutions and a limited number of ISOs that, in turn, resell our products and services, in which case, the financial institutions and select ISOs are our end customers. The majority of merchant services revenue is generated on services priced as a percentage of transaction value or a specified fee per transaction, depending on card type. We also charge other fees based on specific services that are unrelated to the number of transactions or the transaction value. Revenue from credit cards and signature debit cards is generally based on a percentage of transaction value along with other related fees, while revenue from PIN-based debit cards is typically based on a fee per transaction.
Cash and cash equivalents— Cash and cash equivalents include cash on hand and all liquid investments with an initial maturity of three months or less when purchased. Cash and cash equivalents include reserve funds collected from our merchants that serve as collateral to minimize contingent liabilities associated with any losses that may occur under the merchant agreement (“Merchant Reserves”). We record a corresponding liability in settlement processing assets and settlement processing obligations in our consolidated balance sheet. While this cash is not restricted in its use, we believe that designating this cash to collateralize Merchant Reserves strengthens our fiduciary standing with our member sponsors and is in accordance with guidelines set by the card networks. As of May 31, 2014 and 2013, our cash and cash equivalents included $124.7 million and $280.7 million, respectively, related to Merchant Reserves.
Certain of our member sponsors hold Merchant Reserves on our behalf. In these instances, neither the Merchant Reserve cash nor the corresponding liability appears on our consolidated balance sheet; however, we have access to the collateral in the event that we incur a merchant loss. During the year ended May 31, 2014, we transferred a significant amount of merchant reserve cash to one of our member sponsors to whom we transferred a substantial portion of our processing volume.
Our cash and cash equivalents include settlement related cash balances. Settlement related cash balances represent surplus funds that we hold on behalf of our member sponsors when the incoming amount from the card networks precedes the member sponsors’ funding obligation to the merchant. Settlement related cash balances are not restricted; however, these funds are generally
54
paid out in satisfaction of settlement processing obligations the following day. Please see Note 3 - Settlement Processing Assets and Obligations and discussion below for further information.
Inventory— Inventory, which includes electronic point of sale terminals, automated teller machines ("ATMs"), and related peripheral equipment, is stated at the lower of cost or fair value. Cost is determined by using the average cost method.
Settlement processing assets and obligations— Settlement processing assets and obligations represent intermediary balances arising in our settlement process for direct merchants. In accordance with Accounting Standards Codification ("ASC") 210-20, Offsetting, we apply offsetting to our settlement processing assets and obligations where legal right of set off exists. Please see Note 3 - Settlement Processing Assets and Obligations for further information.
Reserve for operating losses— As a part of our merchant credit and debit card processing and check guarantee services, we experience merchant losses and check guarantee losses, which are collectively referred to as “operating losses.”
Our credit card processing merchant customers are liable for any charges or losses that occur under the merchant agreement. In the event, however, that we are not able to collect such amount from the merchants, due to merchant fraud, insolvency, bankruptcy or any other merchant-related reason, we may be liable for any such losses. We require Merchant Reserves, guarantees, letters of credit, and other types of collateral by certain merchants to minimize any such contingent liability. We also utilize a number of systems and procedures to manage merchant risk. We have, however, historically experienced losses due to merchant defaults.
We record reserves for our estimated liability for operating losses. This estimate of losses is comprised of estimated known losses and estimated incurred but not reported losses. Estimated known losses arise from specific instances of, for example, merchant bankruptcies, closures or fraud of which we are aware at the balance sheet date, but for which the ultimate amount of associated loss will not be determined until after the balance sheet date. Estimated known loss accruals are recorded when it is probable that we have incurred a loss and the loss is reasonably estimable. Estimated known losses are calculated at the merchant level based on chargebacks received to date, processed volume, and historical chargeback ratios. The estimate is reduced for any collateral that we hold. Accruals for estimated known losses are evaluated periodically and adjusted as appropriate based on actual loss experience. Incurred but not reported losses result from transactions that we process before the balance sheet date for which we have not yet received chargeback notification. We estimate incurred but not reported losses by applying historical loss ratios to our direct merchant credit card and signature debit card sales volumes processed, or processed volume. Historically, this estimation process has been materially accurate.
As of May 31, 2014 and 2013, $1.7 million and $2.3 million, respectively, was recorded to reflect the reserve for operating losses with merchant card processing. These amounts are included in settlement processing obligations in the accompanying consolidated balance sheets. The expense associated with the fair value of the guarantees of customer chargebacks is included in cost of service in the accompanying consolidated statements of income. For the years ended May 31, 2014, 2013 and 2012, we recorded such expenses in the amounts of $8.7 million, $9.5 million and $8.8 million, respectively.
In our check guarantee service offering, we charge our merchants a percentage of the gross amount of the check and guarantee payment of the check to the merchant in the event the check is not honored by the checkwriter's bank. We have the right to collect the full amount of the check from the checkwriter but have not historically recovered 100% of the guaranteed checks. Our check guarantee loss reserve is comprised of estimated losses on returned checks and estimated incurred but not reported losses. We estimate the loss on returned checks by applying historical collection rates to our claims receivable balance. We estimate incurred but not reported losses by applying historical loss ratios to the face value of our guaranteed checks. As of May 31, 2014 and 2013, we had a check guarantee loss reserve of $3.0 million and $3.1 million, respectively, which is included in net claims receivable in the accompanying consolidated balance sheets. For the years ended May 31, 2014, 2013 and 2012, we recorded expenses of $11.9 million, $11.7 million and $13.4 million, respectively, which are included in cost of service in the accompanying consolidated statements of income. The estimated check returns and recovery amounts are subject to the risk that actual amounts returned and recovered in the future may differ significantly from estimates used in calculating the receivable valuation allowance.
As the potential for merchants’ failure to settle individual reversed charges from consumers in our merchant credit card processing offering and the timing of individual checks clearing the payors’ banks in our check guarantee offering are not predictable, it is not practicable to calculate the maximum amounts for which we could be liable under the guarantees issued under the merchant card processing and check guarantee service offerings. It is also not practicable to estimate the extent to which merchant collateral or subsequent collections of dishonored checks, respectively, would offset these exposures due to these same uncertainties.
55
Property and equipment— Property and equipment are stated at amortized cost. Depreciation and amortization are calculated using the straight-line method, except for certain technology assets discussed below. Leasehold improvements are amortized over the lesser of the remaining term of the lease or the useful life of the asset. Maintenance and repairs are charged to operations as incurred.
We develop software that is used in providing processing services to customers. Capitalization of internally developed software, primarily associated with operating platforms, occurs when we have completed the preliminary project stage, management authorizes the project, management commits to funding the project, and it is probable the project will be completed and used to perform the function intended. The preliminary project stage consists of the conceptual formulation of alternatives, the evaluation of alternatives, the determination of existence of needed technology and the final selection of alternatives. Costs incurred during the preliminary project stage are expensed as incurred.
As of May 31, 2014, we had placed into service $96.7 million of hardware and software associated with our authorization platform. This platform serves as a front-end operating environment for merchant processing and is intended to replace a number of legacy platforms. Depreciation and amortization associated with these costs is calculated based on transactions expected to be processed over the life of the platform. We believe that this method is more representative of the platform's use than the straight-line method. We are currently processing transactions on this authorization platform in nine markets in our Asia-Pacific region and for a limited number of U.S. merchants. As these markets represent a small percentage of our overall transactions, depreciation and amortization related to this platform for fiscal 2014, 2013 and 2012 was not significant. Depreciation and amortization expense will increase as we complete migrations of other merchants to this authorization platform.
Goodwill and other intangible assets— Goodwill is tested for impairment at the reporting unit level. We test goodwill for impairment annually as of January 1st and more often if an event occurs or circumstances change that would more likely than not reduce the fair value of a reporting unit below its net carrying value. We have the option of performing a qualitative assessment of impairment to determine whether any further quantitative testing for impairment is necessary. The option of whether or not to perform a qualitative assessment is made from year-to-year and can vary by reporting unit.
As of January 1, 2014, we elected to apply the qualitative goodwill impairment assessment guidance in ASC 350-20, Goodwill, for each of our reporting units. Factors we consider in the qualitative assessment include general macroeconomic conditions, industry and market conditions, cost factors, overall financial performance of our reporting units, events or changes affecting the composition or carrying value of the net assets of our reporting units, sustained decrease in our share price, and other relevant entity specific events. If we elect to bypass the qualitative assessment or if we determine, on the basis of qualitative factors, that the fair value of the reporting unit is more likely than not less than the carrying value, a two-step quantitative test is required. In the first step, the reporting unit's carrying amount, including goodwill, is compared to its fair value. If the carrying amount of the reporting unit is greater than its fair value, goodwill is considered impaired and step two must be performed. Step two measures the impairment loss by comparing the implied fair value of reporting unit goodwill with the carrying amount of that goodwill. The implied fair value of goodwill is determined by allocating the fair value of the reporting unit to all the assets and liabilities of that unit (including unrecognized intangibles) as if the reporting unit had been acquired in a business combination. The excess of the fair value over the amounts allocated to the assets and liabilities of the reporting unit is the implied fair value of the goodwill. The excess of the carrying amount over the implied fair value of the goodwill is the impairment loss.
We have six reporting units: North America Merchant Services, U.K. Merchant Services, Asia-Pacific Merchant Services, Central and Eastern Europe Merchant Services, Russia Merchant Services and Spain Merchant Services. Based on our annual assessment as of January 1, 2014, we determined on the basis of qualitative factors, that the fair values of the reporting units were not more likely than not less than their respective carrying values; and therefore, a two-step quantitative test was not required. We believe that the fair values of our reporting units are substantially in excess of their carrying values.
Our goodwill impairment testing involves the use of estimates and the exercise of judgment on the part of management. Our assessment of the qualitative factors discussed above involves significant judgments about expected future business performance and general market conditions. Significant changes in our assessment of such qualitative factors could affect our assessment of the fair value of one or more of our reporting units and could result in a goodwill impairment charge in a future period.
Other intangible assets primarily represent customer-related intangible assets (such as customer lists and merchant contracts), contract-based intangible assets (such as non-compete agreements, referral agreements and processing rights), acquired technology
56
and trademarks associated with acquisitions. Customer-related intangible assets, contract-based intangible assets and trademarks are amortized over their estimated useful lives of from 5 to 30 years. The useful lives for customer-related intangible assets are determined based primarily on forecasted cash flows, which include estimates for the revenues, expenses, and customer attrition associated with the assets. The useful lives of contract-based intangible assets are equal to the terms of the agreements. The useful lives of amortizable trademarks are based on our plans to phase out the trademarks in the applicable markets. Acquired technology is amortized on a straight-line basis over its estimated useful life.
Amortization for most of our customer-related intangible assets is calculated using an accelerated method. In determining amortization expense under our accelerated method for any given period, we calculate the expected cash flows for that period that were used in determining the acquired value of the asset and divide that amount by the expected total cash flows over the estimated life of the asset. We multiply that percentage by the initial carrying value of the asset to arrive at the amortization expense for that period. If the cash flow patterns that we experience differ significantly from our initial estimates, we will adjust the amortization schedule accordingly. These cash flow patterns are derived using certain assumptions and cost allocations due to a significant amount of asset interdependencies that exist in our business. During fiscal 2014, we did not adjust the amortization schedules.
We believe that our accelerated method better approximates the distribution of cash flows generated by our acquired customer relationships. We use the straight-line method of amortization for our contract-based intangibles and amortizable trademarks.
Impairment of long-lived assets— We regularly evaluate whether events and circumstances have occurred that indicate the carrying amount of property and equipment and finite-life intangible assets may not be recoverable. When factors indicate that these long-lived assets should be evaluated for possible impairment, we assess the potential impairment by determining whether the carrying value of such long-lived assets will be recovered through the future undiscounted cash flows expected from use of the asset and its eventual disposition. If the carrying amount of the asset is determined not to be recoverable, a write-down to fair value is recorded. Fair values are determined based on quoted market prices or discounted cash flow analysis as applicable. We regularly evaluate whether events and circumstances have occurred that indicate the useful lives of property and equipment and finite-life intangible assets may warrant revision. In our opinion, the carrying values of our long-lived assets, including property and equipment and finite-life intangible assets, were not impaired at May 31, 2014 and 2013.
Income taxes— Deferred income taxes are determined based on the difference between the financial statement and tax bases of assets and liabilities using enacted tax laws and rates. A valuation allowance is provided when it is more likely than not that some portion or all of the deferred tax assets will not be realized.
Fair value measurements — GAAP requires disclosures about assets and liabilities that are measured at fair value. Fair value is defined as the price that would be received to sell an asset or paid to transfer a liability in an orderly transaction between market participants at the reporting date. The reporting standard establishes consistency and comparability by providing a fair value hierarchy that prioritizes the inputs to valuation techniques into three broad levels. Level 1 inputs utilize quoted prices in active markets for identical assets or liabilities. Level 2 inputs are based on other observable market data, such as quoted prices for similar assets and liabilities, and inputs other than quoted prices that are observable such as interest rates and yield curves. Level 3 inputs are developed from unobservable data reflecting our assumptions and include situations where there is little or no market activity for the asset or liability.
Fair value of financial instruments— We consider that the carrying amounts of our financial instruments, including cash and cash equivalents, receivables, lines of credit, accounts payable and accrued liabilities, approximate their fair value given the short-term nature of these items. Our long-term debt includes variable interest rates based on the London Interbank Offered Rate ("LIBOR"), the Federal Funds Effective Rate (as defined in the debt agreements) or the prime rate plus a margin based on our leverage position. At May 31, 2014, the carrying amount of our term loan and Corporate Credit Facility approximates fair value, which is calculated using Level 2 inputs. Please see Note 7 – Long-Term Debt and Credit Facilities for further information.
Foreign currencies— We have significant operations in a number of foreign subsidiaries whose functional currency is their local currency. Gains and losses on transactions denominated in currencies other than the functional currencies are included in determining net income for the period. For the years ended May 31, 2014 and 2013, our transaction gains and losses were insignificant.
The assets and liabilities of subsidiaries whose functional currency is a foreign currency are translated at the period-end rate of exchange. Income statement items are translated at the weighted average rates prevailing during the period. The resulting translation
57
adjustment is recorded as a component of other comprehensive income and is included in equity. Translation gains and losses on intercompany balances of a long-term investment nature are also recorded as a component of other comprehensive income.
Earnings per share— Basic earnings per share is computed by dividing reported earnings available to common shareholders by the weighted average shares outstanding during the period. Earnings available to common shareholders is the same as reported net income attributable to Global Payments for all periods presented.
Diluted earnings per share is computed by dividing reported earnings available to common shareholders by the weighted average shares outstanding during the period and the impact of securities that would have a dilutive effect on earnings per share. All options with an exercise price less than the average market share price for the period are assumed to have a dilutive effect on earnings per share. The diluted share base for the fiscal years ended May 31, 2013 and 2012 excludes 0.3 million and 0.2 million shares, respectively, related to stock options that would have an antidilutive effect on the computation of diluted earnings per share. For the fiscal year ended May 31, 2014, there were no such shares to exclude. No additional securities were outstanding that could potentially dilute basic earnings per share.
The following table sets forth the computation of diluted weighted average shares outstanding for the years ended May 31, 2014, 2013 and 2012:
2014 | 2013 | 2012 | ||||||
(in thousands) | ||||||||
Basic weighted average shares outstanding | 72,119 | 77,767 | 78,829 | |||||
Plus: Dilutive effect of stock options and other share-based awards | 569 | 460 | 602 | |||||
Diluted weighted average shares outstanding | 72,688 | 78,227 | 79,431 | |||||
Repurchased shares—We account for the retirement of repurchased shares using the par value method under which we allocate the cost of repurchased and retired shares between paid-in capital and retained earnings by comparing the price of shares repurchased to the original issue proceeds of those shares. When the repurchase price of the shares repurchased is greater than the original issue proceeds, the excess is charged to retained earnings. We use a last-in, first-out cost flow assumption to identify the original issue proceeds to the cost of the shares repurchased. We believe that this allocation method is preferable because it more accurately reflects our paid-in capital balances by allocating the cost of the shares repurchased and retired to paid-in capital in proportion to paid-in capital associated with the original issuance of said shares.
New accounting pronouncements— From time-to-time, new accounting pronouncements are issued by the Financial Accounting Standards Board ("FASB") or other standards setting bodies that are adopted by us as of the specified effective date. Unless otherwise discussed, our management believes that the impact of recently issued standards that are not yet effective will not have a material impact on our consolidated financial statements upon adoption.
In May 2014, the FASB issued Accounting Standards Update ("ASU") 2014-09, "Revenue from Contracts with Customers(Topic 606)." The core principle of the ASU is that an entity should recognize revenue for the transfer of goods or services equal to the amount that it expects to be entitled to receive for those goods or services. The ASU requires additional disclosure about the nature, amount, timing and uncertainty of revenue and cash flows arising from customer contracts, including significant judgments and changes in judgments. The amendments are effective for annual reporting periods beginning after December 15, 2016, including interim periods within that reporting period. Early application is not permitted. We are evaluating the impact of this ASU on our consolidated financial statements.
In April 2014, the FASB issued ASU 2014-08, "Presentation of Financial Statements (Topic 205) and Property, Plant, and Equipment (Topic 360) Reporting Discontinued Operations and Disclosures of Disposals of Components of an Entity." The amendments in ASU 2014-11change the requirements for reporting discontinued operations in ASC 205-20. The amendments change the definition of discontinued operations by limiting discontinued operations reporting to disposals of components of an entity that represent strategic shifts that have (or will have) a major effect on an entity’s operations and financial results. The amendments require expanded disclosures for discontinued operations and are effective for fiscal years, and interim periods within those years, beginning after December 15, 2014. Early adoption is permitted, but only for disposals (or classifications as "held for sale") that have not been reported in financial statements previously issued or available for issuance.
58
In July 2013, the FASB issued ASU 2013-11, "Presentation of an Unrecognized Tax Benefit When a Net Operating Loss Carryforward, a Similar Tax Loss, or a Tax Credit Carryforward Exists" ("ASU 2013-11"). The amendments in ASU 2013-11 require an entity to present an unrecognized tax benefit in the financial statements as a reduction to a deferred tax asset for a net operating loss ("NOL") carryforward, a similar tax loss, or a tax credit carryforward except when: (1) A NOL carryforward, a similar tax loss, or a tax credit carryforward is not available as of the reporting date under the governing tax law to settle taxes that would result from the disallowance of the tax position; or (2) the entity does not intend to use the deferred tax asset for this purpose (provided that the tax law permits a choice). If either of these conditions exists, an entity should present an unrecognized tax benefit in the financial statements as a liability and should not net the unrecognized tax benefit with a deferred tax asset. The amendment does not affect the recognition or measurement of uncertain tax positions under ASC 740-5. The amendments in this ASU are effective for fiscal years, and interim periods within those years, beginning after December 15, 2013. The amendments should be applied prospectively to all unrecognized tax benefits that exist at the effective date. Retrospective application is permitted.
In March 2013, the FASB issued ASU 2013-05, "Foreign Currency Matters" ("ASU 2013-05"). The amendments in ASU 2013-05 resolve the diversity in practice about whether current literature applies to the release of the cumulative translation adjustment into net income when a parent either sells a part or all of its investment in a foreign entity or no longer holds a controlling financial interest in a subsidiary or group of assets that is a nonprofit activity or a business within a foreign entity. In addition, the amendments in ASU 2013-05 resolve the diversity in practice for the treatment of business combinations achieved in stages (sometimes also referred to as step acquisitions) involving a foreign entity. ASU 2013-05 is effective prospectively for fiscal years and interim reporting periods within those years, beginning after December 15, 2013.
NOTE 2—PROCESSING SYSTEM INTRUSION
In March 2012, we identified and self-reported unauthorized access into a limited portion of our North America card processing system and potential unauthorized access to servers containing personal information collected from U.S. merchants who applied for processing services. We incurred approximately $114.2 million of cumulative expenses, net of insurance recoveries of $27.0 million, relating to the incident. During fiscal 2014, we recorded a credit of $7.0 million related to insurance recoveries. During fiscal 2013 and 2012, we recorded net processing system intrusion charges of $36.8 million and $84.4 million, respectively. As a result of this event, certain card networks temporarily removed us from their lists of Payment Card Industry Data Security Standards (“PCI DSS”) compliant service providers. After remediating our processes and systems, we returned to the lists of PCI DSS compliant service providers in the third quarter of fiscal 2013.
NOTE 3—SETTLEMENT PROCESSING ASSETS AND OBLIGATIONS
Funds settlement refers to the process of transferring funds for sales and credits between card issuers and merchants. For transactions processed on our systems, we use our internal network to provide funding instructions to financial institutions that in turn fund the merchants. We process funds settlement under two models, a sponsorship model and a direct membership model.
Under the sponsorship model, we are designated as a Merchant Service Provider by MasterCard and an ISO by Visa, which means that member clearing banks ("Member") sponsor us and require our adherence to the standards of the networks. In certain markets, we have sponsorship or depository and clearing agreements with financial institution sponsors. These agreements allow us to route transactions under the Members' control and identification numbers to clear credit card transactions through MasterCard and Visa. In this model, the standards of the card networks restrict us from performing funds settlement or accessing merchant settlement funds, and, instead, require that these funds be in the possession of the Member until the merchant is funded.
Under the direct membership model, we are direct members in various payment networks, allowing us to process and fund transactions without third-party sponsorship. In this model, we route and clear transactions directly through the card brand’s network and are not restricted from performing funds settlement. Otherwise, we process these transactions similarly to how we process transactions in the sponsorship model. We are required to adhere to the standards of the various networks in which we are direct members. We maintain relationships with financial institutions, which may also serve as our member sponsors for other card brands or in other markets, to assist with funds settlement.
59
Timing differences, interchange expense, Merchant Reserves and exception items cause differences between the amount received from the card networks and the amount funded to the merchants. These intermediary balances arising in our settlement process for direct merchants are reflected as settlement processing assets and obligations on our balance sheet. Settlement processing assets and obligations consist of the components outlined below:
• | Interchange reimbursement - our receivable from merchants for the portion of the discount fee related to reimbursement of the interchange expense. |
• | Receivable from Members - our receivable from the Members for transactions in which merchants have been funded in advance of receipt of card association funding. |
• | Receivable from networks - our receivable from the card networks for transactions processed on behalf of merchants where we are a direct member of that particular network. |
• | Exception items - items such as customer chargeback amounts received from merchants. |
• | Merchant Reserves - reserves held to minimize contingent liabilities associated with losses that may occur under the merchant agreement. |
• | Liability to Members - our liability to the Members for transactions for which funding from the network has been received by the Members but merchants have not yet been funded. |
• | Liability to merchants - our liability to merchants for transactions that have been processed but not yet funded where we are a direct member of that particular network. |
• | Reserve for operating losses - see Note 1 - Summary of Significant Accounting Policies. |
• | Reserve for sales allowances. |
In accordance with ASC 210-20, Offsetting, we apply offsetting to our settlement processing assets and obligations where legal right of set-off exists. In the sponsorship model, we apply offsetting by Member because the Member is ultimately responsible for funds settlement. With these Member transactions, we do not have access to the gross proceeds of the receivable from the networks and, thus, do not have a direct obligation or any ability to satisfy the payable that funds the merchant. In these situations, we apply offsetting to determine a net position with each member sponsor. If that net position is an asset, we reflect the net amount in settlement processing assets on our balance sheet and we present the individual components in the settlement processing assets table below. If that net position is a liability, we reflect the net amount in settlement processing obligations on our consolidated balance sheet and we present the individual components in the settlement processing obligations table below. In the direct membership model, offsetting is not applied, and the individual components are presented as an asset or obligation based on the nature of that component.
60
As of May 31, 2014 and 2013, settlement processing assets and obligations consisted of the following:
May 31, 2014 | May 31, 2013 | ||||||
(in thousands) | |||||||
Settlement processing assets: | |||||||
Interchange reimbursement | $ | 217,806 | $ | 70,348 | |||
Receivable from Members | 206,322 | 117,404 | |||||
Receivable from networks | 430,763 | 126,136 | |||||
Exception items | 5,573 | 2,725 | |||||
Merchant Reserves | (79,547 | ) | (57,409 | ) | |||
$ | 780,917 | $ | 259,204 | ||||
Settlement processing obligations: | |||||||
Interchange reimbursement | $ | 54,459 | $ | 200,319 | |||
Liability to Members | (5,490 | ) | (27,717 | ) | |||
Liability to merchants | (407,651 | ) | (120,875 | ) | |||
Exception items | 6,313 | 12,308 | |||||
Merchant Reserves | (96,622 | ) | (223,314 | ) | |||
Reserve for operating losses | (1,725 | ) | (2,318 | ) | |||
Reserves for sales allowances | (601 | ) | (961 | ) | |||
$ | (451,317 | ) | $ | (162,558 | ) | ||
NOTE 4—BUSINESS AND INTANGIBLE ASSET ACQUISITIONS AND JOINT VENTURES
In the years ended May 31, 2014, 2013, and 2012, we acquired the following businesses and intangible assets:
Date Acquired | Percentage Ownership | |||
Fiscal 2014 | ||||
American Express merchant portfolio (Czech Republic) | October 24, 2013 | 100 | % | |
PayPros (United States) | March 4, 2014 | 100 | % | |
Fiscal 2013 | ||||
Accelerated Payment Technologies (United States) | October 1, 2012 | 100 | % | |
Banca Civica (Spain) | December 12, 2012 | 100 | % | |
Fiscal 2012 | ||||
Alfa-Bank (Russian Federation) | December 5, 2011 | 100 | % | |
HSBC Malta (Republic of Malta) | December 30, 2011 | 100 | % | |
CyberSource merchant portfolio (United States) | January 31, 2012 | 100 | % | |
The business acquisitions have been recorded using the purchase method of accounting, and accordingly, the purchase price has been allocated to the assets acquired and liabilities assumed based on their estimated fair value as of the date of acquisition. The operating results of each acquisition are included in our consolidated statements of income from the dates of each acquisition. In addition to these acquisitions, in September 2013, we also restructured our business in Brazil to form a new joint venture, as discussed below.
61
Fiscal 2014
Comercia Global Payments Brazil
Effective September 30, 2013, CaixaBank, S.A. ("CaixaBank"), which owns 49% of Comercia Global Payments ("Comercia"), our subsidiary in Spain, purchased 50% of Global Payments Brazil for $2.1 million in cash and a commitment to fund the capital needs of the business until such time as its cumulative funding is equal to funding that we have provided from inception through the effective date of the transaction. The transaction created a new joint venture which does business as Comercia Global Payments Brazil. As a result of the transaction, we deconsolidated Global Payments Brazil, and we apply the equity method of accounting to our retained interest in Comercia Global Payments Brazil. We recorded a gain on the transaction of $2.1 million which is included in interest and other income in the consolidated statement of income for the fiscal year ended May 31, 2014. The results of the Brazil operation from inception until the restructuring into a joint venture on September 30, 2013 were not material to our consolidated results of operations, and the assets and liabilities that we derecognized were not material to our consolidated balance sheet.
American Express Portfolio
On October 24, 2013, we acquired a merchant portfolio in the Czech Republic from American Express Limited for $1.9 million. The acquired assets have been classified as customer-related intangible assets and contract-based intangible assets with estimated amortization periods of 10 years.
PayPros
On March 4, 2014, we completed the acquisition of 100% of the outstanding stock of Payment Processing, Inc. ("PayPros") for $420.0 million in cash plus $7.7 million in cash for working capital, subject to adjustment based on a final determination of working capital. We funded the acquisition with a combination of cash on hand and proceeds from our new Term Loan. PayPros, based in California, is a provider of fully-integrated payment solutions for small-to-medium sized merchants in the United States. PayPros delivers its products and services through a network of technology-based enterprise software partners to vertical markets that are complementary to the markets served by Accelerated Payment Technologies ("APT"), which we acquired in October 2012. We acquired PayPros to expand our direct distribution capabilities in the United States and to further enhance our existing integrated solutions offerings. This acquisition was recorded as a business combination, and the purchase price was allocated to the assets acquired and liabilities assumed based on their estimated fair values. Due to the timing of this transaction, the allocation of the purchase price is preliminary pending final valuation of intangible assets and deferred income taxes as well as resolution of the working capital settlement discussed above. The purchase price of PayPros was determined by analyzing the historical and prospective financial statements. Acquisition costs associated with this purchase were not material.
The following table summarizes the preliminary purchase price allocation (in thousands):
Goodwill | $ | 271,577 | |
Customer-related intangible assets | 147,500 | ||
Contract-based intangible assets | 31,000 | ||
Acquired technology | 10,700 | ||
Fixed assets | 1,680 | ||
Other assets | 4,230 | ||
Total assets acquired | 466,687 | ||
Deferred income taxes | (38,949 | ) | |
Net assets acquired | $ | 427,738 | |
The preliminary purchase price allocation resulted in goodwill, included in the North America merchant services segment, of $271.6 million. Such goodwill is attributable primarily to synergies with the services offered and markets served by PayPros. The goodwill associated with the acquisition is not deductible for tax purposes. The customer-related intangible assets and the contract-based intangible assets have an estimated amortization period of 13 years. The acquired technology has an estimated amortization period of 7 years.
62
The amount of revenue and earnings of PayPros since the acquisition date included in the consolidated statement of income for fiscal 2014 is not material. The following pro forma information shows the results of our operations for fiscal year ended May 31, 2014 and May 31, 2013 as if the PayPros acquisition had occurred June 1, 2012. The pro forma information is presented for information purposes only and is not necessarily indicative of what would have occurred if the acquisition had been made as of that date. The pro forma information is also not intended to be a projection of future results due to the integration of the acquired business.
Year Ended May 31, | |||||||||||||||
Unaudited | |||||||||||||||
2014 | 2014 | 2013 | 2013 | ||||||||||||
(Actual) | (Pro forma) | (Actual) | (Pro forma) | ||||||||||||
(in thousands, except per share data) | |||||||||||||||
Total revenues | $ | 2,554,236 | $ | 2,628,547 | $ | 2,375,923 | $ | 2,465,319 | |||||||
Net income attributable to Global Payments | $ | 245,286 | $ | 241,272 | $ | 216,125 | $ | 207,032 | |||||||
Net income per share attributable to Global Payments, basic | $ | 3.40 | $ | 3.35 | $ | 2.78 | $ | 2.66 | |||||||
Net income per share attributable to Global Payments, diluted | $ | 3.37 | $ | 3.32 | $ | 2.76 | $ | 2.65 | |||||||
Fiscal 2013
Accelerated Payment Technologies
On October 1, 2012, we completed the acquisition of 100% of the common stock of APT for $413.0 million less working capital. We funded the acquisition using proceeds from a term loan. We acquired APT, a provider of fully-integrated payment technology solutions for small and medium sized merchants, to expand our direct distribution capabilities in the United States. This acquisition was recorded as a business combination, and the purchase price was allocated to the assets acquired and liabilities assumed based on their estimated fair values. The purchase price of APT was determined by analyzing the historical and prospective financial statements. Acquisition costs associated with this purchase were not material.
The following table summarizes the purchase price allocation (in thousands):
Goodwill | $ | 308,518 | |
Customer-related intangible assets | 97,200 | ||
Contract-based intangible assets | 30,600 | ||
Acquired technology | 15,000 | ||
Fixed assets | 1,309 | ||
Other assets | 3,708 | ||
Total assets acquired | 456,335 | ||
Deferred income taxes | (46,167 | ) | |
Net assets acquired | $ | 410,168 | |
The goodwill associated with the acquisition is not deductible for tax purposes. The customer-related intangible assets have estimated amortization periods of 12 years. The contract-based intangible assets have estimated amortization periods of 1.5 to 10 years. The acquired technology has an estimated amortization period of 8 years.
Prior to the acquisition, we processed transactions for the majority of APT's merchants via an ISO relationship. As a result, our revenue did not materially change with this acquisition and the amount of incremental revenue and earnings of APT since the acquisition date included in the consolidated statement of income for fiscal 2013 is not material. With the acquisition, we no longer pay a monthly residual to APT. The following pro forma information shows the results of our operations for fiscal year ended May 31, 2013 and May 31, 2012 as if the APT acquisition had occurred June 1, 2011. The pro forma information is presented for information
63
purposes only and is not necessarily indicative of what would have occurred if the acquisition had been made as of that date. The pro forma information is also not intended to be a projection of future results due to the integration of the acquired business.
Year Ended May 31, | |||||||||||||||
Unaudited | |||||||||||||||
2013 | 2013 | 2012 | 2012 | ||||||||||||
(Actual) | (Pro forma) | (Actual) | (Pro forma) | ||||||||||||
(in thousands, except per share data) | |||||||||||||||
Total revenues | $ | 2,375,923 | $ | 2,380,098 | $ | 2,203,847 | $ | 2,212,066 | |||||||
Net income attributable to Global Payments | $ | 216,125 | $ | 217,122 | $ | 188,161 | $ | 183,387 | |||||||
Net income per share attributable to Global Payments, basic | $ | 2.78 | $ | 2.79 | $ | 2.39 | $ | 2.33 | |||||||
Net income per share attributable to Global Payments, diluted | $ | 2.76 | $ | 2.78 | $ | 2.37 | $ | 2.31 | |||||||
Redeemable Noncontrolling Interest Acquisition
On July 26, 2012, we entered into an agreement to purchase HSBC Asia's 44% interest in Global Payments Asia-Pacific Limited ("GPAP") for fair value of $242.0 million. Effective December 1, 2012, we completed the purchase. We used a combination of excess cash and existing borrowings to complete the transaction.
The purchase was treated as an equity transaction and reflected as a financing cash outflow in our statement of cash flows. Accordingly, no additional value was ascribed to the assets of GPAP. The difference between the maximum redemption amount of the redeemable noncontrolling interest at July 26, 2012 and our purchase price was recorded as a reduction of paid-in capital of $96.0 million. In accordance with ASC 480, Distinguishing Liabilities from Equity ("ASC 480"), from the agreement date through the close of the transaction, we accounted for our commitment to purchase the remaining 44% of GPAP as a freestanding forward contract. Accordingly as of July 26, 2012, we stopped attributing income to redeemable noncontrolling interest and any subsequent distributions to holders of the redeemable noncontrolling interest were characterized as interest expense. HSBC Asia was entitled to dividends through the closing of the transaction pursuant to the GPAP shareholders' agreement and the purchase agreement. During fiscal 2013, we declared a dividend for fiscal year 2012 of which $8.4 million was paid to HSBC Asia. During the third quarter of fiscal 2014, we declared an additional dividend related to GPAP operations for fiscal year 2013 through the closing date of which $3.3 million was paid to HSBC Asia. Such dividends are reflected as interest expense in our consolidated statements of income in the accordance with the provisions of ASC 480.
Banca Civica
On December 12, 2012, Comercia completed the acquisition of the merchant acquiring business of Banca Civica, S.A. ("Civica") from CaixaBank for €17.5 million ($22.9 million equivalent as of the acquisition date). This transaction has been recorded as a business combination, and the purchase price is allocated to the assets acquired and liabilities assumed based on their estimated fair values. The purchase price of Civica was determined by analyzing the historical and prospective financial statements. The results of operations of this business were not significant to our consolidated results of operations and accordingly, we have not provided pro forma information relating to this acquisition. Acquisition costs associated with this purchase were not material.
The following table summarizes the purchase price allocation (in thousands):
Goodwill | $ | 4,445 | |
Customer-related intangible assets | 4,576 | ||
Contract-based intangible assets | 13,858 | ||
Net assets acquired | $ | 22,879 | |
The goodwill associated with the acquisition is not deductible for tax purposes. The customer-related and contract-based intangible assets have estimated amortization periods of 10 and 18 years, respectively.
64
Fiscal 2012
Alfa-Bank
On December 5, 2011, we acquired the merchant acquiring business of Alfa-Bank ("Alfa"), the largest privately owned bank in Russia, for $14.1 million in cash. This acquisition has been recorded as a business combination, and the purchase price is allocated to the assets acquired and liabilities assumed based on their estimated fair values. The purchase price of Alfa was determined by analyzing the historical and prospective financial statements. The results of operations of this business were not significant to our consolidated results of operations and accordingly, we have not provided pro forma information relating to this acquisition.
The following table summarizes the purchase price allocation (in thousands):
Goodwill | $ | 3,021 | |
Customer-related intangible assets | 7,004 | ||
Fixed assets | 1,137 | ||
Other assets | 2,888 | ||
Net assets acquired | $ | 14,050 | |
The customer-related intangible assets have estimated amortization periods of 10 years.
HSBC Malta
On December 30, 2011, we acquired a merchant acquiring business in Malta from HSBC Malta for $14.5 million in cash. This acquisition has been recorded as a business combination, and the purchase price is allocated to the assets acquired and liabilities assumed based on their estimated fair values. In conjunction with the acquisition, HSBC Malta agreed to a 10 year marketing alliance agreement in which HSBC Malta will refer customers to us for payment processing services in Malta and provide sponsorship into the card networks. The purchase price of our merchant acquiring business in Malta was determined by analyzing the historical and prospective financial statements. The results of operations of this business were not significant to our consolidated results of operations and accordingly, we have not provided pro forma information relating to this acquisition.
The following table summarizes the purchase price allocation (in thousands):
Goodwill | $ | 6,341 | |
Customer-related intangible assets | 4,543 | ||
Contract-based intangible assets | 2,796 | ||
Fixed assets | 798 | ||
Net assets acquired | $ | 14,478 | |
The goodwill associated with the acquisition is not deductible for tax purposes. The customer-related intangible assets have estimated amortization periods of 16 years. The contract-based intangible assets have estimated amortization periods of 10 years.
CyberSource Portfolio
On January 31, 2012, we acquired the U.S. merchant portfolio of CyberSource from Visa for $14.9 million. The merchant portfolio has been classified as customer-related intangible assets with estimated amortization periods of 10 years.
65
NOTE 5—PROPERTY AND EQUIPMENT
As of May 31, 2014 and 2013, property and equipment consisted of the following:
Range of Useful Lives in Years | 2014 | 2013 | |||||||
(in thousands) | |||||||||
Land | N/A | $ | 1,942 | $ | 1,983 | ||||
Buildings | 25-30 | 33,996 | 35,216 | ||||||
Equipment | 2-10 | 204,102 | 181,316 | ||||||
Software | 5-10 | 224,766 | 167,084 | ||||||
Leasehold improvements | 5-15 | 19,399 | 12,278 | ||||||
Furniture and fixtures | 5-7 | 3,809 | 5,796 | ||||||
Work in progress | N/A | 53,704 | 101,339 | ||||||
541,718 | 505,012 | ||||||||
Less accumulated depreciation and amortization of property and equipment | 171,965 | 156,948 | |||||||
$ | 369,753 | $ | 348,064 | ||||||
Depreciation and amortization expense of property and equipment was $60.1 million, $55.0 million, and $48.4 million for fiscal 2014, 2013 and 2012, respectively.
NOTE 6—GOODWILL AND INTANGIBLE ASSETS
As of May 31, 2014 and 2013, goodwill and intangible assets consisted of the following:
2014 | 2013 | ||||||
(in thousands) | |||||||
Goodwill | $ | 1,337,285 | $ | 1,044,222 | |||
Other intangible assets: | |||||||
Customer-related intangible assets | $ | 714,704 | $ | 559,884 | |||
Trademarks | 6,140 | 6,390 | |||||
Acquired technology | 25,700 | 15,000 | |||||
Contract-based intangible assets | 145,967 | 110,234 | |||||
892,511 | 691,508 | ||||||
Less accumulated amortization: | |||||||
Customer-related intangible assets | 317,629 | 262,649 | |||||
Trademarks | 4,147 | 3,967 | |||||
Acquired technology | 3,531 | 1,248 | |||||
Contract-based intangible assets | 32,031 | 22,796 | |||||
357,338 | 290,660 | ||||||
$ | 535,173 | $ | 400,848 | ||||
66
The following table sets forth the changes in the carrying amount of goodwill for the years ended May 31, 2014 and 2013:
North America Merchant Services | International Merchant Services | Total | |||||||||
(in thousands) | |||||||||||
Balance at May 31, 2012 | $ | 211,102 | $ | 513,585 | $ | 724,687 | |||||
Accumulated impairment losses | — | — | — | ||||||||
Balance at May 31, 2012 | 211,102 | 513,585 | 724,687 | ||||||||
Goodwill acquired | 308,518 | 4,445 | 312,963 | ||||||||
Effect of foreign currency translation | (445 | ) | 7,017 | 6,572 | |||||||
Balance at May 31, 2013 | 519,175 | 525,047 | 1,044,222 | ||||||||
Accumulated impairment losses | — | — | — | ||||||||
Balance at May 31, 2013 | 519,175 | 525,047 | 1,044,222 | ||||||||
Goodwill acquired | 271,577 | — | 271,577 | ||||||||
Effect of foreign currency translation | (4,097 | ) | 25,583 | 21,486 | |||||||
Balance at May 31, 2014 | 786,655 | 550,630 | 1,337,285 | ||||||||
Accumulated impairment losses | — | — | — | ||||||||
Balance at May 31, 2014 | $ | 786,655 | $ | 550,630 | $ | 1,337,285 | |||||
Customer-related intangible assets, contract-based intangible assets and acquired technology acquired during the year ended May 31, 2014 have weighted average amortization periods of 13.2 years, 13.2 years and 6.5 years, respectively. Customer-related intangible assets, contract-based intangible assets and acquired technology acquired during the year ended May 31, 2013 have weighted average amortization periods of 11.9 years, 12.3 years and 8 years, respectively. Amortization expense of acquired intangibles was $61.9 million, $56.8 million, and $50.7 million for fiscal 2014, 2013 and 2012, respectively.
The estimated amortization expense of acquired intangibles as of May 31, 2014 for the next five fiscal years, calculated using the exchange rate at the date of acquisition, is as follows (in thousands):
2015 | $ | 71,966 | |
2016 | 66,211 | ||
2017 | 59,924 | ||
2018 | 55,173 | ||
2019 | 50,631 | ||
67
NOTE 7—LONG-TERM DEBT AND CREDIT FACILITIES
As of May 31, 2014 and 2013, outstanding debt consisted of the following:
2014 | 2013 | ||||||
Lines of credit: | (in thousands) | ||||||
Corporate Credit Facility - long-term | $ | 140,000 | $ | 309,955 | |||
Short-term lines of credit | 440,128 | 187,461 | |||||
Total lines of credit | 580,128 | 497,416 | |||||
Notes payable | 3,679 | 6,014 | |||||
Term loan | 1,250,000 | 647,500 | |||||
Total debt | $ | 1,833,807 | $ | 1,150,930 | |||
Current portion | $ | 457,805 | $ | 259,796 | |||
Long-term debt | 1,376,002 | 891,134 | |||||
Total debt | $ | 1,833,807 | $ | 1,150,930 | |||
Maturity requirements on outstanding debt by fiscal year are as follows (in thousands):
2015 | $ | 457,805 | |
2016 | 63,150 | ||
2017 | 78,776 | ||
2018 | 125,325 | ||
2019 | 1,108,751 | ||
Total | $ | 1,833,807 | |
On February 28, 2014, we entered into an amended and restated term loan agreement ("Term Loan") and an amended and restated credit agreement ("Corporate Credit Facility") with a syndicate of financial institutions. The Term Loan and the Corporate Credit Facility amended and restated the term loan agreement dated September 28, 2012 and the credit agreement dated December 7, 2010, respectively.
The Term Loan is a five-year senior unsecured $1,250.0 million term loan. We used proceeds from the Term Loan to partially fund our acquisition of PayPros on March 4, 2014 and to repay the outstanding balances on our previously existing revolving credit facility and our previously existing term loan.
The Term Loan expires February 28, 2019 and bears interest, at our election, at either LIBOR or a base rate, in each case plus a leverage-based margin. As of May 31, 2014, the interest rate on the Term Loan was 1.62%. Commencing in May 2015 and ending in November 2018, the Term Loan has scheduled quarterly principal payments of 1.25%, increasing up to 2.50%. At maturity, 27.50% of the Term Loan will have been repaid through scheduled amortization and the remaining principal balance will be due. With notice, the Term Loan may be voluntarily prepaid at any time, in whole or in part, without penalty. As of May 31, 2014, the outstanding balance of the Term Loan was $1,250.0 million.
The Corporate Credit Facility is a five-year senior unsecured revolving $1,000.0 million revolving credit facility. The Corporate Credit Facility expires February 28, 2019 and bears interest, at our election, at either LIBOR or a base rate, in each case plus a leverage-based margin. Borrowing under the Corporate Credit Facility is available in various currencies. As of May 31, 2014, the outstanding balance of the Corporate Credit Facility was $140.0 million, and the interest rate was 1.6%. The Corporate Credit Facility is available for general corporate purposes.
The Corporate Credit Facility allows us to issue standby letters of credit of up to $100.0 million in the aggregate. Outstanding letters of credit under the Corporate Credit Facility reduce the amount of borrowings available to us. At May 31, 2014, we had standby letters of credit of $8.1 million. The total available incremental borrowings under our Corporate Credit Facility at May 31, 2014 was
68
$851.9 million. The Corporate Credit Facility is included in long-term debt in the accompanying consolidated balance sheets because we are not contractually obligated to make repayments in the next twelve months.
Upon closing of the Term Loan and the Corporate Credit Facility, which occurred on February 28, 2014, we repaid the outstanding balance of $612.5 million on our previously existing term loan and the outstanding balance of $290.0 million on our previously existing revolving credit facility together with accrued interest and fees on each. In connection with the debt refinancing, we recorded a loss of $2.1 million, representing the write off of debt issuance costs associated with the previously existing term loan. We reported this loss in Interest and other expense in our consolidated statements of income for the fiscal year ended May 31, 2014. We incurred fees and expenses associated with these new arrangements of approximately $6.0 million, which was capitalized as debt issuance costs. Debt issuance costs are included in Other assets in our consolidated balance sheet at May 31, 2014 and are being amortized over the term of these new arrangements.
The agreements contain customary affirmative and restrictive covenants, including, among others, financial covenants based on our leverage and fixed charge coverage ratios. Please see "Compliance with Covenants" below. Each of the agreements includes customary events of default, the occurrence of which, following any applicable cure period, would permit lenders to, among other things, declare the principal, accrued interest and other obligations to be immediately due and payable.
Short-term Lines of Credit
We have short-term lines of credit with banks in the United States and Canada as well as several countries in Europe and Asia in which we do business. The short-term lines of credit, which are primarily used to fund settlement, generally have variable short-term interest rates and are subject to annual review. The credit facilities are generally denominated in local currency but may, in some cases, facilitate borrowings in multiple currencies. For certain of our lines of credit, the line of credit balance is reduced by the amount of cash we have on deposit in specific accounts with the lender when determining compliance with the credit limit. Accordingly, the line of credit balance may exceed the stated credit limit at any given point in time, when in fact the combined position is less than the credit limit.
As of May 31, 2014 and May 31, 2013, respectively, we had $440.1 million and $187.5 million outstanding under these short-term lines of credit, with additional borrowing capacity as of May 31, 2014, of $818.5 million to fund settlement. During the year ended May 31, 2014, the maximum and average borrowings under our lines of credit were $1,000.5 million and $551.6 million, respectively. The weighted-average interest rate on these borrowings was 1.7% and 2.1%, at May 31, 2014 and May 31, 2013, respectively. Our maximum borrowed amount was greater than our average and period end borrowings due to the timing of settlement funding.
Notes Payable
United Card Services, our subsidiary in the Russian Federation, had notes payable with a total outstanding balance of approximately $3.7 million at May 31, 2014. These notes had fixed annual interest rates of 8.5% with maturity dates ranging from June 2014 through November 2018.
Compliance with Covenants
There are certain financial and non-financial covenants contained in our various credit facilities and Term Loan. Our Term Loan and Corporate Credit Facility agreements include financial covenants requiring (i) a leverage ratio no greater than 3.50 to 1.00 and (ii) a fixed charge coverage ratio no less than 2.50 to 1.00. We complied with all applicable covenants as of and for the year ended May 31, 2014.
69
NOTE 8—ACCOUNTS PAYABLE AND ACCRUED LIABILITIES
As of May 31, 2014 and 2013, accounts payable and accrued liabilities consisted of the following:
2014 | 2013 | ||||||
(in thousands) | |||||||
Trade accounts payable | $ | 13,076 | $ | 18,497 | |||
Compensation and benefits | 61,193 | 39,623 | |||||
Third-party processing expenses | 11,062 | 10,340 | |||||
Commissions to third parties | 66,551 | 61,279 | |||||
Accrued fees and assessment expenses | 51,649 | 30,490 | |||||
Transition service fees payable | 1,156 | 16,528 | |||||
Accrued processing system intrusion costs | — | 9,021 | |||||
Other | 85,419 | 77,112 | |||||
$ | 290,106 | $ | 262,890 | ||||
NOTE 9—INCOME TAX
The provision for income taxes for the fiscal years ended May 31, 2014, 2013 and 2012 consisted of the following:
2014 | 2013 | 2012 | |||||||||
(in thousands) | |||||||||||
Current tax expense: | |||||||||||
Federal | $ | 49,178 | $ | 16,326 | $ | 52,875 | |||||
State | 3,856 | 987 | 2,989 | ||||||||
Foreign | 48,074 | 36,020 | 35,029 | ||||||||
101,108 | 53,333 | 90,893 | |||||||||
Deferred tax expense (benefit): | |||||||||||
Federal | 1,568 | 26,302 | (21,088 | ) | |||||||
State | 1,206 | 3,568 | (813 | ) | |||||||
Foreign | 3,515 | 12,368 | 13,889 | ||||||||
6,289 | 42,238 | (8,012 | ) | ||||||||
Provision for income taxes | 107,398 | 95,571 | 82,881 | ||||||||
Tax allocated to noncontrolling interests in a taxable entity | (5,230 | ) | (4,178 | ) | (6,604 | ) | |||||
Net income tax expense attributable to Global Payments | $ | 102,168 | $ | 91,393 | $ | 76,277 | |||||
The following presents our income before income taxes for the fiscal years ended May 31, 2014, 2013 and 2012:
2014 | 2013 | 2012 | |||||||||
(in thousands) | |||||||||||
Income before income taxes - U.S. | $ | 153,453 | $ | 137,501 | $ | 103,163 | |||||
Income before income taxes - foreign | 223,897 | 196,783 | 197,284 | ||||||||
Income before income taxes | $ | 377,350 | $ | 334,284 | $ | 300,447 | |||||
70
Our effective tax rates, as applied to income before income taxes for the years ended May 31, 2014, 2013 and 2012, respectively, differ from federal statutory rates as follows:
2014 | 2013 | 2012 | ||||||
Federal statutory rate | 35.0 | % | 35.0 | % | 35.0 | % | ||
State income taxes, net of federal income tax benefit | 0.9 | 0.9 | 0.5 | |||||
Foreign income taxes | (7.2 | ) | (7.0 | ) | (6.3 | ) | ||
Foreign interest income not subject to tax | (2.1 | ) | (2.8 | ) | (2.2 | ) | ||
Tax credits and other | 3.1 | 3.7 | 1.8 | |||||
Effective tax rate attributable to Global Payments | 29.7 | % | 29.8 | % | 28.8 | % | ||
Noncontrolling interests | (1.2 | ) | (1.2 | ) | (1.2 | ) | ||
Effective tax rate | 28.5 | % | 28.6 | % | 27.6 | % | ||
Deferred income taxes are determined based on the difference between the financial statement and tax bases of assets and liabilities using enacted tax laws and rates. Deferred income taxes as of May 31, 2014 and 2013 reflect the impact of temporary differences between the amounts of assets and liabilities for financial accounting and income tax purposes. As of May 31, 2014 and 2013, principal components of deferred tax items were as follows:
2014 | 2013 | ||||||
(in thousands) | |||||||
Deferred tax assets: | |||||||
Share-based compensation | $ | 5,916 | $ | 12,266 | |||
Bad debt expense | 2,802 | 2,292 | |||||
Foreign NOL carryforward | 6,881 | 8,221 | |||||
U.S. NOL carryforward | 22,074 | 243 | |||||
U.S. capital loss carryforward | 1,734 | 20,176 | |||||
Basis difference - U.K. business | 96,720 | 90,678 | |||||
Foreign tax credit | 11,819 | 14,413 | |||||
Other tax credits | 1,730 | 1,733 | |||||
149,676 | 150,022 | ||||||
Less: valuation allowance | (7,199 | ) | (28,464 | ) | |||
Net deferred tax asset | 142,477 | 121,558 | |||||
Deferred tax liabilities: | |||||||
Taxes on unremitted earnings and other | 5,470 | 13,729 | |||||
Foreign currency translation | 26,813 | 30,163 | |||||
Acquired intangibles | 149,440 | 90,205 | |||||
Prepaid expenses | 1,800 | 2,523 | |||||
Property and equipment | 53,238 | 53,998 | |||||
236,761 | 190,618 | ||||||
Net deferred tax liability | (94,284 | ) | (69,060 | ) | |||
Less: current net deferred tax asset | 12,887 | 6,485 | |||||
Net noncurrent deferred tax liability | $ | (107,171 | ) | $ | (75,545 | ) | |
71
The net non-current deferred tax asset and liability is reflected on our consolidated balance sheets as of May 31, 2014 and 2013 as follows:
2014 | 2013 | ||||||
(in thousands) | |||||||
Non-current deferred income tax asset per balance sheet | $ | 101,928 | $ | 95,178 | |||
Non-current deferred income tax liability per balance sheet | (209,099 | ) | (170,723 | ) | |||
Net non-current deferred tax liability | $ | (107,171 | ) | $ | (75,545 | ) | |
Undistributed earnings of $577.0 million from certain foreign subsidiaries are permanently invested abroad and will not be repatriated to the United States in the foreseeable future. In accordance with FASB guidance, because those earnings are considered to be indefinitely reinvested, no domestic federal or state deferred income taxes have been provided thereon. Upon distribution of those earnings, in the form of dividends or otherwise, we would be subject to both U.S. income taxes (subject to an adjustment for foreign tax credits) and withholding taxes payable to the various foreign countries. Because of the availability of U.S. foreign tax credits, it is not practicable to determine the domestic federal income tax liability that would be payable if such earnings were not reinvested indefinitely.
A valuation allowance is provided when it is more likely than not that some portion or all of the deferred tax assets will not be realized. Changes to our valuation allowance during the fiscal year ended May 31, 2014 and 2013 are summarized below (in thousands):
Valuation allowance at May 31, 2012 | $ | (26,090 | ) |
Allowance for NOLs of foreign subsidiaries | (3,415 | ) | |
Allowance for foreign tax credit carryforward | 15 | ||
Other | 1,026 | ||
Valuation allowance at May 31, 2013 | $ | (28,464 | ) |
Allowance for NOLs of foreign subsidiaries | 2,822 | ||
Release of allowance for capital loss carryforward | 18,061 | ||
Other | 382 | ||
Valuation allowance at May 31, 2014 | $ | (7,199 | ) |
NOL carryforwards of foreign subsidiaries totaling $29.8 million and U.S. NOL carryforwards previously acquired totaling $63.1 million at May 31, 2014 will expire if not utilized between May 31, 2017 and May 31, 2033. Capital loss carryforwards of U.S. subsidiaries totaling $4.8 million will expire if not utilized by May 31, 2017. Tax credit carryforwards totaling $8.9 million at May 31, 2014 will expire if not utilized between May 31, 2017 and May 31, 2023.
72
A reconciliation of the beginning and ending amounts of unrecognized tax benefits for the years ended May 31, 2014, 2013, and 2012 is as follows:
2014 | 2013 | 2012 | |||||||||
(in thousands) | |||||||||||
Balance at the beginning of the year | $ | 53,763 | $ | 45,595 | $ | 37,197 | |||||
Additions based on tax positions related to the current year | 8,551 | 8,778 | 10,684 | ||||||||
Additions for tax positions of prior years | 296 | 142 | 118 | ||||||||
Foreign currency impact for tax positions | 5,303 | (601 | ) | (2,340 | ) | ||||||
Reductions for tax positions of prior years | (60 | ) | (151 | ) | (64 | ) | |||||
Settlements with taxing authorities | (277 | ) | — | — | |||||||
Balance at the end of the year | $ | 67,576 | $ | 53,763 | $ | 45,595 | |||||
As of May 31, 2014, the total amount of gross unrecognized tax benefits that, if recognized, would affect the effective tax rate is $2.5 million. The amount of unrecognized tax benefits that will impact income tax during the upcoming fiscal year is insignificant.
We recognize accrued interest related to unrecognized income tax benefits in interest expense and accrued penalty expense related to unrecognized tax benefits in sales, general and administrative expenses. Interest and penalties recognized in the income statement were insignificant in fiscal years 2014, 2013 and 2012.
We conduct business globally and file income tax returns in the U.S. federal jurisdiction and various state and foreign jurisdictions. In the normal course of business, we are subject to examination by taxing authorities throughout the world, including such major jurisdictions as the United States, the United Kingdom and Canada. We are no longer subject to income tax examinations for years ended on or before May 31, 2006. We completed an audit with the U.S. Internal Revenue Service ("IRS") for fiscal years 2011 and 2010 with no significant adjustments, after which we are no longer subject to U.S. federal income tax examinations by the IRS for fiscal years prior to 2012.
NOTE 10—SHAREHOLDERS’ EQUITY
During fiscal 2013, pursuant to the authorization described above, we entered into an Accelerated Share Repurchase program (''ASR'') with a financial institution to repurchase an aggregate of $125.0 million of the Company's common stock. In exchange for an up-front payment of $125.0 million, the financial institution committed to deliver a number of shares during the ASR's purchase period, which ended on March 30, 2013. The total number of shares delivered under this ASR was 2.5 million at an average price of $49.13 per share.
During fiscal 2014, our Board of Directors authorized the repurchase of up to an additional $500.0 million of our common stock. On October 7, 2013, pursuant to this authorization, we entered into an ASR with a financial institution to repurchase an aggregate of $100.0 million of our common stock. In exchange for an upfront payment of $100.0 million, the financial institution committed to deliver a number of shares during the ASR's purchase period, which ended on January 9, 2014. The total number of shares delivered under this ASR was 1.6 million shares at an average price of $60.96 per share. These shares were retired and accounted for as a reduction of shareholders' equity in the consolidated balance sheet.
Shares repurchased under ASRs were retired and accounted for as a reduction of shareholders' equity in the consolidated balance sheet. We accounted for the initial delivery of shares component of the ASR as a repurchase of common stock for purposes of calculating earnings per share. We accounted for the variable component of shares to be delivered under the ASR as a forward contract indexed to our stock which met all of the applicable criteria for equity classification, and, therefore, was not accounted for as a derivative instrument, but instead was also accounted for as a component of equity.
In addition to shares repurchased under the ASR, we repurchased and retired 6.2 million shares of our common stock at a cost of $355.0 million, or an average of $57.29 per share, including commissions, during fiscal 2014. As of May 31, 2014, we had $169.6 million of remaining authorized share repurchases, including available authorization from existing resolutions.
73
NOTE 11—SHARE-BASED AWARDS AND OPTIONS
As of May 31, 2014, we had awards outstanding under four share-based employee compensation plans. The fair value of share-based awards is amortized as compensation expense on a straight-line basis over the vesting period.
Non-qualified stock options and restricted stock have been granted to officers, key employees and directors under the Global Payments Inc. 2000 Long-Term Incentive Plan, as amended and restated (the “2000 Plan”), the Global Payments Inc. Amended and Restated 2005 Incentive Plan (the “2005 Plan”), the Amended and Restated 2000 Non-Employee Director Stock Option Plan (the “Director Stock Option Plan”), and the Global Payments Inc. 2011 Incentive Plan (the “2011 Plan”) (collectively, the “Plans”). There were no further grants made under the 2000 Plan after the 2005 Plan was effective, and the Director Stock Option Plan expired by its terms on February 1, 2011. There will be no future grants under the 2000 Plan, the 2005 Plan or the Director Stock Option Plan.
The 2011 Plan permits grants of equity to employees, officers, directors and consultants. A total of 7.0 million shares of our common stock was reserved and made available for issuance pursuant to awards granted under the 2011 Plan.
The following table summarizes the share-based compensation cost charged to income and the related total income tax benefit recognized for (i) stock options, (ii) restricted stock (including PRSUs and TSRs, each as defined below), and (iii) shares issued under our employee stock purchase plan.
2014 | 2013 | 2012 | |||||||||
(in millions) | |||||||||||
Share-based compensation expense | $ | 29.8 | $ | 18.4 | $ | 16.4 | |||||
Income tax benefit | $ | (7.1 | ) | $ | (5.6 | ) | $ | (6.0 | ) | ||
Restricted Stock
Shares and performance units awarded under the restricted stock program of the Plans are held in escrow and released to the grantee upon the grantee’s satisfaction of conditions of the grantee’s restricted stock agreement. The grant date fair value of restricted stock awards is based on the quoted market value of our common stock at the award date.
Certain executives are granted two different types of performance units under our restricted stock program. A portion of those performance units represent the right to earn 0% to 200% of a target number of shares of our common stock depending upon the achievement level of certain performance measures during the grant year (“PRSUs”). The target number of PRSUs and the performance measures (at threshold, target, and maximum) are set by the Compensation Committee of our Board of Directors. PRSUs are converted to a time-based restricted stock grant only if our performance during the fiscal year exceeds pre-established goals. The other portion of these performance units represents the right to earn 0% to 200% of target shares of our common stock based on our relative total shareholder return compared to peer companies over a three-year performance period ("TSRs"). The target number of TSRs for each executive is set by the Compensation Committee of our Board of Directors and a monte carlo simulation is used to calculate the estimated share payout.
Grants of restricted stock awards are subject to forfeiture if a grantee, among other conditions, leaves our employment prior to expiration of the restricted period. New grants of restricted stock awards generally vest in 25% increments over each of the first four anniversaries of the grant date. TSRs vest after a three year period.
74
The following table summarizes the changes in non-vested restricted stock awards for the years ended May 31, 2014 and 2013 (shares in thousands):
Shares | Weighted Average Grant-Date Fair Value | ||||||
Non-vested at May 31, 2012 | 941 | $ | 44 | ||||
Granted | 561 | 44 | |||||
Vested | (315 | ) | 43 | ||||
Forfeited | (91 | ) | 44 | ||||
Non-vested at May 31, 2013 | 1,096 | 44 | |||||
Granted | 544 | 47 | |||||
Vested | (643 | ) | 45 | ||||
Forfeited | (120 | ) | 45 | ||||
Non-vested at May 31, 2014 | 877 | $ | 45 | ||||
The total fair value of share awards vested during the years ended May 31, 2014, 2013 and 2012 was $28.7 million, $13.6 million and $12.9 million, respectively.
We recognized compensation expense for restricted stock of $28.2 million, $16.2 million and $13.6 million in the years ended May 31, 2014, 2013 and 2012, respectively. As of May 31, 2014, there was $29.8 million of total unrecognized compensation cost related to non-vested restricted stock awards that is expected to be recognized over a weighted average period of 2.5 years.
Employee Stock Purchase Plan
We have an Employee Stock Purchase Plan under which the sale of 2.4 million shares of our common stock has been authorized. Employees may designate up to the lesser of $25,000 or 20% of their annual compensation for the purchase of our common stock. The price for shares purchased under the plan is 85% of the market value on the last day of the quarterly purchase period. As of May 31, 2014, 1.1 million shares had been issued under this plan, with 1.3 million shares reserved for future issuance. We recognized compensation expense for the plan of $0.6 million, $0.6 million and $0.5 million in the years ended May 31, 2014, 2013 and 2012, respectively.
The weighted average grant-date fair value of each designated share purchased under this plan during the years ended May 31, 2014, 2013 and 2012 was approximately $7, $6 and $7, respectively, which represents the fair value of the 15% discount.
Stock Options
Stock options are granted at 100% of fair market value on the date of grant and have 10-year terms. Stock options vest in 25% increments over each of the first four anniversaries of the grant date. The Plans provide for accelerated vesting under certain conditions. There were no options granted under the Plans during the years ended May 31, 2014 and May 31, 2013.
75
The following is a summary of our stock option activity as of and for the years ended May 31, 2014 and 2013:
Options | Weighted Average Exercise Price | Weighted Average Remaining Contractual Term | Aggregate Intrinsic Value | |||||||||
(in thousands) | (years) | (in millions) | ||||||||||
Outstanding at May 31, 2012 | 2,145 | $ | 34 | 4.1 | $ | 20.7 | ||||||
Granted | — | — | ||||||||||
Forfeited | (72 | ) | 39 | |||||||||
Exercised | (308 | ) | 23 | |||||||||
Outstanding at May 31, 2013 | 1,765 | 35 | 3.5 | 23.9 | ||||||||
Granted | — | — | ||||||||||
Forfeited | (65 | ) | 39 | |||||||||
Exercised | (934 | ) | 30 | |||||||||
Outstanding at May 31, 2014 | 766 | $ | 41 | 3.8 | $ | 21.3 | ||||||
Options vested and exercisable at May 31, 2014 | 725 | $ | 41 | 3.6 | $ | 20.1 | ||||||
Options vested and exercisable at May 31, 2013 | 1,586 | $ | 34 | 3.1 | $ | 22.3 | ||||||
The aggregate intrinsic value of stock options exercised during the fiscal years ended 2014, 2013 and 2012 was $24.9 million, $6.3 million and $4.4 million, respectively. We recognized compensation expense for stock options of $1.0 million, $1.7 million and $2.4 million in the years ended May 31, 2014, 2013 and 2012, respectively. As of May 31, 2014, we had $0.1 million of total unrecognized compensation cost related to unvested options which we expect to recognize in fiscal 2015.
NOTE 12—SUPPLEMENTAL CASH FLOW INFORMATION
Supplemental cash flow disclosures and non-cash investing and financing activities for the years ended May 31, 2014, 2013, and 2012 are as follows:
2014 | 2013 | 2012 | |||||||||
(in thousands) | |||||||||||
Supplemental cash flow information: | |||||||||||
Income taxes paid, net of refunds | $ | 94,938 | $ | 55,218 | $ | 74,199 | |||||
Interest paid (1) | $ | 33,214 | $ | 29,677 | $ | 13,631 | |||||
(1) Includes distributions to HSBC Asia of $3.3 million and $8.4 million in fiscal 2014 and fiscal 2013, respectively, which were characterized as interest expense pursuant to ASC 480. See Note 4 - Business and Intangible Asset Acquisitions and Joint Ventures. | |||||||||||
76
NOTE 13—NONCONTROLLING INTERESTS
The following table details the components of redeemable noncontrolling interest for the fiscal year ended May 31, 2013:
2013 | |||
(in thousands) | |||
Beginning balance | $ | 144,422 | |
Net income attributable to redeemable noncontrolling interest | 1,814 | ||
Foreign currency translation adjustment | 573 | ||
Decrease in the maximum redemption amount of redeemable noncontrolling interest | (817 | ) | |
Derecognition of redeemable noncontrolling interest | (145,992 | ) | |
Ending balance | $ | — | |
For the fiscal years ended May 31, 2014, 2013 and 2012, net income included in the consolidated statements of changes in equity is reconciled to net income presented in the consolidated statements of income as follows:
2014 | 2013 | 2012 | |||||||||
(in thousands) | |||||||||||
Net income attributable to Global Payments | $ | 245,286 | $ | 216,125 | $ | 188,161 | |||||
Net income attributable to nonredeemable noncontrolling interests | 24,666 | 20,774 | 17,804 | ||||||||
Subtotal per statement of changes in equity | 269,952 | 236,899 | 205,965 | ||||||||
Net income attributable to redeemable noncontrolling interest | — | 1,814 | 11,601 | ||||||||
Net income | $ | 269,952 | $ | 238,713 | $ | 217,566 | |||||
The following table is the reconciliation of net income attributable to noncontrolling interests to comprehensive income attributable to noncontrolling interests for the fiscal years ended May 31, 2014 and May 31, 2013:
2014 | 2013 | 2012 | |||||||||
(in thousands) | |||||||||||
Net income attributable to noncontrolling interests, net of tax | $ | 24,666 | $ | 22,588 | $ | 29,405 | |||||
Foreign currency translation attributable to nonredeemable noncontrolling interests | 7,054 | 7,217 | (22,991 | ) | |||||||
Foreign currency translation attributable to redeemable noncontrolling interest | — | 573 | (2,741 | ) | |||||||
Comprehensive income attributable to noncontrolling interests, net of tax | $ | 31,720 | $ | 30,378 | $ | 3,673 | |||||
NOTE 14—SEGMENT INFORMATION
General Information
We operate in two reportable segments: North America merchant services and International merchant services. The merchant services segments primarily offer processing solutions for credit cards, debit cards and check-related services.
Information About Profit and Assets
We evaluate performance and allocate resources based on the operating income of each segment. The operating income of each segment includes the revenues of the segment less those expenses that are directly related to those revenues. Operating overhead, shared costs and certain compensation costs are included in Corporate in the following table. Interest expense and income and income tax expense are not allocated to the individual segments. We do not evaluate performance or allocate resources using segment asset data. The accounting policies of the reportable segments are the same as those described in the Summary of Significant Accounting Policies in Note 1.
77
Information on segments, including revenue by geographic distribution within segments, and reconciliations to consolidated revenues and consolidated operating income are as follows for the years ended May 31, 2014, 2013, and 2012:
2014 | 2013 | 2012 | |||||||||
(in thousands) | |||||||||||
Revenues: | |||||||||||
United States | $ | 1,488,659 | $ | 1,394,675 | $ | 1,234,818 | |||||
Canada | 320,333 | 311,000 | 332,434 | ||||||||
North America merchant services | 1,808,992 | 1,705,675 | 1,567,252 | ||||||||
Europe | 587,463 | 522,593 | 489,300 | ||||||||
Asia-Pacific | 157,781 | 147,655 | 147,295 | ||||||||
International merchant services | 745,244 | 670,248 | 636,595 | ||||||||
Consolidated revenues | $ | 2,554,236 | $ | 2,375,923 | $ | 2,203,847 | |||||
Operating income (loss) for segments: | |||||||||||
North America merchant services | $ | 272,251 | $ | 258,910 | $ | 281,305 | |||||
International merchant services | 240,179 | 211,242 | 196,137 | ||||||||
Corporate (1) | (106,931 | ) | (112,939 | ) | (170,093 | ) | |||||
Consolidated operating income | $ | 405,499 | $ | 357,213 | $ | 307,349 | |||||
Depreciation and amortization: | |||||||||||
North America merchant services | $ | 60,970 | $ | 48,882 | $ | 35,479 | |||||
International merchant services | 54,728 | 57,520 | 60,462 | ||||||||
Corporate | 6,371 | 5,386 | 3,158 | ||||||||
Consolidated depreciation and amortization | $ | 122,069 | $ | 111,788 | $ | 99,099 | |||||
(1) Includes a processing system intrusion credit of $7.0 million in fiscal 2014 and charges of $36.8 million and $84.4 million in fiscal 2013 and 2012, respectively.
Our results of operations and our financial condition are not significantly reliant upon any single customer.
The following is a breakdown of long-lived assets by geographic regions as of May 31, 2014 and 2013:
2014 | 2013 | ||||||
(in thousands) | |||||||
United States | $ | 1,291,909 | $ | 826,972 | |||
Canada | 150,635 | 162,374 | |||||
Europe | 722,140 | 719,991 | |||||
Asia-Pacific region | 77,527 | 82,538 | |||||
South America | — | 1,259 | |||||
$ | 2,242,211 | $ | 1,793,134 | ||||
78
NOTE 15—COMMITMENTS AND CONTINGENCIES
Leases
We conduct a major part of our operations using leased facilities and equipment. Many of these leases have renewal and purchase options and provide that we pay the cost of property taxes, insurance and maintenance. Rent expense on all operating leases for fiscal 2014, 2013 and 2012 was $16.0 million, $16.5 million, and $16.0 million, respectively.
Future minimum lease payments for all non-cancelable operating leases at May 31, 2014 were as follows:
Fiscal years ending May 31: | ||||
2015 | $ | 12,549 | ||
2016 | 10,120 | |||
2017 | 8,515 | |||
2018 | 7,056 | |||
2019 | 6,383 | |||
Thereafter | 15,046 | |||
Total future minimum lease payments | $ | 59,669 | ||
Legal
We are party to a number of claims and lawsuits incidental to our business. In our opinion, the liabilities, if any, which may ultimately result from the outcome of such matters, individually or in the aggregate, are not expected to have a material adverse impact on our financial position, liquidity or results of operations.
Operating Taxes
We define operating taxes as taxes that are unrelated to income taxes, such as sales, property, value-add and other business taxes. During the course of operations, we must interpret the meaning of various operating tax matters in the United States and in the foreign jurisdictions in which we do business. Taxing authorities in those various jurisdictions may arrive at different interpretations of applicable tax laws and regulations as they relate to such operating tax matters, which could result in the payment of additional taxes in those jurisdictions. As of May 31, 2014 and 2013, we did not have liabilities for contingencies related to operating tax items based on management's best estimate given our history with similar matters and interpretations of current laws and regulations.
BIN/ICA Agreements
We have entered into sponsorship or depository and processing agreements with certain banks. These agreements allow us to use the banks' identification numbers, referred to as a Bank Identification Number ("BIN") for Visa transactions and an Interbank Card Association ("ICA") number for MasterCard transactions, to clear credit card transactions through Visa and MasterCard. Certain of these agreements contain financial covenants, and we were in compliance with all such covenants as of May 31, 2014.
79
NOTE 16—QUARTERLY CONSOLIDATED FINANCIAL INFORMATION (UNAUDITED)
Summarized quarterly results for the years ended May 31, 2014 and 2013 are as follows (in thousands, except per share data):
Quarter Ended | |||||||||||||||
August 31 | November 30 | February 28 | May 31 | ||||||||||||
2014: | |||||||||||||||
Revenues | $ | 629,685 | $ | 634,122 | $ | 616,452 | $ | 673,977 | |||||||
Operating income(1) | 107,384 | 111,907 | 97,291 | 88,917 | |||||||||||
Net income | 71,708 | 79,857 | 60,121 | 58,266 | |||||||||||
Net income attributable to Global Payments | 64,643 | 73,897 | 55,121 | 51,625 | |||||||||||
Basic earnings per share attributable to Global Payments | 0.88 | 1.02 | 0.77 | 0.73 | |||||||||||
Diluted earnings per share attributable to Global Payments | 0.87 | 1.02 | 0.76 | 0.72 | |||||||||||
Quarter Ended | |||||||||||||||
August 31 | November 30 | February 28 | May 31 | ||||||||||||
2013: | |||||||||||||||
Revenues | $ | 590,287 | $ | 588,538 | $ | 578,746 | $ | 618,352 | |||||||
Operating income(1) | 80,488 | 116,582 | 90,774 | 69,369 | |||||||||||
Net income | 54,162 | 75,371 | 62,814 | 46,366 | |||||||||||
Net income attributable to Global Payments | 46,675 | 70,183 | 58,462 | 40,805 | |||||||||||
Basic earnings per share attributable to Global Payments | 0.59 | 0.89 | 0.75 | 0.54 | |||||||||||
Diluted earnings per share attributable to Global Payments | 0.59 | 0.89 | 0.75 | 0.53 | |||||||||||
(1) Includes a processing system intrusion credit of $7.0 million and a charge of $36.8 million for the years ended May 31, 2014 and May 31, 2013, respectively.
80
GLOBAL PAYMENTS INC.
SCHEDULE II
Valuation & Qualifying Accounts
Description | Balance at Beginning of Year | Charged to Costs and Expenses | Acquired Balances | Uncollectible Accounts Write-Off | Balance at End of Year | |||||||||||||||
(in thousands) | ||||||||||||||||||||
Allowance for doubtful accounts | ||||||||||||||||||||
May 31, 2012 | $ | 472 | $ | 165 | $ | — | $ | 105 | $ | 532 | ||||||||||
May 31, 2013 | 532 | 444 | — | 467 | 509 | |||||||||||||||
May 31, 2014 | 509 | 174 | — | 282 | 401 | |||||||||||||||
Reserve for operating losses-Merchant card processing (1) | ||||||||||||||||||||
May 31, 2012 | 3,102 | 8,848 | — | 9,625 | 2,325 | |||||||||||||||
May 31, 2013 | 2,325 | 9,484 | — | 9,491 | 2,318 | |||||||||||||||
May 31, 2014 | 2,318 | 8,658 | — | 9,252 | 1,724 | |||||||||||||||
Reserve for sales allowances-Merchant card processing (1) | ||||||||||||||||||||
May 31, 2012 | 3,275 | 3,913 | — | 6,315 | 873 | |||||||||||||||
May 31, 2013 | 873 | 2,074 | — | 1,986 | 961 | |||||||||||||||
May 31, 2014 | 961 | 1,330 | — | 1,690 | 601 | |||||||||||||||
Reserve for operating losses-Check guarantee processing | ||||||||||||||||||||
May 31, 2012 | 3,870 | 13,404 | — | 13,839 | 3,435 | |||||||||||||||
May 31, 2013 | 3,435 | 11,731 | — | 12,022 | 3,144 | |||||||||||||||
May 31, 2014 | 3,144 | 11,916 | — | 12,062 | 2,998 | |||||||||||||||
Deferred tax asset valuation allowance | ||||||||||||||||||||
May 31, 2012 | 28,629 | (2,539 | ) | — | — | 26,090 | ||||||||||||||
May 31, 2013 | 26,090 | 2,374 | — | — | 28,464 | |||||||||||||||
May 31, 2014 | 28,464 | (21,265 | ) | — | — | 7,199 | ||||||||||||||
(1)Included in settlement processing obligations. | ||||||||||||||||||||
81
ITEM 9- CHANGES IN AND DISAGREEMENTS WITH ACCOUNTANTS ON ACCOUNTING AND FINANCIAL DISCLOSURE
None.
ITEM 9A- CONTROLS AND PROCEDURES
Evaluation of Disclosure Controls and Procedures
As of May 31, 2014, management carried out, under the supervision and with the participation of our principal executive officer and principal financial officer, an evaluation of the effectiveness of the design and operation of our disclosure controls and procedures (as defined in Rules 13a-15(e) and 15d-15(e) under the Securities Exchange Act of 1934). Based on this evaluation, our principal executive officer and principal financial officer concluded that, as of May 31, 2014, our disclosure controls and procedures were effective in ensuring that information required to be disclosed by us in the reports that we file or submit under the Securities Exchange Act of 1934, as amended, is recorded, processed, summarized and reported within the time periods specified in applicable rules and forms and are designed to ensure that information required to be disclosed in those reports is accumulated and communicated to management, including our principal executive and principal financial officers, as appropriate to allow timely decisions regarding required disclosure.
Management Report on Internal Control over Financial Reporting
Our management team is responsible for establishing and maintaining adequate internal control over financial reporting as defined in Rules 13a-15(f) and 15d-15(f) under the Securities Exchange Act of 1934. Our management assessed the effectiveness of our internal control over financial reporting as of May 31, 2014. In making this assessment, our management used the criteria set forth by the Committee of Sponsoring Organizations of the Treadway Commission ("COSO") in Internal Control-Integrated Framework (1992). As of May 31, 2014, management believes that the Company's internal control over financial reporting is effective based on those criteria. Our independent registered public accounting firm has issued an audit report on our internal control over financial reporting, which is included in this annual report.
Because of its inherent limitations, internal control over financial reporting may not prevent or detect all misstatements. Projections of any evaluation of effectiveness to future periods are subject to the risk that controls may become inadequate because of changes in conditions or that the degree of compliance with the policies or procedures may deteriorate. Internal control over financial reporting cannot provide absolute assurance of achieving financial reporting objectives because of its inherent limitations. Internal control over financial reporting is a process that involves human diligence and compliance and is subject to lapses in judgment and breakdowns resulting from human failures. Internal control over financial reporting also can be circumvented by collusion or improper management override. Due to such limitations, there is a risk that material misstatements may not be prevented or detected on a timely basis by internal control over financial reporting. However, these inherent limitations are known features of the financial reporting process. Therefore, it is possible to design into the process safeguards to reduce, though not eliminate, such risk.
Changes in Internal Control over Financial Reporting
There were no changes in our internal control over financial reporting or in other factors that occurred during the quarter ended May 31, 2014 that have materially affected, or are reasonably likely to materially affect, our internal control over financial reporting.
ITEM 9B- OTHER INFORMATION
None.
82
PART III
ITEM 10- DIRECTORS, EXECUTIVE OFFICERS AND CORPORATE GOVERNANCE
We incorporate by reference in this Item 10 information about our directors, executive officers and our corporate governance contained under the headings “Election of Directors” and "Information Concerning Our Executive Officers" and information about compliance with Section 16(a) of the Securities and Exchange Act of 1934 by our directors and executive officers under the heading “Section 16(a) Beneficial Ownership Reporting Compliance” from our proxy statement to be delivered in connection with our 2014 Annual Meeting of Shareholders to be held on November 19, 2014.
We have adopted codes of ethics that apply to our senior financial officers. The senior financial officers include our Chief Executive Officer, Chief Financial Officer, Chief Accounting Officer, Controller or persons performing similar functions. The code of ethics is available in the investor information section of our website at www.globalpaymentsinc.com, and as indicated in the section entitled “Where To Find Additional Information” in Part I to this Annual Report on Form 10-K. We intend to satisfy the disclosure requirement under Item 5.05 of Form 8-K regarding an amendment to, or a waiver from, a provision of our code of ethics by posting such information on our website at the address and location set forth above.
As previously reported, effective June 30, 2014, our Board of Directors promoted David E. Mangum from Senior Executive Vice President and Chief Financial Officer to President and Chief Operating Officer and appointed Cameron M. Bready as Executive Vice President and Chief Financial Officer. Solely for purposes of this Annual Report on Form 10-K and the certifications attached hereto, which are filed shortly after, and relate to a fiscal period that precedes, the effective date of Mr. Mangum’s promotion and Mr. Bready’s appointment, Mr. Mangum performed the function of “principal financial officer” (or the equivalent of “chief financial officer”).
ITEM 11- EXECUTIVE COMPENSATION
We incorporate by reference in this Item 11 the information relating to executive and director compensation contained under the headings “Compensation, Discussion, and Analysis,” "Director Compensation" and “Report of the Compensation Committee” from our proxy statement to be delivered in connection with our 2014 Annual Meeting of Shareholders.
ITEM 12- SECURITY OWNERSHIP OF CERTAIN BENEFICIAL OWNERS AND MANAGEMENT AND RELATED STOCKHOLDER MATTERS
We incorporate by reference in this Item 12 the information relating to ownership of our common stock by certain persons contained under the headings “Common Stock Ownership of Management” and “Common Stock Ownership by Certain Other Persons” from our proxy statement to be delivered in connection with our 2014 Annual Meeting of Shareholders.
The following table provides certain information as of May 31, 2014 concerning the shares of the Company’s common stock that may be issued under existing equity compensation plans. For more information on these plans, see Note 11 to notes to consolidated financial statements.
Plan category | Number of securities to be issued upon exercise of outstanding options, warrants and rights (a) | Weighted-average exercise price of outstanding options, warrants and rights (b) | Number of securities remaining available for future issuance under equity compensation plans (excluding securities reflected in column (a)) (c) | ||||||
Equity compensation plans approved by security holders | 766,801 | $ | 40.85 | 8,945,694 | |||||
Equity compensation plans not approved by security holders | — | — | — | ||||||
Total | 766,801 | $ | 40.85 | 8,945,694 | |||||
The information presented in the table above includes shares of common stock available for issuance other than upon the exercise of an option, warrant or right under the Employee Stock Purchase Plan and the 2011 Incentive Plan. In addition, it includes 977,296 shares authorized under the Amended and Restated 2005 Incentive Plan and 584,004 shares authorized under the 2000
83
Long-Term Incentive Plan. As previously disclosed, we do not intend to issue shares under either the Amended and Restated 2005 Incentive Plan or the 2000 Long-Term Incentive Plan.
ITEM 13- CERTAIN RELATIONSHIPS AND RELATED TRANSACTIONS, AND DIRECTOR INDEPENDENCE
We incorporate by reference in this Item 13 the information regarding certain relationships and related transactions between us and our affiliates and the independence of our directors contained under the headings “Certain Relationships and Related Transactions” and “Board Independence” from our proxy statement to be delivered in connection with our 2014 Annual Meeting of Shareholders.
ITEM 14- PRINCIPAL ACCOUNTING FEES AND SERVICES
We incorporate by reference in this Item 14 the information regarding principal accounting fees and services contained under the heading "Ratification of the Reappointment of Auditors" from our proxy statement to be delivered in connection with our 2014 Annual Meeting of Shareholders.
84
PART IV
ITEM 15- EXHIBITS, FINANCIAL STATEMENT SCHEDULES:
(a) The following documents are filed as part of this Annual Report
(1) Consolidated Financial Statements
Our consolidated financial statements listed below are set forth in “Item 8-Financial Statements and Supplementary Data” of this report:
Page Number | |
Reports of Independent Registered Public Accounting Firm | |
Consolidated Statements of Income for the years ended May 31, 2014, 2013 and 2012 | |
Consolidated Statements of Comprehensive Income for the years ended May 31, 2014, 2013 and 2012 | |
Consolidated Balance Sheets as of May 31, 2014 and 2013 | |
Consolidated Statements of Cash Flows for the years ended May 31, 2014, 2013 and 2012 | |
Consolidated Statements of Changes in Equity for the years ended May 31, 2014, 2013, and 2012 | |
Notes to Consolidated Financial Statements | |
(2) Financial Statement Schedules
Page Number | |
Schedule II, Valuation and Qualifying Accounts | |
All other schedules to our consolidated financial statements have been omitted because they are not required under the related instruction or are inapplicable, or because we have included the required information in our consolidated financial statements or related notes.
(3) Exhibits
The following exhibits either (i) are filed with this report or (ii) have previously been filed with the SEC and are incorporated in this Item 15 by reference to those prior filings.
Exhibit No. | Description |
2.1 | Agreement and Plan of Merger, dated as of January 23, 2014, by and among the Company, Payment Processing, Inc. and, solely for the limited purposes set forth therein, certain additional parties thereto, incorporated by reference to Exhibit 2.1 to the Company’s Quarterly Report on Form 10-Q filed April 3, 2014. |
3.1 | Second Amended and Restated Articles of Incorporation of the Company, incorporated by reference to Exhibit 3.1 to the Company’s Annual Report on Form 10-K filed July 25, 2013. |
3.2 | Sixth Amended and Restated Bylaws of the Company, incorporated by reference to Exhibit 3.2 to the Company’s Annual Report on Form 10-K filed July 25, 2013. |
10.1* | Amended and Restated Term Loan Agreement, dated as of February 28, 2014, by and among the Company and Global Payments Direct, Inc., as borrowers, Bank of America, N.A., as administrative agent, and certain other lenders party thereto. |
10.2* | Amended and Restated Credit Agreement, dated as of February 28, 2014, by and among the Company and certain wholly owned subsidiaries of the Company, as borrowers, Bank of America, N.A., as administrative agent, swing line lender and letter of credit issuer, and certain other lenders party thereto. |
10.3 | First Amended and Restated Marketing Alliance Agreement with HSBC Bank plc, dated June 12, 2009, incorporated by reference to Exhibit 10.39 to the Company’s Annual Report on Form 10-K filed July 28, 2009, File No. 001-16111. |
10.4 | Stock Purchase Agreement for Accelerated Payment Technologies, Inc., dated as of August 14, 2012, by and among the Company, Vegas Holding Corp., its stockholders and the stockholder representative named therein, incorporated by reference to Exhibit 10.1 to the Company’s Quarterly Report on Form 10-Q filed October 2, 2012. |
85
10.5 | Stock Purchase Agreement for Global Payments Asia-Pacific Limited, dated as of July 26, 2012, by and between Global Payments Acquisition PS 2 C.V. and The Hongkong and Shanghai Banking Corporation Limited, incorporated by reference to Exhibit 10.2 to the Company’s Quarterly Report on Form 10-Q filed October 2, 2012. |
10.6+ | Amended and Restated 2000 Long-Term Incentive Plan, incorporated by reference to Exhibit 10.9 to the Company’s Annual Report on Form 10-K filed August 26, 2003, File No. 001-16111. |
10.7+ | First Amendment to Amended and Restated 2000 Long-Term Incentive Plan, dated March 28, 2007, incorporated by reference to Exhibit 10.17 to the Company's Annual Report on Form 10-K filed July 30, 2007, File No. 001-16111. |
10.8+ | Second Amendment to Amended and Restated 2000 Long-Term Incentive Plan, dated December 15, 2008, incorporated by reference to Exhibit 10.1 to the Company's Form 10-Q filed April 6, 2009, File No. 001-16111. |
10.9+ | Amended and Restated 2000 Employee Stock Purchase Plan, incorporated by reference to Exhibit 99.2 to the Company's Registration Statement on Form S-8 filed January 16, 2001, File No. 333-53774. |
10.10+ | Third Amended and Restated 2000 Non-Employee Director Stock Option Plan, dated June 1, 2004, incorporated by reference to Exhibit 10.20 to the Company's Annual Report on Form 10-K filed July 30, 2007, File No. 001-16111. |
10.11+ | Amendment to the Third Amended and Restated 2000 Non-Employee Director Stock Option Plan, dated March 28, 2007, incorporated by reference to Exhibit 10.21 to the Company's Annual Report on Form 10-K filed July 30, 2007, File No. 001-16111. |
10.12+ | Third Amended and Restated 2005 Incentive Plan, dated December 31, 2008, incorporated by reference to Exhibit 10.2 to the Company's Form 10-Q filed April 6, 2009, File No. 001-16111. |
10.13+ | Form of Performance Unit Award (U.S. Officers) pursuant to the Amended and Restated 2005 Incentive Plan, incorporated by reference to Exhibit 10.3 to the Company's Quarterly Report on Form 10‑Q filed January 8, 2007, File No. 001-16111. |
10.14+ | Form of Performance Unit Award (Non-U.S. Officers) pursuant to the Amended and Restated 2005 Incentive Plan, incorporated by reference to Exhibit 10.4 to the Company's Quarterly Report on Form 10-Q filed January 8, 2007, File No. 001-16111. |
10.15+ | Form of Non-Statutory Stock Option Award pursuant to the Amended and Restated 2005 Incentive Plan, incorporated by reference to Exhibit 10.5 to the Company's Quarterly Report on Form 10-Q filed January 8, 2007, File No. 001-16111. |
10.16+ | Form of Non-Statutory Stock Option Award pursuant to the Amended and Restated 2005 Incentive Plan (Hong Kong employees), incorporated by reference to Exhibit 10.6 to the Company's Quarterly Report on Form 10-Q filed January 8, 2007, File No. 001-16111. |
10.17+ | Form of Non-Statutory Stock Option Award pursuant to the Amended and Restated 2005 Incentive Plan (certain Asia-Pacific employees), incorporated by reference to Exhibit 10.7 to the Company's Quarterly Report on Form 10-Q filed January 8, 2007, File No. 001-16111. |
10.18+ | Form of Restricted Stock Award pursuant to the Amended and Restated 2005 Incentive Plan, incorporated by reference to Exhibit 10.8 to the Company's Quarterly Report on Form 10-Q filed January 8, 2007, File No. 001-16111. |
10.19+ | Form of Stock-Settled Restricted Stock Unit Award pursuant to the Amended and Restated 2005 Incentive Plan, incorporated by reference to Exhibit 10.9 to the Company's Quarterly Report on Form 10-Q filed January 8, 2007, File No. 001-16111. |
10.20+ | Form of the Performance Unit Award Certificate (Performance Shares) pursuant to the Third Amended and Restated 2005 Incentive Plan, dated December 31, 2008, incorporated by reference to Exhibit 10.6 to the to the Company's Quarterly Report on Form 10-Q filed October 11, 2011, File No. 001-16111. |
10.21+ | Form of the Performance Unit Award Certificate (TSR) pursuant to the Third Amended and Restated 2005 Incentive Plan, dated December 31, 2008, incorporated by reference to Exhibit 10.7 to the to the Company's Quarterly Report on Form 10-Q filed October 11, 2011, File No. 001-16111. |
10.22+ | Non-Qualified Deferred Compensation Plan, incorporated by reference to Exhibit 99.1 to the Company's Registration Statement on Form S-8 filed September 16, 2010. |
10.23+ | 2011 Incentive Plan, incorporated by reference to Exhibit 99.1 to the Company’s Current Report on Form 8-K filed September 29, 2011. |
10.24*+ | Form of Restricted Stock Award pursuant to the 2011 Incentive Plan (2013 and 2014 fiscal years). |
10.25*+ | Form of Performance Unit Award (Performance Shares) (2013 fiscal year) pursuant to the 2011 Incentive Plan. |
10.26*+ | Form of Performance Unit Award (Performance Shares) (2014 fiscal year) pursuant to the 2011 Incentive Plan. |
10.27*+ | Form of Performance Unit Award (TSRs) (2013 fiscal year) pursuant to the 2011 Incentive Plan. |
10.28*+ | Form of Performance Unit Award (TSRs) (2014 fiscal year) pursuant to the 2011 Incentive Plan. |
10.29*+ | Form of Stock-Settled Restricted Stock Unit Award pursuant to the 2011 Incentive Plan. |
10.30*+ | Form of Stock-Settled Restricted Stock Unit Award (Hong Kong employees) pursuant to the 2011 Incentive Plan. |
86
10.31*+ | Form of Stock-Settled Restricted Stock Unit Award (Canada employees) pursuant to the 2011 Incentive Plan. |
10.32+ | Amended and Restated 2014 Non-Employee Director Compensation Plan, dated April 1, 2014 (sub-plan to the Global Payments Inc. 2011 Incentive Plan, dated September 27, 2011), incorporated by reference to Exhibit 10.1 to the to the Company's Current Report on Form 8-K filed May 28, 2014. |
10.33+ | Annual Performance Plan, adopted August 29, 2012 (sub-plan to the Global Payments Inc. 2011 Incentive Plan, dated September 27, 2011), incorporated by reference to Exhibit 10.52 to the Company’s Annual Report on Form 10-K filed July 25, 2013. |
10.34+ | Employment Agreement by and between the Company and Jeffrey S. Sloan, dated as of March 30, 2010, incorporated by reference to Exhibit 10.1 to the Company’s Current Report on Form 8-K filed April 1, 2010. |
10.35+ | Amendment to Employment Agreement by and between the Company and Jeffrey S. Sloan, dated as of October 1, 2013, incorporated by reference to Exhibit 10.3 to the Company’s Current Report on Form 8-K filed October 7, 2013. |
10.36+ | Employment Agreement by and between the Company and David E. Mangum, dated as of March 1, 2010, incorporated by reference to Exhibit 10.1 to the Company’s Current Report on Form 8-K filed March 3, 2010. |
10.37+ | Employment Agreement by and between the Company and G. Thomas Balas, Jr., dated as of December 1, 2013, incorporated by reference to Exhibit 10.2 to the Company’s Quarterly Report on Form 10-Q filed January 8, 2014. |
10.38+ | Employment Agreement by and between the Company and Cameron M. Bready, dated as of May 21, 2014, incorporated by reference to Exhibit 10.1 to the Company’s Current Report on Form 8-K filed May 23, 2014. |
10.39+ | Employment Agreement by and between the Company and Jane M. Elliott, dated as of December 1, 2013, incorporated by reference to Exhibit 10.1 to the Company’s Quarterly Report on Form 10-Q filed January 8, 2014. |
10.40+ | Employment Agreement by and between the Company and Paul R. Garcia, dated as of July 12, 2000, incorporated by reference to Exhibit 10.13 to Pre-Effective Amendment No. 1 to the Company's Registration Statement on Form 10 filed October 27, 2000. |
10.41+ | Amendment to Employment Agreement by and between the Company and Paul R. Garcia, dated as of December 23, 2008, incorporated by reference to Exhibit 10.3 to the Company's Form 10-Q filed April 6, 2009, File No. 001-16111. |
10.42+ | Second Amendment to Employment Agreement by and between the Company and Paul R. Garcia, dated as of October 1, 2013, incorporated by reference to Exhibit 10.1 to the Company’s Current Report on Form 8-K filed October 7, 2013. |
10.43+ | Key Position Agreement by and between the Company and Paul R. Garcia, dated as of January 6, 2010, incorporated by reference to Exhibit 10.1 to Current Report on Form 8-K filed January 6, 2010. |
10.44+ | Amendment to Key Position Agreement by and between the Company and Paul R. Garcia, dated as of October 1, 2013, incorporated by reference to Exhibit 10.2 to Current Report on Form 8-K filed January 6, 2010. |
10.45+ | Employment Agreement by and between the Company and David L. Green, dated as of December 1, 2013, incorporated by reference to Exhibit 10.4 to the Company’s Quarterly Report on Form 10-Q filed January 8, 2014. |
10.46+ | Non-Competition and Non-Solicitation Agreement by and between the Company and Daniel C. O’Keefe, dated as of October 1, 2013, incorporated by reference to Exhibit 10.2 to the Company’s Quarterly Report on Form 10-Q filed October 1, 2013. |
10.47+ | Employment Agreement by and between the Company and Guido F. Sacchi, dated as of December 1, 2013, incorporated by reference to Exhibit 10.3 to the Company’s Quarterly Report on Form 10-Q filed January 8, 2014. |
10.48+ | Amended and Restated Employment Agreement by and between the Company and Morgan M. Schuessler, dated as of August 23, 2013, incorporated by reference to Exhibit 10.1 to the Company’s Quarterly Report on Form 10-Q filed October 1, 2013. |
10.49+ | Employment Agreement by and between the Company and Suellyn P. Tornay, dated as of June 1, 2001, incorporated by reference to Exhibit 10.23 to the Company's Annual Report on Form 10-K filed August 10, 2004, File No. 001-16111. |
10.50+ | Amendment to Employment Agreement by and between the Company and Suellyn P. Tornay, dated as of June 1, 2001, incorporated by reference to Exhibit 10.5 to the Company's Form 10-Q filed April 6, 2009, File No. 001-16111. |
10.51+ | Transition and Separation Agreement by and between the Company and Suellyn P. Tornay, dated as of December 12, 2013, incorporated by reference to Exhibit 10.1 to the Company’s Current Report on Form 8-K filed December 16, 2013. |
21.1* | List of Subsidiaries. |
23.1* | Consent of Independent Registered Public Accounting Firm. |
24.1* | Powers of Attorney of Certain Directors. |
31.1* | Rule 13a-14(a)/15d-14(a) Certification of CEO. |
31.2* | Rule 13a-14(a)/15d-14(a) Certification of CFO. |
32.1* | Certification pursuant to 18 U.S.C. § 1350, as adopted pursuant to § 906 of the Sarbanes-Oxley Act of 2002. |
87
101.1* | The following financial information from the Annual Report on Form 10-k for the year ended May 31, 2014, formatted in XBRL (eXtensible Business Reporting Language) and filed electronically herewith: (i) the Consolidated Statements of Income; (ii) the Consolidated Statements of Comprehensive Income; (iii) the Consolidated Balance Sheets; (iv) the Consolidated Statements of Cash Flows; (v) the Consolidated Statements of Changes in Equity; and (vi) the Notes to Consolidated Financial Statements. |
* Filed with this report.
+ Represents a management contract or compensatory plan or arrangement.
(b) Exhibits
Page Number | |
Index to Exhibits | |
(c) Financial Statement Schedules
See Item 15(a)(2) above.
88
SIGNATURES
Pursuant to the requirements of Section 13 or 15(d) of the Securities Exchange Act of 1934, Global Payments Inc. has duly caused this report to be signed on its behalf by the undersigned, thereunto duly authorized, on July 29, 2014.
GLOBAL PAYMENTS INC. | |
By: | /s/ Jeffrey S. Sloan |
Jeffrey S. Sloan | |
Chief Executive Officer | |
(Principal Executive Officer) | |
By: | /s/ David E. Mangum |
David E. Mangum | |
President and Chief Operating Officer | |
(Principal Financial Officer) | |
By: | /s/ Daniel C. O'Keefe |
Daniel C. O'Keefe | |
Senior Vice President and Chief Accounting Officer | |
(Principal Accounting Officer) | |
Pursuant to the requirements of the Securities Exchange Act of 1934, this report has been signed below by the following persons on behalf of Global Payments Inc. and in the capacities and on the dates indicated.
Signature | Title | Date | |||
/s/ William I Jacobs * | Chairman of the Board | July 29, 2014 | |||
William I Jacobs | |||||
/s/ John G. Bruno* | Director | July 29, 2014 | |||
John G. Bruno | |||||
/s/ Alex W. (Pete) Hart * | Director | July 29, 2014 | |||
Alex W. (Pete) Hart | |||||
/s/ Ruth Ann Marshall * | Director | July 29, 2014 | |||
Ruth Ann Marshall | |||||
/s/ John M. Partridge * | Director | July 29, 2014 | |||
John M. Partridge | |||||
/s/ Alan M. Silberstein * | Director | July 29, 2014 | |||
Alan M. Silberstein | |||||
/s/ Jeffrey S. Sloan | Director | July 29, 2014 | |||
Jeffrey S. Sloan | |||||
/s/ Michael W. Trapp * | Director | July 29, 2014 | |||
Michael W. Trapp | |||||
/s/ Gerald J. Wilkins * | Director | July 29, 2014 | |||
Gerald J. Wilkins | |||||
*By: | /s/ Jeffrey S. Sloan | Attorney-in-fact | July 29, 2014 | ||
Jeffrey S. Sloan | |||||
89