Attached files
| file | filename |
|---|---|
| EX-99.1 - EX-99.1 - OCEANFIRST FINANCIAL CORP | d761991dex991.htm |
| 8-K - FORM 8-K - OCEANFIRST FINANCIAL CORP | d761991d8k.htm |
 OceanFirst Financial Corp.
INVESTOR PRESENTATION
JULY 2014
Exhibit 99.2
NASDAQ: OCFC
1 |
 OceanFirst Financial Corp.
Forward Looking Statements:
This presentation contains certain forward-looking statements within the
meaning of the Private Securities Reform Act of 1995 which are based on
certain assumptions and describe future plans, strategies and expectations
of the Company. These forward-looking statements are generally
identified by use of the words "believe," "expect,"
"intend," "anticipate," "estimate," "project," "will,"
"should," "may," "view," "opportunity,"
"potential," or similar expressions or expressions of confidence.
The Company's ability to predict results or the actual effect of
future plans or strategies is inherently
uncertain. Factors which could have a material adverse effect on the
operations of the Company and its subsidiaries include, but are not limited
to, changes in interest rates, general economic conditions, levels of
unemployment in the Bank’s lending area, real estate market values in the Bank’s lending
area, future natural disasters and increases to flood insurance premiums, the level
of prepayments on loans
and
mortgage-backed
securities,
legislative/
regulatory
changes,
monetary
and
fiscal
policies
of
the U.S. Government including policies of the U.S. Treasury and the Board of
Governors of the Federal Reserve System, the quality or composition of the
loan or investment portfolios, demand for loan products, deposit flows,
competition, demand for financial services in the Company's market area and
accounting principles and guidelines. These risks and uncertainties are further discussed in
the Company’s Annual Report on Form 10-K for the year ended December 31,
2013 and should be considered in evaluating forward-looking statements
and undue reliance should not be placed on such statements. The
Company does not undertake - and specifically disclaims any
obligation - to
publicly release the result of any revisions which may be made to any
forward-looking statements to reflect events or circumstances after the
date of such statements or to reflect the occurrence of anticipated or
unanticipated events. NASDAQ: OCFC
2 |
 NASDAQ: OCFC
3
112 Years of Growth and Capital Management
112 Years of Growth and Capital Management
Founded in Point Pleasant, NJ, in 1902, OceanFirst has grown from a small
one-town savings and loan to a full-service community bank serving
the Central New Jersey Shore. Rebuilt capital from 6.05% to 9.27% through the
Great Recession with retained earnings and completion of a follow-on
common stock offering in November 2009. Demutualized in 1996 and over the
ensuing 11 years generated value for shareholders,
largely through the successful implementation and execution of our community bank
model, and the strategic repurchase of 62.4% of original IPO shares.
Since late 2011, the Company has utilized share repurchases to again strategically
redeploy surplus capital until growth prospects improved. Current
repurchase authorization for 867,923 shares in place until
growth initiatives mature. |
 Community Bank serving the Central
Jersey Shore -
$2.3 billion in assets and
23 branch offices
Market Cap $275 million
Core deposits –
87.4%
of total deposits
Locally
originated
loan
portfolio
-
no
SNCs
Residential and commercial
real estate mortgages
C&I loans and lines
Consumer equity loans and lines
Corporate Profile
Corporate Profile
Note: See Appendix 1 for Market Demographic information.
Philadelphia
New York
Morris
Sussex
Warren
Hunterdon
Bergen
Somerset
Passaic
Essex
Union
Hudson
Ocean
Burlington
Atlantic
Salem
Monmouth
Cumberland
Mercer
Middlesex
Gloucester
Camden
Cape May
NASDAQ: OCFC
4 |
 Experienced Executive Management Team
Substantial insider ownership of 27.4% –
aligned
with
shareholders’
interests
OceanFirst Bank ESOP 10.5%
Directors & Senior Executive Officers 9.8% (CEO 5.7%)
Director and Proxy Officer Stock Ownership Guidelines
OceanFirst Foundation 7.1%
As of the March 11, 2014 proxy
record date.
Name
Position
# of Years in
Banking
# of Years
at OCFC
John R. Garbarino
Chairman, Chief Executive Officer
43
43
Christopher D. Maher
President, Chief Operating Officer
26
1
Michael J. Fitzpatrick
Executive Vice President, Chief Financial Officer
32
21
Joseph R. Iantosca
Executive Vice President, Chief Administrative Officer
36
10
Joseph J. Lebel III
Executive Vice President, Chief Lending Officer
30
8
Succession planning affirmed –
Christopher D. Maher named as successor
CEO effective January 1, 2015
NASDAQ: OCFC
5 |
 Our
Strategy Our Strategy
Positioned as the leading Community Bank in attractive Central Jersey
Shore market –
developing the franchise, growing revenue and
creating additional value for shareholders
Strategically focused on revenue growth in commercial lending, wealth
management, and bankcard services
Guarding
credit
quality
in
ALL
business
cycles
Growing diversified streams of non-interest income to decrease
reliance on Net Interest Margin (NIM)
On the watch for roll-up opportunities presented by local community
banks lacking the scale or desire to remain independent
NASDAQ: OCFC
6 |
 NASDAQ: OCFC
7
Significant
Significant
Primary Market Deposit Share
Primary Market Deposit Share
Competing
Favorably
Against
Banking
Behemoths
# of
Dep. In Mkt.
Mkt. Shr.
Rank
Institution
Branches
($000)
(%)
Ocean County, NJ
1
TD Bank, National Association (Canada)
21
2,460,349
16.88
2
Hudson
City
Bancorp
Inc.
(NJ)
(1)
14
2,415,792
16.57
3
Wells Fargo Bank NA (CA)
26
2,315,657
15.89
4
OceanFirst Financial Corp. (NJ)
20
1,488,197
10.21
5
Banco Santander S.A. (Spain)
23
1,438,132
9.87
6
Bank of America Corp. (NC)
17
1,292,963
8.87
Total For Institutions In Market
192
14,577,615
Source: FDIC Summary of Deposits, June 30, 2013
(1)
Pending acquisition by M&T Bank (NY) |
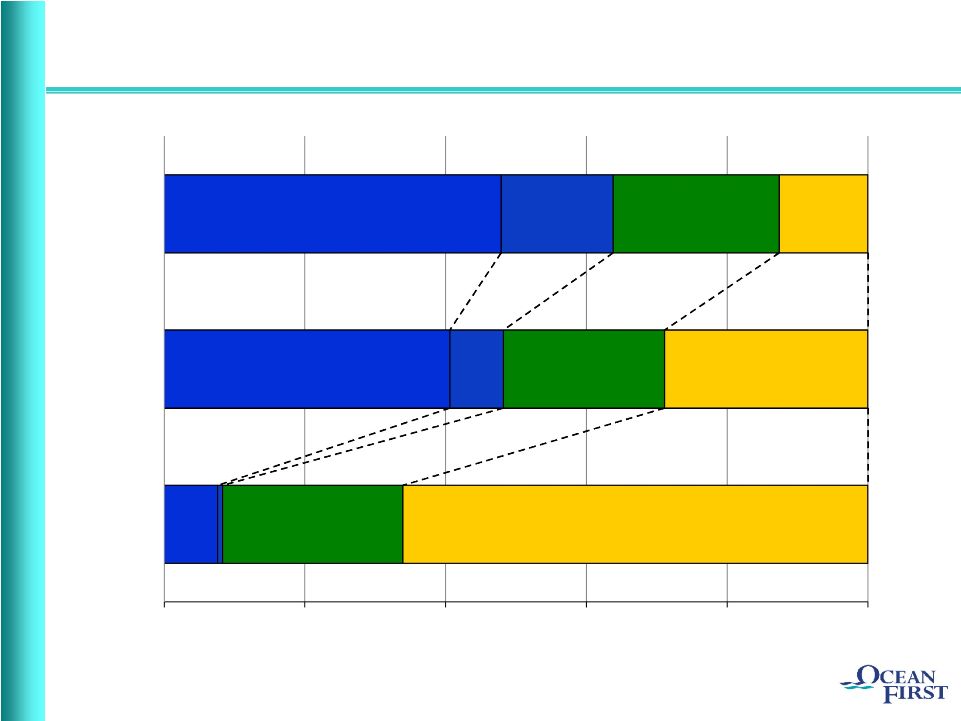 Strategic Deposit Composition Transition
Time
Deposits
0%
20%
40%
60%
80%
100%
Dec 1996
Dec 2008
June 2014
Time Deposits
Time Deposits
MMDA & Savings
MMDA & Savings
MMDA & Savings
Interest Checking
Interest Checking
Interest
Checking
Interest
Checking
Non
Interest
Checking
Non-
-
NASDAQ: OCFC
8 |
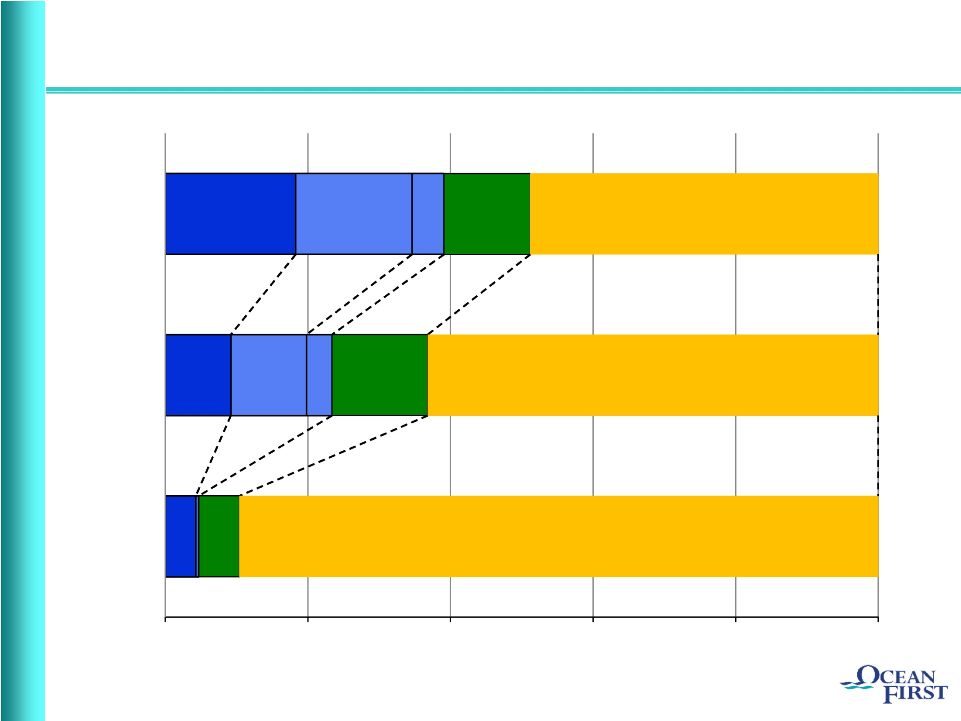 Strategic Loan Composition Transition
C&I
NASDAQ: OCFC
9
0%
20%
40%
60%
80%
100%
Dec 1996
Dec 2008
June 2014
Residential R.E.
Residential R.E.
Residential R.E.
Investment
CRE
Investment CRE
Investment
CRE
Consumer &
Other
Consumer
& Other
Consumer &
Other
C&I
Owner-
Occupied CRE
Owner-
Occupied
CRE |
 Grew commercial loan portfolio $35.3 million, 22.9% annualized
Earnings per share of $0.30, 9.5% ROE & 0.90% ROA
Net interest margin stable at 3.35%, above historical average
New 5% common stock repurchase plan put in place
Tangible common equity of 9.3% of assets
Highlights
Highlights
–
–
Second Quarter 2014
Second Quarter 2014
NASDAQ: OCFC
10 |
 Highlights –
Risk Management
Risk Management
NASDAQ: OCFC
11
Interest Rate Risk Management
Extended
$110
million
of
FHLB
advances
into
3
–
5
year
terms
$64 million of retail checking migrated to non-interest bearing
Retail and commercial checking growth replacing more price
sensitive government deposits
Asset Quality Improvements
Non-performing loans decreased by 10% or $4.6 million to
$40.7 million at June 30, 2014
Quarterly charge-offs decreased 48% from the linked quarter
92% of residential NPLs relate to loans originated before 2009
|
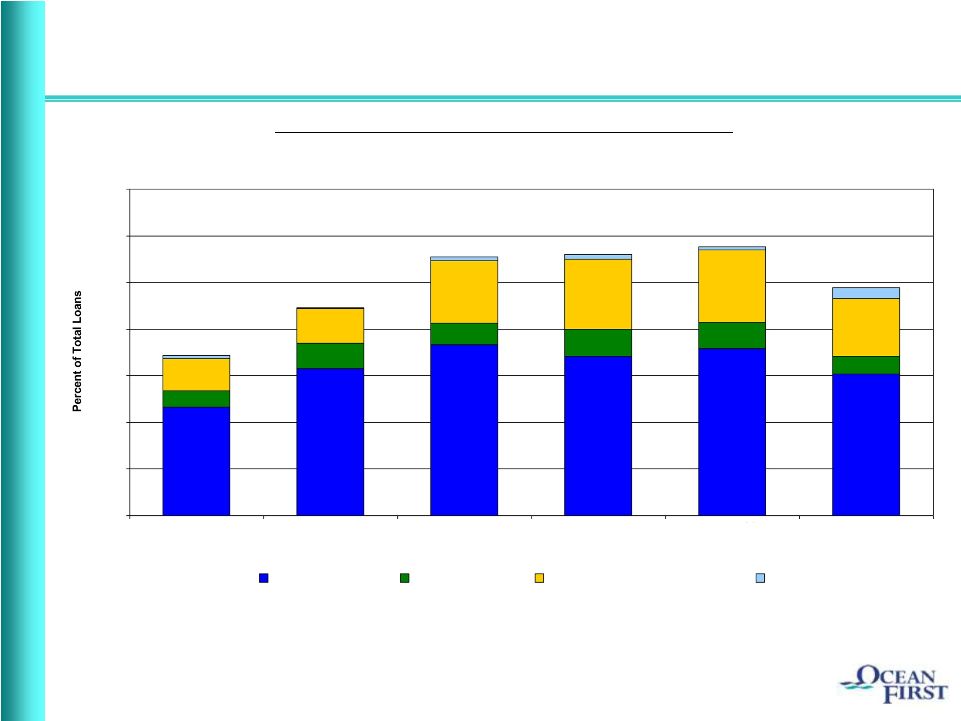 Stabilized NPL’s in a Diversified Portfolio
Data as of December 31, unless otherwise indicated.
(1)
Increase attributable to Superstorm Sandy.
Exposure
Primarily
in
Lower
Risk
Residential
(1)
0.00%
0.50%
1.00%
1.50%
2.00%
2.50%
3.00%
3.50%
2009
2010
2011
2012
2013
6/30/2014
Residential
Consumer
Commercial Real Estate
Commercial
NASDAQ: OCFC
12 |
 Prudently Provisioning for Credit Costs
$0
$1
$2
$3
$4
$5
$6
$7
$8
$9
$10
Net Charge-Offs
Provision for Loan Losses
(1)
Spike in charge-offs was due to a change in charge-off policy to recognize
the charge-off when the loan is deemed uncollectible rather than when
the foreclosure process is complete. The additional charge-off relating to the change in
policy through 2011 was $5.7 million, all of which had been previously
specifically reserved. (2)
Increase attributable to Superstorm Sandy.
12/31/09
12/31/10
12/31/11
(1)
12/31/12
(2)
12/31/13
6/30/14
(Annualized)
NASDAQ: OCFC
13 |
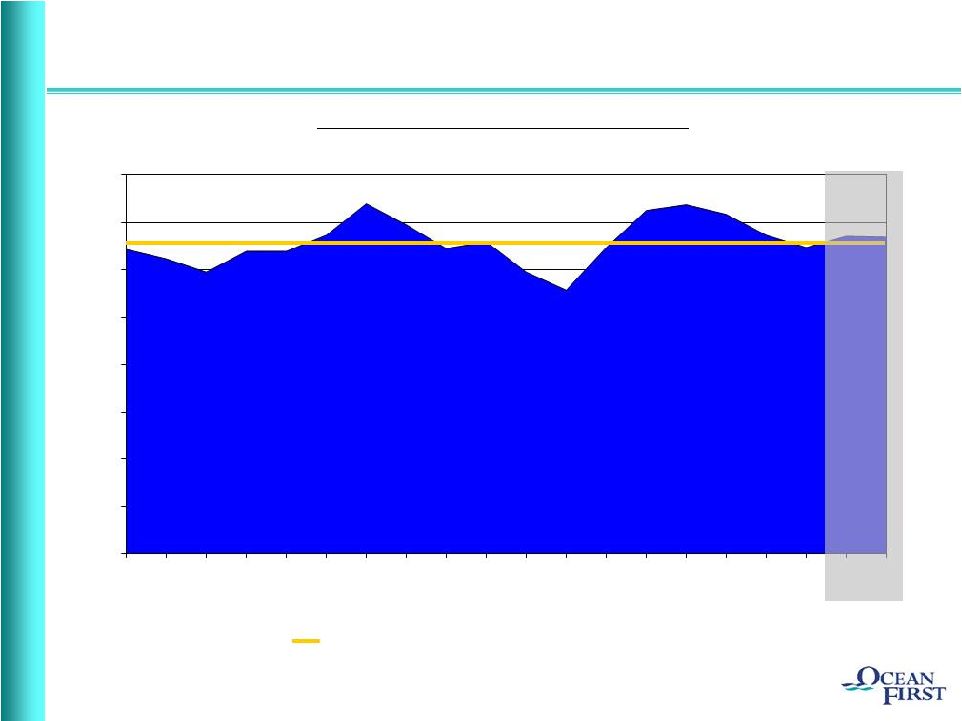 Net
Net
Interest Margin
Interest Margin
Stabilizing
Close
to
Historical
Levels
Quarterly
Trend
Historical Average Net Interest Margin (3.28%)
0.00%
0.50%
1.00%
1.50%
2.00%
2.50%
3.00%
3.50%
4.00%
1996
1998
2000
2002
2004
2006
2008
2010
2012
2013
Q1
2014
Q2
2014
NASDAQ: OCFC
14 |
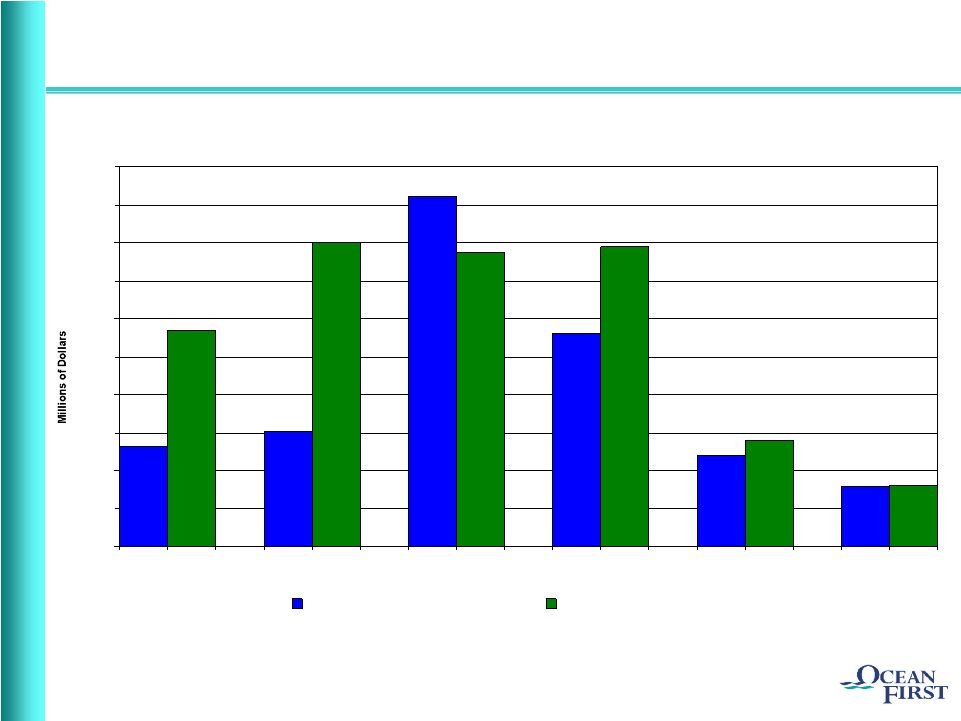
 Diversified Streams of Non-Interest Income
2011
Non-Interest Income excludes gain/loss from other real estate operations, gain
on sale of securities and provision for repurchased loans.
$2.5M
$17.0M
Targeted
Growth
Areas
NASDAQ: OCFC
15
0.00%
0.10%
0.20%
0.30%
0.40%
0.50%
0.60%
0.70%
0.80%
0.90%
Fees and Service Charges
Gain on Sale of Loans
BOLI
Other
BankCard Services
Investment Services
Wealth Management
1996
6/30/14 (Annualized) |
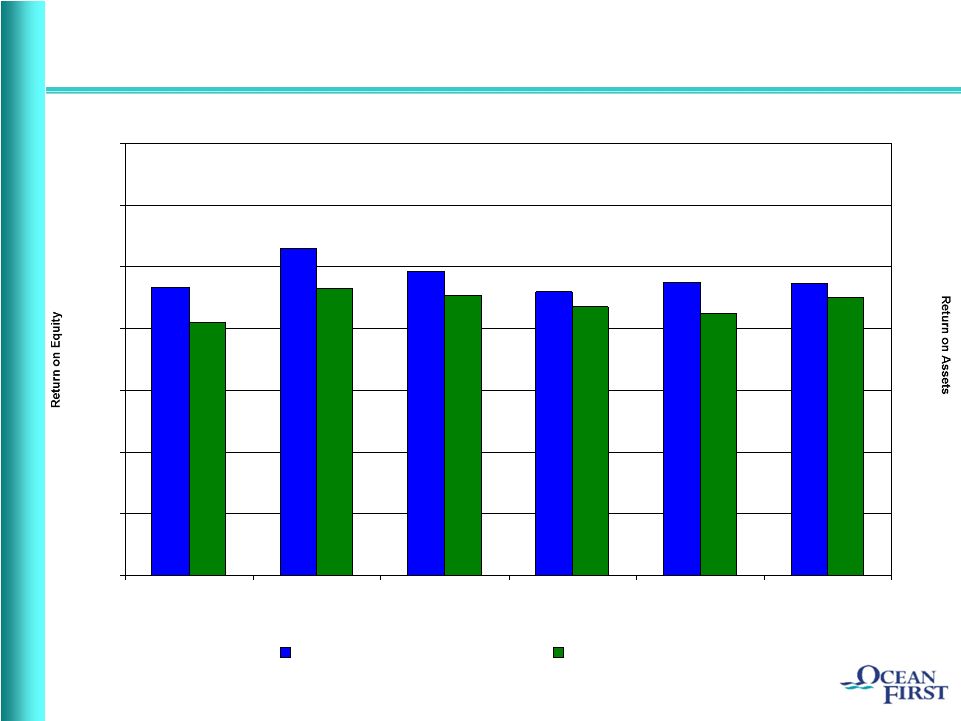 Generating Consistent Attractive Returns
0.0%
0.20%
0.40%
0.60%
0.80%
1.00%
1.20%
1.40%
(1)
(1)
0.0%
2.0%
4.0%
6.0%
8.0%
10.0%
12.0%
14.0%
2009
2010
2011
2012
2013
6/30/2014
(Annualized)
Return on Equity
Return on Assets
NASDAQ: OCFC
16
Excludes after-tax impact of $3.1 million in non-recurring charges related to strategic
advance restructuring and branch consolidation. |
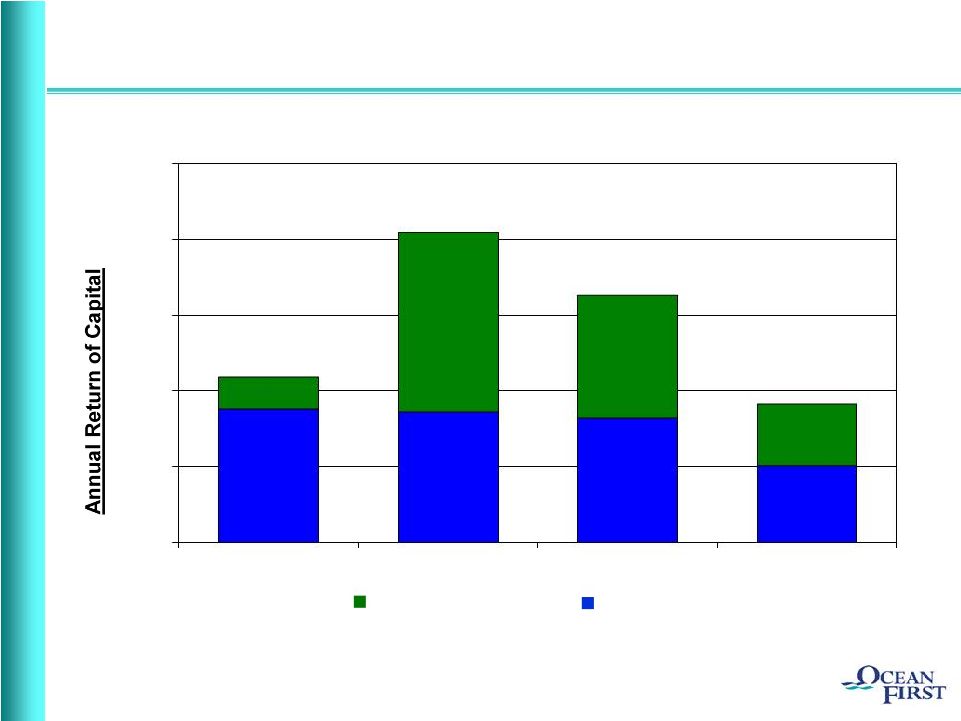 Prudently Managing Excess Capital in Near Term
Note:
Stock
Repurchases
–
$14.74
Average
Cost
per
Share
Cash
Dividends
Stock Repurchases
$0.0
$5.0
$10.0
$15.0
$20.0
$25.0
2011
2012
2013
2014 (Six Months)
NASDAQ: OCFC
17 |
 Target growth within existing market –
increasing share
Commercial loans increase at double digit growth rate for four consecutive
quarters Superstorm Sandy recovery providing market opportunity*
Continuing Strategic Execution
FHLB Advances restructured in fourth quarter 2013
Rationalizing Branch Network and Residential Lending, reinvesting cost saves
supporting growth Diversifying and strengthening non-interest income
streams; reducing reliance on NIM Assessing opportunistic roll-up of
local community banks Financial performance develops value proposition for
shareholders and preserves the right to remain independent
Challenge Today is to Grow Revenue
Challenge Today is to Grow Revenue
Build Shareholder Value
Build Shareholder Value
*Note: See Appendix 4.
NASDAQ: OCFC
18
Consolidated two overlapping branches at the end of 2013
Reduced residential lending overhead to improve efficiency
|
 Fundamental
franchise
value
–
superior
market
demographics
Seasoned and effective management team
Sandy response and experience
Substantial
insider
ownership
–
aligned
with
shareholders’
interests
Succession
planning
affirmed
–
2014
Attractive deposit mix and market share
Conservative credit culture and profile
Solid
financial
performance
–
developing
shareholder
value
Strong balance sheet and capital base
NASDAQ: OCFC
19
Why OCFC…?
Why OCFC…? |
 NASDAQ: OCFC
20
THANK YOU
FOR YOUR INTEREST IN
OCEANFIRST FINANCIAL CORP. |
 Market Demographics
APPENDIX 1
Ocean
Monmouth
Middlesex
New Jersey
National
Number of Offices
20
5
1
% of OceanFirst Deposits
86.6
10.3
3.1
Market Rank
4
18
36
Market Share (%)
10.2
0.9
0.2
Population
577,000
635,000
816,000
Projected 2012-2017
Population Growth (%)
1.6
1.0
2.1
1.2
3.5
Median Household Income ($)
59,000
81,000
77,000
67,000
50,000
Projected 2012-2017 Median
Household Income Growth (%)
22.6
14.0
13.1
18.9
13.4
Deposit data as of June 30, 2013.
Demographic data as of December 31, 2012.
Source: SNL Financial
NASDAQ: OCFC
21 |
 Residential Portfolio Metrics
Total Portfolio
$812.9 million
% of Total Loan Portfolio
48.8%
Average size of mortgage loans
$191,000
Interest-only loans
$22.2 million
- % of total 1-4 family loans
2.8%
- Weighted average loan-to-value ratio
(using original or most recent appraisal) 59%
Stated income loans
$34.7 million
- % of total 1-4 family
loans 4.4%
Portfolio weighted average loan-to-value ratio (using original or most recent appraisal)
56%
- Loans originated during 2014
62%
Portfolio average FICO score
748
- Loans originated during 2014
765
% of loans outside the New York/New Jersey market
3.8%
% of loans outside Ocean/Monmouth Counties
30.1%
% of loans exceeding agency conforming amounts
45.5%
% of loans for second homes
8.5%
APPENDIX 2
As of June 30, 2014, unless
otherwise noted.
NASDAQ: OCFC
22
Residential
Real
Estate |
 APPENDIX 3
Commercial Portfolio Metrics
Commercial Portfolio Metrics
As of June 30, 2014.
(1)
Combined commercial relationships (excluding small business) total 420.
Commercial Real Estate
(CRE)
Total portfolio
(1)
$577.1
million
% of Total Loan Portfolio
34.6%
Average size of CRE loans
$841,000
Largest CRE loan
$14.6
million
(Secured by local university dormitory housing)
Current
Pipeline
$59.1
million
Weighted Average Yield
4.35%
Weighted Average Repricing Term
5.5
years
Commercial
Loans
Total portfolio
(1)
$75.2
million
% of Total Loan Portfolio
4.5%
Average size of commercial loan
$286,000
Largest commercial loan
$3.9
million
Current Pipeline
$10.5
million
Weighted Average Yield
3.77%
Weighted Average Repricing Term
1 month
NASDAQ: OCFC
23 |
 Commercial Portfolio Segmentation
Total Commercial Loan Exposure
by Industry Classification
Real Estate Investment by
Property Classification
As of June 30, 2014.
APPENDIX 3
(Cont’d)
Diversified portfolio provides
protection against industry-
specific credit events.
Real Estate
Investment, 37.5%
Construction, 7.3%
Retail Trade, 3.2%
Wholesale Trade, 5.6%
Healthcare, 7.6%
Accommodations/
Food Services, 7.1%
Other Services, 3.2%
Arts/Entertainment/
Recreation, 7.5%
Manufacturing, 4.1%
Educational Services,
3.7%
Public Administration,
7.1%
Miscellaneous, 6.1%
Office, 36.0%
Industrial/
Warehouse, 13.4%
Residential
Development, 5.1%
Land,
1.8%
Commercial
Development, 10.2%
Shopping Center, 10.2%
Retail Store, 9.6%
Multi-Family, 2.5%
Miscellaneous, 11.2%
NASDAQ: OCFC
24 |
 Superstorm Sandy Recovery
* Construction lending has been driven by owner-occupied projects resulting
from storm damage APPENDIX 4
NASDAQ: OCFC
25
Loan Portfolio Performed Well
Net Charge-offs related to Superstorm Sandy total a modest $424,000
Damage Estimate ( FEMA 2012):
50,103 structures damaged were located in Monmouth and Ocean County
3,033 structures classified as major damage or totally destroyed
Multi-Year Recovery Horizon
4,307 Homes demolished in Monmouth and Ocean in 2013; 59% of New Jersey
total Toms River specifically
$23.6 million in consumer originated/committed in first half of 2014; $16.4
million cumulative undrawn $6.9 million in commercial originated/committed
in first half of 2014; $24.7 million cumulative undrawn $16.7 million
pipeline 422 permits for $64.5 million issued in the first six months of 2014 1,108 homes
demolished in 2013 (of 30,235 Single Family Homes)
Construction Lending*
|