Attached files
| file | filename |
|---|---|
| 8-K - 8-K - WARREN RESOURCES INC | a2220910z8-k.htm |
| EX-99.5 - EX-99.5 - WARREN RESOURCES INC | a2220910zex-99_5.htm |
| EX-99.3 - EX-99.3 - WARREN RESOURCES INC | a2220910zex-99_3.htm |
| EX-99.1 - EX-99.1 - WARREN RESOURCES INC | a2220910zex-99_1.htm |
| EX-99.2 - EX-99.2 - WARREN RESOURCES INC | a2220910zex-99_2.htm |
Exhibit 99.4
|
|
WarrenR_logo-paths.pnghttp://dev.warrenresources.com/images/shadowbar.pngCONFIDENTIAL http://dev.warrenresources.com/images/shadowbar.png\\lbdata\personal data\BDowell\My Pictures\IMG_0096.JPGInvesting in the Future of Energy $300 Million Senior Unsecured Notes Offering July 24, 2014 |

|
|
WarrenR_logo-paths.pnghttp://dev.warrenresources.com/images/shadowbar.pngCONFIDENTIAL Warren is Acquiring the Marcellus Assets of Citrus Energy Investing in the Future of Energy NASDAQ (WRES) 10 Key Highlights •Entry into a prolific natural gas basin .Acreage located in the part of the basin with top tier economics •Transformative acquisition that doubles Warren’s reserves and triples Warren’s production •Retention of key Citrus personnel provides significant operational expertise •High operating control and 100% HBP •Infrastructure in place •Self-funding development immediately •Committed financing in place •Highly accretive •Attractive purchase metrics: $1.72 / Mcf net proved reserves $3.16 / Mcf net PD reserves $4,299 / Mcf/d net production for June 2014 |

|
|
WarrenR_logo-paths.pnghttp://dev.warrenresources.com/images/shadowbar.pngCONFIDENTIAL Attractive Production Valuation Metrics Citrus Acq. Marcellus Peers Other Peers Warren Note: As of 7/21/14. Marcellus peers include MHR, RRC, GST, RICE, EQT, COG, and REXX. Other peers include GDP, CWEI, REN, CRK, SFY, and PQ. 1.TEV represents total enterprise value. 2.Warren production as of 3/31/14. Citrus production represents average net daily production for June 2014. Investing in the Future of Energy NASDAQ (WRES) 13 |

|
|
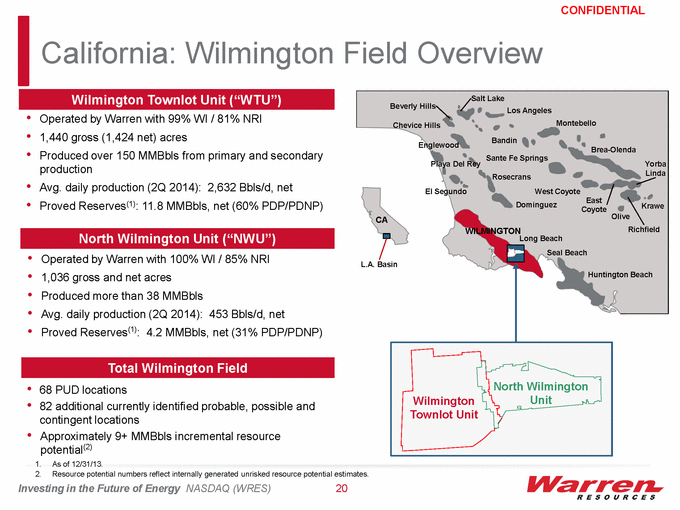
WarrenR_logo-paths.pnghttp://dev.warrenresources.com/images/shadowbar.pngCONFIDENTIAL California: Wilmington Field Overview Investing in the Future of Energy NASDAQ (WRES) 20 Wilmington Townlot Unit (“WTU”) North Wilmington Unit (“NWU”) •Operated by Warren with 99% WI / 81% NRI •1,440 gross (1,424 net) acres •Produced over 150 MMBbls from primary and secondary production •Avg. daily production (2Q 2014): 2,632 Bbls/d, net •Proved Reserves(1): 11.8 MMBbls, net (60% PDP/PDNP) •Operated by Warren with 100% WI / 85% NRI •1,036 gross and net acres •Produced more than 38 MMBbls •Avg. daily production (2Q 2014): 453 Bbls/d, net •Proved Reserves(1): 4.2 MMBbls, net (31% PDP/PDNP) North Wilmington Unit Wilmington Townlot Unit M:\Departments\Energy & Power (CFHOU)\Bankers\Magids, Jeffrey\5-13-2013\Map.jpgM:\Departments\Energy & Power (CFHOU)\Bankers\Magids, Jeffrey\5-13-2013\Red shade.pngHuntington Beach Seal Beach Long Beach Dominguez Rosecrans Chevice Hills Beverly Hills Salt Lake Los Angeles Bandin Sante Fe Springs West Coyote East Coyote Olive Krawe Richfield Yorba Linda Brea-Olenda Montebello CA L.A. Basin El Segundo Playa Del Rey Englewood WILMINGTON •68 PUD locations •82 additional currently identified probable, possible and contingent locations •Approximately 9+ MMBbls incremental resource potential(2) Total Wilmington Field 1.As of 12/31/13. 2.Resource potential numbers reflect internally generated unrisked resource potential estimates. |
|
|
WarrenR_logo-paths.pnghttp://dev.warrenresources.com/images/shadowbar.pngCONFIDENTIAL Marcellus Assets Overview Investing in the Future of Energy NASDAQ (WRES) 29 Asset Summary Map of Operations & Offset Operators •Concentrated acreage position in Wyoming County, PA .Offset operators include Cabot, Southwestern, and Chesapeake •Citrus drilled 7 of the top 25 wells in the Marcellus in 2012 in terms of IP rates •Over 75% of Citrus’ wells IPs have been in the top quartile of all Marcellus wells brought online since 2010 in terms of max 30-day IP rate Marcellus Wells Since 2010 (1) 1. Includes 5,022 Marcellus wells brought online since 2010 with publicly available gas production data between January 2010 and December 2013 per HPDI. |

|
|
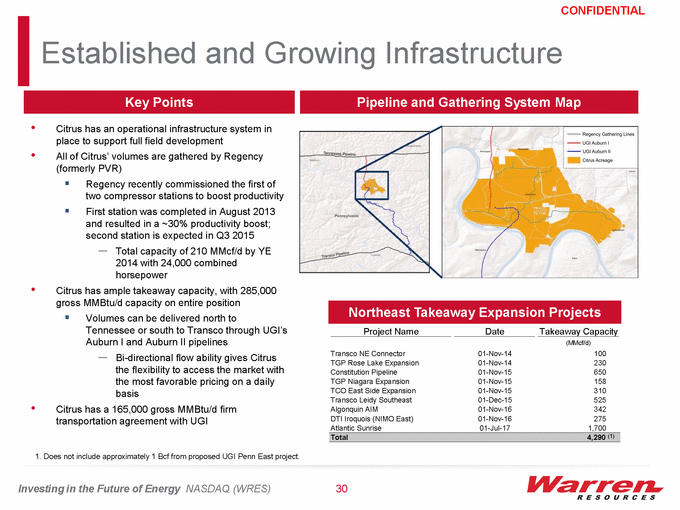
WarrenR_logo-paths.pnghttp://dev.warrenresources.com/images/shadowbar.pngCONFIDENTIAL Established and Growing Infrastructure Investing in the Future of Energy NASDAQ (WRES) 30 •Citrus has an operational infrastructure system in place to support full field development •All of Citrus’ volumes are gathered by Regency (formerly PVR) .Regency recently commissioned the first of two compressor stations to boost productivity .First station was completed in August 2013 and resulted in a ~30% productivity boost; second station is expected in Q3 2015 -Total capacity of 210 MMcf/d by YE 2014 with 24,000 combined horsepower •Citrus has ample takeaway capacity, with 285,000 gross MMBtu/d capacity on entire position .Volumes can be delivered north to Tennessee or south to Transco through UGI’s Auburn I and Auburn II pipelines -Bi-directional flow ability gives Citrus the flexibility to access the market with the most favorable pricing on a daily basis •Citrus has a 165,000 gross MMBtu/d firm transportation agreement with UGI Pipeline and Gathering System Map Key Points Northeast Takeaway Expansion Projects 1. Does not include approximately 1 Bcf from proposed UGI Penn East project. J:\Energy US\HO E&P Active\Citrus - Project Denver - CIT81400\2 Work\9 CorpFin\Management Presentation\Backup\Maps\Citrus Pipeline System.jpgC:\Users\mpeterson\AppData\Local\Microsoft\Windows\Temporary Internet Files\Content.Outlook\X6MO6IZ1\7-Citrus Pipeline System - Legend.jpg |
|
|
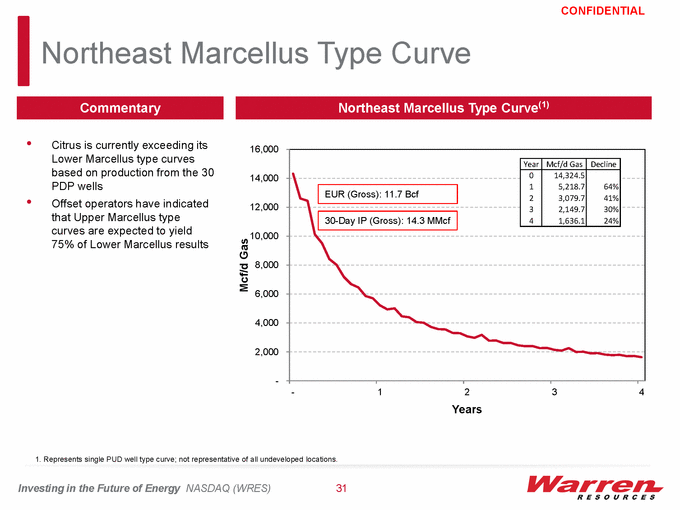
WarrenR_logo-paths.pnghttp://dev.warrenresources.com/images/shadowbar.pngCONFIDENTIAL Northeast Marcellus Type Curve Investing in the Future of Energy NASDAQ (WRES) 31 Northeast Marcellus Type Curve(1) •Citrus is currently exceeding its Lower Marcellus type curves based on production from the 30 PDP wells •Offset operators have indicated that Upper Marcellus type curves are expected to yield 75% of Lower Marcellus results Commentary 1. Represents single PUD well type curve; not representative of all undeveloped locations. |
|
|
WarrenR_logo-paths.pnghttp://dev.warrenresources.com/images/shadowbar.pngCONFIDENTIAL Compelling Upside Potential Investing in the Future of Energy NASDAQ (WRES) 32 Overview Upper Marcellus •Opportunity to significantly increase reserves through targeting of the Upper Marcellus •Cabot Oil & Gas, an offset operator to Citrus, has reported highly encouraging preliminary results from its Upper Marcellus test approximately 10 miles from Citrus’ acreage •Cabot is currently projecting single well EURs of over 11 Bcf for Upper Marcellus locations •Cabot successfully developing on 500’ spacing directly north of Citrus’ acreage •Currently designing a compressor station that is expected to lower the system pressure by 350 psi and allow greater deliverability from the wells |

|
|
WarrenR_logo-paths.pngCONFIDENTIAL Appendix Investing in the Future of Energy NASDAQ (WRES) 40 |

|
|
WarrenR_logo-paths.pnghttp://dev.warrenresources.com/images/shadowbar.pngCONFIDENTIAL Non-GAAP Disclosure •Warren reports its financial results in accordance with accounting principles generally accepted in the United States of America ("GAAP"). However, management believes certain non-GAAP measures provide useful information for investors as the Company utilizes non-GAAP measures internally to evaluate the performance of its operation and many of those same measures are commonly used by industry analysts to evaluate a company's operations as well as for comparison purposes to industry peers. .Adjusted net income, a non-GAAP measure, excludes from the calculation of net income, the impact of unrealized non-cash gains or losses related to the mark to market of hedging contracts as well as other non-recurring items such as severance expense and other extraordinary items. Management views this measure as offering a more accurate picture of our current business operations as unrealized hedging gains and losses are accounting adjustments and have no cash impact on our operations. Additionally, by excluding non-recurring items, adjusted net income enables comparison of the business' ongoing prospects to previous periods. .Discretionary cash flow, a non-GAAP measure, excludes the impact of changes in working capital from the calculation of cash flow from operations. Management views this measure as useful because it is widely accepted by the investment community as a means of measuring a company's ability to fund its capital expenditures, while excluding the fluctuations caused by changes in current assets and liabilities. ."EBITDA" (earnings before interest expenses, income taxes, depreciation and amortization) is a non-GAAP measure and excludes the impact of working capital growth, capital expenditures, debt principal reductions, and other sources and uses of cash from net income. Management views this measure as useful because it indicates the Company's ability to generate cash flow at a level that can sustain its operations and support its capital investment program. EBITDA is a commonly used measure by the Company and industry peers to evaluate and compare operational performance and plan our capital expenditure programs. EBITDA is not a calculation based on GAAP and in measuring our Company's performance should not be considered as an alternative to net income/(loss), the most directly comparable GAAP financial measure. .The PV-10 value represents a non-GAAP measure that differs from the standardized measure of discounted future net cash flows presented in Warren’s Form 10-K, which includes the effect of future income taxes. The standardized measure of discounted future net cash flows represents the present value of future cash flows attributable to our proved oil and natural gas reserves after income tax, discounted at 10%. The PV-10 value represents the present value of future cash flows attributable to our proved oil and gas reserves before income tax, discounted at 10% per annum. We use PV-10 value when assessing the potential return on investment related to our oil and gas properties. Although it is a non-GAAP measure, we believe that the presentation of the PV-10 value is relevant and useful to our investors because it presents the discounted future net cash flows attributable to our proved reserves prior to taking into account future corporate income taxes and our current tax structure Investing in the Future of Energy NASDAQ (WRES) 41 |
|
|
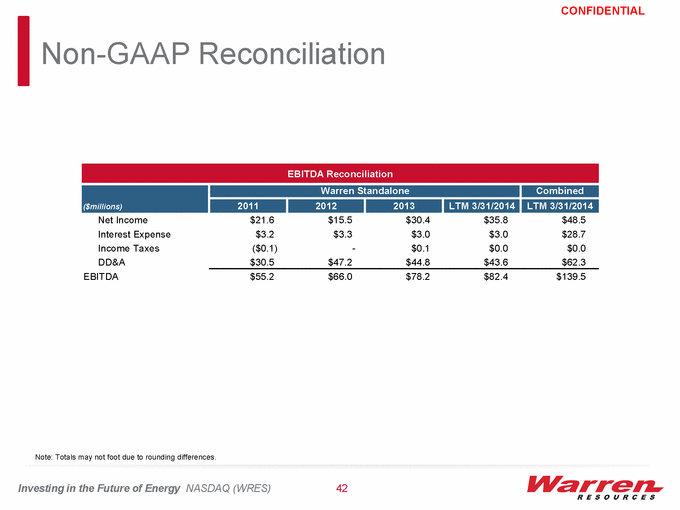
WarrenR_logo-paths.pnghttp://dev.warrenresources.com/images/shadowbar.pngCONFIDENTIAL Investing in the Future of Energy NASDAQ (WRES) 42 Non-GAAP Reconciliation Note: Totals may not foot due to rounding differences. EBITDA Reconciliation Warren Standalone ($millions) 2011 2012 2013 LTM 3/31/2014 Combined LTM 3/31/2014 Net Income Interest Expense Income Taxes DD&A EBITDA $21.6 $15.5 $30.4 $35.8 $48.5 $3.2 $3.3 $3.0 $3.0 $28.7 ($0.1) - $0.1 $0.0 $0.0 $30.5 $47.2 $44.8 $43.6 $62.3 $55.2 $66.0 $78.2 $82.4 $139.5 |
|
|
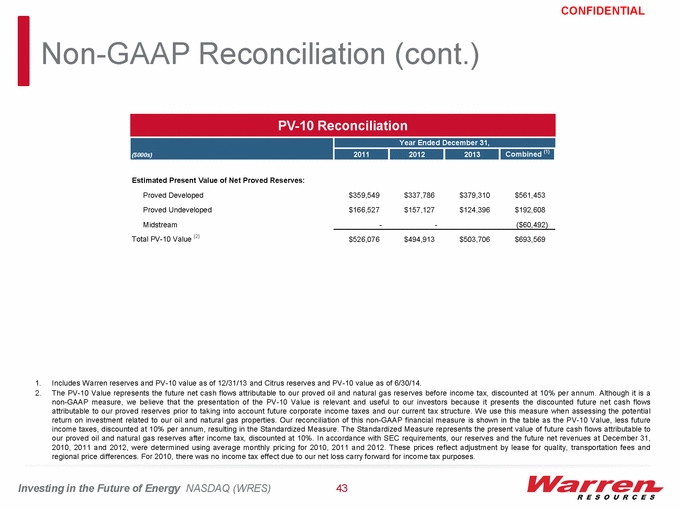
WarrenR_logo-paths.pnghttp://dev.warrenresources.com/images/shadowbar.pngCONFIDENTIAL Non-GAAP Reconciliation (cont.) Investing in the Future of Energy NASDAQ (WRES) 43 PV-10 Reconciliation 1.Includes Warren reserves and PV-10 value as of 12/31/13 and Citrus reserves and PV-10 value as of 6/30/14. 2.The PV-10 Value represents the future net cash flows attributable to our proved oil and natural gas reserves before income tax, discounted at 10% per annum. Although it is a non-GAAP measure, we believe that the presentation of the PV-10 Value is relevant and useful to our investors because it presents the discounted future net cash flows attributable to our proved reserves prior to taking into account future corporate income taxes and our current tax structure. We use this measure when assessing the potential return on investment related to our oil and natural gas properties. Our reconciliation of this non-GAAP financial measure is shown in the table as the PV-10 Value, less future income taxes, discounted at 10% per annum, resulting in the Standardized Measure. The Standardized Measure represents the present value of future cash flows attributable to our proved oil and natural gas reserves after income tax, discounted at 10%. In accordance with SEC requirements, our reserves and the future net revenues at December 31, 2010, 2011 and 2012, were determined using average monthly pricing for 2010, 2011 and 2012. These prices reflect adjustment by lease for quality, transportation fees and regional price differences. For 2010, there was no income tax effect due to our net loss carry forward for income tax purposes. PV-10 Reconciliation Year Ended December 31, ($000s) 2011 2012 2013 Combined (1) Estimated Present Value of Net Proved Reserves: Proved Developed Proved Undeveloped Midstream Total PV-10 Value (2) $359,549 $337,786 $379,310 $561,453 $166,527 $157,127 $124,396 $192,608 - - ($60,492) $526,076 $494,913 $503,706 $693,569 |