Attached files
| file | filename |
|---|---|
| 8-K - FORM 8-K - Aleris Corp | d751121d8k.htm |
 Aleris Investor Presentation
June 2014
Exhibit 99.1 |
 Forward-Looking and Other Information
1
IMPORTANT INFORMATION
FORWARD-LOOKING INFORMATION
NON-GAAP INFORMATION
INDUSTRY INFORMATION
Certain statements in this presentation are “forward-looking statements” within the
meaning of the federal securities laws. Statements about our beliefs and expectations and
statements containing the words “may,” “could,” “would,” “should,” “will,” “believe,” “expect,” “anticipate,” “plan,” “estimate,” “target,”
“project,” “look forward to,” “intend” and similar
expressions intended to connote future events and circumstances constitute forward-looking statements. Forward-looking statements
include statements about, among other things, future costs and prices of commodities, production
volumes, industry trends, demand for our products and services, anticipated cost savings,
anticipated benefits from new products or facilities, and projected results of operations. Forward-looking statements involve known and
unknown risks and uncertainties, which could cause actual results to differ materially from those
contained in or implied by any forward-looking statement. Some of the important factors
that could cause actual results to differ materially from those expressed or implied by forward-looking statements include, but are not limited to, the
following: (1) our ability to successfully implement our business strategy; (2) the cyclical
nature of the aluminum industry, material adverse changes in the aluminum industry or our
end-use segments, such as global and regional supply and demand conditions for aluminum and aluminum products, and changes in our customers’
industries; (3) our ability to fulfill our substantial capital investment requirements; (4)
variability in general economic conditions on a global or regional basis; (5) our ability to
retain the services of certain members of our management; (6) our ability to enter into effective metal, natural gas and other commodity derivatives or
arrangements with customers to manage effectively our exposure to commodity price fluctuations and
changes in the pricing of metals, especially London Metal Exchange-based aluminum prices;
(7) our internal controls over financial reporting and our disclosure controls and procedures may not prevent all possible errors that
could occur; (8) increases in the cost of raw materials and energy; (9) the loss of order volumes from
any of our largest customers; (10) our ability to retain customers, a substantial number of
whom do not have long-term contractual arrangements with us; (11) our ability to generate sufficient cash flows to fund our capital expenditure
requirements and to meet our debt service obligations; (12) competitor pricing activity, competition
of aluminum with alternative materials and the general impact of competition in the industry
segments we serve; (13) risks of investing in and conducting operations on a global basis, including political, social, economic, currency and
regulatory factors; (14) current environmental liabilities and the cost of compliance with and
liabilities under health and safety laws; (15) labor relations (i.e., disruptions, strikes or
work stoppages) and labor costs; (16) our levels of indebtedness and debt service obligations, including changes in our credit ratings, material increases in
our cost of borrowing, or the failure of financial institutions to fulfill their commitments to us
under committed credit facilities; (17) our ability to access the credit and capital markets;
(18) the possibility that we may incur additional indebtedness in the future; and (19) limitations on operating our business as a result of covenant
restrictions under our indebtedness. Investors, potential investors and other readers are urged to
consider these factors carefully in evaluating the forward-looking statements and are
cautioned not to place undue reliance on such forward-looking statements. We undertake no obligation to publicly update or revise any forward-
looking statements, whether in response to new information, futures events or otherwise, except as
otherwise required by law.
The non-GAAP financial measures contained in this presentation (including, without limitation,
EBITDA, Adjusted EBITDA, commercial margin, and variations thereof) are not measures of
financial performance calculated in accordance with U.S. GAAP and should not be considered as alternatives to net income and loss attributable to
Aleris Corporation or any other performance measure derived in accordance with GAAP or as alternatives
to cash flows from operating activities as a measure of our liquidity. Non-GAAP measures
have limitations as analytical tools and should be considered in addition to, not in isolation or as a substitute for, or as superior to, our
measures of financial performance prepared in accordance with GAAP. Management believes that certain
non-GAAP performance measures may provide investors with additional meaningful comparisons
between current results and results in prior periods. Management uses non-GAAP financial measures as performance metrics
and believes these measures provide additional information commonly used by the holders of our senior
debt securities and parties to the ABL Facility with respect to the ongoing performance of our
underlying business activities, as well as our ability to meet our future debt service, capital expenditures and working capital needs.
These adjustments are based on currently available information and certain adjustments that we believe
are reasonable and are presented as an aid in understanding our operating results. They are not
necessarily indicative of future results of operations that may be obtained by the Company.
Information regarding market and industry statistics contained in this presentation is based on
information from third party sources as well as estimates prepared by us using certain
assumptions and our knowledge of these industries. Our estimates, in particular as they relate to our general expectations concerning the aluminum
industry, involve risks and uncertainties and are subject to changes based on various factors,
including those discussed under “Risk Factors” in our filings with the Securities and
Exchange Commission. This information is current only as of its date and may have changed. We undertake no obligation to
update this information in light of new information, future events or otherwise. This
information contains certain financial projections and forecasts and other forward looking information concerning our business, prospects, financial
condition and results of operations, and we are not making any representation or warranty that this
information is accurate or complete. See “Forward-Looking Information” below.
|
 Contents
Aleris Overview
Key Highlights
Financial Overview
2 |
 3
3
Aleris Overview
3 |
 4
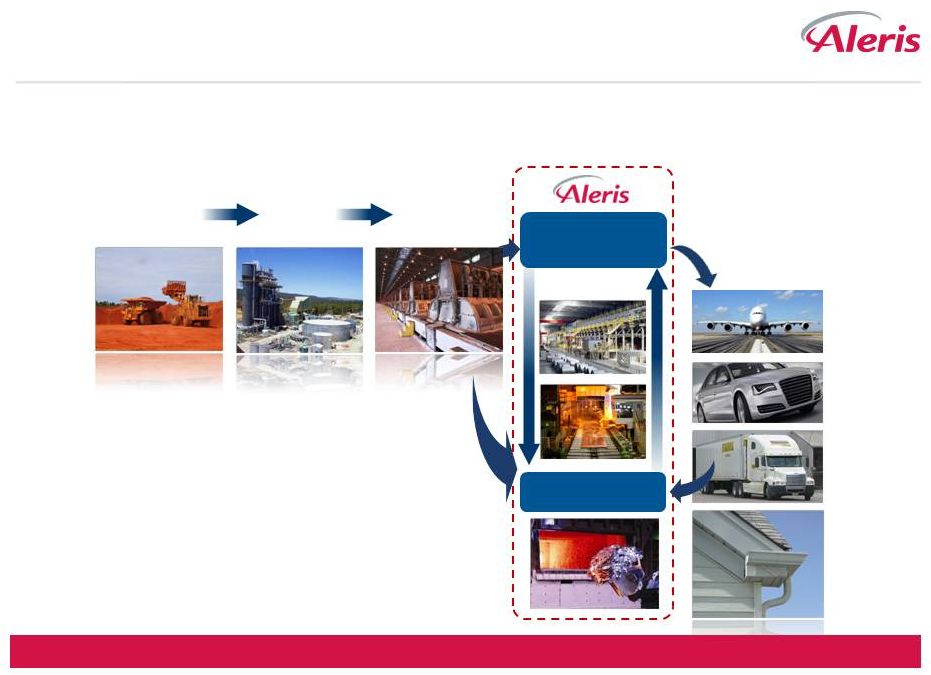
Aleris’
Position in the Aluminum Value Chain
Limited exposure to upstream aluminum volatility and costs
Aleris participates in select
segments of the aluminum
fabricated products industry
4
Bauxite
mining
Alumina
refining
Aluminum
smelting
End use
applications
Recycling
Processing |
 Successful History of Acquisitions
Strategic growth has led to diversity in capabilities and industries served
ALSCO
Ormet
Alumitech
EKCO
Wabash
Alloys
Corus
AE
Inc.
HT
Aluminum
Voerde
Nichols
5
2012
2013
2010
2011
2004
2009
2008
2007
2006
2005
2003
2014
2015
2016
Commonwealth Aluminum
IMCO Recycling Inc.
|
 Leading Global Downstream Aluminum Company
Rolled & Extruded Products
Recycling & Specification Alloys
Business Segments:
RPNA, RPEU, RPAP, Extrusions
Global Market Segments:
-
Aerospace
-
Automotive
-
Heat Exchanger
-
Commercial Plate & Defense
Regional Industries
-
Engineering
-
Building & Construction
-
Distribution
#1 in North America building and construction
Leading player in auto body sheet in Europe
Leading player in aerospace sheet and plate globally
Business Segments:
RSAA, RSEU
Recycling
-
Packaging (can sheet)
-
Transportation
-
General Industrial
-
Deox (steel production)
Specification Alloys:
-
Auto
-
General Industrial
Global leader in merchant aluminum recycling and
supply of specification alloys in U.S. / Europe
LTM March ‘14 Adj. EBITDA: $199m
1
LTM March ‘14 Adj. EBITDA: $68m
1
1
Excludes $36M of corporate overhead
2
Year ended revenue 12/31/2013; includes intercompany revenue
Revenue:
$3.0
billion
2
Revenue:
$1.5
billion
2
RPEU
RPNA
Extrusions
RSEU
RSAA
RPAP
12%
48%
40%
37%
63%
6 |
 Global Platform
North America
Europe
Key Facilities
China
Koblenz
Duffel
Specialized facilities,
high value products
Zhenjiang
Bonn
Lewisport
Uhrichsville
Richmond
Morgantown
Grevenbroich
Ability to deliver molten
aluminum
Stuttgart
Wabash
Davenport
Modern and highly efficient facilities in key countries
7
Low cost production,
maximum use of scrap |
 Light-weight:
approximately 1/3 the weight of steel
Exceptional strength-to-weight
ratio
Corrosion resistant
High electrical and heat
conductivity
Highly recyclable
Consumption rises with
economic development
Leveraging Aluminum’s Value & Sustainability
Uniquely positioned to grow through sustainability
Global Drive to Sustainability
Significant customer demand for
sustainable solutions
Strong shift from Primary
Aluminum to Recycled Scrap
95% more energy efficient vs.
primary aluminum
Leader in Scrap Processing
Leader in merchant supply and
recycling for internal
consumption
Approximately 2 million tons of
scrap processed in 2013
Customer “closed loop”
relationships
Key Attributes of Aluminum
8 |
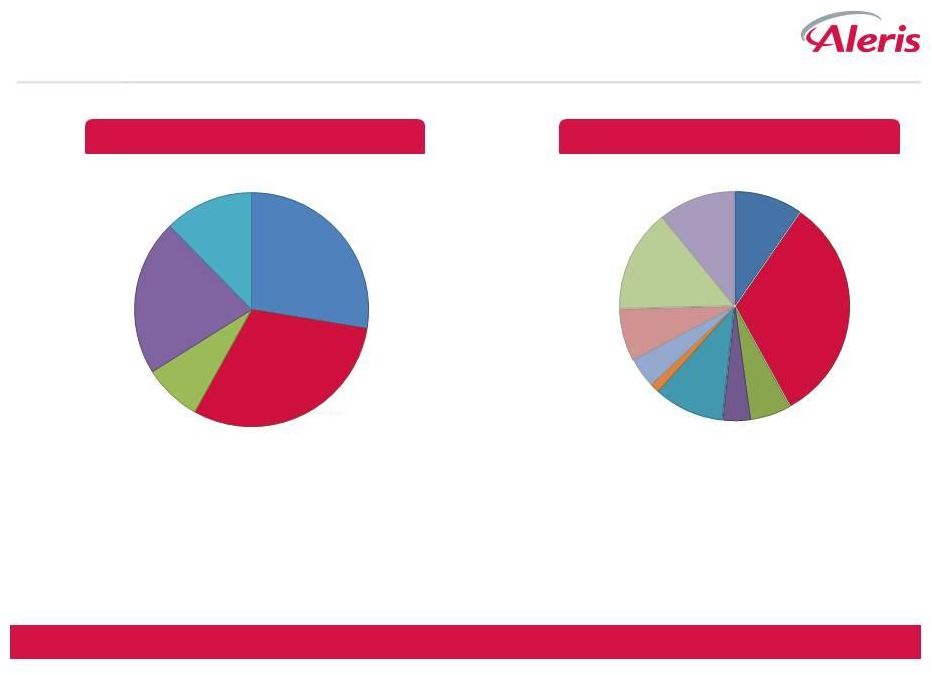 2013 Revenue
1
Serving customers in diverse industries worldwide
1.
2013 information does not include Nichols business as the transaction closed in the second quarter of
2014. 2.
Rolled Products Asia Pacific segment revenue was excluded from this chart as the segment’s
revenue was less than 1% of consolidated revenue for the year ended December 31, 2013.
Other
11%
Aerospace
10%
Automotive
32%
Heat Exchanger
6%
Europe
Building &
Construction
4%
N. America
Building &
Construction
10%
Engineering 1%
Packaging 4%
Transportation 7%
Distribution
15%
Revenue by Reportable Segment
2
Revenue by End Use
RPNA
28%
RPEU
30%
Extrusion
8%
RSAA
22%
RSEU
12%
9 |
 Foundation for Growth in Place*
More than $600M committed to support growth
CHINA
$350M
DUFFEL
$70M
ASHVILLE
$20M
TIANJIN
$10M
RECYCLING
$20M
R&D INSOURCING
$30M
NICHOLS
ACQUISITION
$110M
10
2013
2014
2011
2012
2009
2010
2015
Relocated 28Mn press
from Duffel
Numerous capacity
expansion and
productivity projects
Collaboration with
customers
Proprietary alloys
Wide Coating Line
Benefit from Nichols
acquisition
250kT Hot Mill
35kT Phase 1 Plate Mill
Nadcap certification June
2014
Wide Auto Body Sheet Cold
Mill
Capturing transformational
growth opportunity
1 Hot Mill, 3 Finishing
Plants
Complementary Rolling Mill
asset base; expected
significant synergies
*Represents capital expenditure estimates from 2010 – 2014. |
 11
11
Key Highlights |
 Key
Highlights Strong, experienced management team
Flexible capital structure; adequate liquidity and limited amortization requirements
Significant growth investments underpin future performance
Well-positioned to benefit from economic recovery and growth in aluminum
consumption
12 |
 13
13
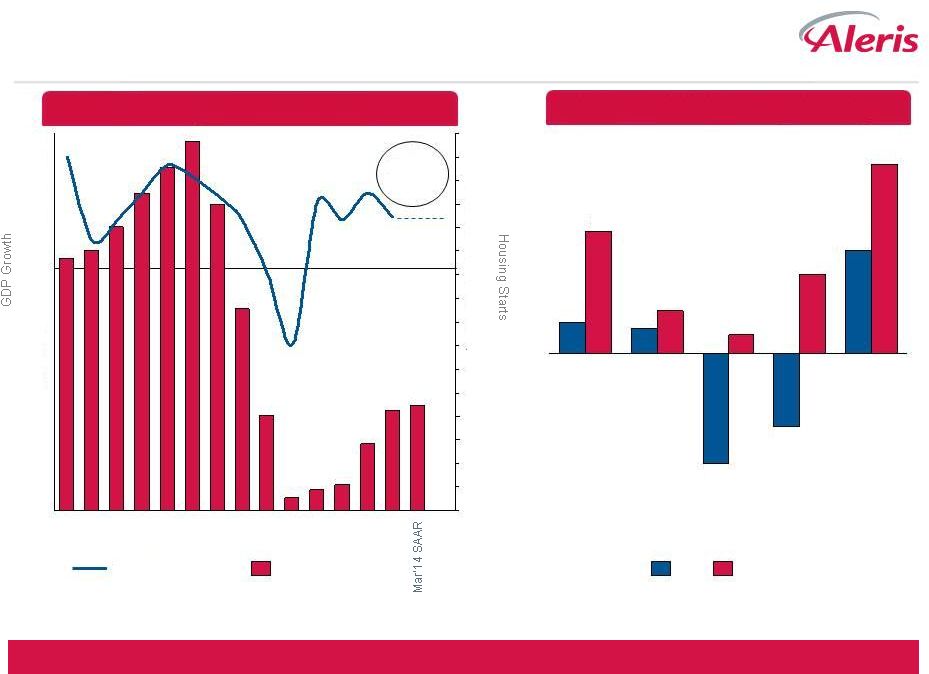
Poised to benefit from recoveries
U.S. Housing and Europe Recovery Gaining Momentum
5.0
4.0
3.0
2.0
1.0
0.0
(1.0)
(2.0)
(3.0)
(4.0)
2005
2000
2010
Housing starts (M)
US GDP Growth %
Germany
Italy
France
UK
Spain
2013
2014F
US Housing Starts & GDP Growth
EU Real GDP Growth by Country
1.7
-1.2
-1.8
0.4
0.5
3.1
1.3
0.3
0.7
2.0
Source: Barclays Economic Research – May 2014 Source:
US census for actuals, GDP actuals - US census, Barclays Economic Research – May 2014
2014 Forecast
1.9%
0.5
0.6
0.7
0.8
0.9
1.0
1.1
1.2
1.3
1.4
1.5
1.6
1.7
1.8
1.9
2.0
2.1 |
 14
14
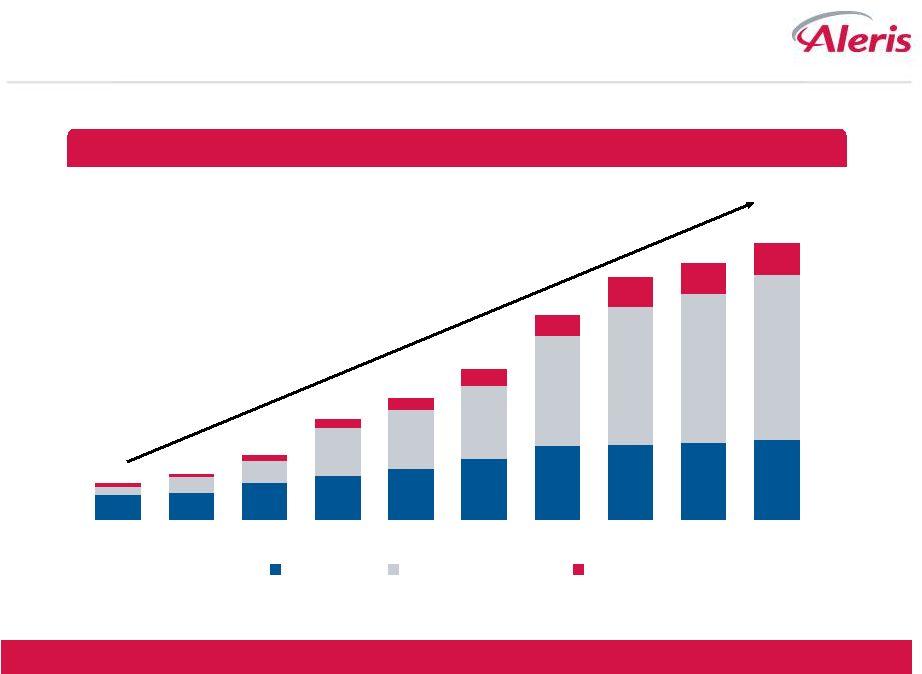
Healthy Global FRP Growth
Transportation sector leading growth; Aleris well-positioned
Transport
B&C
Industrial
CAGR ‘13-’18 (%)
China
North America
1
Western Europe
10.7%
2018
2013
1,855
3,085
5.6
15.3
3.4
5.0%
2018
2013
2,217
1,741
2.1
8.3
1.5
8.9%
2013
2,217
2018
3,392
8.1
10.3
8.9
(kT)
Source: CRU Aluminum Outlook Quarterly Report Feb 2014, Aleris Analysis |
 15
15
192
812
254
Aircraft Backlogs Remain at Record Levels
+16%
11
7,966
10
6,676
09
6,484
08
6,942
07
6,443
06
4,803
05
3,899
04
2,545
YTD 14
10,532
12
8,948
Boeing
Airbus
A380
A350
A330
A320
4256
46
884
388
B747
B787
B777/767
B737
3778
Order backlog expected to support production for 6 to 8 years
13
10,610
Airbus backlog break out per AC
Boeing backlog break out per AC
Order Backlog (# planes)
Source: Airbus & Boeing reports Note: Backlog defined as Net Orders
(Gross Orders – Conversions/Cancellations) minus Deliveries |
 16
16
Aluminum
Auto
Body
Sheet
–
Transformative
Opportunity
Source: IHS & Aleris internal projections
Structural shift underway
12
13
14
15
16
17
18
19
20
21
China
North America
Europe
Projected Global ABS Demand, including non-CALP Qualities (2012-2021)
|
 17
17
Key Growth Initiatives
Execution on track; beginning to realize benefits
Aerospace growth and shift in
demand to Asia
Significant latent optionality
given under utilized Hot Mill
Built to exacting standards for
our Koblenz, Germany Mill
Capturing transformative shift
in automotive
Global customer base
Widest ABS Rolling Mill in
Europe
Well-timed to benefit from
housing recovery
Comparable asset base;
similar technologies
Significant synergy opportunity
NICHOLS
ACQUISITION
$110M
CHINA
$350M
DUFFEL
$70M |
 18
18
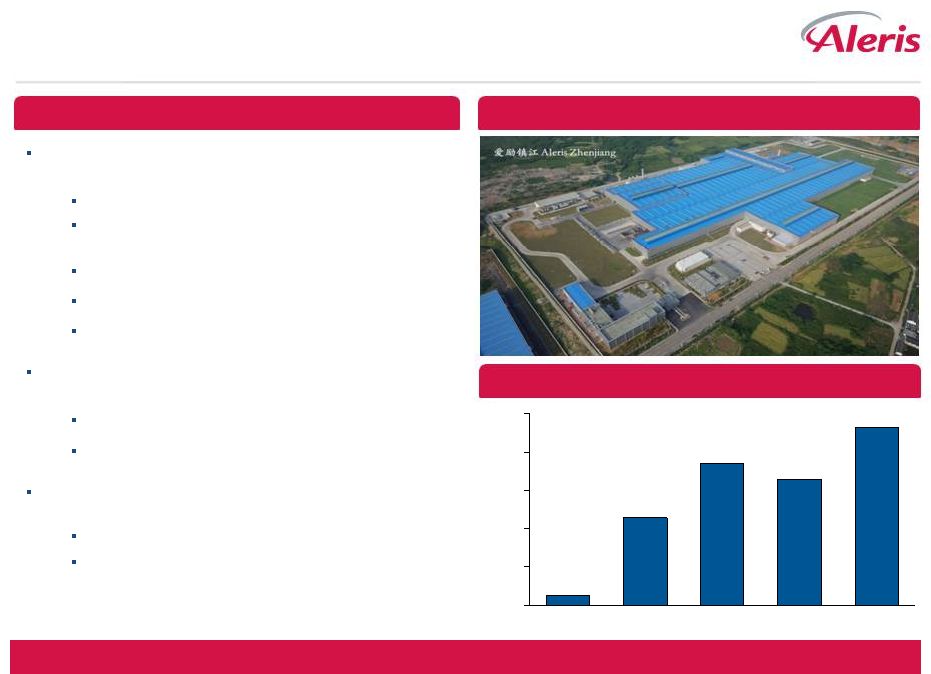
Aleris Zhenjiang –
Summary Overview
World class rolling mill initially targeting value added heat-treat
plate applications, including aerospace
State-of-the-art machinery
Plant engineered to exacting German standards used in
Aleris’
Koblenz, Germany mill
Employee training conducted in Koblenz
Unmatched “know how”
and capability in China
Leverages Aleris reputation in aerospace
Significant growth options with 250kT Hot Mill capacity and
35kT annual Phase 1 plate capacity
Plate expansion
Coil and auto body sheet
Aerospace qualification agreements in place; aerospace
shipments expected 2H14
AS9100 certification achieved in 4Q13
Nadcap certification achieved 2Q14
Laser-focus on Aerospace qualification process
2324
1649
1852
1142
132
0
500
1000
1500
2000
2500
1Q14
4Q13
3Q13
2Q13
1Q13
Overview
Plant
Shipments by Qtr (T) |
 19
19
Aerospace Qualification (Nadcap) Process Complete
First aerospace shipments imminent
Agreements with all 4 major OEMs (Boeing,
COMAC, Bombardier, Airbus) in place
Approval of heat treatment facilities
Accreditation of lab by OEMs underway
Produced AC plate qualification material
ISO 9001 certification
AS 9100 certification (Aerospace certification)
Implemented ultrasonic test device
Achieved Nadcap certification in 2Q14
Develop/confirm process control documents
Pass final OEM audits end 3Q14
Achievements
Next steps / Main priorities
Required to sell to
OEMs |
 20
20
Duffel Automotive –
Solid Foundation for Growth
Wide Automotive Body Sheet (WABS)
1Q14 Automotive volumes increased 43% vs 1Q13
New cold rolling mill
Furnaces
Automation
$70M investment completed |
 21
21
Nichols Acquisition Update
Company Overview
Key North American aluminum sheet
supplier to building & construction
and transportation industries
Four facilities
–
Davenport, IA (2)
–
Lincolnshire, IL
–
Decatur, AL
Approximately 550 employees
2013 shipments of ~300 million lbs
1
2013 fiscal results from Quanex SEC filings.
1 |
 22
22
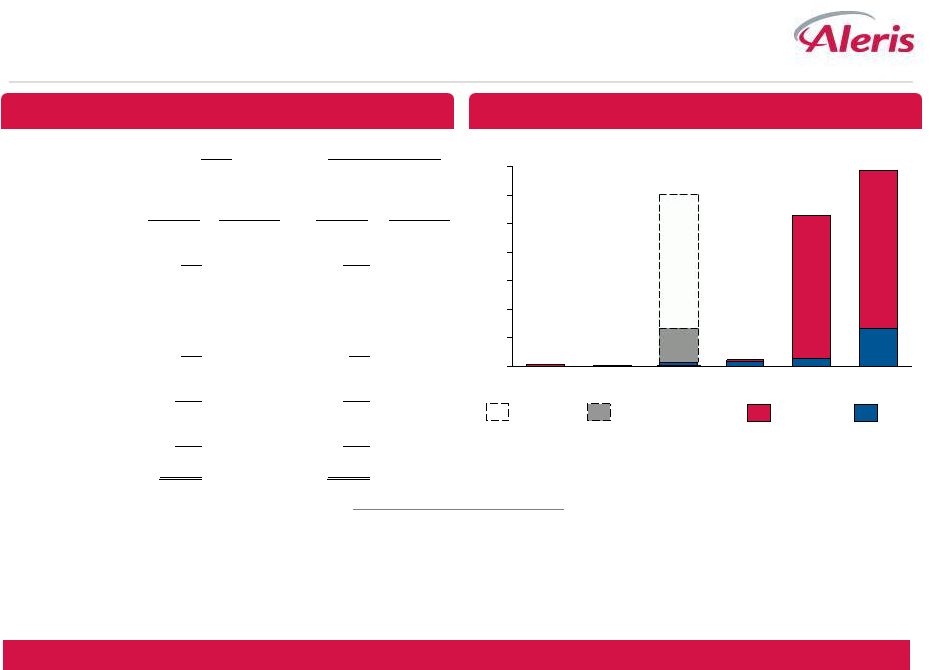
Continuous Cast Profitability Comparison
Synergistic Nichols acquisition expected to generate attractive returns
|
 23
23
Experienced Management Team
Name
Title
Yrs. w/ Company
Previous Experience
Industrial Experience
Roeland Baan
Eric Rychel
Sean Stack
Chairman and CEO
EVP and CEO –
Europe
& Asia Pacific
SVP and CFO
EVP and CEO –
Rolled
Products North America
11
6
2
10
CEO of Noveon
CEO of Mittal Steel Europe
VP and Treasurer of Noveon
31
31
2
23
Steven Demetriou
Chris Clegg
Tom Weidenkopf
EVP, General Counsel and
Secretary
EVP of HR and
Communications
SVP, General Counsel and
Secretary of Noveon
SVP, HR for Honeywell
International
10
5
29
31
1
Includes years with Aleris and/or Commonwealth
John Zhu
Ingrid Joerg
SVP, President of China
3
28
China President for Wartsila
SVP and GM of RPEU
2
17
President, Alcoa FRP Europe &
Brazil
Managing Director, Barclays &
Deutsche Bank
Aleris formed in 2004 through combination of IMCO Recycling and Commonwealth Industries
Proven acquirer; successfully integrated 13 acquisitions since 2004 including Corus Aluminum
1
Successfully restructured during downturn – lowered costs and repositioned business (2008 –
2009) |
 24
24
Financial Overview |
 25
25
Key
Performance
Metrics
–
Total
Aleris
Volume (kT
1
)
EBITDA ($M)
1
Excludes Brazil &Voerde
Business and Earnings Drivers
Key Areas of Impact on Drivers
1963
1936
1925
2006
0
500
1,000
1,500
2,000
2,500
1Q14 LTM
2013
2011
2012
236
231
294
332
0
50
100
150
200
250
300
350
0
50
100
150
200
2011
1Q14 LTM
2013
2012
EBITDA
EBITDA $/ton
Economic recovery, growth initiatives, share gains
Quality and service, supply and demand
Growth in value-added Aero, ABS and recovery in B&C
LME, scrap availability and processing capabilities
Productivity focus, volume leverage from recovery & initiatives
Volume
Rolling margin / conversion price
Mix
Scrap and metal spreads
Cash conversion costs |
 26
26
Capital Expenditures
Capital Expenditures Summary
Capital expenditures returning to normalized levels
92
112
103
100
36
113
278
135
65
12
$48
1Q14
2014E
$165
2012
$390
2011
$205
2013
$238
Maintenance
Growth |
 27
27
Capital Structure and Amortization Schedule
$700
600
100
0
400
500
200
300
Thereafter
685
2018
529
2017
19
2016
611
2015
2
2014
8
China
Recourse
Revolver Funded
Revolver
Capital Structure Highlights
•
No near term amortization requirements
•
No maintenance or performance covenants unless liquidity drops substantially
•
Unsecured, except for working capital assets
1Q14 Debt Maturity Profile
1
Summary Capitalization Table
Actual
Pro Forma for Nichols¹
Net Debt -
Net Debt -
Mult of 1Q14
Mult of 1Q14
3/31/2014
LTM EBTIDA
3/31/2014
LTM EBTIDA
Cash
$51.3
$51.3
Revolver
10.0
120.0
Total Secured Debt
10.0
120.0
Senior Notes due 2018
500.0
500.0
Senior Notes due 2020
500.0
500.0
Exchangeable Notes
44.8
44.8
Other Debt
16.0
4.4 x
16.0
4.8 x
Total Recourse Debt
1,070.8
1,180.8
China Debt
191.8
5.2 x
191.8
5.6 x
Total Debt
1,262.6
1,372.6
Total Shareholders' Equity
361.3
361.3
Total Capitalization
$1,623.9
$1,733.9
1
Includes $110M for Nichols acquisition and estimated $6M for Nichols LTM EBITDA
added to Total Aleris EBITDA. Near term amortization requirements
limited |
 28
28
First Quarter Performance Overview
Sequential Adjusted EBITDA improvement affirms recovering fundamentals
1Q14 Adjusted EBITDA of $59 million
Significantly higher automotive volumes
Global aerospace volumes impacted by customer destocking
North American rolled products volumes down due to MWP volatility
Weather affected volume, scrap availability and natural gas costs in NA
Improvement in Specification Alloy metal spreads |
 29
29
1Q14 Volume Recap & Highlights
Volume Change vs. 1Q13
Volume Drivers
1
Excludes
2013
shipments
of
semi-finished
product
to
Zhenjiang,
China
and
from
Voerde
cast
house;
including these shipments volume was (4%).
2
Excludes impact of idling production at Saginaw, Michigan facility; including this
impact volume was (5%). RPNA
(9%)
Distribution
(11%)
-
High and volatile Midwest Premium, weather
Transportation
3%
-
Steady trailer builds
B&C
(18%)
-
Harsh winter weather; MWP volatility
RPEU / Global Market Segments
1
5%
Aerospace
(7%)
-
Customer inventory overhang
Automotive
43%
-
Premium auto builds; Aluminum penetration
Heat Exchanger
11%
-
Share gain; rebound from cycle lows
Plate & Sheet
(3%)
-
Overcapacity in plate market
Extrusions
10%
-
Improved Automotive demand; EU rebound
RSAA
2
1%
Spec / Automotive
2
5%
-
NA Auto builds
Recycling
(4%)
-
Winter weather; scrap availability
RSEU
1%
Spec / Automotive
17%
-
Improved Automotive demand
Recycling
(29%)
-
Scrap availability; furnace redeployment |
 30
30
Scrap Environment Update
NA Spec Alloy Metal Spreads
RPNA Scrap Spreads
Current scrap flows recovering from winter disruptions
More dramatic winter impact in 1Q14
Decreased scrap exports
Scrap processing equip increasing flexibility
Low LME limiting scrap spreads
Increased competition for scrap
Regional premium very volatile
Mar
12
Mar
13
Mar
14
Spread Indexed to 9 Yr Avg
9 Yr Avg Spread
Winter
impact
Winter
impact
$0.70
$0.90
$1.10
$0.80
$1.00
$0.15
$0.25
$0.20
$0.30
$0.10
Mar
14
Mar
13
Mar
12
MLC Diff. to P1020
P1020 (right axis)
Ptd. Siding Diff. to P1020
0.6
0.7
0.8
0.9
1.0
1.1
1.2 |
 31
31
Adjusted EBITDA Bridge
($M)
2
1Q14 vs. 1Q13 |
 Key
Highlights Strong, experienced management team
Flexible capital structure; adequate liquidity and limited amortization requirements
Significant growth investments underpin future performance
Well-positioned to benefit from economic recovery and growth in aluminum
consumption
32 |
 33
33
Appendix |
 34
34
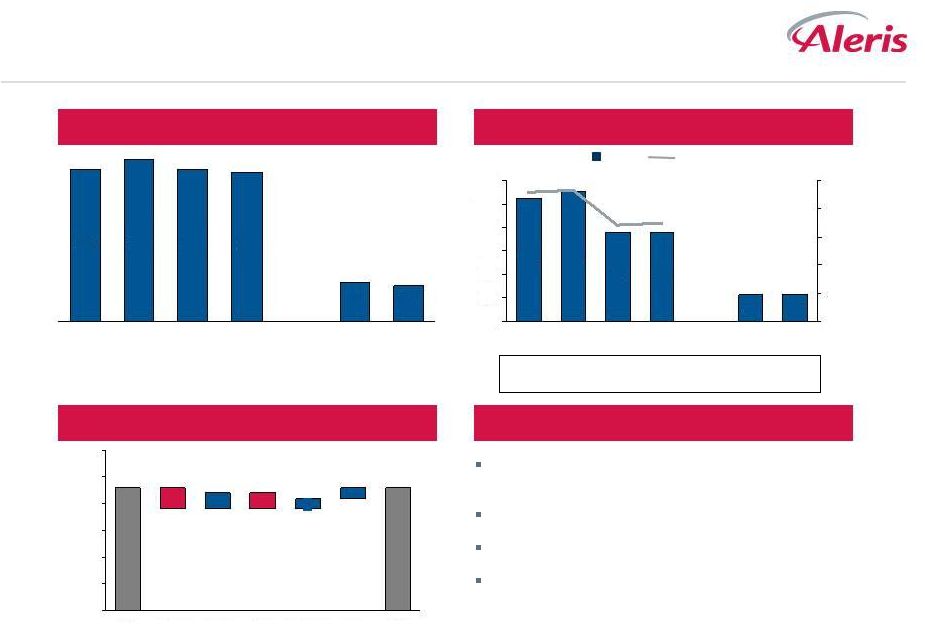
RPNA
Volume (kT)
Adjusted EBITDA
1Q14 Performance
1Q Adjusted EBITDA Bridge ($M)
2011
1Q14
1Q13
LTM
2013
2012
23
2
2
3
3
4
23
1Q14
1Q13
LTM
2013
2012
2011
Adj. EBITDA / ton
283
281 205 209 246
269
Adjusted EBITDA ($M)
EBITDA as % of Commercial Margin
Lower volumes due to weather and Midwest Premium
volatility
Tighter scrap spreads and availability
MWP impact on lower priced inventory
Productivity partly offset inflation
1Q14
Other
Productivity
Inflation
Margin /
Scrap
Spreads
Volume /
Mix
1Q13
371
396
364
86
95
372
105
111
76
23
23
76
0%
5%
10%
15%
20%
25%
0
20
40
60
80
100
120
30
20
10
5
15
0
25 |
 35
35
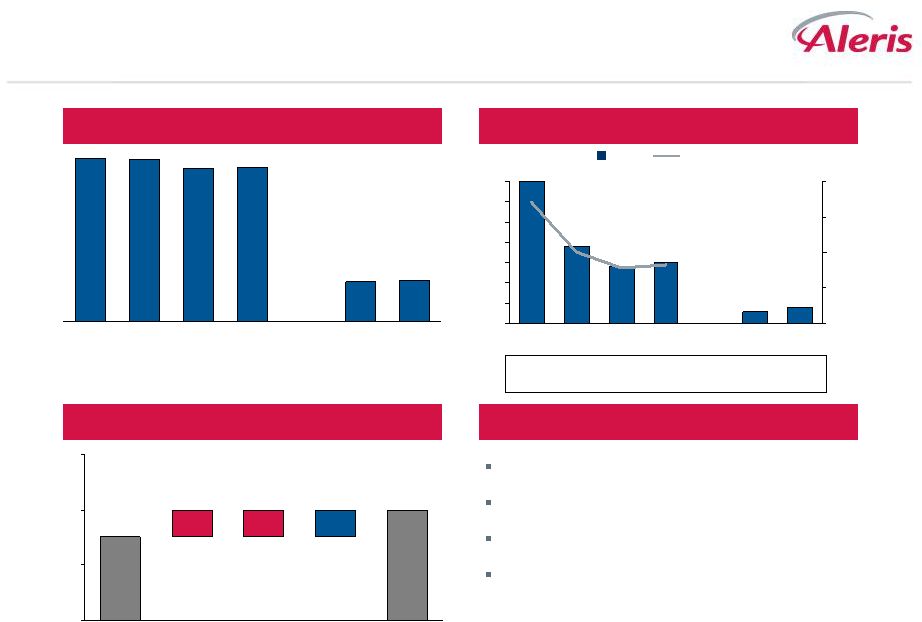
RPEU
Volume (kT)
Adjusted EBITDA
1Q14 Performance
1Q Adjusted EBITDA Bridge ($M)
314
299
342
87
90
345
1Q14
1Q13
LTM
2013
2012
2011
20
25
30
35
40
3
Price
2
Volume/Mix
1
1Q13
34
30
1Q14
Currency
3
Productivity
Margin/Scrap Inflation
spreads
2
3
152
112
30
34
137
115
0
50
100
150
200
10%
15%
20%
25%
30%
1Q14
1Q13
2013
LTM
2012
2011
Adj. EBITDA / ton
482
457 334 327 374
349
Adjusted EBITDA ($M)
EBITDA as % of Commercial Margin
Strong volume growth in Automotive
Aerospace impacted by customer destocking
Recovering regional plate and sheet pricing
Higher costs for aluminum slabs
Weaker U.S. Dollar impacted margins & AR |
 36
36
Extrusions
Volume (kT)
Adjusted EBITDA
1Q14 Performance
1Q Adjusted EBITDA Bridge ($M)
0
2
4
1Q14
3
Productivity
1
Inflation
Volume/Mix
1Q13
2
8
14
11
3
2
11
0
2
4
6
8
10
12
14
0%
2%
4%
6%
8%
10%
LTM
2013
2012
2011
1Q13
1Q14
Adj. EBITDA / ton
104
202 159 158
137 134 Adjusted EBITDA ($M)
EBITDA as % of Commercial Margin
Volume growth in automotive projects
Productivity offset inflation
Continuing to gain momentum; well positioned for
recovery
76
68
71
19
17
69
LTM
2013
2012
2011
1Q14
1Q13
1
1 |
 37
37
RSAA
Volume (kT)
Adjusted EBITDA
1Q14 Performance
1Q Adjusted EBITDA Bridge ($M)
895
868
847
206
217
857
1Q14
LTM
2013
2012
2011
1Q13
6
8
10
12
1Q14
9
Inflation
3
Margin/Scrap
spreads
3
1Q13
10
LTM
2012
2011
1Q14
1Q13
2013
Adj. EBITDA / ton
90
62 63 62
48 43
Adjusted EBITDA ($M)
EBITDA as % of Commercial Margin
Continued improvement in YoY metal spreads
Higher automotive volumes
Harsh winter weather had significant impact on natural
gas costs, scrap availability, operations and caused
numerous lost shipping days
1
Volume /
Mix
100
25%
60
40
20
80
0
20%
0%
15%
10%
5%
81
54
54
52
10
9 |
 38
38
RSEU
Volume (kT)
Adjusted EBITDA
1Q14 Performance
1Q Adjusted EBITDA Bridge ($M)
387
385
365
96
95
364
LTM
2013
2012
2011
1Q14
1Q13
0
2
4
6
1Q14
4
Productivity
1
Inflation
1
Margin/Scrap
spreads
1
1Q13
3
35
15
4
3
19
14
0
5
10
15
20
25
30
35
0%
5%
10%
15%
20%
LTM
2013
2012
2011
1Q13
1Q14
Adj. EBITDA / ton
91
50 39 42
34 45
Adjusted EBITDA ($M)
EBITDA as % of Commercial Margin
Slightly higher volumes
Redeployed furnace to support customer demand
Continued improvement in metal spreads
Productivity offset inflation |
 39
39
Limited Commodity Exposure
Robust risk management processes
Balances credit lines and reduces
liquidity risk
Risk
Mitigation
Expected Impact
Match physical purchases
Eliminate LT fixed price sales
Forward purchase LME
LME volatility
Business model
Pass thru pricing
Tolling
Pass thru pricing-tolling
Forward buy / hedge
Revenue and margin % volatility
Minimal earnings impact
No hedge accounting treatment
Locks in rolling margin
Reduce multi-year dated derivatives
Maintains toll margin
Fixes costs
Reduces FIFO “metal lag”
volatility
Balances hedge book and counter
party exposures
Active position management
Counterparty Management
Forward price sales
Energy
Inventory exposure
Sell open inventory forward |
 40
40
2011 –
1Q14 LTM Adjusted EBITDA Reconciliation
LTM
1Q 2014
2013
2012
2011
Adjusted EBITDA
230.9
$
236.2
$
293.6
$
331.6
$
Reorganization items, net
-
-
-
1.3
Unrealized gains on derivative financial instruments
(18.9)
0.7
14.3
(37.8)
Impact of recording assets at fair value through fresh-start and purchase accounting
0.1
0.1
0.9
(3.4)
Restructuring gains (charges)
(10.3)
(10.7)
(9.6)
(4.4)
Unallocated currency exchange (losses) gains on debt
(2.4)
(2.9)
0.8
(0.7)
Stock-based compensation expense
(12.8)
(14.3)
(11.4)
(10.1)
Start-up expenses
(32.8)
(35.8)
(27.4)
(10.2)
Favorable metal price lag
16.6
23.0
16.0
18.9
Other
(11.7)
(8.6)
(7.1)
(11.2)
EBITDA
158.7
187.7
270.1
274.0
Loss (income from discontinued operations)
-
-
-
-
Interest expense, net
(103.2)
(97.9)
(52.4)
(46.3)
Benefit from (provision for) income taxes
4.6
2.6
(25.4)
4.2
Depreciation and amortization
(135.5)
(129.5)
(84.8)
(70.3)
Net (loss) income attributable to Aleris Corporation
(65.6)
(37.1)
107.5
161.6
Net income (loss) attributable to noncontrolling interest
0.9
1.0
(0.5)
(0.4)
Net (loss) income
(64.7)
$
(36.1)
$
107.0
$
161.2
$
For the years ended
December 31, |
  41
41
1Q 2014 Adjusted EBITDA Reconciliation
March 31, 2014
March 31, 2013
Adjusted EBITDA
59.2
$
64.5
$
Unrealized (losses) gains on derivative financial
instruments (9.3)
10.3
Restructuring charges
(0.5)
(0.9)
Unallocated currency exchange
losses on debt -
(0.5)
Stock-based compensation
expense (4.2)
(2.7)
Start-up expenses
(8.4)
(11.4)
Favorable metal price lag
12.0
5.6
Other
(2.6)
0.5
EBITDA
46.2
65.4
Interest expense, net
(26.3)
(21.0)
Provision for income taxes
(4.3)
(6.3)
Depreciation and
amortization (33.2)
(27.2)
Net (loss) income attributable to Aleris
Corporation (17.6)
10.9
Net income attributable to
noncontrolling interest 0.3
0.4
Net (loss) income
(17.3)
11.3
Depreciation and amortization
33.2
27.2
Provision for deferred income
taxes 0.5
1.0
Stock-based
compensation expense 4.2
2.7
Unrealized losses (gains)
on derivative financial instruments 9.3
(10.3)
Currency exchange losses on debt
0.3
0.4
Amortization of debt
issuance costs 2.0
1.9
Other
1.1
(2.1)
Change in operating assets and
liabilities: Change in accounts receivable
(83.5)
(105.5)
Change in inventories
(11.1)
(14.1)
Change in other assets
2.3
(12.0)
Change in accounts payable
90.3
52.2
Change in accrued liabilities
(3.5)
(8.3)
Net cash provided by operating
activities 27.8
$
(55.6)
$
For the three months ended
(in millions) |
 42
42
1Q14 & 1Q13 Adjusted EBITDA Reconciliation by Segment
March 31, 2014
March 31, 2013
RPNA
Segment income
26.9
$
23.5
$
Favorable metal price
lag (3.7)
(0.1)
Segment
Adjusted EBITDA (1) 23.2
$
23.4
$
RPEU
Segment income
38.1
$
38.5
$
Impact of recording amounts
at fair value through fresh-start and purchase accounting -
-
Favorable metal price lag
(7.9)
(4.8)
Segment
Adjusted EBITDA (1) 30.3
$
33.6
$
RPAP
Segment loss
-
$
(0.3)
$
Segment Adjusted EBITDA
(2) -
(0.3)
Extrusions
Segment income
3.0
$
3.0
$
Favorable metal
price lag (0.5)
(0.6)
Segment
Adjusted EBITDA (1) 2.6
$
2.4
$
RSAA
Segment income
9.0
$
10.4
$
Segment Adjusted EBITDA
(2) 9.0
10.4
RSEU
Segment income
4.3
$
3.3
$
Segment
Adjusted EBITDA (2) 4.3
3.3
(1)
Amounts may not foot as they represent the calculated totals based on actual amounts and not the rounded amounts presented in this table.
(2) There was no difference between segment income and segment Adjusted EBITDA for this
segment. For the three months ended |
 43
43
2011 –
1Q14 LTM Adjusted EBITDA Reconciliation by Segment
LTM
March 31, 2014
2013
2012
2011
RPNA
Segment income
85.2
$
81.8
$
117.6
$
111.1
$
Impact of recording amounts at fair value through fresh-start and purchase
accounting -
-
-
-
Favorable metal price lag
(9.2)
(5.6)
(6.4)
(6.2)
Segment Adjusted EBITDA (1)
76.0
$
76.2
$
111.1
$
104.9
$
RPEU
Segment income
131.7
$
132.1
$
144.6
$
157.6
$
Impact of recording amounts at fair value through fresh-start and purchase
accounting (0.1)
(0.1)
(0.8)
3.8
Favorable metal price lag
(19.7)
(16.6)
(7.1)
(9.9)
Segment Adjusted EBITDA
112.0
$
115.3
$
136.7
$
151.5
$
Extrusions
Segment (loss) income
11.7
$
11.7
$
16.4
$
10.9
$
Impact of recording amounts at fair value through fresh-start and purchase
accounting -
-
(0.1)
(0.3)
Unfavorable (favorable) metal price lag
(0.6)
(0.7)
(2.6)
(2.7)
Segment Adjusted EBITDA (1)
11.2
$
11.0
$
13.8
$
7.9
$
RSAA
Segment income
52.6
$
54.0
$
53.6
$
80.9
$
Impact of recording amounts at fair value through fresh-start and purchase
accounting -
-
-
-
Segment Adjusted EBITDA
52.6
$
54.0
$
53.6
$
80.9
$
RSEU
Segment income
15.3
$
14.3
$
19.4
$
35.3
$
Impact of recording amounts at fair value through fresh-start and purchase
accounting -
-
-
-
Segment Adjusted EBITDA
15.3
$
14.3
$
19.4
$
35.3
$
(1) Amounts
may
not
foot
as
they
represent
the
calculated
totals
based
on
actual
amounts
and
not
the
rounded
amounts
presented
in
this
table.
(in millions)
For the years ended December 31, |