Attached files
| file | filename |
|---|---|
| 8-K - FORM 8-K - RCS Capital Corp | v381942_8k.htm |

American Realty Capital 1 June 2014 Investor Presentation
2 2 Certain statements made in this presentation are forward - looking statements . Those statements include statements regarding the intent, belief or current expectations of RCS Capital Corporation (“RCAP” or the “Company”) and members of its management team, as well as the assumptions on which such statements are based, and generally are identified by the use of words such as “may,” “will,” “seeks,” “anticipates,” “believes,” “estimates,” “expects,” “plans,” “intends,” “should” or similar expressions . Actual results may differ materially from those contemplated by such forward - looking statements . Further, forward - looking statements speak only as of the date they are made, and we undertake no obligation to update or revise forward - looking statements to reflect changed assumptions, the occurrence of unanticipated events or changes to future operating results over time, unless required by law . The following are some of the possible risks and uncertainties, although not all risks and uncertainties, that could cause our actual results to differ materially from those presented in our forward - looking statements : our ability to complete the pending acquisitions on the anticipated terms, in the anticipated timeframes or at all, due to the failure of any required closing condition to be met, the exercise by one of the parties of its right to terminate one of the relevant agreements, an adverse judgment in any stockholder litigation challenging any of the pending acquisitions or any other reason ; our ability to integrate the acquired businesses into our existing businesses ; whether and when we will be able to realize the anticipated benefits from the recent and pending acquisitions ; significant dilution could result from future issuances of our Class A common stock ; future sales of our Class A common stock could lower the market price of our Class A common stock ; adverse developments in the direct investment program industry ; deterioration in the business environment in the specific sectors of the economy in which we focus or a decline in the market for securities of companies within these sectors ; substantial fluctuations in our financial results ; our ability to retain our senior professionals and key management personnel of the acquired businesses ; pricing and other competitive pressures ; changes in laws and regulations and industry practices that adversely affect our business ; incurrence of losses in the future ; competition from larger firms ; larger and more frequent capital commitments by Realty Capital Securities ; limitations on our access to capital ; malfunctioning or failure in our operations and infrastructure ; and failure to achieve and maintain effective internal controls Forward - Looking Statements

3 2 This presentation includes estimates of 2014 operating results . These estimates were not prepared in accordance with published guidelines of the SEC or the guidelines established by the American Institute of Certified Public Accountants for preparation and presentation of financial projections . This information is not fact and should not be relied upon as being necessarily indicative of future results, The estimates were prepared in good faith by management and are based on numerous assumptions that may prove to be wrong . Important factors that may affect actual results and cause the projections to not be achieved include, but are not limited to, risks and uncertainties relating to the company and other factors described under “Risk Factors” section of the Company’s Annual Report on Form 10 - K . and “Forward - Looking Statements . ” The estimates also reflect assumptions as to certain business decisions that are subject to change . As a result, actual results may differ materially from those contained in the estimates . Accordingly, there can be no assurance that the estimates will be realized . This presentation also contains estimates and information concerning our industry, including market position, market size, and growth rates of the markets in which we participate, that are based on industry publications and reports . This information involves a number of assumptions and limitations, and you are cautioned not to give undue weight to these estimates . We have not independently verified the accuracy or completeness of the data contained in these industry publications and reports . The industry in which we operate is subject to a high degree of uncertainty and risk due to variety of factors, including those described in the “Risk Factors” section of the Company’s Annual Report on Form 10 - K . These and other factors could cause results to differ materially from those expressed in these publications and reports . Disclaimer

Leading Integrated Financial Services Company Focused on Retail Investors Diversified and Recurring Revenue Streams Strong Sector Fundamentals and Strategic Opportunities Drive Growth Potential Solid Financial Profile Supports Growth Strategy Highly Experienced and Cohesive Management Team A leading integrated financial services company focused on mass affluent retail investors and alternative investment programs 4 Investment Highlights – “Redefining Retail Investing” Note: Investment highlights reflect RCS pro forma for Pending Acquisitions..
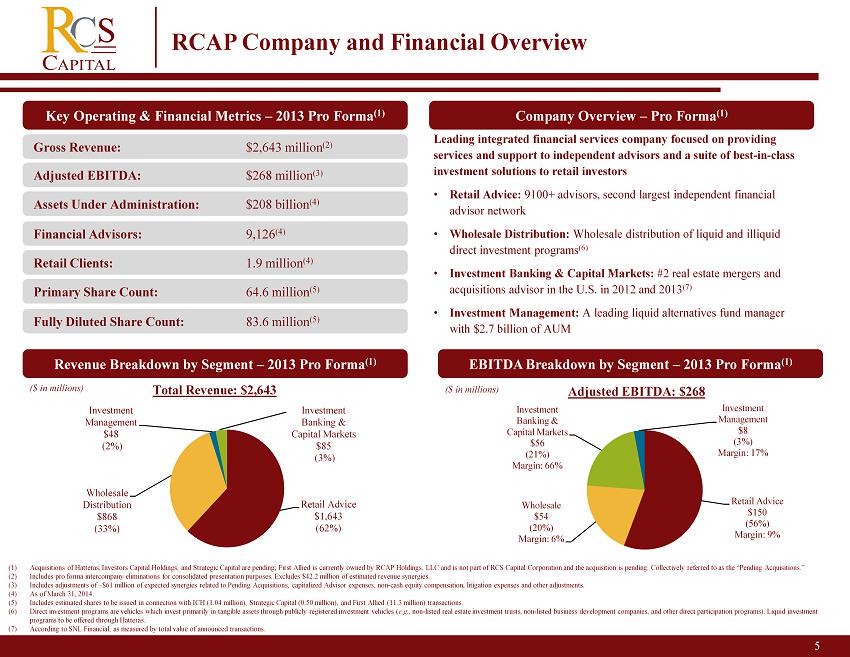
5 RCAP Company and Financial Overview (1) Acquisitions of Hatteras, Investors Capital Holdings, and Strategic Capital are pending; First Allied is currently owned by R CAP Holdings, LLC and is not part of RCS Capital Corporation and the acquisition is pending. Collectively referred to as the “Pending Acquisitions.” (2) Includes pro forma intercompany eliminations for consolidated presentation purposes. Excludes $42.2 million of estimated revenue syner gie s. (3) Includes adjustments of ~$61 million of expected synergies related to Pending Acquisitions, capitalized Advisor expenses, non - cash equity compensation, litigation expenses and o ther adjustments. (4) As of March 31, 2014 . (5) Includes estimated shares to be issued in connection with ICH (1.04 million), Strategic Capital (0.50 million), and First All ied (11.3 million) transactions. (6) Direct investment programs are vehicles which invest primarily in tangible assets through publicly registered investment vehi cle s ( e.g., non - listed real estate investment trusts, non - listed business development companies, and other direct participation programs). Liquid investment programs to be offered through Hatteras. (7) According to SNL Financial, as measured by total value of announced transactions . Key Operating & Financial Metrics – 2013 Pro Forma (1 ) Retail Advice $1,643 (62%) Wholesale Distribution $868 (33%) Investment Management $48 (2%) Investment Banking & Capital Markets $85 (3%) Revenue Breakdown by Segment – 2013 Pro Forma (1 ) ($ in millions) Total Revenue: $2,643 Gross Revenue: $2,643 million (2 ) Adjusted EBITDA: $268 million (3 ) Assets Under Administration: $208 billion (4 ) Financial Advisors: 9,126 (4 ) Retail Clients: 1.9 million (4 ) Company Overview – Pro Forma (1 ) Leading integrated financial services company focused on providing services and support to independent advisors and a suite of best - in - class investment solutions to retail investors • Retail Advice: 9100+ advisors, second largest independent financial advisor network • Wholesale Distribution: Wholesale distribution of liquid and illiquid direct investment programs (6) • Investment Banking & Capital Markets: #2 real estate mergers and acquisitions advisor in the U.S. in 2012 and 2013 (7) • Investment Management: A leading liquid alternatives fund manager with $2.7 billion of AUM Primary Share Count: 64.6 million (5 ) Fully Diluted Share Count: 83.6 million (5 ) EBITDA Breakdown by Segment – 2013 Pro Forma (1 ) ($ in millions) Adjusted EBITDA: $268 62% Retail Advice $150 (56%) Margin: 9% Wholesale $54 (20%) Margin: 6% Investment Banking & Capital Markets $56 (21%) Margin: 66% Investment Management $8 (3%) Margin: 17%
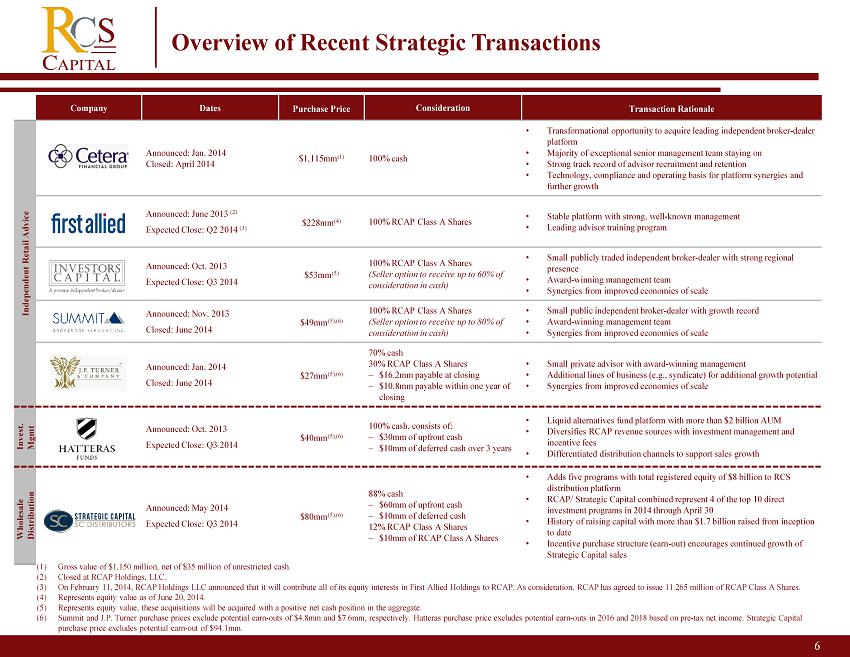
6 Overview of Recent Strategic Transactions 2 Company Dates Purchase Price Consideration Transaction Rationale Independent Retail Advice Announced: Jan. 2014 Closed: April 2014 $1,115mm (1) 100% cash • Transformational opportunity to acquire leading independent broker - dealer platform • Majority of exceptional senior management team staying on • Strong track record of advisor recruitment and retention • Technology, compliance and operating basis for platform synergies and further growth Announced: June 2013 (2) Expected Close: Q2 2014 (3) $228mm (4) 100% RCAP Class A Shares • Stable platform with strong, well - known management • Leading advisor training program Announced: Oct. 2013 Expected Close: Q3 2014 $53mm (5) 100% RCAP Class A Shares (Seller option to receive up to 60% of consideration in cash) • Small publicly traded independent broker - dealer with strong regional presence • Award - winning management team • Synergies from improved economies of scale Announced: Nov. 2013 Closed: June 2014 $49mm (5),(6) 100% RCAP Class A Shares (Seller option to receive up to 80% of consideration in cash) • Small public independent broker - dealer with growth record • Award - winning management team • Synergies from improved economies of scale Announced: Jan. 2014 Closed: June 2014 $27mm (5),(6) 70% cash 30% RCAP Class A Shares – $16.2mm payable at closing – $10.8mm payable within one year of closing • Small private advisor with award - winning management • Additional lines of business (e.g., syndicate) for additional growth potential • Synergies from improved economies of scale Invest. Mgmt Announced: Oct. 2013 Expected Close: Q3 2014 $40mm (5),(6) 100% cash, consists of: – $30mm of upfront cash – $10mm of deferred cash over 3 years • Liquid alternatives fund platform with more than $2 billion AUM • Diversifies RCAP revenue sources with investment management and incentive fees • Differentiated distribution channels to support sales growth Wholesale Distribution Announced: May 2014 Expected Close: Q3 2014 $80mm (5),(6) 88% cash – $60mm of upfront cash – $10mm of deferred cash 12% RCAP Class A Shares – $10mm of RCAP Class A Shares • Adds five programs with total registered equity of $8 billion to RCS distribution platform • RCAP/ Strategic Capital combined represent 4 of the top 10 direct investment programs in 2014 through April 30 • History of raising capital with more than $1.7 billion raised from inception to date • Incentive purchase structure (earn - out) encourages continued growth of Strategic Capital sales (1) Gross value of $1,150 million, net of $35 million of unrestricted cash. (2) Closed at RCAP Holdings, LLC. (3) On February 11, 2014, RCAP Holdings LLC announced that it will contribute all of its equity interests in First Allied Holding s t o RCAP. As consideration, RCAP has agreed to issue 11.265 million of RCAP Class A Shares . (4) Represents equity value as of June 20, 2014. (5) Represents equity value, these acquisitions will be acquired with a positive net cash position in the aggregate. (6) Summit and J.P. Turner purchase prices exclude potential earn - outs of $4.8mm and $7.6mm, respectively. Hatteras purchase price e xcludes potential earn - outs in 2016 and 2018 based on pre - tax net income. Strategic Capital purchase price excludes potential earn - out of $94.1mm.
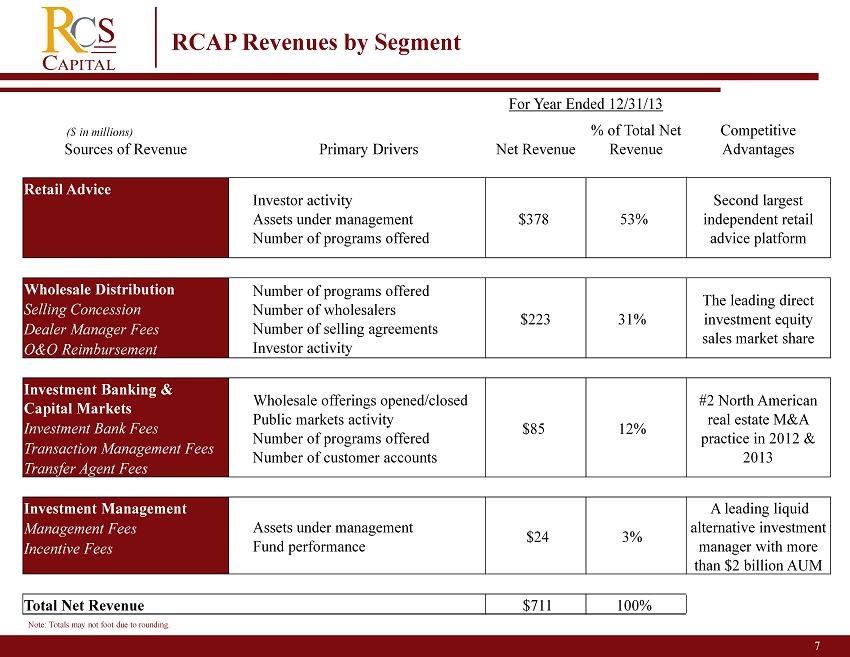
7 RCAP Revenues by Segment For Year Ended 12/31/13 ($ in millions) Sources of Revenue Primary Drivers Net Revenue % of Total Net Revenue Competitive Advantages Retail Advice Investor activity Assets under management Number of programs offered $378 53% Second largest independent retail advice platform Wholesale Distribution Number of programs offered Number of wholesalers Number of selling agreements Investor activity $223 31% The leading direct investment equity sales market share Selling Concession Dealer Manager Fees O&O Reimbursement Investment Banking & Capital Markets Wholesale offerings opened/closed Public markets activity Number of programs offered Number of customer accounts $85 12% #2 North American real estate M&A practice in 2012 & 2013 Investment Bank Fees Transaction Management Fees Transfer Agent Fees Investment Management Assets under management Fund performance $24 3% A leading liquid alternative investment manager with more than $2 billion AUM Management Fees Incentive Fees Total Net Revenue $711 100% Note: Totals may not foot due to rounding.

American Realty Capital Retail Advice 8 2
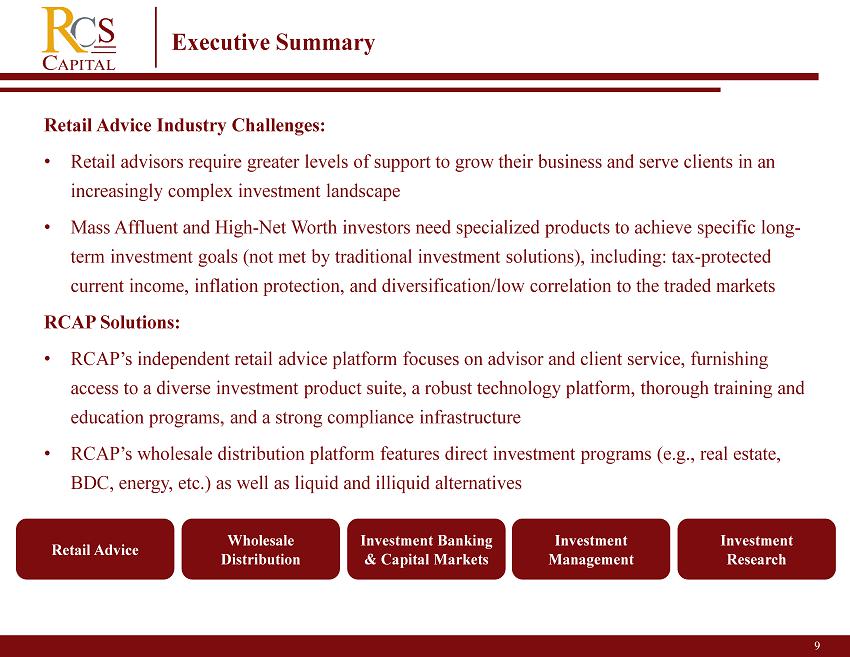
9 2 Retail Advice Industry Challenges: • Retail advisors require greater levels of support to grow their business and serve clients in an increasingly complex investment landscape • Mass Affluent and High - Net Worth investors need specialized products to achieve specific long - term investment goals (not met by traditional investment solutions), including: tax - protected current income, inflation protection, and diversification/low correlation to the traded markets RCAP Solutions: • RCAP’s independent retail advice platform focuses on advisor and client service, furnishing access to a diverse investment product suite, a robust technology platform, thorough training and education programs, and a strong compliance infrastructure • RCAP’s wholesale distribution platform features direct investment programs (e.g., real estate, BDC, energy, etc.) as well as liquid and illiquid alternatives Retail Advice Wholesale Distribution Investment Banking & Capital Markets Investment Management Investment Research Executive Summary
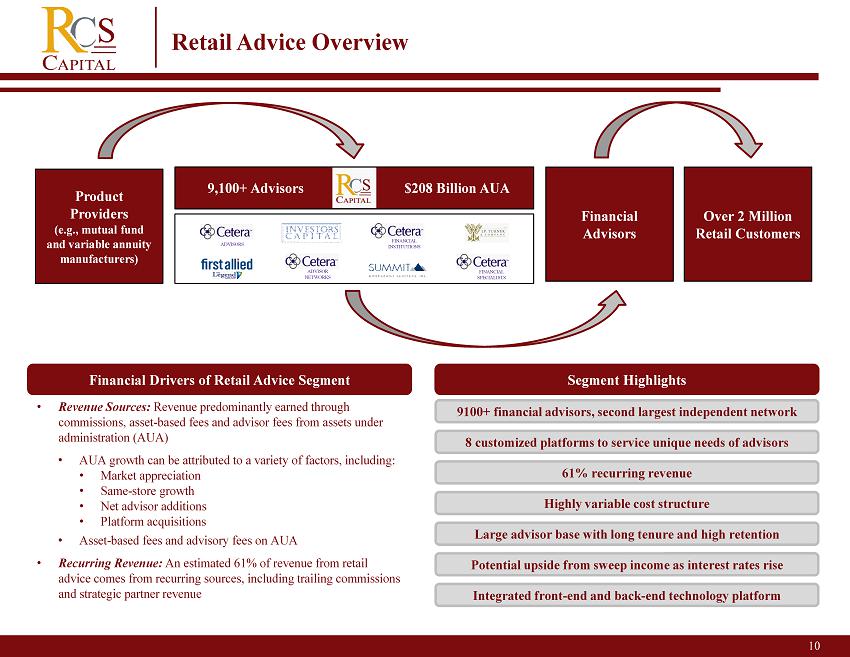
10 Retail Advice Overview Financial Drivers of Retail Advice Segment Segment Highlights Over 2 Million Retail Customers Financial Advisors Product Providers (e.g., mutual fund and variable annuity manufacturers) FINANCIAL SPECIALISTS FINANCIAL INSTITUTIONS ADVISOR NETWORKS ADVISORS 9,100+ Advisors $208 B illion AUA • Revenue Sources: Revenue predominantly earned through commissions, asset - based fees and advisor fees from assets under administration (AUA) • AUA growth can be attributed to a variety of factors, including: • Market appreciation • Same - store growth • Net advisor additions • Platform acquisitions • Asset - based fees and advisory fees on AUA • Recurring Revenue: An estimated 61% of revenue from retail advice comes from recurring sources, including trailing commissions and strategic partner revenue Highly variable cost structure 9100+ financial advisors, second largest independent network Potential upside from sweep income as interest rates rise Integrated front - end and back - end technology platform 61% recurring revenue Large advisor base with long tenure and high retention 8 customized platforms to service unique needs of advisors
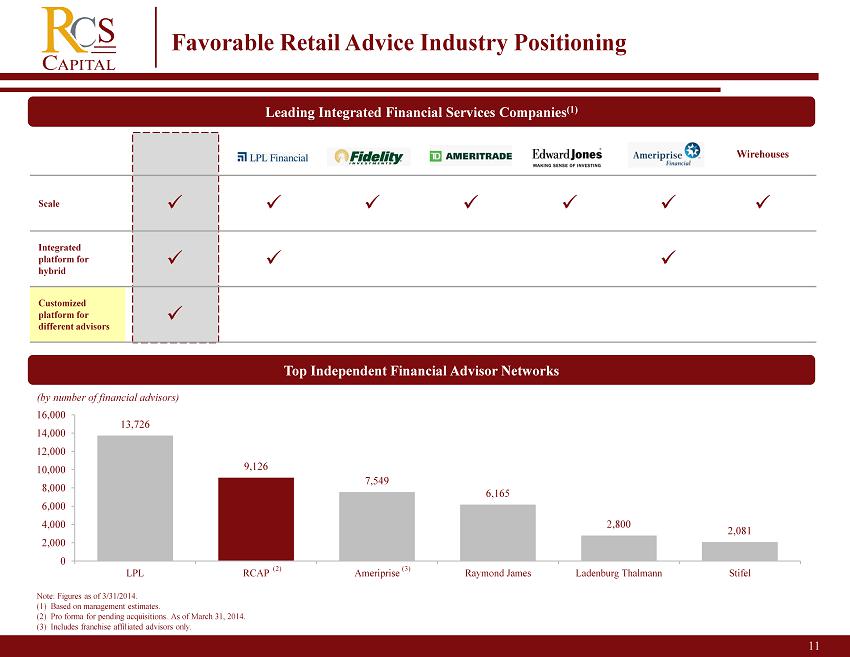
American Realty Capital Wirehouses Scale x x x x x x x Integrated platform for hybrid x x x Customized platform for different advisors x 13,726 9,126 7,549 6,165 2,800 2,081 0 2,000 4,000 6,000 8,000 10,000 12,000 14,000 16,000 LPL RCAP Ameriprise Raymond James Ladenburg Thalmann Stifel Top Independent Financial Advisor Networks Note: Figures as of 3/31/2014. (1) Based on management estimates. (2) Pro forma for pending acquisitions. As of March 31, 2014. (3) Includes franchise affiliated advisors only. Leading Integrated Financial Services Companies (1) (by number of financial advisors) 11 Favorable Retail Advice Industry Positioning (3) (2)
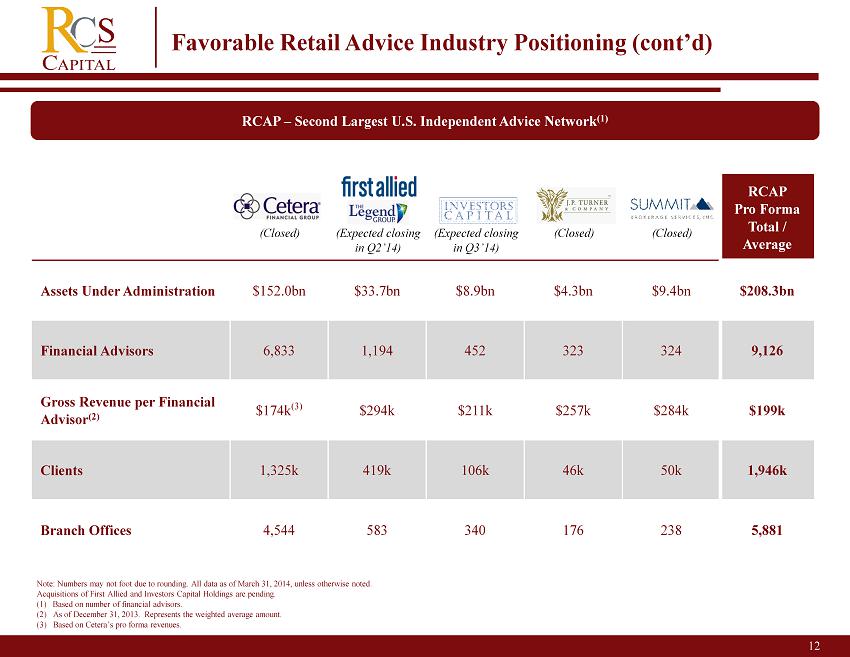
12 2 Favorable Retail Advice Industry Positioning (cont’d) Note: Numbers may not foot due to rounding. All data as of March 31, 2014, unless otherwise noted. Acquisitions of First Allied and Investors Capital Holdings are pending. (1) Based on number of financial advisors. (2) As of December 31, 2013. Represents the weighted average amount. (3) Based on Cetera’s pro forma revenues. RCAP – Second Largest U.S. Independent Advice Network (1) RCAP Pro Forma Total / Average Assets Under Administration $ 152.0bn $33.7bn $8.9bn $4.3bn $9.4bn $208.3bn Financial Advisors 6,833 1,194 452 323 324 9,126 Gross Revenue per Financial Advisor (2) $ 174k (3) $294k $211k $257k $284k $199k Clients 1,325k 419k 106k 46k 50k 1,946k Branch Offices 4,544 583 340 176 238 5,881 (Closed) (Expected closing in Q2’14) (Closed) (Expected closing in Q3’14) (Closed)
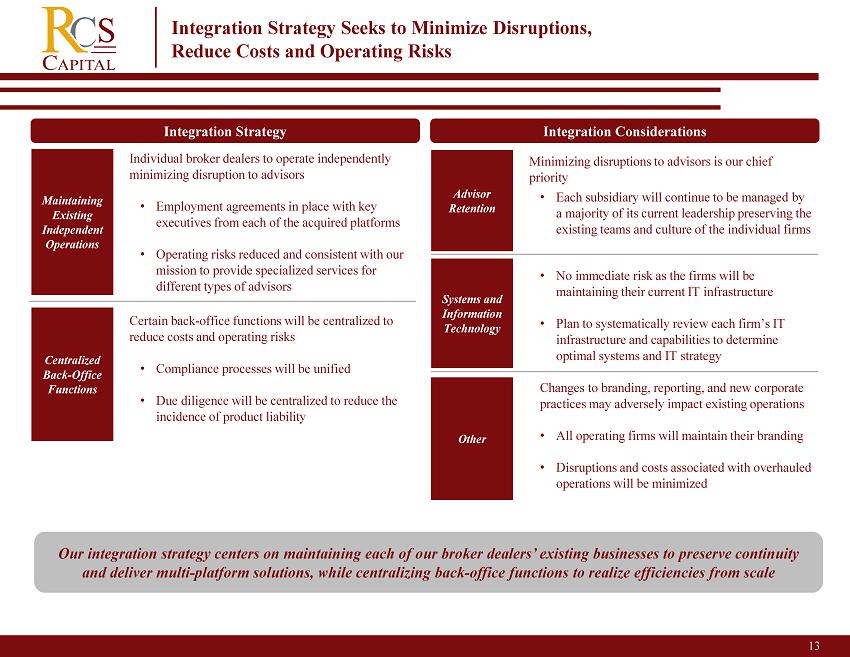
13 2 Integration Strategy Seeks to Minimize Disruptions, Reduce Costs and Operating Risks Integration Considerations • Minimizing disruptions to advisors is our chief priority • Each subsidiary will continue to be managed by a majority of its current leadership preserving the existing teams and culture of the individual firms • No immediate risk as the firms will be maintaining their current IT infrastructure • Plan to systematically review each firm’s IT infrastructure and capabilities to determine optimal systems and IT strategy Changes to branding, reporting, and new corporate practices may adversely impact existing operations • All operating firms will maintain their branding • Disruptions and costs associated with overhauled operations will be minimized Integration Strategy • Individual broker dealers to operate independently minimizing disruption to advisors • Employment agreements in place with key executives from each of the acquired platforms • O perating risks reduced and consistent with our mission to provide specialized services for different types of advisors • Certain back - office functions will be centralized to reduce costs and operating risks • Compliance processes will be unified • Due diligence will be centralized to reduce the incidence of product liability Our integration strategy centers on maintaining each of our broker dealers’ existing businesses to preserve continuity and deliver multi - platform solutions, while centralizing back - office functions to realize efficiencies from scale Maintaining Existing Independent Operations Centralized Back - Office Functions Advisor Retention Systems and Information Technology Other
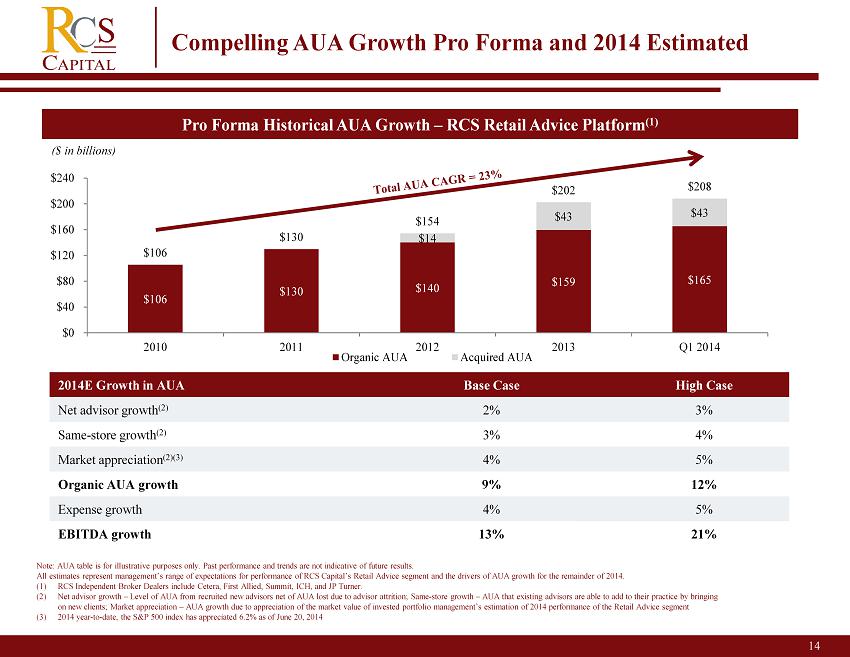
American Realty Capital $106 $130 $140 $159 $165 $14 $43 $43 $106 $130 $154 $202 $208 $0 $40 $80 $120 $160 $200 $240 2010 2011 2012 2013 Q1 2014 Organic AUA Acquired AUA ($ in billions) 14 2 Pro Forma Historical AUA Growth – RCS Retail Advice Platform (1) Compelling AUA Growth Pro Forma and 2014 Estimated Note: AUA table is for illustrative purposes only. Past performance and trends are not indicative of future results. All estimates represent management’s range of expectations for performance of RCS Capital’s Retail Advice segment and the drivers of AUA growth for the remainder of 2014 . (1) RCS Independent Broker Dealers include Cetera, First Allied, Summit, ICH, and JP Turner. (2) Net advisor growth – Level of AUA from recruited new advisors net of AUA lost due to advisor attrition; Same - store growth – AUA that existing advisors are able to add to their practice by bringing on new clients; Market appreciation – AUA growth due to appreciation of the market value of invested portfolio management’s estimation of 2014 performance of the Retail Advice segment (3) 2014 year - to - date, the S&P 500 index has appreciated 6.2% as of June 20, 2014 2014E Growth in AUA Base Case High Case Net advisor growth (2) 2% 3% Same - store growth (2) 3% 4% Market appreciation (2)(3) 4% 5% Organic AUA growth 9% 12% Expense growth 4% 5% EBITDA growth 13% 21%
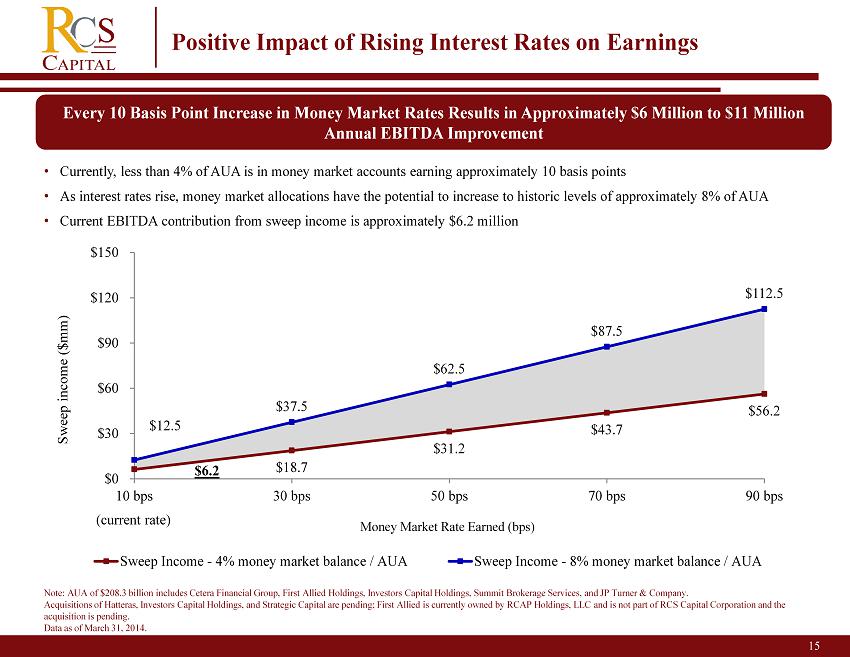
15 Positive Impact of Rising Interest Rates on Earnings Note: AUA of $208.3 billion includes Cetera Financial Group, First Allied Holdings, Investors Capital Holdings, Summit Brokerage Services, and JP Turner & Company. Acquisitions of Hatteras, Investors Capital Holdings, and Strategic Capital are pending; First Allied is currently owned by RCAP Holdings, LLC and is not part of RCS Capital Corporation and the acquisition is pending. Data as of March 31, 2014. • Currently, less than 4% of AUA is in money market accounts earning approximately 10 basis points • As interest rates rise, money market allocations have the potential to increase to historic levels of approximately 8% of AUA • Current EBITDA contribution from sweep income is approximately $6.2 million Every 10 Basis Point Increase in Money Market Rates Results in Approximately $6 Million to $11 Million Annual EBITDA Improvement $6.2 $18.7 $31.2 $43.7 $56.2 $12.5 $37.5 $62.5 $87.5 $112.5 $0 $30 $60 $90 $120 $150 10 bps 30 bps 50 bps 70 bps 90 bps Sweep Income - 4% money market balance / AUA Sweep Income - 8% money market balance / AUA Money Market Rate Earned (bps) Sweep income ($mm) (current rate)
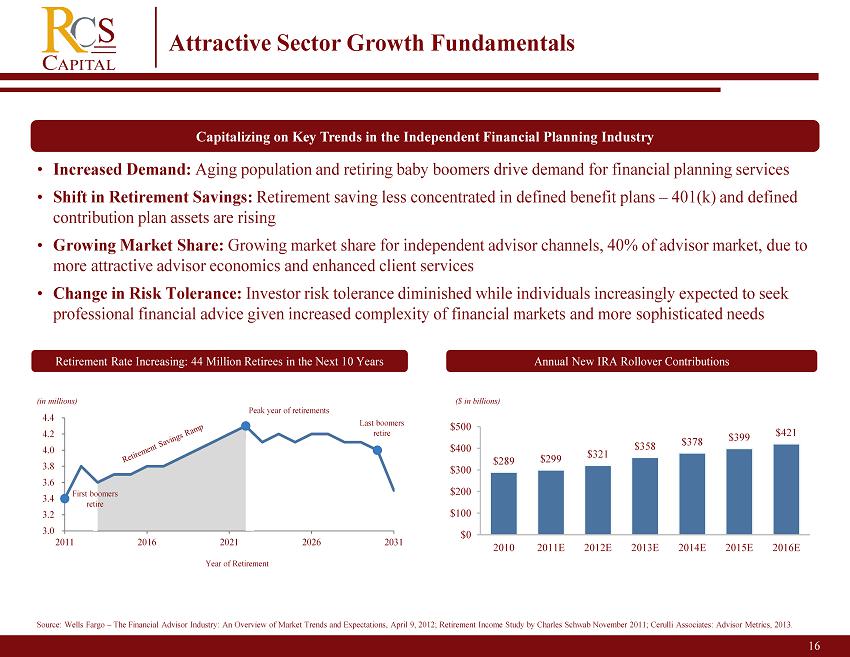
16 2 Attractive Sector Growth Fundamentals Retirement Rate Increasing: 44 Million Retirees in the Next 10 Years Annual New IRA Rollover Contributions ($ in billions) Source: Wells Fargo – The Financial Advisor Industry: An Overview of Market Trends and Expectations, April 9, 2012; Retirement Income Study by Charles Schwab November 2011; Cerulli Associates: Advisor Metrics, 2013. • Increased Demand: A ging population and retiring baby boomers drive demand for financial planning services • Shift in Retirement Savings: Retirement saving less concentrated in defined benefit plans – 401(k) and defined contribution plan assets are rising • Growing Market Share: Growing market share for independent advisor channels, 40% of advisor market, due to more attractive advisor economics and enhanced client services • Change in Risk Tolerance: Investor risk tolerance diminished while individuals increasingly expected to seek professional financial advice given increased complexity of financial markets and more sophisticated needs $289 $299 $321 $358 $378 $399 $421 $0 $100 $200 $300 $400 $500 2010 2011E 2012E 2013E 2014E 2015E 2016E Capitalizing on Key Trends in the Independent Financial Planning Industry (in millions) Last boomers retire 3.0 3.2 3.4 3.6 3.8 4.0 4.2 4.4 2011 2016 2021 2026 2031 Peak year of retirements Year of Retirement First boomers retire

American Realty Capital Wholesale Distribution 17 2
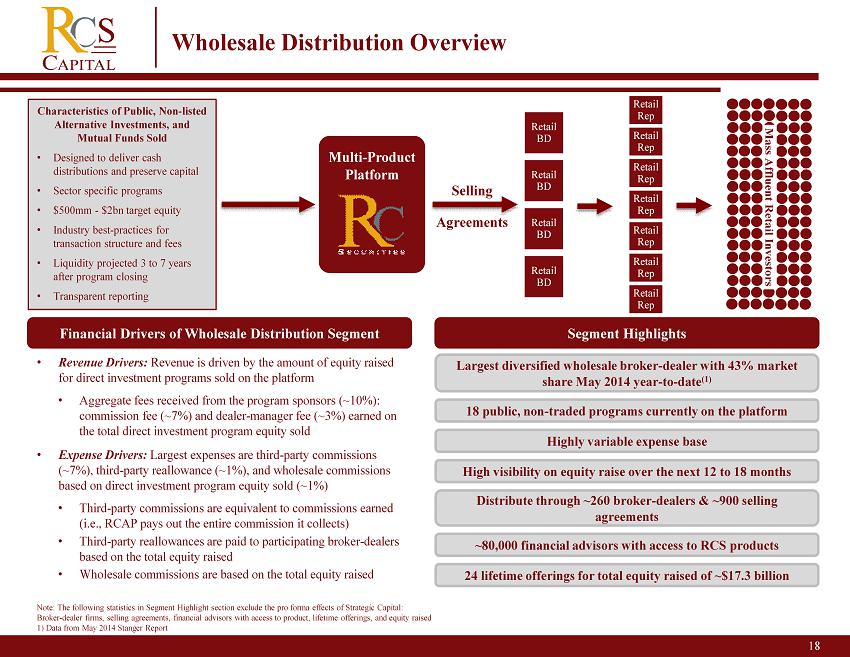
18 Wholesale Distribution Overview Selling Agreements Multi - Product Platform Retail BD Retail BD Retail BD Retail BD Retail Rep Retail Rep Retail Rep Retail Rep Retail Rep Retail Rep Retail Rep Characteristics of Public, Non - listed Alternative Investments, and Mutual Funds Sold • Designed to deliver cash distributions and preserve capital • Sector specific programs • $500mm - $2bn target equity • Industry best - practices for transaction structure and fees • Liquidity projected 3 to 7 years after program closing • Transparent reporting Mass Affluent Retail Investors Financial Drivers of Wholesale Distribution Segment Segment Highlights Highly variable expense base Largest diversified wholesale broker - dealer with 43% market share May 2014 year - to - date (1) 24 lifetime offerings for total equity raised of ~$17.3 billion Distribute through ~260 broker - dealers & ~900 selling agreements ~80,000 financial advisors with access to RCS products 18 public, non - traded programs currently on the platform High visibility on equity raise over the next 12 to 18 months • Revenue Drivers: Revenue is driven by the amount of equity raised for direct investment programs sold on the platform • Aggregate fees received from the program sponsors (~10%): commission fee (~ 7 %) and dealer - manager fee (~ 3 %) earned on the total direct investment program equity sold • Expense Drivers: Largest expenses are third - party commissions (~7%), third - party reallowance (~1%), and wholesale commissions based on direct investment program equity sold (~1%) • Third - party commissions are equivalent to commissions earned (i.e., RCAP pays out the entire commission it collects) • Third - party reallowances are paid to participating broker - dealers based on the total equity raised • Wholesale commissions are based on the total equity raised Note: The following statistics in Segment Highlight section exclude the pro forma effects of Strategic Capital: Broker - dealer firms, selling agreements, financial advisors with access to product, lifetime offerings, and equity raised 1) Data from May 2014 Stanger Report
19 2 Rationale for Growth of Alternative Investments • Retail financial advisors have historically focused their attention on allocating the majority of their clients’ assets between two asset classes – equities and fixed income. • The combination of high levels of correlation between equities and fixed income and recent periods of extreme market volatility, have caused advisors to seek greater portfolio diversification. • Financial advisors are increasingly addressing portfolio diversification through alternative asset classes – consistent with their institutional counterparts. • Low interest rate environment has created demand for products that provide stable income as well as the potential for capital appreciation. • Financial advisors are rapidly adopting both liquid and non - liquid alternative investments as a fixed income surrogate – and as a volatility management tool. • Significant room for continued growth in alternatives as they make up only 2% to 3 % of retail investors’ portfolios (1) 1) Data from Cerulli Research
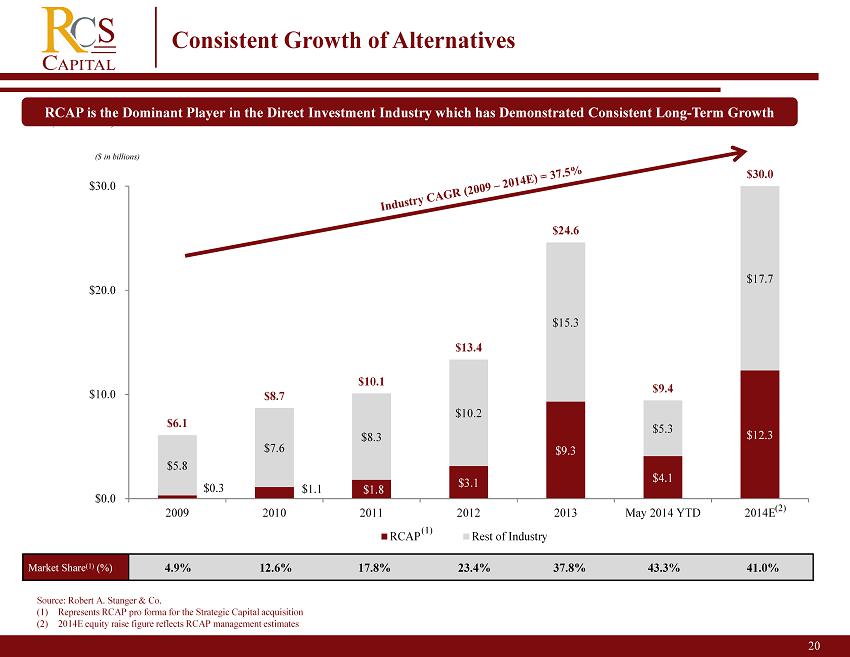
$0.3 $1.1 $1.8 $3.1 $9.3 $4.1 $12.3 $5.8 $7.6 $8.3 $10.2 $15.3 $5.3 $17.7 $6.1 $8.7 $10.1 $13.4 $24.6 $9.4 $30.0 $0.0 $10.0 $20.0 $30.0 2009 2010 2011 2012 2013 May 2014 YTD 2014E RCAP Rest of Industry ($ in billions) Source: Robert A. Stanger & Co. (1) Represents RCAP pro forma for the Strategic Capital acquisition (2) 2014E equity raise figure reflects RCAP management estimates 20 2 Consistent Growth of Alternatives RCAP is the Dominant Player in the Direct Investment Industry which has Demonstrated Consistent Long - Term Growth Market Share (1) (%) 4.9% 12.6% 17.8% 23.4% 37.8% 43.3% 41.0% (1) (2) ($ in billions )
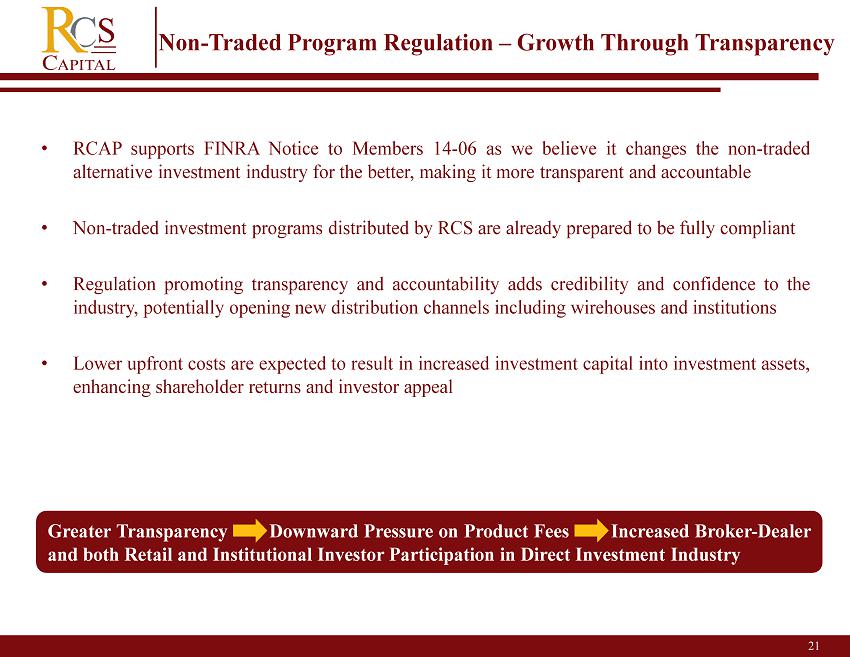
21 2 Non - Traded Program Regulation – Growth Through Transparency • RCAP supports FINRA Notice to Members 14 - 06 as we believe it changes the non - traded alternative investment industry for the better, making it more transparent and accountable • Non - traded investment programs distributed by RCS are already prepared to be fully compliant • Regulation promoting transparency and accountability adds credibility and confidence to the industry, potentially opening new distribution channels including wirehouses and institutions • Lower upfront costs are expected to result in increased investment capital into investment assets, enhancing shareholder returns and investor appeal Greater T ransparency Downward Pressure on Product Fees Increased Broker - Dealer and both Retail and Institutional Investor Participation in Direct Investment Industry

American Realty Capital Investment Banking & Capital Markets 22 2
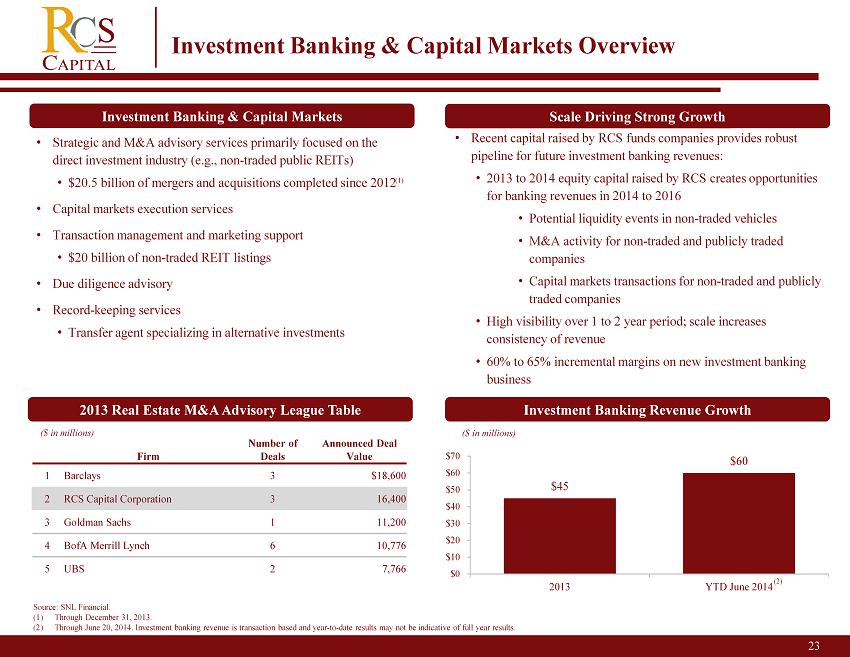
23 2 Investment Banking & Capital Markets Overview Firm Number of Deals Announced Deal Value 1 Barclays 3 $18,600 2 RCS Capital Corporation 3 16,400 3 Goldman Sachs 1 11,200 4 BofA Merrill Lynch 6 10,776 5 UBS 2 7,766 Investment Banking & Capital Markets • Strategic and M&A advisory services primarily focused on the direct investment industry (e.g., non - traded public REITs) • $20.5 billion of mergers and acquisitions completed since 2012 • Capital markets execution services • Transaction management and marketing support • $20 billion of non - traded REIT listings • Due diligence advisory • Record - keeping services • Transfer agent specializing in alternative investments Source: SNL Financial. (1) Through December 31, 2013. (2) Through June 20, 2014. Investment banking revenue is transaction based and year - to - date results may not be indicative of full ye ar results. ($ in millions) 2013 Real Estate M&A Advisory League Table 2% (1) Scale Driving Strong Growth • Recent capital raised by RCS funds companies provides robust pipeline for future investment banking revenues: • 2013 to 2014 equity capital raised by RCS creates opportunities for banking revenues in 2014 to 2016 • Potential liquidity events in non - traded vehicles • M&A activity for non - traded and publicly traded companies • Capital markets transactions for non - traded and publicly traded companies • High visibility over 1 to 2 year period; scale increases consistency of revenue • 60% to 65% incremental margins on new investment banking business Investment Banking Revenue Growth ($ in millions) $45 $60 $0 $10 $20 $30 $40 $50 $60 $70 2013 YTD June 2014 (2)
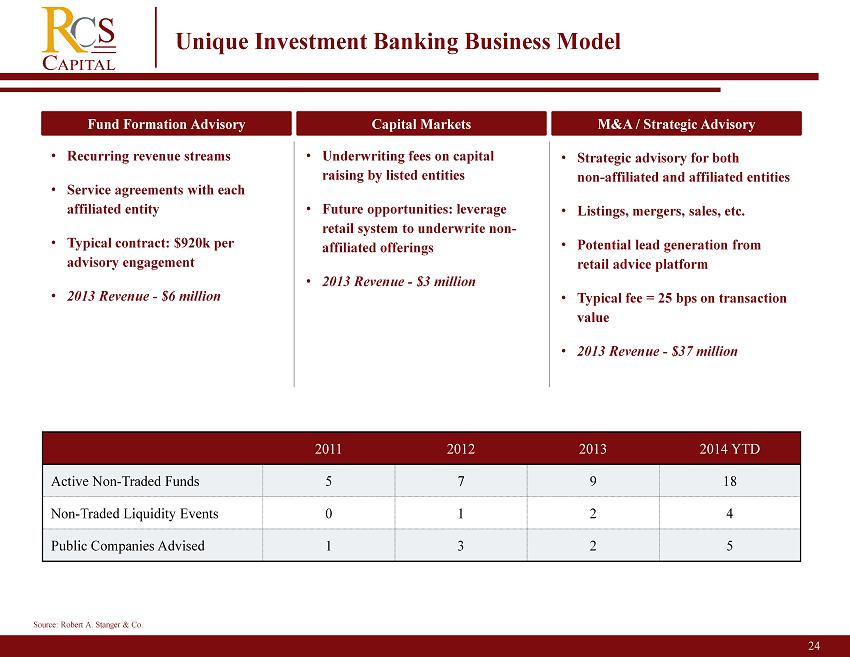
24 2 Unique Investment Banking Business Model Fund Formation Advisory Capital Markets M&A / Strategic Advisory • Recurring revenue streams • Service agreements with each affiliated entity • Typical contract: $920k per advisory engagement • 2013 Revenue - $6 million • Underwriting fees on capital raising by listed entities • Future opportunities: leverage retail system to underwrite non - affiliated offerings • 2013 Revenue - $3 million • Strategic advisory for both non - affiliated and affiliated entities • Listings, mergers, sales, etc. • Potential lead generation from retail advice platform • Typical fee = 25 bps on transaction value • 2013 Revenue - $37 million 2011 2012 2013 2014 YTD Active Non - Traded Funds 5 7 9 18 Non - Traded Liquidity Events 0 1 2 4 Public Companies Advised 1 3 2 5 Source: Robert A. Stanger & Co .

American Realty Capital Investment Management 25 2
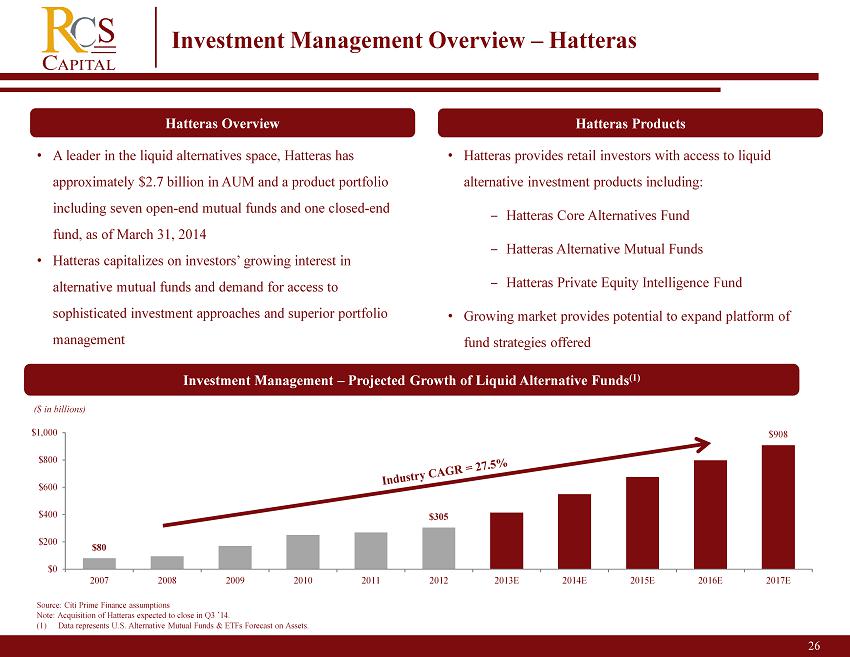
26 2 Investment Management Overview – Hatteras Hatteras Overview Hatteras Products • A leader in the liquid alternatives space, Hatteras has approximately $2.7 billion in AUM and a product portfolio including seven open - end mutual funds and one closed - end fund, as of March 31, 2014 • Hatteras capitalizes on investors’ growing interest in alternative mutual funds and demand for access to sophisticated investment approaches and superior portfolio management Source: Citi Prime Finance assumptions Note: Acquisition of Hatteras expected to close in Q3 ’14 . (1) Data represents U.S. Alternative Mutual Funds & ETFs Forecast on Assets. Investment Management – Projected Growth of Liquid Alternative Funds (1) 44% 2% $80 $305 $908 $0 $200 $400 $600 $800 $1,000 2007 2008 2009 2010 2011 2012 2013E 2014E 2015E 2016E 2017E ($ in billions) • Hatteras provides retail investors with access to liquid alternative investment products including: ‒ Hatteras Core Alternatives Fund ‒ Hatteras Alternative Mutual Funds ‒ Hatteras Private Equity Intelligence Fund • Growing market provides potential to expand platform of fund strategies offered

American Realty Capital Financial Information 27
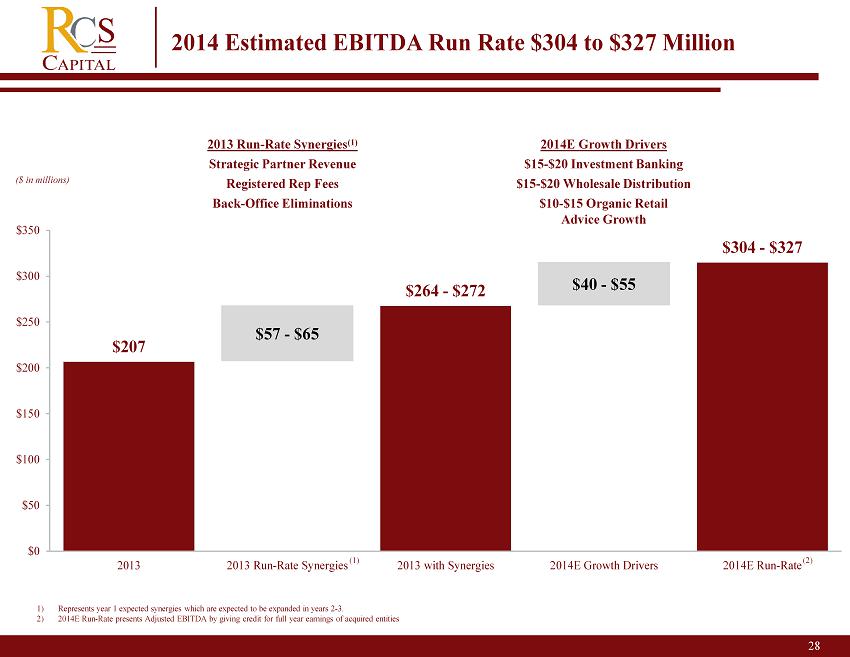
1) Represents year 1 expected synergies which are expected to be expanded in years 2 - 3. 2) 2014E Run - Rate presents Adjusted EBITDA by giving credit for full year earnings of acquired entities $57 - $65 $40 - $55 $207 $ 264 - $272 $ 304 - $327 $0 $50 $100 $150 $200 $250 $300 $350 2013 2013 Run-Rate Synergies 2013 with Synergies 2014E Growth Drivers 2014E Run-Rate 28 2 2014 Estimated EBITDA Run Rate $304 to $327 Million ($ in m illions ) (1) (2) 2013 Run - Rate Synergies (1) Strategic Partner Revenue Registered Rep Fees Back - Office Eliminations 2014E Growth Drivers $15 - $20 Investment Banking $15 - $20 Wholesale Distribution $10 - $15 Organic Retail Advice Growth (2) (1)
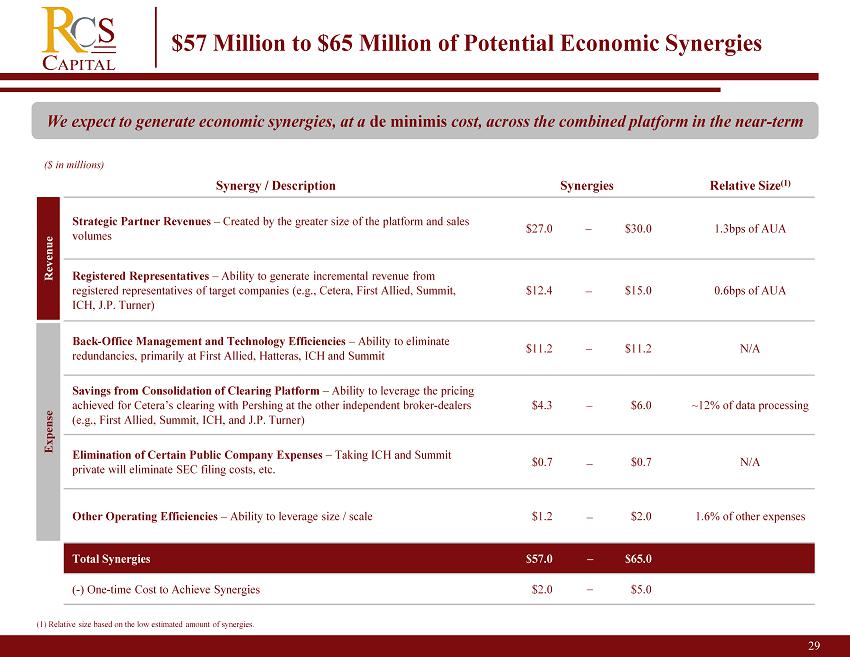
29 $57 Million to $65 Million of Potential Economic Synergies Synergy / Description Synergies Relative Size (1) Strategic Partner Revenues – Created by the greater size of the platform and sales volumes $27.0 $30.0 1.3bps of AUA Registered Representatives – Ability to generate incremental revenue from registered representatives of target companies (e.g., Cetera, First Allied, Summit, ICH, J.P. Turner) $12.4 $15.0 0.6bps of AUA Back - Office Management and Technology Efficiencies – Ability to eliminate redundancies, primarily at First Allied, Hatteras, ICH and Summit $11.2 $11.2 N/A Savings from Consolidation of Clearing Platform – Ability to leverage the pricing achieved for Cetera’s clearing with Pershing at the other independent broker - dealers (e.g., First Allied , Summit, ICH, and J.P. Turner) $4.3 $6.0 ~12% of data processing Elimination of Certain Public Company Expenses – Taking ICH and Summit private will eliminate SEC filing costs, etc. $0.7 $0.7 N/A Other Operating Efficiencies – Ability to leverage size / scale $1.2 $2.0 1.6% of other expenses Total Synergies $57.0 $65.0 ( - ) One - time C ost to Achieve Synergies $2.0 $5.0 Revenue Expense We expect to generate economic synergies, at a de minimis cost, across the combined platform in the near - term ($ in millions) (1) Relative size based on the low estimated amount of synergies. – – – – – – – –
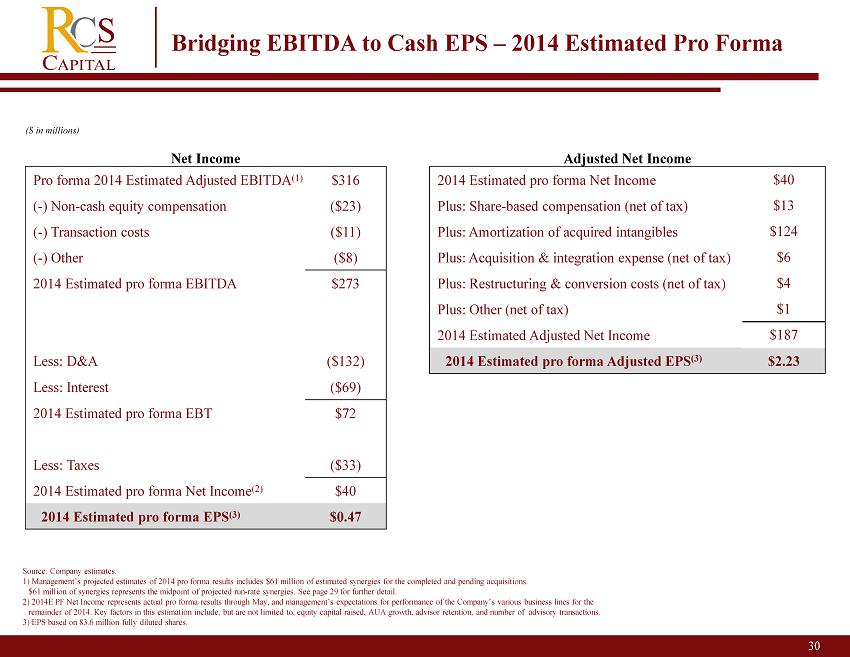
Color Scheme 0 31 97 114 49 177 90 175 30 61 69 82 64 165 217 0 90 130 30 Bridging EBITDA to Cash EPS – 2014 Estimated Pro Forma Source: Company estimates. 1) Management’s projected estimates of 2014 pro forma results includes $61 million of estimated synergies for the completed a nd pending acquisitions. $61 million of synergies represents the midpoint of projected run - rate synergies. See page 29 for further detail. 2) 2014E PF Net Income represents actual pro forma results through May, and management’s expectations for performance of the Com pany’s various business lines for the remainder of 2014. Key factors in this estimation include, but are not limited to, equity capital raised, AUA growth, advisor re tention, and number of advisory transactions. 3 ) EPS based on 83.6 million fully diluted shares. ($ in m illions ) Net Income Adjusted Net Income Pro forma 2014 Estimated Adjusted EBITDA (1) $ 316 2014 Estimated pro forma Net Income $ 40 ( - ) Non - cash equity compensation ($23) Plus: Share - based compensation (net of tax) $ 13 ( - ) Transaction costs ($11) Plus: Amortization of acquired intangibles $124 ( - ) Other ($8) Plus: Acquisition & integration expense (net of tax) $6 2014 Estimated pro forma EBITDA $ 273 Plus: Restructuring & conversion costs (net of tax) $4 Plus: Other (net of tax) $1 2014 Estimated Adjusted Net Income $187 Less: D&A ($ 132) 2014 Estimated pro forma Adjusted EPS (3) $2.23 Less: Interest ($69) 2014 Estimated pro forma EBT $72 Less: Taxes ($33) 2014 Estimated pro forma Net Income (2) $ 40 2014 Estimated pro forma EPS (3) $ 0.47
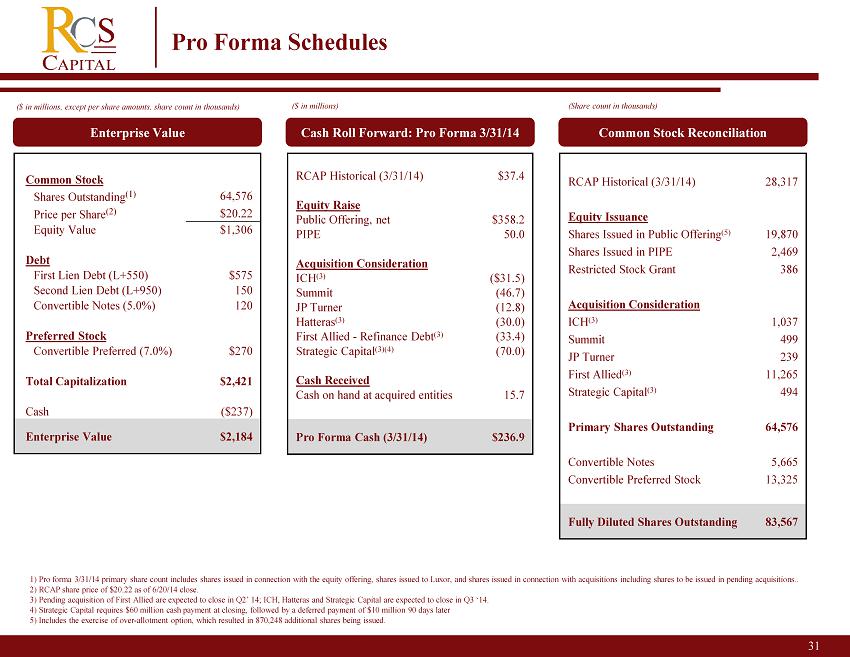
31 Pro Forma Schedules 1) Pro forma 3/31/14 primary share count includes shares issued in connection with the equity offering, shares issued to Luxor, and shares issued in connection with acquisitions including shares to be issued in pending acquisitions.. 2) RCAP share price of $ 20.22 as of 6/20/14 close. 3) Pending acquisition of First Allied are expected to close in Q2’ 14; ICH, Hatteras and Strategic Capital are expected to c los e in Q3 ‘14. 4) Strategic Capital requires $60 million cash payment at closing, followed by a deferred payment of $10 million 90 days late r 5) Includes the exercise of over - allotment option, which resulted in 870,248 additional shares being issued. Common Stock Shares Outstanding (1) 64,576 Price per Share (2) $ 20.22 Equity Value $ 1,306 Debt First Lien Debt (L+550) $575 Second Lien Debt (L+950) 150 Convertible Notes (5.0%) 120 Preferred Stock Convertible Preferred (7.0%) $270 Total Capitalization $2,421 Cash ($ 237) Enterprise Value $ 2,184 RCAP Historical (3/31/14) 28,317 Equity Issuance Shares Issued in Public Offering (5) 19,870 Shares Issued in PIPE 2,469 Restricted Stock Grant 386 Acquisition Consideration ICH (3) 1,037 Summit 499 JP Turner 239 First Allied (3) 11,265 Strategic Capital (3) 494 Primary Shares Outstanding 64,576 Convertible Notes 5,665 Convertible Preferred Stock 13,325 Fully Diluted Shares Outstanding 83,567 RCAP Historical (3/31/14) $37.4 Equity Raise Public Offering, net $358.2 PIPE 50.0 Acquisition Consideration ICH (3) ($31.5) Summit (46.7) JP Turner (12.8) Hatteras (3) (30.0) First Allied - Refinance Debt (3) (33.4) Strategic Capital (3)(4) (70.0) Cash Received Cash on hand at acquired entities 15.7 Pro Forma Cash ( 3/31/14) $ 236.9 Enterprise Value Cash Roll Forward: Pro Forma 3/31/14 Common Stock Reconciliation ($ in millions, except per share amounts, share count in thousands) ($ in millions) (Share count in thousands)
American Realty Capital Highly Experienced & Cohesive Management Team 32
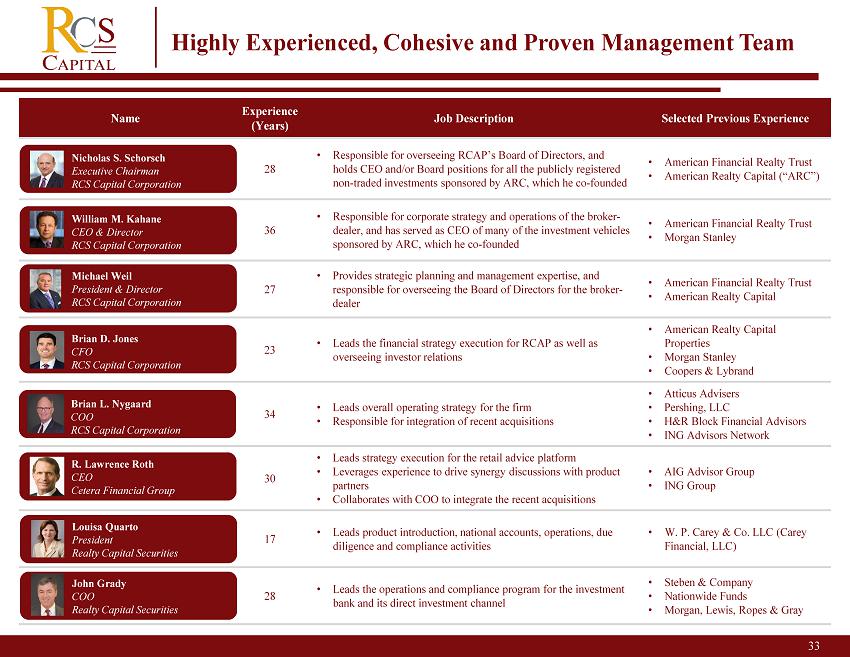
33 2 Name Experience (Years) Job Description Selected Previous Experience 28 • Responsible for overseeing RCAP’s Board of Directors, and holds CEO and/or Board positions for all the publicly registered non - traded investments sponsored by ARC, which he co - founded • American Financial Realty Trust • American Realty Capital (“ARC”) 36 • Responsible for corporate strategy and operations of the broker - dealer, and has served as CEO of many of the investment vehicles sponsored by ARC, which he co - founded • American Financial Realty Trust • Morgan Stanley 27 • Provides strategic planning and management expertise, and responsible for overseeing the Board of Directors for the broker - dealer • American Financial Realty Trust • American Realty Capital 23 • Leads the financial strategy execution for RCAP as well as overseeing investor relations • American Realty Capital Properties • Morgan Stanley • Coopers & Lybrand 34 • Leads overall operating strategy for the firm • Responsible for integration of recent acquisitions • Atticus Advisers • Pershing, LLC • H&R Block Financial Advisors • ING Advisors Network 30 • Leads strategy execution for the retail advice platform • Leverages experience to drive synergy discussions with product partners • Collaborates with COO to integrate the recent acquisitions • AIG Advisor Group • ING Group 17 • Leads product introduction, national accounts, operations, due diligence and compliance activities • W. P. Carey & Co. LLC (Carey Financial, LLC) 28 • Leads the operations and compliance program for the investment bank and its direct investment channel • Steben & Company • Nationwide Funds • Morgan, Lewis, Ropes & Gray Highly Experienced, Cohesive and Proven Management Team Nicholas S. Schorsch Executive Chairman RCS Capital Corporation William M. Kahane CEO & Director RCS Capital Corporation Michael Weil President & Director RCS Capital Corporation Brian D. Jones CFO RCS Capital Corporation R. Lawrence Roth CEO Cetera Financial Group Brian L. Nygaard COO RCS Capital Corporation Louisa Quarto President Realty Capital Securities John Grady COO Realty Capital Securities
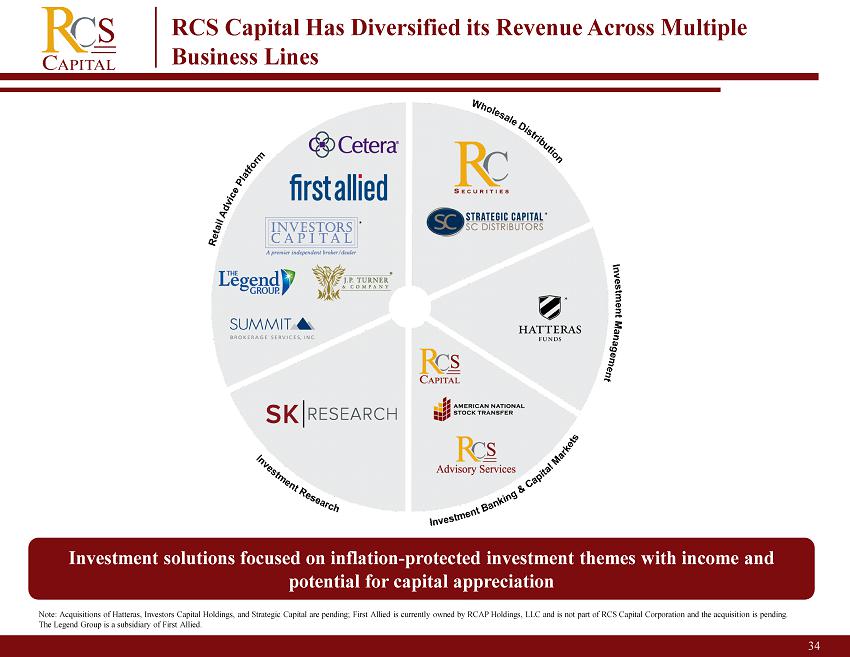
34 2 Investment solutions focused on inflation - protected investment themes with income and potential for capital appreciation RCS Capital Has Diversified its Revenue Across Multiple Business Lines Note: Acquisitions of Hatteras, Investors Capital Holdings, and Strategic Capital are pending; First Allied is currently owne d b y RCAP Holdings, LLC and is not part of RCS Capital Corporation and the acquisition is pending. The Legend Group is a subsidiary of First Allied.
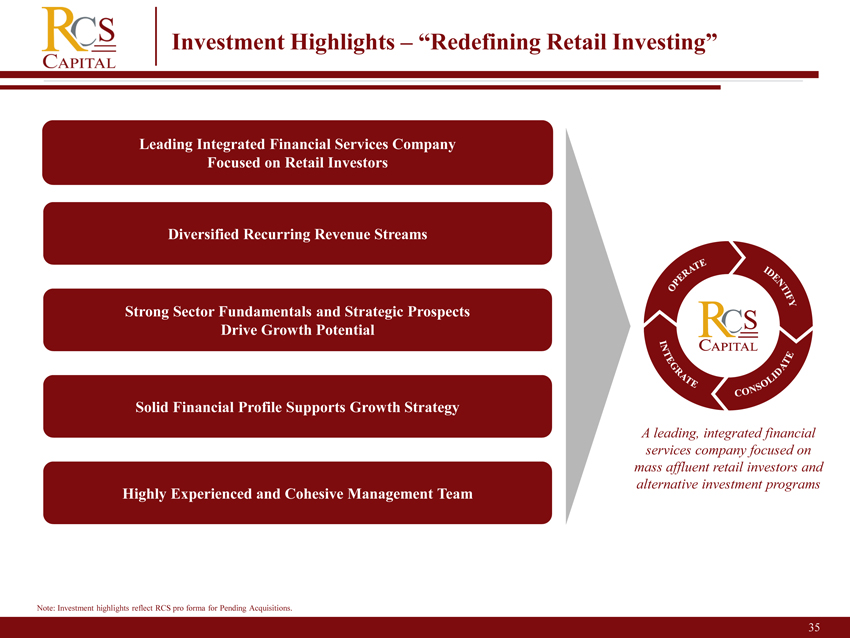
Leading Integrated Financial Services Company Focused on Retail Investors Diversified Recurring Revenue Streams Strong Sector Fundamentals and Strategic Prospects Drive Growth Potential Solid Financial Profile Supports Growth Strategy Highly Experienced and Cohesive Management Team Color Scheme 0 31 97 114 49 177 90 175 30 61 69 82 64 165 217 0 90 130 A leading, integrated financial services company focused on mass affluent retail investors and alternative investment programs 35 Investment Highlights – “Redefining Retail Investing” Note: Investment highlights reflect RCS pro forma for Pending Acquisitions.
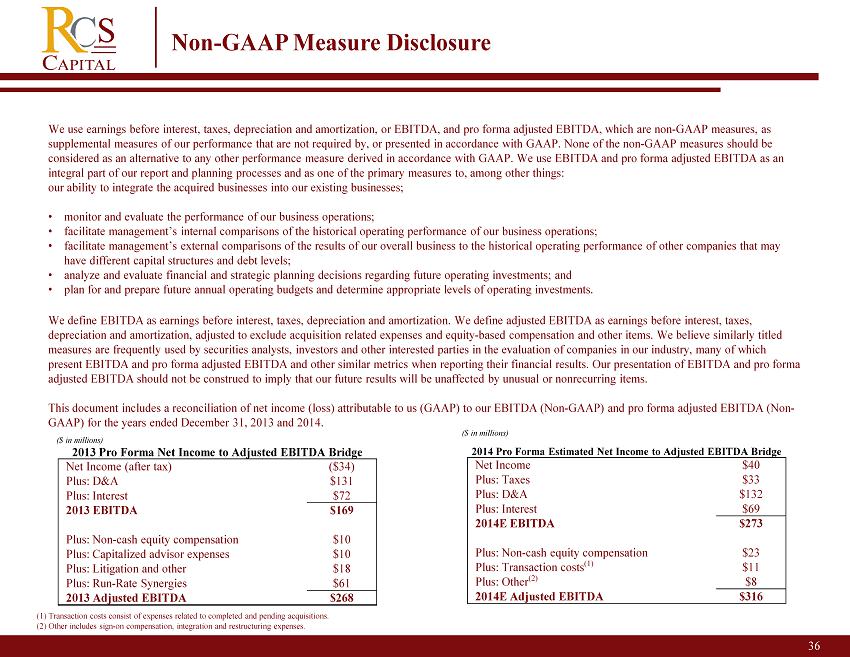
36 2 Non - GAAP Measure Disclosure We use earnings before interest, taxes, depreciation and amortization, or EBITDA, and pro forma adjusted EBITDA, which are no n - G AAP measures, as supplemental measures of our performance that are not required by, or presented in accordance with GAAP . None of the non - GAAP measures should be considered as an alternative to any other performance measure derived in accordance with GAAP. We use EBITDA and pro forma ad jus ted EBITDA as an integral part of our report and planning processes and as one of the primary measures to, among other things: our ability to integrate the acquired businesses into our existing businesses; • monitor and evaluate the performance of our business operations; • facilitate management’s internal comparisons of the historical operating performance of our business operations ; • facilitate management’s external comparisons of the results of our overall business to the historical operating performance of other com pan ies that may have different capital structures and debt levels; • analyze and evaluate financial and strategic planning decisions regarding future operating investments; and • plan for and prepare future annual operating budgets and determine appropriate levels of operating investments. We define EBITDA as earnings before interest, taxes, depreciation and amortization. We define adjusted EBITDA as earnings before in terest, taxes, depreciation and amortization, adjusted to exclude acquisition related expenses and equity - based compensation and other items. W e believe similarly titled measures are frequently used by securities analysts, investors and other interested parties in the evaluation of companies in ou r industry, many of which present EBITDA and pro forma adjusted EBITDA and other similar metrics when reporting their financial results. Our presentati on of EBITDA and pro forma adjusted EBITDA should not be construed to imply that our future results will be unaffected by unusual or nonrecurring items . This document includes a reconciliation of net income (loss) attributable to us (GAAP) to our EBITDA (Non - GAAP) and pro forma adjusted EBITDA (Non - GAAP) for the years ended December 31, 2013 and 2014. 2014 Pro Forma Estimated Net Income to Adjusted EBITDA Bridge Net Income $ 40 Plus: Taxes $ 33 Plus: D&A $132 Plus: Interest $69 2014E EBITDA $ 273 Plus: Non - cash equity compensation $23 Plus: Transaction costs (1) $11 Plus: Other (2) $8 2014E Adjusted EBITDA $ 316 (1) Transaction costs consist of expenses related to completed and pending acquisitions . (2) Other includes sign - on compensation, integration and restructuring expenses. 2013 Pro Forma Net Income to Adjusted EBITDA Bridge Net Income (after tax) ($34) Plus: D&A $131 Plus: Interest $72 2013 EBITDA $169 Plus: Non - cash equity compensation $10 Plus: Capitalized advisor expenses $10 Plus: Litigation and other $18 Plus: Run - Rate Synergies $61 2013 Adjusted EBITDA $268 ($ in millions) ($ in millions)