Attached files
| file | filename |
|---|---|
| 8-K - 8-K - HD Supply Holdings, Inc. | a14-15666_18k.htm |
Exhibit 99.1
|
|
Citi Global Water Investment Conference June 19, 2014 |
|
|
Disclaimers Forward-Looking Statements This presentation includes “forward-looking statements” within the meaning of Section 27A of the Securities Act and Section 21E of the Exchange Act. Forward-looking statements are subject to known and unknown risks and uncertainties, many of which may be beyond our control. We caution you that the forward-looking information presented herein is not a guarantee of future events, and that actual events may differ materially from those made in or suggested by the forward-looking information contained in this presentation. In addition, forward-looking statements generally can be identified by the use of forward-looking terminology such as “may,” “plan,” “seek,” “comfortable with,” “will,” “expect,” “intend,” “estimate,” “anticipate,” “believe” or “continue” or the negative thereof or variations thereon or similar terminology. A number of important factors could cause actual events to differ materially from those contained in or implied by the forward-looking statements, including those factors discussed in our filings with the U.S. Securities & Exchange Commission’s (the “SEC”), including our annual report on Form 10-K, as amended, for the year ended February 2, 2014, and those described in our other filings with the SEC from time to time, which can be found at the SEC’s website www.sec.gov. Any forward-looking information presented herein is made only as of the date of this presentation, and we do not undertake any obligation to update or revise any forward-looking information to reflect changes in assumptions, the occurrence of unanticipated events, or otherwise. Non-GAAP Financial Measures HD Supply supplements its reporting net income (loss) with non-GAAP measurements, including Adjusted EBITDA, Adjusted net income (loss) and Adjusted net income (loss) per share. This supplemental information should not be considered in isolation or as a substitute for the GAAP measurements. Additional information regarding Adjusted EBITDA, Adjusted net income (loss) and Adjusted net income (loss) per share referred to in this presentation can be found in our current report on Form 8-K, filled on June 10, 2014, and in our other filings with the SEC, which can be found at the SEC’s website www.sec.gov. |
|
|
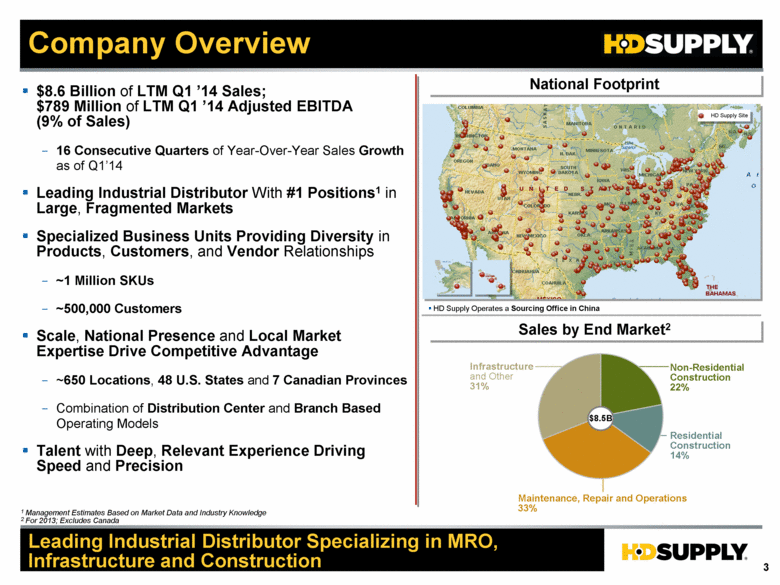
Company Overview $8.6 Billion of LTM Q1 ’14 Sales; $789 Million of LTM Q1 ’14 Adjusted EBITDA (9% of Sales) 16 Consecutive Quarters of Year-Over-Year Sales Growth as of Q1’14 Leading Industrial Distributor With #1 Positions1 in Large, Fragmented Markets Specialized Business Units Providing Diversity in Products, Customers, and Vendor Relationships ~1 Million SKUs ~500,000 Customers Scale, National Presence and Local Market Expertise Drive Competitive Advantage ~650 Locations, 48 U.S. States and 7 Canadian Provinces Combination of Distribution Center and Branch Based Operating Models Talent with Deep, Relevant Experience Driving Speed and Precision National Footprint HD Supply Operates a Sourcing Office in China Sales by End Market2 Maintenance, Repair and Operations 33% Residential Construction 14% Non-Residential Construction 22% Infrastructure and Other 31% $8.5B Leading Industrial Distributor Specializing in MRO, Infrastructure and Construction 1 Management Estimates Based on Market Data and Industry Knowledge 2 For 2013; Excludes Canada HD Supply Site |
|
|
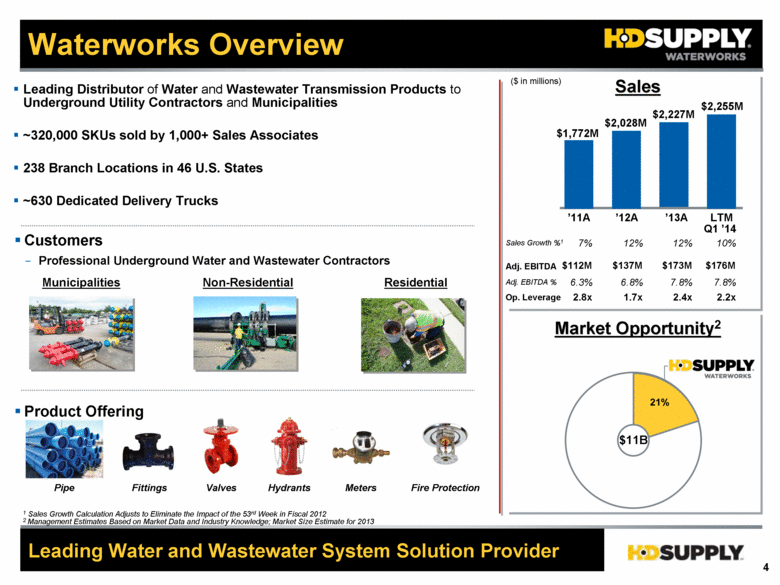
Waterworks Overview Product Offering Pipe Fittings Valves Hydrants Fire Protection Meters Leading Water and Wastewater System Solution Provider Leading Distributor of Water and Wastewater Transmission Products to Underground Utility Contractors and Municipalities ~320,000 SKUs sold by 1,000+ Sales Associates 238 Branch Locations in 46 U.S. States ~630 Dedicated Delivery Trucks Municipalities 21% $11B Customers Professional Underground Water and Wastewater Contractors Residential Non-Residential Market Opportunity2 ($ in millions) Sales 1 Sales Growth Calculation Adjusts to Eliminate the Impact of the 53rd Week in Fiscal 2012 2 Management Estimates Based on Market Data and Industry Knowledge; Market Size Estimate for 2013 $2,227M ’13A $2,028M ’12A $1,772M ’11A $2,255M $173M 7.8% Adj. EBITDA Adj. EBITDA % $137M 6.8% 2.4x Op. Leverage 1.7x 12% Sales Growth %1 12% $112M 6.3% 2.8x 7% $176M 7.8% 2.2x 10% LTM Q1 ’14 |
|
|
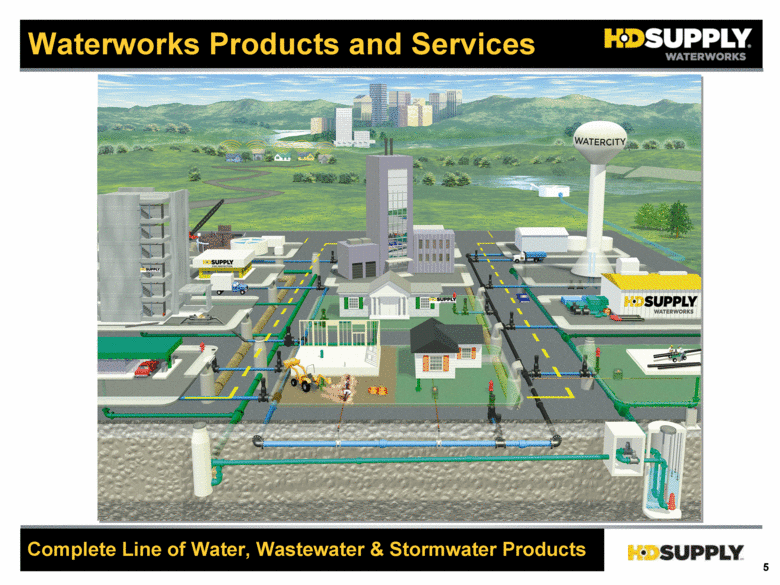
Waterworks Products and Services Complete Line of Water, Wastewater & Stormwater Products |
|
|
[LOGO] |


