Attached files
| file | filename |
|---|---|
| 8-K - 8-K - ABERCROMBIE & FITCH CO /DE/ | williamblairconferencejune.htm |
| EX-99.2 - TRANSCRIPT - ABERCROMBIE & FITCH CO /DE/ | anftranscript20140611wil.htm |
WILLIAM BLAIR 34TH ANNUAL GROWTH STOCK CONFERENCE JUNE 11, 2014
SAFE HARBOR STATEMENT UNDER THE PRIVATE SECURITIES LITIGATION REFORM ACT OF 1995 A&F cautions that any forward-looking statements (as such term is defined in the Private Securities Litigation Reform Act of 1995) contained in this presentation or made by management or spokespeople of A&F involve risks and uncertainties and are subject to change based on various important factors, many of which may be beyond the Company’s control. Words such as “estimate,” “project,” “plan,” “believe,” “expect,” “anticipate,” “intend,” and similar expressions may identify forward-looking statements. Except as may be required by applicable law, we assume no obligation to publicly update or revise our forward-looking statements. The factors included in the disclosure under the heading “FORWARD-LOOKING STATEMENTS AND RISK FACTORS” in “ITEM 1A. RISK FACTORS” of A&F’s Annual Report on Form 10-K for the fiscal year ended February 1, 2014, in some cases have affected and in the future could affect the Company’s financial performance and could cause actual results for the 2014 fiscal year and beyond to differ materially from those expressed or implied in any of the forward-looking statements included in this presentation or otherwise made by management. OTHER INFORMATION All dollar and share amounts are in 000’s unless otherwise stated. Sub-totals and totals may not foot due to rounding.
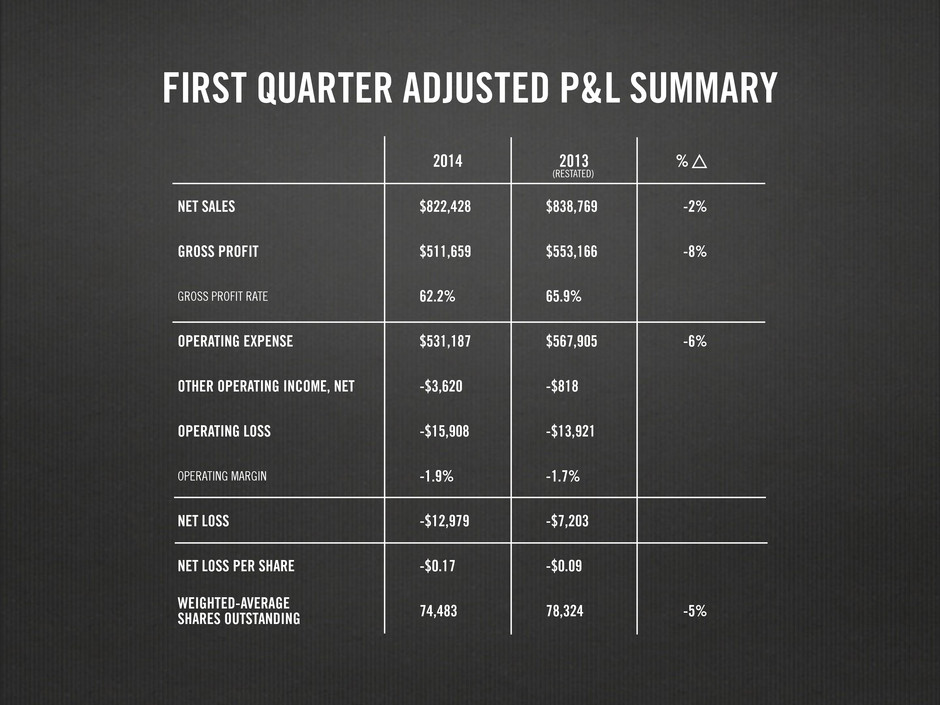
FIRST QUARTER ADJUSTED P&L SUMMARY 2014 2013 % NET SALES $822,428 $838,769 -2% GROSS PROFIT $511,659 $553,166 -8% GROSS PROFIT RATE 62.2% 65.9% OPERATING EXPENSE $531,187 $567,905 -6% OTHER OPERATING INCOME, NET -$3,620 -$818 OPERATING LOSS -$15,908 -$13,921 OPERATING MARGIN -1.9% -1.7% NET LOSS -$12,979 -$7,203 NET LOSS PER SHARE -$0.17 -$0.09 WEIGHTED-AVERAGE SHARES OUTSTANDING 74,483 78,324 -5% (RESTATED)
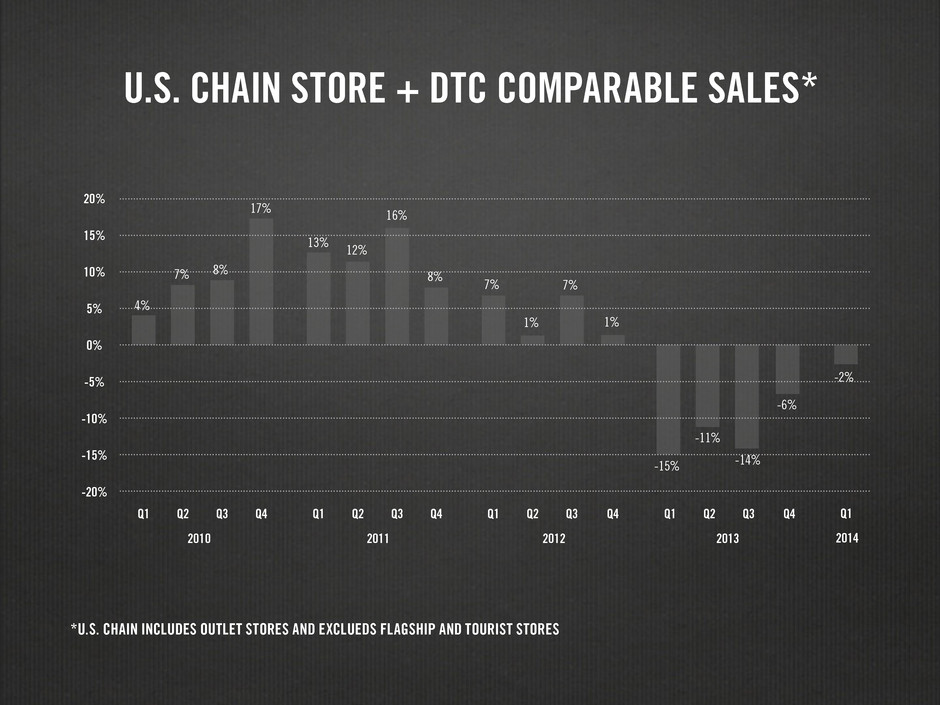
U.S. CHAIN STORE + DTC COMPARABLE SALES* 17% 13% 12% 16% 4% 7% 7% 7% 1% 8% 8% 1% -15% -11% -6% -14% Q2 Q2 Q2 Q2Q4 2010 2011 2012 2013 Q4 Q4 Q4Q1 -20% -15% -10% -5% 5% 10% 15% 20% 0% Q1 Q1 Q1Q3 Q3 Q3 Q3 *U.S. CHAIN INCLUDES OUTLET STORES AND EXCLUEDS FLAGSHIP AND TOURIST STORES Q1 2014 -2%
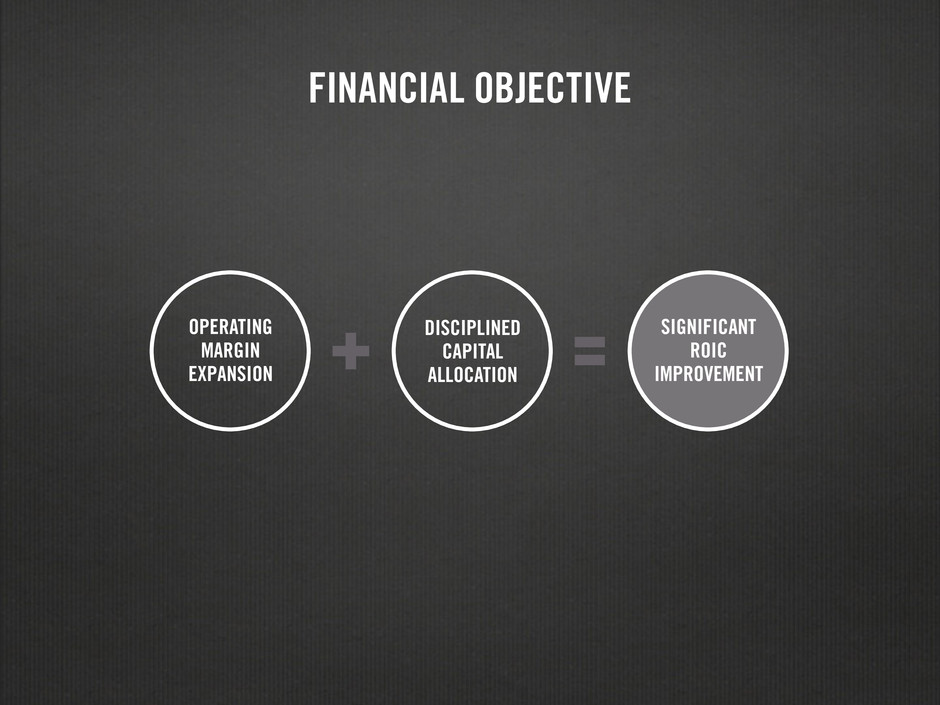
FINANCIAL OBJECTIVE OPERATING MARGIN EXPANSION DISCIPLINED CAPITAL ALLOCATION SIGNIFICANT ROIC IMPROVEMENT
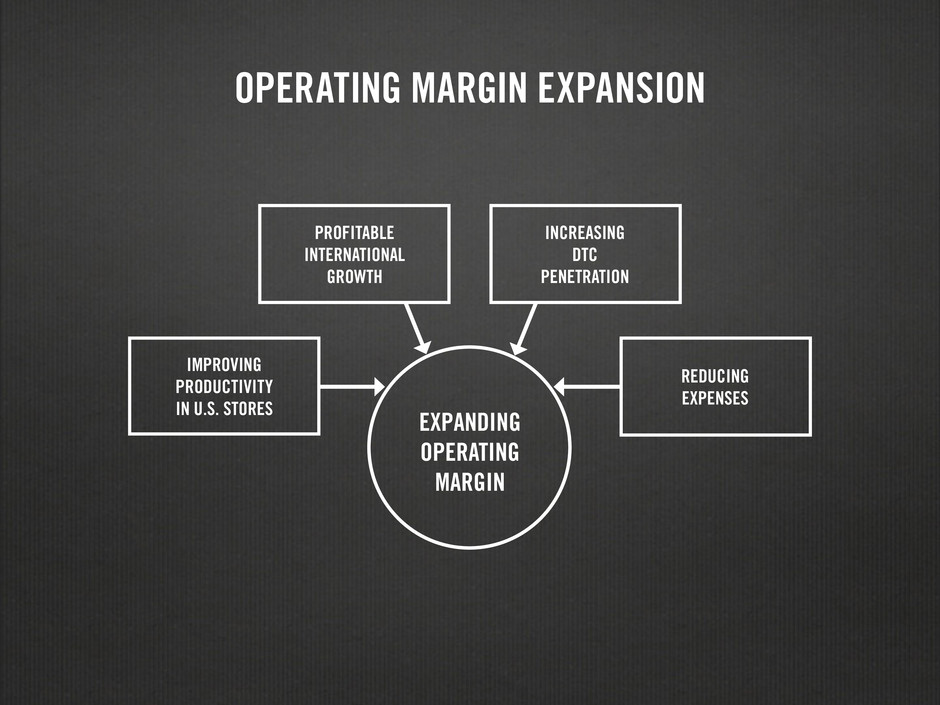
OPERATING MARGIN EXPANSION INCREASING DTC PENETRATION PROFITABLE INTERNATIONAL GROWTH IMPROVING PRODUCTIVITY IN U.S. STORES REDUCING EXPENSES EXPANDING OPERATING MARGIN
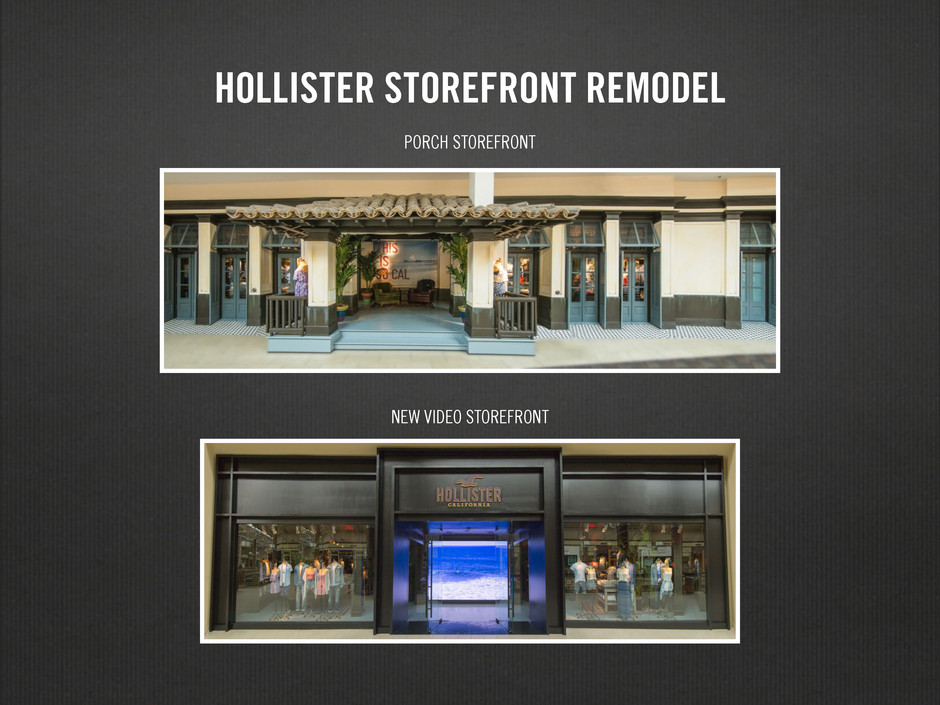
HOLLISTER STOREFRONT REMODEL PORCH STOREFRONT NEW VIDEO STOREFRONT
VIDEO 1 ‐ Hollister Store Fronts
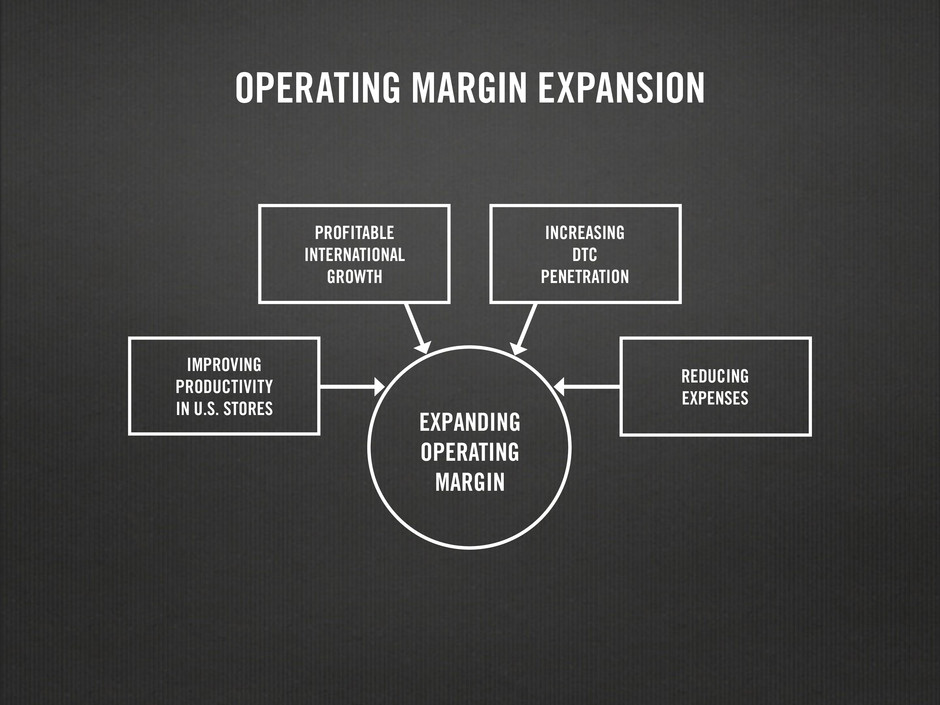
OPERATING MARGIN EXPANSION INCREASING DTC PENETRATION PROFITABLE INTERNATIONAL GROWTH IMPROVING PRODUCTIVITY IN U.S. STORES REDUCING EXPENSES EXPANDING OPERATING MARGIN
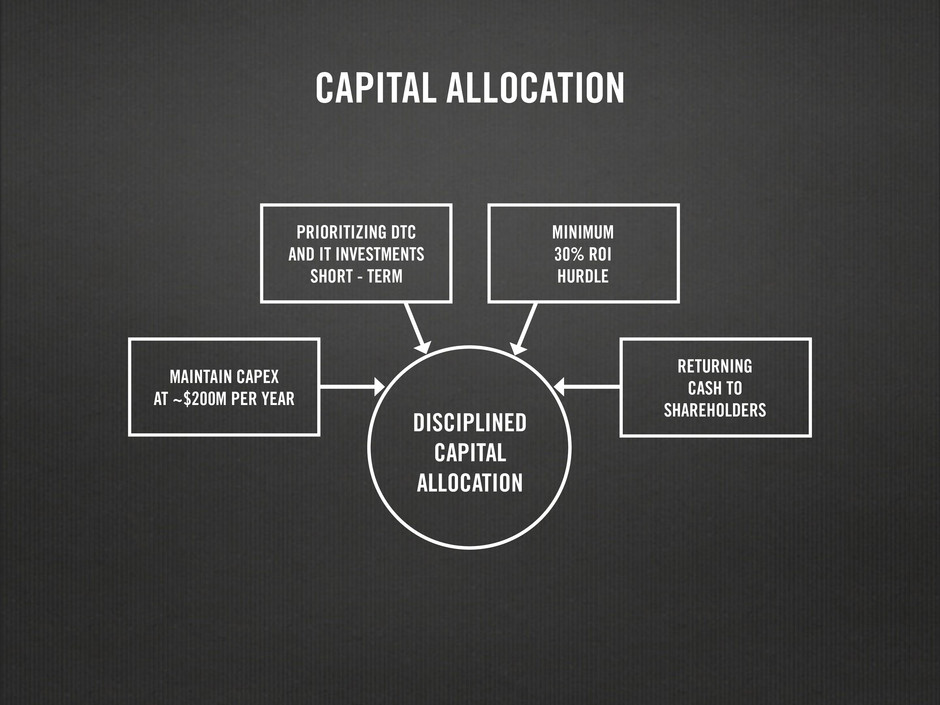
DISCIPLINED CAPITAL ALLOCATION MINIMUM 30% ROI HURDLE PRIORITIZING DTC AND IT INVESTMENTS SHORT - TERM CAPITAL ALLOCATION MAINTAIN CAPEX AT ~$200M PER YEAR RETURNING CASH TO SHAREHOLDERS
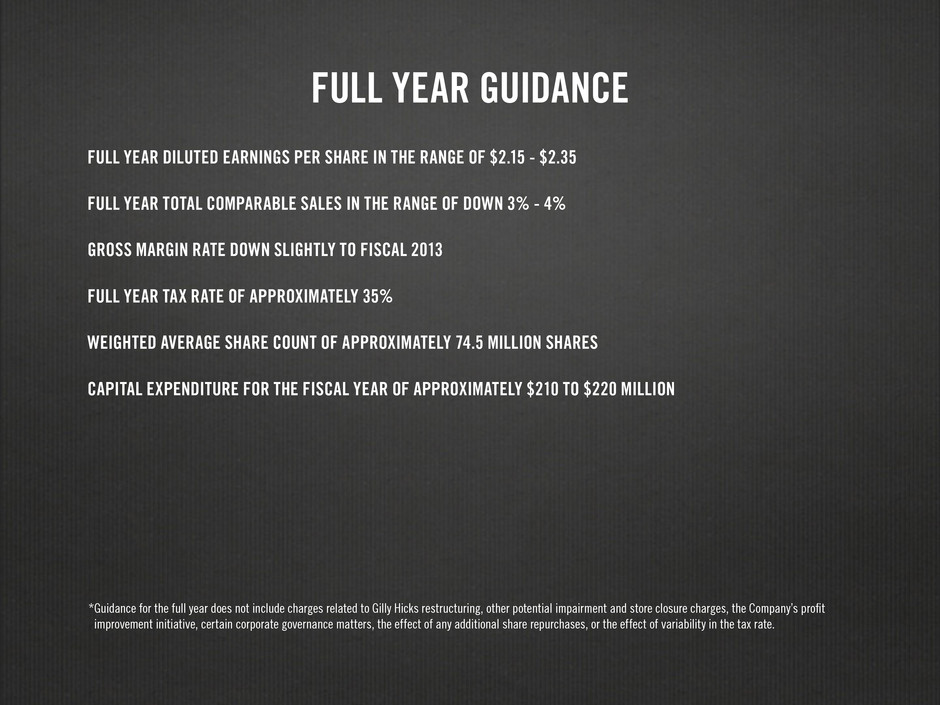
FULL YEAR GUIDANCE FULL YEAR DILUTED EARNINGS PER SHARE IN THE RANGE OF $2.15 - $2.35 FULL YEAR TOTAL COMPARABLE SALES IN THE RANGE OF DOWN 3% - 4% GROSS MARGIN RATE DOWN SLIGHTLY TO FISCAL 2013 FULL YEAR TAX RATE OF APPROXIMATELY 35% WEIGHTED AVERAGE SHARE COUNT OF APPROXIMATELY 74.5 MILLION SHARES CAPITAL EXPENDITURE FOR THE FISCAL YEAR OF APPROXIMATELY $210 TO $220 MILLION * Guidance for the full year does not include charges related to Gilly Hicks restructuring, other potential impairment and store closure charges, the Company’s profit improvement initiative, certain corporate governance matters, the effect of any additional share repurchases, or the effect of variability in the tax rate.
