Attached files
| file | filename |
|---|---|
| 8-K - 8-K - HD Supply Holdings, Inc. | a14-15058_18k.htm |
| EX-99.1 - EX-99.1 - HD Supply Holdings, Inc. | a14-15058_1ex99d1.htm |
Exhibit 99.2
|
|
2014 First-Quarter Performance June 10, 2014 Financial Results and Company Highlights |

|
|
Disclaimers Forward-Looking Statements This presentation includes “forward-looking statements” within the meaning of Section 27A of the Securities Act and Section 21E of the Exchange Act. Forward-looking statements are subject to known and unknown risks and uncertainties, many of which may be beyond our control. We caution you that the forward-looking information presented herein is not a guarantee of future events, and that actual events may differ materially from those made in or suggested by the forward-looking information contained in this presentation. In addition, forward-looking statements generally can be identified by the use of forward-looking terminology such as “may,” “plan,” “seek,” “comfortable with,” “will,” “expect,” “intend,” “estimate,” “anticipate,” “believe” or “continue” or the negative thereof or variations thereon or similar terminology. A number of important factors could cause actual events to differ materially from those contained in or implied by the forward-looking statements, including those factors discussed in our filings with the U.S. Securities & Exchange Commission’s (the “SEC”), including our annual report on Form 10-K, as amended, for the year ended February 2, 2014, which can be found at the SEC’s website www.sec.gov. Any forward-looking information presented herein is made only as of the date of this presentation, and we do not undertake any obligation to update or revise any forward-looking information to reflect changes in assumptions, the occurrence of unanticipated events, or otherwise. Non-GAAP Financial Measures HD Supply supplements its reporting net income (loss) with non-GAAP measurements, including Adjusted EBITDA, Adjusted net income (loss) and Adjusted net income (loss) per share. This supplemental information should not be considered in isolation or as a substitute for the GAAP measurements. Additional information regarding Adjusted EBITDA, Adjusted net income (loss) and Adjusted net income (loss) per share referred to in this presentation is included at the end of this presentation under “Reconciliation of Non-GAAP Measures.” |
|
|
Q1’14 Performance Highlights +400 BPs of Growth in Excess of Estimated Market Growth +6% Sales Growth Versus Prior Year +400 Basis Points Versus Market Estimate1 $15M of Investment in Strategic Growth Initiatives Across 5 Growth Strategies: Sell More to Existing Customers (i.e., Share of Wallet) Introduce New Products and Services Expand the Channels to Reach Our Customers (e.g., Internet, Catalog, Mobility) Acquire New Customers Enter New Geographies (i.e., Open New Locations) +20 Basis Points Gross Margin Improvement Versus Prior Year +15% Adjusted EBITDA Growth Versus Prior Year 2.8x Operating Leverage2 1 Management estimate; market estimate is management estimate of the growth of our markets based on multiple quantitative and qualitative inputs 2 Operating Leverage is defined as Adjusted EBITDA growth divided by total Sales growth |
|
|
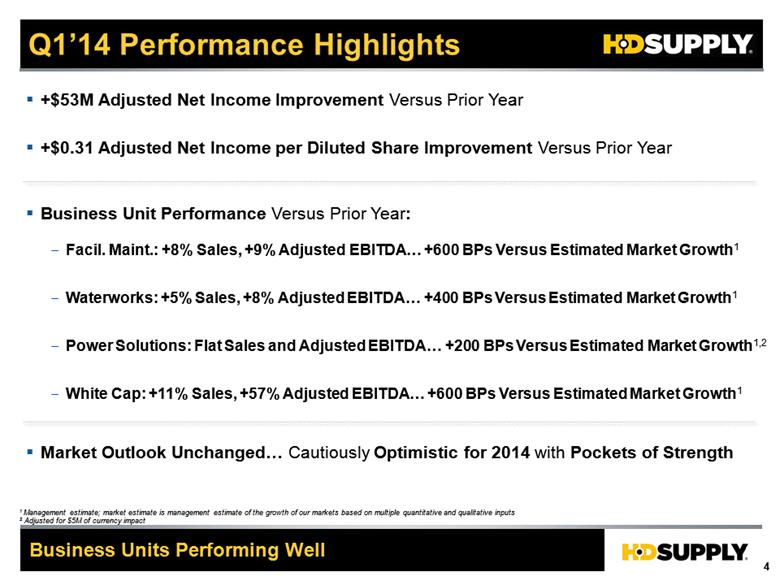
Q1’14 Performance Highlights Business Units Performing Well +$53M Adjusted Net Income Improvement Versus Prior Year +$0.31 Adjusted Net Income per Diluted Share Improvement Versus Prior Year Business Unit Performance Versus Prior Year: Facil. Maint.: +8% Sales, +9% Adjusted EBITDA +600 BPs Versus Estimated Market Growth1 Waterworks: +5% Sales, +8% Adjusted EBITDA +400 BPs Versus Estimated Market Growth1 Power Solutions: Flat Sales and Adjusted EBITDA +200 BPs Versus Estimated Market Growth1,2 White Cap: +11% Sales, +57% Adjusted EBITDA +600 BPs Versus Estimated Market Growth1 Market Outlook Unchanged Cautiously Optimistic for 2014 with Pockets of Strength 1 Management estimate; market estimate is management estimate of the growth of our markets based on multiple quantitative and qualitative inputs 2 Adjusted for $5M of currency impact |
|
|
Refreshed Brand Structure Customer-Centric Brand Enhancements Refreshed Prior |

|
|
Q1’14 Financial Results $2,048M $2,161M +6% Gross Profit Gross Margin % Operating Income Adj. EBITDA % Op. Income % $593M $631M 29.0% 29.2% $165M $190M $101M $119M 8.1% 8.8% 5.5% +6% +20 BPs +70 BPs +15% +6% Sales Growth; +15% Adjusted EBITDA Growth in Q1’14 ($ in millions, except per share data) ($14M) $39M +$53M +400 BPs of Growth in Excess of Estimated Market Growth3 in Q1’14 Q1’14 Sales Growth From: $83M of Growth Initiatives $35M of End Market Growth ($7M) of FX Impact $15M of Growth Initiative Investment in Q1’14 2.8x Q1’14 Operating Leverage4 +18% Sales 1 During the fourth quarter of fiscal 2013, the company decided to dispose of its Litemor business, a specialty lighting distributor included within the HD Supply Canada business. The results of operations for first quarter 2013 are revised to reflect the Litemor operations as discontinued operations. 2 See appendix slides 22 and 23 for a reconciliation of Adjusted EBITDA and Adjusted Net Income (Loss) to Net Income (Loss) 3 Management estimate; market estimate is management estimate of the growth of our markets based on multiple quantitative and qualitative inputs 4 Operating Leverage is defined as Adjusted EBITDA growth divided by total Sales growth Note: “VPY” denotes Versus Prior Year Q1’131 Adj. EBITDA2 VPY Adj. Net Income (Loss)2 4.9% +60 BPs Q1’14 ($0.11) $0.20 +$0.31 Per Diluted Share |
|
|
Q1’14 Segment Performance Q1’14 $604M $551M $461M $344M Adj. EBITDA $109M $41M $18M $22M Operating Leverage1 1.2x 1.5x nmf 5.2x Sales ($ in millions) Business Units Performing Well Q1’13 $561M $523M $462M $310M $100M $38M +5% $18M (0%) VPY +8% +9% VPY VPY VPY +8% - +11% +57% $14M 1 Operating Leverage is defined as Adjusted EBITDA growth divided by total Sales growth Note: “VPY” denotes Versus Prior Year Q1’14 Q1’13 Q1’14 Q1’13 Q1’14 Q1’13 |

|
|
Liquidity and Capital Structure Q1’14 Debt Balances Sec. ABL Sec. Term Loan Sec. 1st Lien Notes Sec. 2nd Lien Notes Unsec. Sr. Notes Unsec. Sr. Notes $550 1,267 675 1,000 1,275 6/28/18 6/28/18 4/15/19 4/15/20 7/15/20 7/15/20 Gross Debt1 Less Cash Net Debt $5,559 173 $5,732 Facility Balance2 Maturity 1 For a discussion of the risk of a change of control on our tax net operating losses, see the risk factor entitled “Our NOL carryforwards could be limited if we experience an ownership change as defined in the Internal Revenue Code” in our prospectus related to our secondary public offering filed with the U.S. Securities and Exchange Commission on May 2, 2014 2 Net of original issue discount and premium 3 Represents the stated rate of interest, without including the effect of discounts or premiums 4 Subject to applicable redemption price terms $909M of Liquidity with No Near Term Debt Maturities ($ in millions, unless otherwise noted) 1.65% 4.0% 8.125% 11.0% 11.5% 7.5% Interest Rate3 965 n/a now 4/15/15 4/15/16 10/15/16 10/15/16 Soft Call Date4 $5.6B Net Debt at the End of Q1’14 $206M of Cash Interest Paid in Q1’14 $909M Liquidity at the End of Q1’14 $1M Cash Taxes in Q1’14 Favorable Tax Asset with Significant Gross Federal Net Operating Loss Carryforwards of $2.3B ($1B Tax-affected Amount of Federal and State NOLs)1 ~$62M of Estimated GAAP Taxes for FY’14 |
|
|
YTD’14 Monthly Average Daily Sales (%) HD Supply Average Daily Sales Growth VPY February and March Adverse Weather Impacted Sequential Trends Feb. 9.8% 2.2% -3.9% 9.4% 4.1% Apr. 5.7% 6.2% 8.5% 12.8% 7.5% 9.6% May 8.6% 12.3% 6.4% 13.7% 8.1% ’14 Selling Days 20 25 19 20 7.0% -6.7% 9.8% ’13 Selling Days 20 25 19 20 ’12 Selling Days 20 25 20 20 Mar. 4.2% Facilities Maintenance Waterworks Power Solutions Construction & Industrial1 1 Formerly White Cap (Preliminary) |

|
|
+14% +10% +10% +5% Q2’14 Guidance 7% and 12% Sales and EBITDA Growth, Respectively at Midpoint of Guidance Ranges $2,450M $2,350M $219M $2,237M $250M $240M VPY Q2’13 Q2’14 Q2’13 Q2’14 Q2’14 Net Sales Adj. EBITDA Adj. Net Income Per Diluted Share1 VPY 1 Q2’14 Adjusted Net Income per Share range assumes a fully diluted weighted average share count of 200 million Note: “VPY” denotes Versus Prior Year $0.49 $0.42 VPY ($ in millions, except per share amounts) $0.23 . . . . Q2’13 +113% +83% |

|
|
’14 End Market Outlook Cautious Optimism for 2014 Pockets of Strength Preliminary Perspective1 Residential Infrastructure & Other MRO Municipal Power 1 Management estimates (~20%) (~80%) (~25%) (~50%) (~25%) (~25%) (~75%) (~100%) (Approximate End Market Exposure1) FY ’14 End Markets Primary End Market Mid-teens Growth Low Single-digit Growth Down Low Single-digits to Flat +1% to +2% Non- Residential |

|
|
Controllable Execution +300 Basis Points Above Market Estimate 1 Long-term average growth target based on management estimates and aspirations +200 BPs to +500 BPs +300 BPs Long-term Growth Above Market Estimate Targets1 +200 BPs to +500 BPs +200 BPs to +500 BPs +0 BPs to +200 BPs (BPs Above BU End Market Estimate) Sell More to Existing Customers (i.e., Share of Wallet) Introduce New Products and Services Expand the Channels to Reach Our Customers (e.g., Internet, Catalog, Mobility) Acquire New Customers Enter New Geographies (i.e., Open New Locations) Five Growth “Plays” 1. 2. 3. 4. 5. |
|
|
’14 Operating Leverage Framework 1.5x – 2.0x FY’14 Operating Leverage Target; 11% – 14% Implied FY’14 Adjusted EBITDA Growth HDS Market Growth1 Illustrative 4% + Above Market Growth2 300 BPs = End Market Growth Controllable Execution Annual Sales Growth Illustrative Adj. EBITDA Growth Adjusted EBITDA Growth 14.0% HDS Market Growth 10.5% Above Market Growth 7% 2.0x 1.5x Operating Leverage Target3 1 Management estimates 2 Long-term average growth target based on management estimates and aspirations 3 Operating Leverage defined as the percentage change in Adjusted EBITDA divided by the percentage change in Sales; target based on management estimates and aspirations Note: These objectives are forward-looking, are subject to significant business, economic, regulatory and competitive uncertainties and contingencies, many of which are beyond the control of the Company and its management, and are based upon assumptions with respect to future decisions, which are subject to change. Actual results will vary and those variations may be material. For discussion of some of the important factors that could cause these variations, please consult the “Risk Factors” section of Form 10-K, as amended, for the year ended February 2, 2014. Nothing in this presentation should be regarded as a representation by any person that these objectives will be achieved and the Company undertakes no duty to update its objectives. |

|
|
Q&A We Supply the Products and Services to Build Your City and Keep it Running |

|
|
Concluding Remarks Solid Performance +6% Sales Growth and +15% Adjusted EBITDA Growth in Q1’14 VPY Severe February and March Weather Impacts Data Interpretation Pockets of Construction Strength Cautiously Optimistic for 2014 Execution to Deliver Profitable Growth in Excess of Market Growth Estimate Customer-Centric Model Always Focused on Getting Better and Faster Early Innings of Our Full Potential Note: “VPY” denotes versus prior year |
|
|
Appendix HD Supply Proprietary and Confidential |
|
|
Monthly Average Daily Sales Growth – Organic (%) HD Supply Organic Average Daily Sales Growth VPY1 6% Organic Average Daily Sales Growth in Q1’14 8.6% May 8.2% Jun. 9.3% 7.7% 4.4% 10.6% 9.8% 9.2% 2.5% 9.9% 8.2% Jul. 8.8% 11.1% 3.8% 7.3% 5.8% Aug. 1.6% 11.2% -0.4% 10.5% 7.5% Sep. 6.0% 11.7% 1.4% 12.4% 6.1% Oct. 4.5% 9.3% 1.3% 9.5% 8.6% Nov. 8.1% 9.7% 7.4% 9.2% -2.0% Dec. 0.6% -7.5% -2.8% 2.3% 11.5% Jan. 10.6% 6.0% 10.4% 19.9% Feb. 9.8% 2.2% -3.9% 9.4% ’14 Selling Days ’13 Selling Days 19 19 20 20 24 24 20 20 19 19 25 25 18 18 19 19 24 24 ’12 Selling Days 20 19 24 20 19 25 18 20 28 (VPY%) 4.1% 1 Adjusted for Acquisitions, Crown Bolt Contract Amendment and Selling Days 2 Formerly White Cap Apr. May Mar. 20 20 20 20 20 20 25 25 25 19 19 20 FY 2013 FY 2014 4.2% 8.1% 7.0% -6.7% 9.8% 7.5% 5.7% 6.2% 8.5% 12.8% 9.6% 8.6% 12.3% 6.4% 13.7% Facil. Maint. Waterworks Power Solutions Const. & Ind.2 (Preliminary) |
|
|
Monthly Average Daily Sales Growth (%) HD Supply Average Daily Sales Growth VPY 10% Average Daily Sales Growth in May ’14 10.5% May 10.0% Jun. 13.1% 12.2% 4.4% 10.6% 13.0% 14.1% 2.5% 9.9% 19 19 20 20 9.1% Jul. 9.3% 15.7% 3.8% 7.3% 24 24 6.5% Aug. 1.6% 15.1% -0.4% 10.5% 20 20 8.3% Sep. 6.0% 15.7% 1.4% 12.4% 19 19 6.8% Oct. 4.5% 13.0% 1.3% 9.5% 25 25 9.3% Nov. 8.1% 13.7% 7.4% 9.2% 18 18 -2.2% Dec. 0.6% -7.5% -2.8% 2.3% 19 19 8.6% Jan. 10.6% 6.0% 10.4% 19.9% 24 24 4.1% Feb. 9.8% 2.2% -3.9% 9.4% 20 20 20 19 24 20 19 25 18 20 28 20 (VPY%) 4.2% Mar. 8.1% 7.0% -6.7% 9.8% 20 20 20 7.5% Apr. 5.7% 6.2% 8.5% 12.8% 25 25 25 9.6% May 8.6% 12.3% 6.4% 13.7% 19 19 20 Facil. Maint. Waterworks Power Solutions Const. & Ind.1 ’14 Selling Days ’13 Selling Days ’12 Selling Days 1 Formerly White Cap FY 2013 FY 2014 (Preliminary) |
|
|
Monthly Net Sales ($) HD Supply Net Sales $712M May ’14 Preliminary Sales ($ in millions) May Jun. Jul. Aug. Sep. Oct. Nov. Dec. Jan. Feb. $179 $175 $133 $99 $203 $193 $147 $109 $256 $233 $176 $128 $199 $201 $141 $108 $184 $194 $136 $105 $227 $238 $195 $139 $162 $163 $145 $95 $153 $139 $134 $88 $207 $168 $174 $112 $176 $146 $134 $96 $609M $650M $717M $870M $714M $682M $877M $627M $571M $731M ’14 Selling Days ’13 Selling Days 19 19 20 20 24 24 20 20 19 19 25 25 18 18 19 19 24 24 ’12 Selling Days 20 19 24 20 19 25 18 20 28 20 20 20 Mar. Apr. May $184 $168 $140 $106 $244 $237 $187 $142 $195 $197 $142 $113 $712M $893M 20 20 20 25 25 25 19 19 20 $659M Facil. Maint. Waterworks Power Solutions Const. & Ind.1 1 Formerly White Cap FY 2013 FY 2014 (Preliminary) |
|
|
Average Daily Sales Growth – Organic ~6% Organic Average Daily Sales Growth in Q1’14 Q1 Organic Average Daily Sales Growth VPY1 1 Adjusted for Acquisitions, Crown Bolt Contract Amendment, and Selling Days 2 Formerly White Cap Selling Days 65 63 64 61 (VPY%) Q2 Q3 Q4 2011 Facil. Maintenance Waterworks Power Solutions Construction & Industrial2 HD Supply 9.3% 8.6% 13.5% 13.8% -5.4% 8.5% 3.5% 15.0% 16.2% 12.2% 11.1% 5.5% 5.4% 11.8% 18.4% 25.9% 3.5% 8.5% 9.2% 13.3% 11.2% 5.0% 11.1% 15.1% 8.6% 253 2012 Facil. Maintenance Waterworks Power Solutions Construction & Industrial2 HD Supply 13.7% 11.4% 14.5% 10.1% 17.1% 6.3% 12.8% 9.3% 5.1% 6.0% 9.1% 11.1% 23.1% 20.4% 14.8% 13.8% 14.0% 9.7% 12.5% 10.1% Selling Days 65 63 64 66 12.3% 11.0% 7.8% 17.7% 11.4% 258 FY 9.6% 9.4% 8.2% 9.5% 11.3% 3.6% 16.5% 9.4% 11.1% 8.4% 2013 Facil. Maintenance Waterworks Power Solutions HD Supply 6.9% 3.3% 5.7% 11.4% 6.7% Selling Days 65 63 64 61 3.9% 10.6% 0.9% 10.7% 6.5% 7.5% 8.2% 5.2% 11.9% 8.2% 253 Construction & Industrial2 7.7% 5.4% -0.2% 11.0% 5.5% 2014 Facil. Maintenance Waterworks Power Solutions HD Supply Selling Days 65 Construction & Industrial2 |
|
|
Operating Leverage 2.8x Operating Leverage in Q1’14 Q1 Operating Leverage1 (VPY%) Q2 Q3 Q4 2011 Facil. Maintenance Waterworks Power Solutions Construction & Industrial2 HD Supply 1.2x 1.5x 0.7x 1.3x nm 1.3x 2.5x 3.6x 1.2x 0.6x 1.2x (6.6x) nm nm 12.2x nm 6.6x 2.9x 1.9x 2.2x 1.1x 2.8x 0.2x nm 2.7x 2012 Facil. Maintenance Waterworks Power Solutions Construction & Industrial2 HD Supply 1.3x 1.2x 1.6x 1.3x 1.7x 2.9x 1.0x 1.8x 3.3x 7.2x 2.6x 10.5x nm 7.7x 4.7x nm 2.7x 2.4x 2.4x 3.1x 1.4x 1.7x 5.1x 12.5x 2.6x FY 1.4x 1.3x 2.7x 2.0x 2.5x (2.8x) 4.5x 3.5x 2.2x 1.7x 2013 Facil. Maintenance Waterworks Power Solutions HD Supply 2.7x 3.7x 4.6x 9.2x 4.4x 1.6x 2.1x - 2.1x 1.9x 1.6x 2.4x 1.6x 3.7x 2.3x Construction & Industrial2 1.2x 1.5x - 5.2x 2.8x 2014 Facil. Maintenance Waterworks Power Solutions HD Supply Construction & Industrial2 1 Operating Leverage is Defined as Adjusted EBITDA Growth Divided by Adjusted Sales Growth. Adjustments Comprise the 53rd Week in fiscal 2012 and the Crown Bolt Amended Agreement. Not Meaningful (“nm”) when Sales Growth is Negative and when Prior Period Adjusted EBITDA is Negative. 2 Formerly White Cap |
|
|
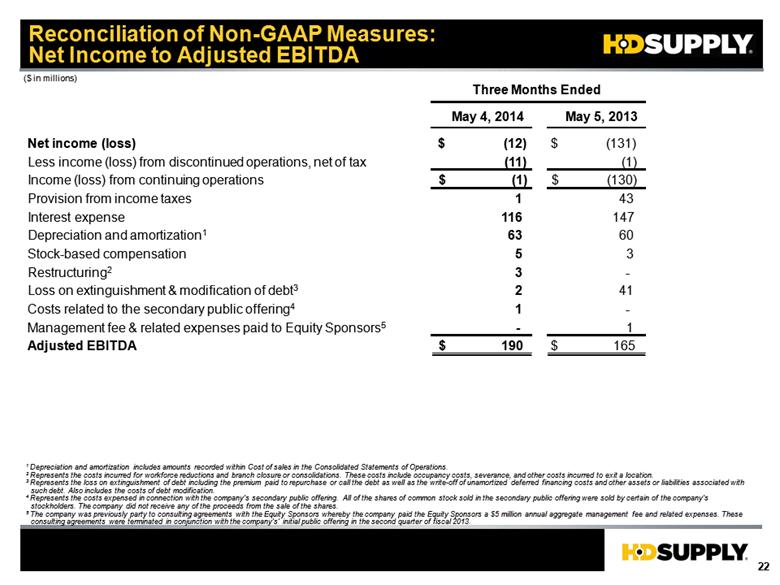
Reconciliation of Non-GAAP Measures: Net Income to Adjusted EBITDA ($ in millions) 1 Depreciation and amortization includes amounts recorded within Cost of sales in the Consolidated Statements of Operations. 2 Represents the costs incurred for workforce reductions and branch closure or consolidations. These costs include occupancy costs, severance, and other costs incurred to exit a location. 3 Represents the loss on extinguishment of debt including the premium paid to repurchase or call the debt as well as the write-off of unamortized deferred financing costs and other assets or liabilities associated with such debt. Also includes the costs of debt modification. 4 Represents the costs expensed in connection with the company’s secondary public offering. All of the shares of common stock sold in the secondary public offering were sold by certain of the company’s stockholders. The company did not receive any of the proceeds from the sale of the shares. 5 The company was previously party to consulting agreements with the Equity Sponsors whereby the company paid the Equity Sponsors a $5 million annual aggregate management fee and related expenses. These consulting agreements were terminated in conjunction with the company’s’ initial public offering in the second quarter of fiscal 2013. May 4, 2014 May 5, 2013 Net income (loss) $ (12) $ (131) Less income (loss) from discontinued operations, net of tax (11) (1) Income (loss) from continuing operations $ (1) $ (130) Provision from income taxes 1 43 Interest expense 116 147 Depreciation and amortization1 63 60 Stock-based compensation 5 3 Restructuring2 3 - Loss on extinguishment & modification of debt3 2 41 Costs related to the secondary public offering4 1 - Management fee & related expenses paid to Equity Sponsors5 - 1 Adjusted EBITDA $ 190 $ 165 Three Months Ended |
|
|
Reconciliation of Non-GAAP Measures: Net Income to Adjusted Net Income ($ in millions, except share and per share amounts) Net income (loss) $ (12) $ (131) Less income (loss) from discontinued operations, net of tax (11) (1) Income (loss) from continuing operations (1) (130) Plus: Provision for income taxes 1 43 Less: Cash income taxes (1) (2) Plus: Amortization of acquisition-related intangible assets1 (other than software) 34 34 Plus: Restructuring2 3 - Plus: Loss on extinguishment & modification of debt3 2 41 Plus: Costs related to the secondary public offering4 1 Adjusted net income (loss) $ 39 $ (14) May 4, 2014 May 5, 2013 Three Months Ended - 1 Estimated Amortization of acquisition-related intangible assets (other than software) for the remainder of FY’14 is expected to be as follows: $34M in Q2’14, $27M in Q3’14 and $10M in Q4’14 2 Represents the costs incurred for workforce reductions and branch closure or consolidations. These costs include occupancy costs, severance, and other costs incurred to exit a location. 3 Represents the loss on extinguishment of debt including the premium paid to repurchase or call the debt as well as the write-off of unamortized deferred financing costs and other assets or liabilities associated with such debt. Also includes the costs of debt modification. 4 Represents the costs expensed in connection with the company’s secondary public offering. Weighted average common shares outstanding (in thousands) Basic 192,859 130,578 Diluted 198,857 130,578 Adjusted Net Income (Loss) Per Share - Basic $0.20 ($0.11) Adjusted Net Income (Loss) Per Share - Diluted $0.20 ($0.11) |
