Attached files
| file | filename |
|---|---|
| 8-K - 8-K - EAGLE BANCORP INC | a14-15118_18k.htm |
| EX-2.1 - EX-2.1 - EAGLE BANCORP INC | a14-15118_1ex2d1.htm |
| EX-99.1 - EX-99.1 - EAGLE BANCORP INC | a14-15118_1ex99d1.htm |
Exhibit 99.2
|
|
Ticker: EGBN www.eaglebankcorp.com Announces the Acquisition of: June 9, 2014 A High Performing Community Bank in Strategic Growth Market |
|
|
1 Forward Looking Statements: This press release contains forward-looking statements within the meaning of the Securities and Exchange Act of 1934, as amended, including statements of goals, intentions, and expectations as to future trends, plans, events or results of Eagle’s operations and policies and regarding general economic conditions. These forward-looking statements include, but are not limited to, statements about (i) the benefits of the merger between EagleBank and VHB (ii) Eagle’s plans, obligations, expectations and intentions. In some cases, forward-looking statements can be identified by use of words such as “may,” “will,” “anticipates,” “believes,” “expects,” “plans,” “estimates,” “potential,” “continue,” “should,” and similar words or phrases. These statements are based upon the beliefs of the management of Eagle as to the expected outcome of future events, current and anticipated economic conditions, nationally and in its market, and their impact on its operations and assets, interest rates and interest rate policy, competitive factors, judgments about the ability of the parties to successfully consummate the merger and to integrate the operations of the two companies, the expected growth opportunities or cost savings resulting from the merger, which may not be fully realized or take longer than expected to realize; the ability of the two companies to avoid customer dislocation or runoff, and employee attrition, during the period leading up to and following the merger, the timing of and any conditions to required regulatory approvals, the demand for and pricing of subordinated debt or other securities, and other conditions which by their nature, are not susceptible to accurate forecast and are subject to significant uncertainty. Factors that could cause results and outcomes to differ materially include, among others, the ability to obtain required regulatory and shareholder approvals; the ability to complete the merger as expected and within the expected timeframe; and the possibility that one or more of the conditions to the completion of the merger may not be satisfied. Because of these uncertainties and the assumptions on which this discussion and the forward-looking statements are based, actual future operations and results in the future may differ materially from those indicated herein. Readers are cautioned against placing undue reliance on such forward-looking statements. Past results are not necessarily indicative of future performance. Eagle and VHB assume no obligation to revise, update, or clarify forward-looking statements to reflect events or conditions after the date of this release. For further information on the Company please contact: Eagle Bancorp, Inc. Ronald D. Paul Chairman, President & CEO 301-986-1800 Virginia Heritage Bank David P. Summers Chairman, President & CEO 703-277-2200 |
|
|
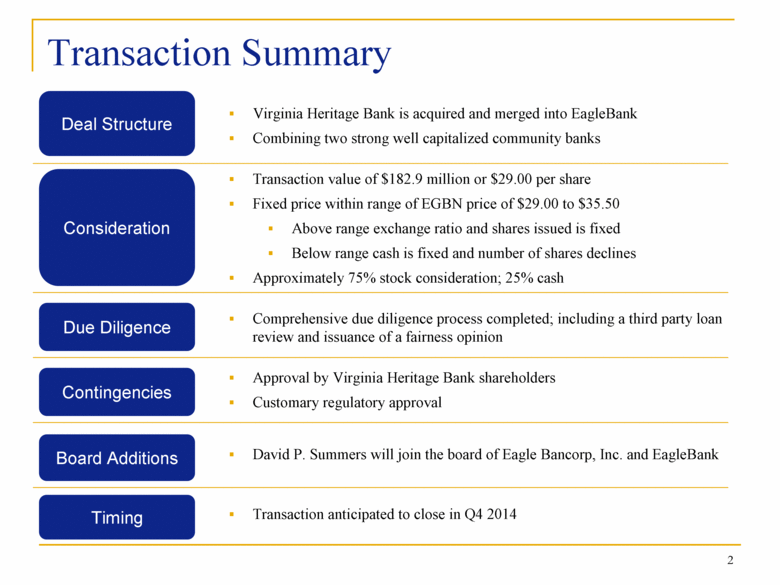
2 Transaction Summary David P. Summers will join the board of Eagle Bancorp, Inc. and EagleBank Deal Structure Consideration Due Diligence Contingencies Timing Board Additions Approval by Virginia Heritage Bank shareholders Customary regulatory approval Comprehensive due diligence process completed; including a third party loan review and issuance of a fairness opinion Transaction value of $182.9 million or $29.00 per share Fixed price within range of EGBN price of $29.00 to $35.50 Above range exchange ratio and shares issued is fixed Below range cash is fixed and number of shares declines Approximately 75% stock consideration; 25% cash Virginia Heritage Bank is acquired and merged into EagleBank Combining two strong well capitalized community banks Transaction anticipated to close in Q4 2014 |
|
|
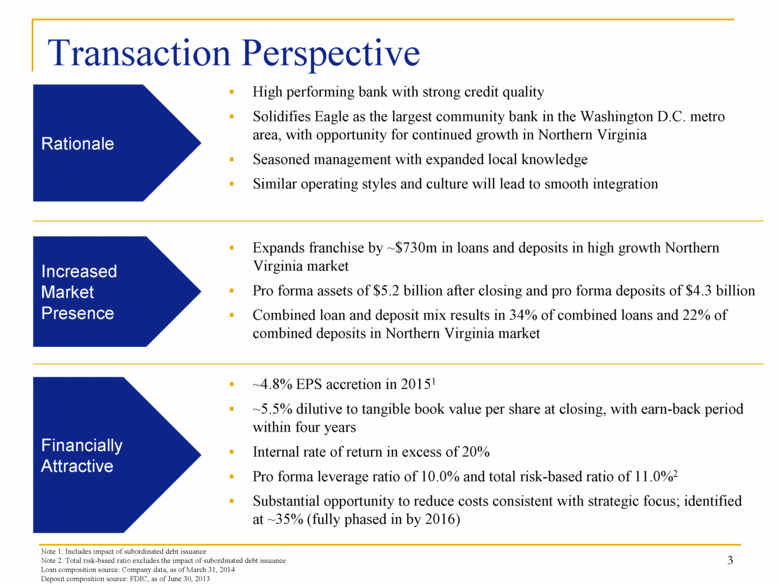
3 Transaction Perspective High performing bank with strong credit quality Solidifies Eagle as the largest community bank in the Washington D.C. metro area, with opportunity for continued growth in Northern Virginia Seasoned management with expanded local knowledge Similar operating styles and culture will lead to smooth integration Rationale Increased Market Presence Financially Attractive Expands franchise by ~$730m in loans and deposits in high growth Northern Virginia market Pro forma assets of $5.2 billion after closing and pro forma deposits of $4.3 billion Combined loan and deposit mix results in 34% of combined loans and 22% of combined deposits in Northern Virginia market ~4.8% EPS accretion in 20151 ~5.5% dilutive to tangible book value per share at closing, with earn-back period within four years Internal rate of return in excess of 20% Pro forma leverage ratio of 10.0% and total risk-based ratio of 11.0%2 Substantial opportunity to reduce costs consistent with strategic focus; identified at ~35% (fully phased in by 2016) Note 1: Includes impact of subordinated debt issuance Note 2: Total risk-based ratio excludes the impact of subordinated debt issuance Loan composition source: Company data, as of March 31, 2014 Deposit composition source: FDIC, as of June 30, 2013 |
|
|
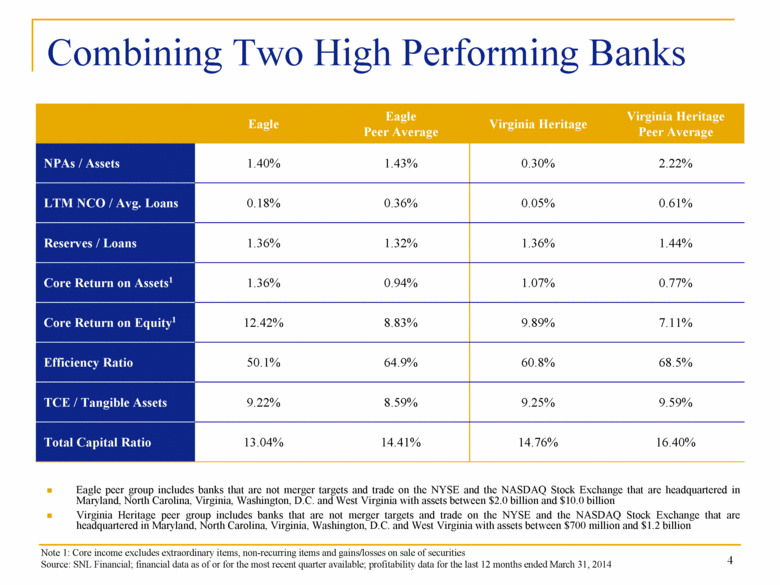
4 Combining Two High Performing Banks Note 1: Core income excludes extraordinary items, non-recurring items and gains/losses on sale of securities Source: SNL Financial; financial data as of or for the most recent quarter available; profitability data for the last 12 months ended March 31, 2014 Eagle Eagle Peer Average Virginia Heritage Virginia Heritage Peer Average NPAs / Assets 1.40% 1.43% 0.30% 2.22% LTM NCO / Avg. Loans 0.18% 0.36% 0.05% 0.61% Reserves / Loans 1.36% 1.32% 1.36% 1.44% Core Return on Assets1 1.36% 0.94% 1.07% 0.77% Core Return on Equity1 12.42% 8.83% 9.89% 7.11% Efficiency Ratio 50.1% 64.9% 60.8% 68.5% TCE / Tangible Assets 9.22% 8.59% 9.25% 9.59% Total Capital Ratio 13.04% 14.41% 14.76% 16.40% Eagle peer group includes banks that are not merger targets and trade on the NYSE and the NASDAQ Stock Exchange that are headquartered in Maryland, North Carolina, Virginia, Washington, D.C. and West Virginia with assets between $2.0 billion and $10.0 billion Virginia Heritage peer group includes banks that are not merger targets and trade on the NYSE and the NASDAQ Stock Exchange that are headquartered in Maryland, North Carolina, Virginia, Washington, D.C. and West Virginia with assets between $700 million and $1.2 billion |
|
|
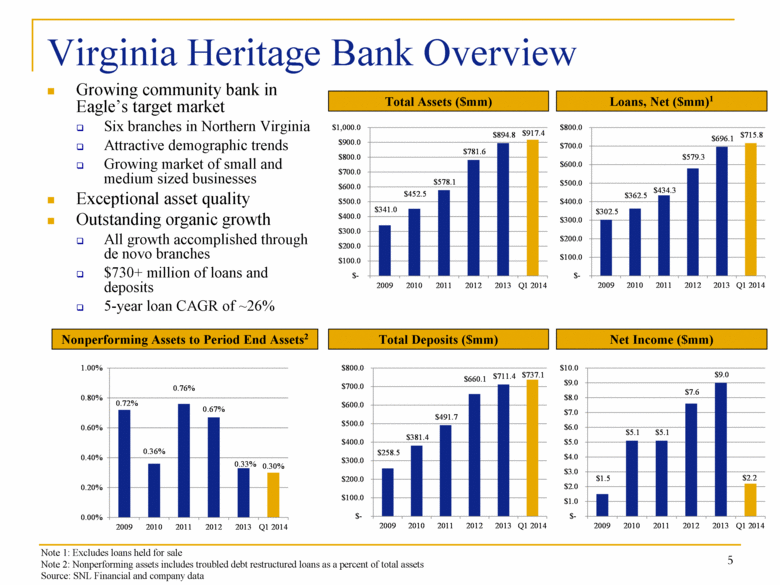
5 Virginia Heritage Bank Overview Growing community bank in Eagle’s target market Six branches in Northern Virginia Attractive demographic trends Growing market of small and medium sized businesses Exceptional asset quality Outstanding organic growth All growth accomplished through de novo branches $730+ million of loans and deposits 5-year loan CAGR of ~26% Loans, Net ($mm)1 Total Assets ($mm) Net Income ($mm) Total Deposits ($mm) Nonperforming Assets to Period End Assets2 Note 1: Excludes loans held for sale Note 2: Nonperforming assets includes troubled debt restructured loans as a percent of total assets Source: SNL Financial and company data $302.5 $362.5 $434.3 $579.3 $696.1 $715.8 $- $100.0 $200.0 $300.0 $400.0 $500.0 $600.0 $700.0 $800.0 2009 2010 2011 2012 2013 Q1 2014 $1.5 $5.1 $5.1 $7.6 $9.0 $2.2 $- $1.0 $2.0 $3.0 $4.0 $5.0 $6.0 $7.0 $8.0 $9.0 $10.0 2009 2010 2011 2012 2013 Q1 2014 0.72% 0.36% 0.76% 0.67% 0.33% 0.30% 0.00% 0.20% 0.40% 0.60% 0.80% 1.00% 2009 2010 2011 2012 2013 Q1 2014 $258.5 $381.4 $491.7 $660.1 $711.4 $737.1 $- $100.0 $200.0 $300.0 $400.0 $500.0 $600.0 $700.0 $800.0 2009 2010 2011 2012 2013 Q1 2014 |
|
|
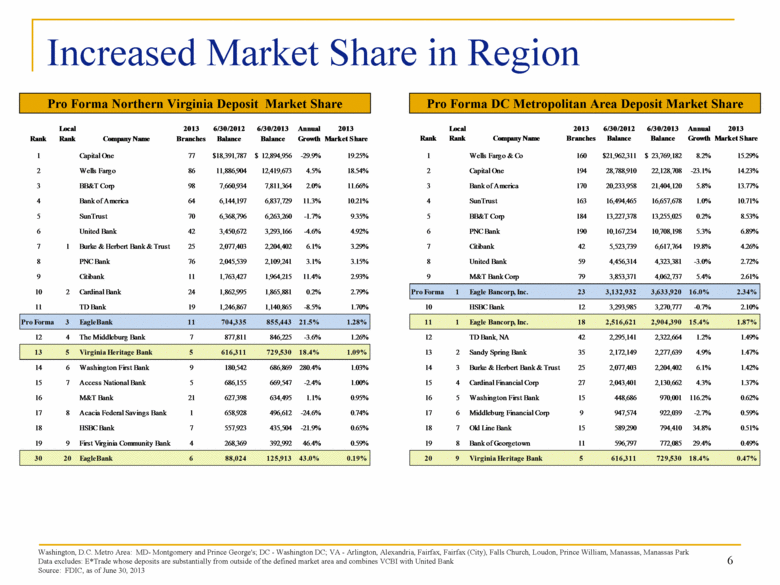
6 Increased Market Share in Region Pro Forma Northern Virginia Deposit Market Share Pro Forma DC Metropolitan Area Deposit Market Share Washington, D.C. Metro Area: MD- Montgomery and Prince George's; DC - Washington DC; VA - Arlington, Alexandria, Fairfax, Fairfax (City), Falls Church, Loudon, Prince William, Manassas, Manassas Park Data excludes: E*Trade whose deposits are substantially from outside of the defined market area and combines VCBI with United Bank Source: FDIC, as of June 30, 2013 Local 2013 6/30/2012 6/30/2013 Annual 2013 Rank Rank Company Name Branches Balance Balance Growth Market Share 1 Wells Fargo & Co 160 21,962,311 $ 23,769,182 $ 8.2% 15.29% 2 Capital One 194 28,788,910 22,128,708 -23.1% 14.23% 3 Bank of America 170 20,233,958 21,404,120 5.8% 13.77% 4 SunTrust 163 16,494,465 16,657,678 1.0% 10.71% 5 BB&T Corp 184 13,227,378 13,255,025 0.2% 8.53% 6 PNC Bank 190 10,167,234 10,708,198 5.3% 6.89% 7 Citibank 42 5,523,739 6,617,764 19.8% 4.26% 8 United Bank 59 4,456,314 4,323,381 -3.0% 2.72% 9 M&T Bank Corp 79 3,853,371 4,062,737 5.4% 2.61% Pro Forma 1 Eagle Bancorp, Inc. 23 3,132,932 3,633,920 16.0% 2.34% 10 HSBC Bank 12 3,293,985 3,270,777 -0.7% 2.10% 11 1 Eagle Bancorp, Inc. 18 2,516,621 2,904,390 15.4% 1.87% 12 TD Bank, NA 42 2,295,141 2,322,664 1.2% 1.49% 13 2 Sandy Spring Bank 35 2,172,149 2,277,639 4.9% 1.47% 14 3 Burke & Herbert Bank & Trust 25 2,077,403 2,204,402 6.1% 1.42% 15 4 Cardinal Financial Corp 27 2,043,401 2,130,662 4.3% 1.37% 16 5 Washington First Bank 15 448,686 970,001 116.2% 0.62% 17 6 Middleburg Financial Corp 9 947,574 922,039 -2.7% 0.59% 18 7 Old Line Bank 15 589,290 794,410 34.8% 0.51% 19 8 Bank of Georgetown 11 596,797 772,085 29.4% 0.49% 20 9 Virginia Heritage Bank 5 616,311 729,530 18.4% 0.47% |
|
|
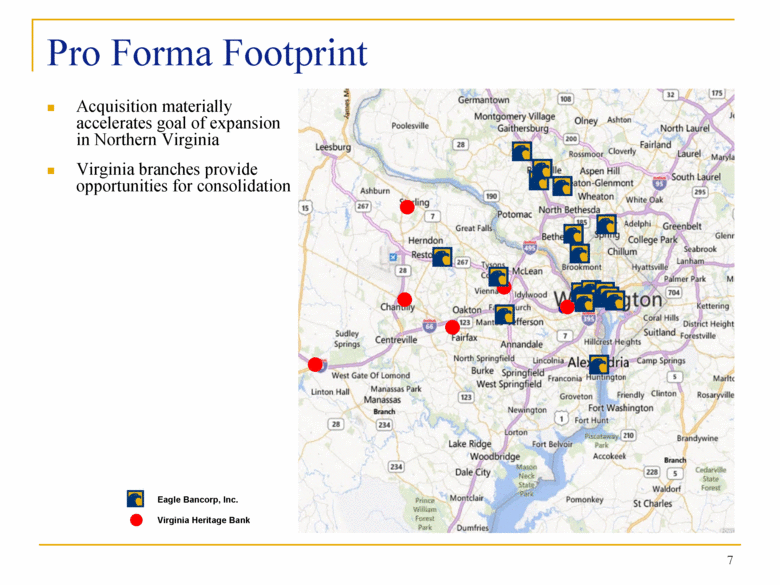
7 Pro Forma Footprint Eagle Bancorp, Inc. Virginia Heritage Bank Acquisition materially accelerates goal of expansion in Northern Virginia Virginia branches provide opportunities for consolidation |
|
|
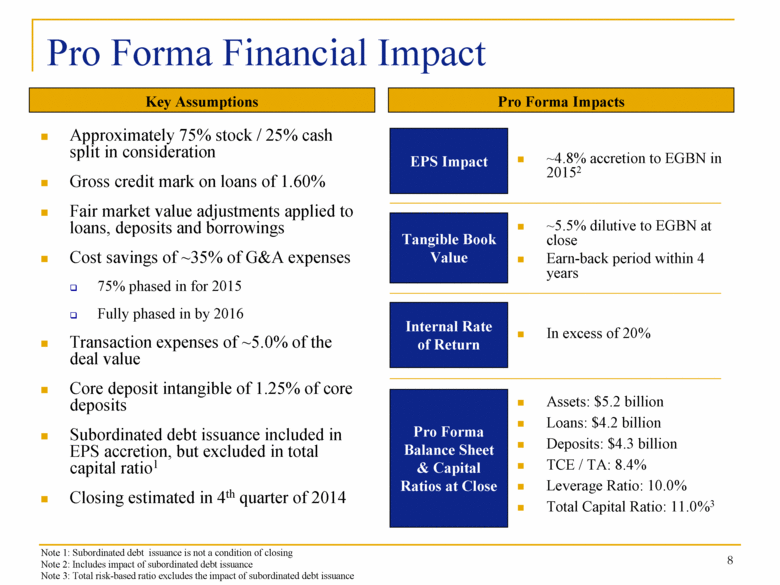
8 Pro Forma Financial Impact Approximately 75% stock / 25% cash split in consideration Gross credit mark on loans of 1.60% Fair market value adjustments applied to loans, deposits and borrowings Cost savings of ~35% of G&A expenses 75% phased in for 2015 Fully phased in by 2016 Transaction expenses of ~5.0% of the deal value Core deposit intangible of 1.25% of core deposits Subordinated debt issuance included in EPS accretion, but excluded in total capital ratio1 Closing estimated in 4th quarter of 2014 Key Assumptions Pro Forma Impacts EPS Impact Tangible Book Value Internal Rate of Return Pro Forma Balance Sheet & Capital Ratios at Close ~4.8% accretion to EGBN in 20152 ~5.5% dilutive to EGBN at close Earn-back period within 4 years In excess of 20% Assets: $5.2 billion Loans: $4.2 billion Deposits: $4.3 billion TCE / TA: 8.4% Leverage Ratio: 10.0% Total Capital Ratio: 11.0%3 Note 1: Subordinated debt issuance is not a condition of closing Note 2: Includes impact of subordinated debt issuance Note 3: Total risk-based ratio excludes the impact of subordinated debt issuance |
|
|
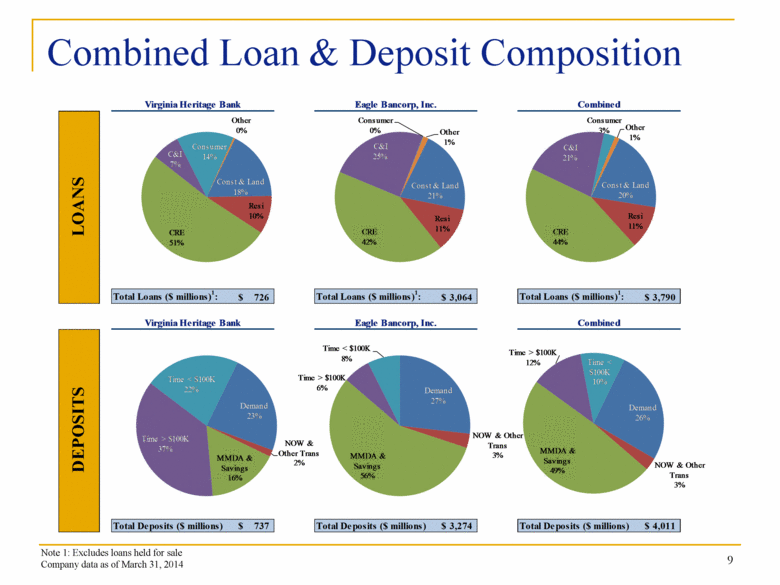
9 Combined Loan & Deposit Composition Note 1: Excludes loans held for sale Company data as of March 31, 2014 Virginia Heritage Bank Eagle Bancorp, Inc. Combined Total Loans ($ millions) 1 : 726 $ Total Loans ($ millions) 1 : 3,064 $ Total Loans ($ millions) 1 : 3,790 $ Virginia Heritage Bank Eagle Bancorp, Inc. Combined Total Deposits ($ millions) 737 $ Total Deposits ($ millions) 3,274 $ Total Deposits ($ millions) 4,011 $ LOANS DEPOSITS Demand 26% NOW & Other Trans 3% MMDA & Savings 49% Time > $100K 12% Time < $100K 10% Const & Land 18% Resi 10% CRE 51% C&I 7% Consumer 14% Other 0% Const & Land 21% Resi 11% CRE 42% C&I 25% Consumer 0% Other 1% Const & Land 20% Resi 11% CRE 44% C&I 21% Consumer 3% Other 1% Demand 23% NOW & Other Trans 2% MMDA & Savings 16% Time > $100K 37% Time < $100K 22% Demand 27% NOW & Other Trans 3% MMDA & Savings 56% Time > $100K 6% Time < $100K 8% |
|
|
10 Transaction Summary Enhances Eagle footprint in high growth Northern Virginia market Additional Virginia branches Pro forma number 12 ranked deposit market share in Northern Virginia Pro forma number 10 ranked deposit market share in Washington, D.C. metro area Demonstrated quality loan growth is consistent with strategic objectives Financially accretive to Eagle ~4.8% accretive to 2015 EPS1 Tangible book value dilution with expected earn-back within four years Maintain “well capitalized” regulatory ratios Pro Forma Leverage: 10.0% Pro Forma Tier 1 Risk-Based: 10.1% Pro Forma Total Risk-Based: 11.0%2 Low-risk transaction In-market acquisition with identified cost savings Familiarity with culture and location of new branches Consistent high quality underwriting from Virginia Heritage Bank leading to strong credit Note 1: Includes impact of subordinated debt issuance Note 2: Total risk-based ratio excludes the impact of subordinated debt issuance |
|
|
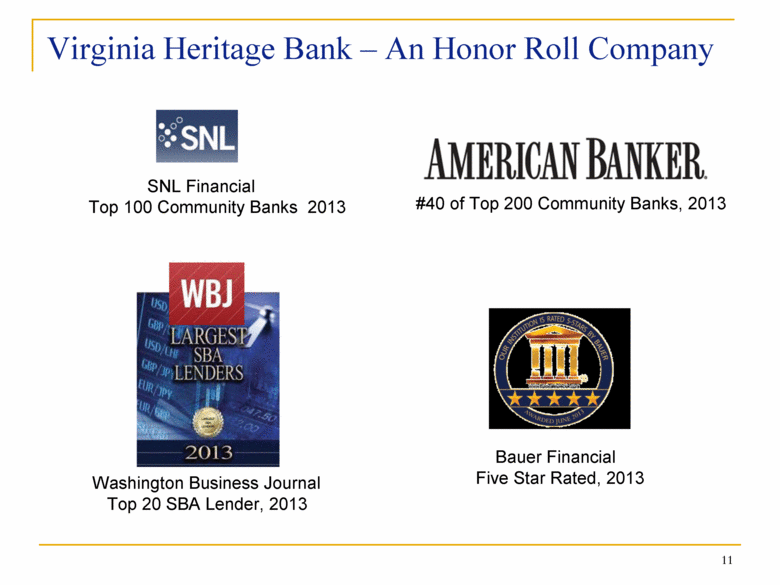
11 SNL Financial Top 100 Community Banks 2013 Washington Business Journal Top 20 SBA Lender, 2013 #40 of Top 200 Community Banks, 2013 Bauer Financial Five Star Rated, 2013 Virginia Heritage Bank – An Honor Roll Company |