Attached files
| file | filename |
|---|---|
| 8-K - FORM 8-K - UNIFI INC | ufi20140602_8k.htm |
Exhibit 99.1

Discussion Reference Materials for Private Investor Meetings June 3, 2014
Third Quarter Press Release and Financials April 23, 2014

|
For more information, contact: James M. Otterberg Chief Financial Officer (336) 316-5424
|
Unifi Announces Third Quarter 2014 Results;
Board Authorizes Additional Repurchases of Common Stock
GREENSBORO, N.C., April 23, 2014 – Unifi, Inc. (NYSE: UFI) today released preliminary operating results for the third quarter ended March 30, 2014 of its 2014 fiscal year. Net income for the March 2014 quarter was $4.7 million, or $0.25 per basic share, compared to net income of $1.4 million, or $0.07 per basic share, for the prior year quarter, reflecting improved operating results in the Company’s domestic business and lower domestic depreciation expenses. These gains were partially offset by lower earnings from the Company’s equity affiliates and higher domestic income tax expense.
Highlights for the March 2014 quarter included:
|
● |
Adjusted EBITDA improved to $12.6 million for the current quarter from $8.4 million for the prior year quarter; |
|
● |
Income before income taxes increased to $8.9 million for the current quarter from $3.7 million for the prior year quarter, while equity in earnings of unconsolidated affiliates decreased $1.2 million; |
|
● |
The Company entered into a Fourth Amendment to its Credit Agreement for its existing revolving credit facility and term loan, which increased the term loan by $18 million to a total of $68 million and extended the maturity date of the facility from May 24, 2018 to March 28, 2019; and |
|
● |
The Company completed its previously authorized $50 million stock repurchase program that commenced in January 2013, through which it retired 2.3 million shares. |
Net sales increased $8.6 million, or 5.1%, to $176.9 million for the March 2014 quarter compared to net sales of $168.3 million for the prior year quarter. Net sales for the current quarter were positively impacted by the timing of the holiday shutdown period compared to the prior quarter and greater contributions from the Company’s domestic premier and other value-added yarns, and were partially offset by currency translation rate changes for Brazil.
“The operating performance in our domestic business remained strong in the March quarter, both in our value-added product segments and commodity business,” said Roger Berrier, President and Chief Operating Officer of Unifi. “We also remain encouraged by the stability of synthetic apparel produced in the CAFTA region and by the growth during the March quarter. As brands and retailers continue to focus on this region for additional sourcing opportunities, we will continue to add incremental capacity.”
Cash-on-hand as of March 30, 2014 was $13.2 million, an increase of $4.4 million from June 30, 2013. Net debt at the end of the March 2014 quarter was $85.4 million, compared to $89.0 million at June 30, 2013. The Company had $62.7 million available under its revolving credit facility as of March 30, 2014, compared to $36.1 million as of June 30, 2013.
Net income was $20.1 million, or $1.05 per basic share, for the nine months ended March 30, 2014, compared to net income of $6.1 million, or $0.30 per basic share, for the prior year period, as gross profit margins increased during the current period as a result of the strength in the Company’s domestic business. Net sales decreased $7.0 million, or 1.4%, to $506.2 million for the current year-to-date period compared to net sales of $513.2 million for the prior year period, as increases to the Company’s domestic business were offset by declines in its international operations.
Subsequent to the quarter’s closing, the Board of Directors authorized a new program for the Company to repurchase up to an additional $50 million of common stock.
Bill Jasper, Chairman and CEO of Unifi, stated: "I am pleased with the operating results from our domestic operations in the March quarter and with our ability to improve the overall liquidity of the Company. The recent amendment to our Credit Agreement increases our borrowing capacity by $18 million, which we can use to fund our strategic initiatives, including possible growth oriented capital expenditures.” Mr. Jasper continued: “Our strong balance sheet, coupled with the Board’s decision to authorize the repurchase of up to an additional $50 million of stock, positions us to continue to maximize shareholder value as we conclude the 2014 fiscal year and enter into the next.”
CONDENSED CONSOLIDATED BALANCE SHEETS (Unaudited)
(amounts in thousands, except share and per share amounts)
|
March 30, 2014 |
June 30, 2013 |
|||||||
|
ASSETS |
||||||||
|
Cash and cash equivalents |
$ | 13,159 | $ | 8,755 | ||||
|
Receivables, net |
97,390 | 98,392 | ||||||
|
Inventories |
110,916 | 110,667 | ||||||
|
Income taxes receivable |
50 | 1,388 | ||||||
|
Deferred income taxes |
1,898 | 1,715 | ||||||
|
Other current assets |
5,254 | 5,913 | ||||||
|
Total current assets |
228,667 | 226,830 | ||||||
|
Property, plant and equipment, net |
118,708 | 115,164 | ||||||
|
Deferred income taxes |
2,459 | 2,196 | ||||||
|
Intangible assets, net |
7,867 | 7,772 | ||||||
|
Investments in unconsolidated affiliates |
98,430 | 93,261 | ||||||
|
Other non-current assets |
4,508 | 10,243 | ||||||
|
Total assets |
$ | 460,639 | $ | 455,466 | ||||
|
LIABILITIES AND SHAREHOLDERS’ EQUITY |
||||||||
|
Accounts payable |
$ | 53,276 | $ | 45,544 | ||||
|
Accrued expenses |
16,472 | 18,485 | ||||||
|
Income taxes payable |
1,550 | 851 | ||||||
|
Current portion of long-term debt |
4,905 | 65 | ||||||
|
Total current liabilities |
76,203 | 64,945 | ||||||
|
Long-term debt |
93,606 | 97,688 | ||||||
|
Other long-term liabilities |
7,379 | 5,053 | ||||||
|
Deferred income taxes |
2,231 | 1,300 | ||||||
|
Total liabilities |
179,419 | 168,986 | ||||||
|
Commitments and contingencies |
||||||||
|
Common stock, $0.10 par (500,000,000 shares authorized, 18,555,370 and 19,205,209 shares outstanding) |
1,855 | 1,921 | ||||||
|
Capital in excess of par value |
42,280 | 36,375 | ||||||
|
Retained earnings |
242,142 | 252,112 | ||||||
|
Accumulated other comprehensive loss |
(6,679 | ) | (5,500 | ) | ||||
|
Total Unifi, Inc. shareholders’ equity |
279,598 | 284,908 | ||||||
|
Non-controlling interest |
1,622 | 1,572 | ||||||
|
Total shareholders’ equity |
281,220 | 286,480 | ||||||
|
Total liabilities and shareholders’ equity |
$ | 460,639 | $ | 455,466 | ||||
CONDENSED CONSOLIDATED STATEMENTS OF INCOME (Unaudited)
(amounts in thousands, except per share amounts)
|
For the Three Months Ended |
For the Nine Months Ended |
|||||||||||||||
|
March 30, 2014 |
March 24, 2013 |
March 30, 2014 |
March 24, 2013 |
|||||||||||||
|
Net sales |
$ | 176,864 | $ | 168,249 | $ | 506,150 | $ | 513,220 | ||||||||
|
Cost of sales |
157,105 | 155,568 | 447,909 | 465,828 | ||||||||||||
|
Gross profit |
19,759 | 12,681 | 58,241 | 47,392 | ||||||||||||
|
Selling, general and administrative expenses |
12,290 | 11,262 | 33,895 | 33,941 | ||||||||||||
|
Provision for bad debts |
137 | 74 | 186 | 257 | ||||||||||||
|
Other operating expense, net |
1,239 | 712 | 4,008 | 1,873 | ||||||||||||
|
Operating income |
6,093 | 633 | 20,152 | 11,321 | ||||||||||||
|
Interest income |
(214 | ) | (240 | ) | (1,570 | ) | (508 | ) | ||||||||
|
Interest expense |
962 | 1,236 | 3,117 | 4,041 | ||||||||||||
|
Loss on extinguishment of debt |
— | 746 | — | 1,102 | ||||||||||||
|
Equity in earnings of unconsolidated affiliates |
(3,585 | ) | (4,783 | ) | (14,830 | ) | (6,712 | ) | ||||||||
|
Income before income taxes |
8,930 | 3,674 | 33,435 | 13,398 | ||||||||||||
|
Provision for income taxes |
4,476 | 2,510 | 14,151 | 7,959 | ||||||||||||
|
Net income including non-controlling interest |
4,454 | 1,164 | 19,284 | 5,439 | ||||||||||||
|
Less: net (loss) attributable to non-controlling interest |
(289 | ) | (235 | ) | (772 | ) | (680 | ) | ||||||||
|
Net income attributable to Unifi, Inc. |
$ | 4,743 | $ | 1,399 | $ | 20,056 | $ | 6,119 | ||||||||
|
Net income attributable to Unifi, Inc. per common share: |
||||||||||||||||
|
Basic |
$ | 0.25 | $ | 0.07 | $ | 1.05 | $ | 0.30 | ||||||||
|
Diluted |
$ | 0.24 | $ | 0.07 | $ | 1.01 | $ | 0.30 | ||||||||
CONDENSED CONSOLIDATED STATEMENTS OF CASH FLOWS (Unaudited)
(amounts in thousands)
|
For The Nine Months Ended |
||||||||
|
March 30, 2014 |
March 24, 2013 |
|||||||
|
Cash and cash equivalents at beginning of year |
$ | 8,755 | $ | 10,886 | ||||
|
Operating activities: |
||||||||
|
Net income including non-controlling interest |
19,284 | 5,439 | ||||||
|
Adjustments to reconcile net income including non-controlling interest to net cash provided by operating activities: |
||||||||
|
Equity in earnings of unconsolidated affiliates |
(14,830 | ) | (6,712 | ) | ||||
|
Dividends received from unconsolidated affiliates |
9,832 | 10,531 | ||||||
|
Depreciation and amortization expense |
13,290 | 19,263 | ||||||
|
Loss on extinguishment of debt |
— | 1,102 | ||||||
|
Non-cash compensation expense |
2,091 | 1,896 | ||||||
|
Excess tax benefit on stock-based compensation plans |
(3,553 | ) | — | |||||
|
Deferred income taxes |
417 | 4,703 | ||||||
|
Restructuring charges |
1,296 | — | ||||||
|
Other |
851 | 341 | ||||||
|
Changes in assets and liabilities, excluding effects of foreign currency adjustments: |
||||||||
|
Receivables, net |
537 | 2,094 | ||||||
|
Inventories |
(1,075 | ) | 4,460 | |||||
|
Other current assets and income taxes receivable |
2,344 | 607 | ||||||
|
Accounts payable and accrued expenses |
2,905 | 1,756 | ||||||
|
Income taxes payable |
4,268 | (470 | ) | |||||
|
Other non-current assets |
4,780 | (84 | ) | |||||
|
Net cash provided by operating activities |
42,437 | 44,926 | ||||||
|
Investing activities: |
||||||||
|
Capital expenditures |
(13,390 | ) | (4,522 | ) | ||||
|
Proceeds from sale of assets |
2,186 | 56 | ||||||
|
Proceeds from other investments |
428 | 592 | ||||||
|
Other investments |
— | (1,835 | ) | |||||
|
Other |
(188 | ) | (272 | ) | ||||
|
Net cash used in investing activities |
(10,964 | ) | (5,981 | ) | ||||
|
Financing activities: |
||||||||
|
Proceeds from revolving credit facility |
99,500 | 64,100 | ||||||
|
Payments on revolving credit facility |
(126,600 | ) | (63,800 | ) | ||||
|
Proceeds from term loan |
25,200 | — | ||||||
|
Payments on term loans |
— | (26,530 | ) | |||||
|
Payments of debt financing fees |
(3 | ) | (113 | ) | ||||
|
Proceeds from related party term loan |
— | 1,250 | ||||||
|
Common stock repurchased and retired under publicly announced program |
(30,715 | ) | (9,671 | ) | ||||
|
Common stock tendered to the Company for withholding tax obligations and retired |
(1,654 | ) | — | |||||
|
Proceeds from stock option exercises |
3,056 | 78 | ||||||
|
Contributions from non-controlling interest |
822 | 880 | ||||||
|
Excess tax benefit on stock-based compensation plans |
3,553 | — | ||||||
|
Other |
(152 | ) | (41 | ) | ||||
|
Net cash used in financing activities |
(26,993 | ) | (33,847 | ) | ||||
|
Effect of exchange rate changes on cash and cash equivalents |
(76 | ) | (83 | ) | ||||
|
Net increase in cash and cash equivalents |
4,404 | 5,015 | ||||||
|
Cash and cash equivalents at end of period |
$ | 13,159 | $ | 15,901 | ||||
RECONCILIATIONS OF NET INCOME ATTRIBUTABLE TO UNIFI, INC. TO ADJUSTED EBITDA (Unaudited)
(amounts in thousands)
The reconciliations of Net income attributable to Unifi, Inc. to EBITDA, Adjusted EBITDA including equity affiliates and Adjusted EBITDA are as follows:
|
For the Three Months Ended |
For the Nine Months Ended |
|||||||||||||||
|
March 30, 2014 |
March 24, 2013 |
March 30, 2014 |
March 24, 2013 |
|||||||||||||
|
Net income attributable to Unifi, Inc. |
$ | 4,743 | $ | 1,399 | $ | 20,056 | $ | 6,119 | ||||||||
|
Provision for income taxes |
4,476 | 2,510 | 14,151 | 7,959 | ||||||||||||
|
Interest expense, net |
748 | 996 | 1,547 | 3,533 | ||||||||||||
|
Depreciation and amortization expense |
4,525 | 6,087 | 12,874 | 18,718 | ||||||||||||
|
EBITDA |
14,492 | 10,992 | 48,628 | 36,329 | ||||||||||||
|
Non-cash compensation expense |
480 | 570 | 2,091 | 1,896 | ||||||||||||
|
Loss on extinguishment of debt |
— | 746 | — | 1,102 | ||||||||||||
|
Other |
1,203 | 845 | 3,749 | 1,736 | ||||||||||||
|
Adjusted EBITDA including equity affiliates |
16,175 | 13,153 | 54,468 | 41,063 | ||||||||||||
|
Equity in earnings of unconsolidated affiliates |
(3,585 | ) | (4,783 | ) | (14,830 | ) | (6,712 | ) | ||||||||
|
Adjusted EBITDA |
$ | 12,590 | $ | 8,370 | $ | 39,638 | $ | 34,351 | ||||||||

Third Quarter Conference Call Slide Presentation April 24, 2014

Cautionary Statement Certain statements included herein contain forward-looking statements within the meaning of federal securities laws about the financial condition and results of operations of Unifi, Inc. (the “Company”) that are based on management’s beliefs, assumptions and expectations about our future economic performance, considering the information currently available to management. The words “believe,” “may,” “could,” “will,” “should,” “would,” “anticipate,” “estimate,” “project,” “expect,” “intend,” “seek,” “strive,” and words of similar import, or the negative of such words, identify or signal the presence of forward-looking statements. These statements are not statements of historical fact; they involve risk and uncertainties that may cause our actual results, performance or financial condition to differ materially from the expectations of future results, performance or financial condition that we express or imply in any forward-looking statement. Factors that could contribute to such differences include, but are not limited to: the competitive nature of the textile industry and the impact of worldwide competition; changes in the trade regulatory environment and governmental policies and legislation; the availability, sourcing and pricing of raw materials; general domestic and international economic and industry conditions in markets where the Company competes, such as recession and other economic and political factors over which the Company has no control; changes in consumer spending, customer preferences, fashion trends and end-uses; the financial condition of the Company’s customers; the loss of a significant customer; the success of the Company’s strategic business initiatives; the continuity of the Company’s leadership; volatility of financial and credit markets; the ability to service indebtedness and fund capital expenditures and strategic initiatives; availability of and access to credit on reasonable terms; changes in currency exchange, interest and inflation rates; the ability to reduce production costs; the ability to protect intellectual property; employee relations; the impact of environmental, health and safety regulations; the operating performance of joint ventures and other equity investments; and the accurate financial reporting of information from equity method investees. All such factors are difficult to predict, contain uncertainties that may materially affect actual results and may be beyond our control. New factors emerge from time to time, and it is not possible for management to predict all such factors or to assess the impact of each such factor on the Company. Any forward-looking statement speaks only as of the date on which such statement is made, and we do not undertake any obligation to update any forward-looking statement to reflect events or circumstances after the date on which such statement is made, except as may be required by federal securities law. The above and other risks and uncertainties are described in the Company’s most recent annual report on Form 10-K, and additional risks or uncertainties may be described from time to time in other reports filed by the Company with the Securities and Exchange Commission pursuant to the Securities Exchange Act of 1934, as amended. 1

Net Sales and Gross Profit Highlights (Amounts in Thousands, Except Percentages) Quarter over Quarter Year over Year For the Three Months Ended For the Nine Months Ended March 30, 2014 vs. March 24, 2013 March 30, 2014 vs. March 24, 2013 Volume Price Volume Price Net Sales: Polyester 6.5% 1.3% (1.3%) 1.4% Nylon (2.3%) 5.5% (0.5%) 1.5% International 15.8% (16.2%) (0.4%) (7.3%) Consolidated 7.9% (2.8%) (1.0%) (0.4%) For the Three Months Ended For the Nine Months Ended March 30, 2014 March 24, 2013 March 30, 2014 March 24, 2013 Gross Profit: Polyester $11,013 $5,034 $31,170 $21,678 Nylon 5,041 3,681 14,493 11,767 International 3,705 3,966 12,578 13,947 Consolidated $19,759 $12,681 $58,241 $47,392 2

Income Statement Highlights (Amounts in Thousands, Except Percentages and Per Share Amounts) For the Three Months Ended March 30, 2014 March 24, 2013 Net sales $176,864 100.0% $168,249 100.0% Gross profit 19,759 11.2% 12,681 7.5% Selling, general and administrative expenses 12,290 6.9% 11,262 6.7% Operating income 6,093 3.4% 633 0.4% Interest expense, net 748 996 Equity in earnings of unconsolidated affiliates 3,585 4,783 Income before income taxes 8,930 3,674 Earnings per share (basic) $0.25 $0.07 Weighted average shares outstanding 18,825 20,082 3

Income Statement Highlights (Amounts in Thousands, Except Percentages and Per Share Amounts)
For the Nine Months Ended March 30, 2014 March 24, 2013 Net sales $506,150 100.0% $513,220 100.0% Gross profit 58,241 11.5% 47,392 9.2% Selling, general and administrative expenses 33,895 6.7% 33,941 6.6% Operating income 20,152 4.0% 11,321 2.2% Interest expense, net 1,547 3,533 Equity in earnings of unconsolidated affiliates 14,830 6,712 Income before income taxes 33,435 13,398 Earnings per share (basic) $1.05 $0.30 Weighted average shares outstanding 19,075 20,091 4

Equity Affiliates Highlights (Amounts in thousands, Except Percentages) For the Three Months Ended For the Nine Months Ended March 30, 2014 March 24, 2013 March 30, 2014 March 24, 2013 Earnings: Parkdale America (34%) $3,230 $4,294 $13,949 $4,990 Other 355 489 881 1,722 Total $3,585 $4,783 $14,830 $6,712 Distributions: Parkdale America (34%) $6,023 $7,807 $8,582 $10,031 Other 750 - 1,250 500 Total $6,773 $7,807 $9,832 $10,531 5

Reconciliations of Net Income to Adjusted EBITDA (Amounts in Thousands) For the Three Months Ended For the Nine Months Ended March 30, 2014 March 24, 2013 March 30, 2014 March 24, 2013 Net income attributable to Unifi, Inc. $4,743 $1,399 $20,056 $6,119 Provision for income taxes 4,476 2,510 14,151 7,959 Interest expense, net 748 996 1,547 3,533 Depreciation and amortization expense 4,525 6,087 12,874 18,718 EBITDA 14,492 10,992 48,628 36,329 Non-cash compensation expense 480 570 2,091 1,896 Loss on extinguishment of debt - 746 - 1,102 Other 1,203 845 3,749 1,736 Adjusted EBITDA including equity affiliates 16,175 13,153 54,468 41,063 Equity in earnings of unconsolidated affiliates (3,585) (4,783) (14,830) (6,712) Adjusted EBITDA $12,590 $8,370 $39,638 $34,351 6
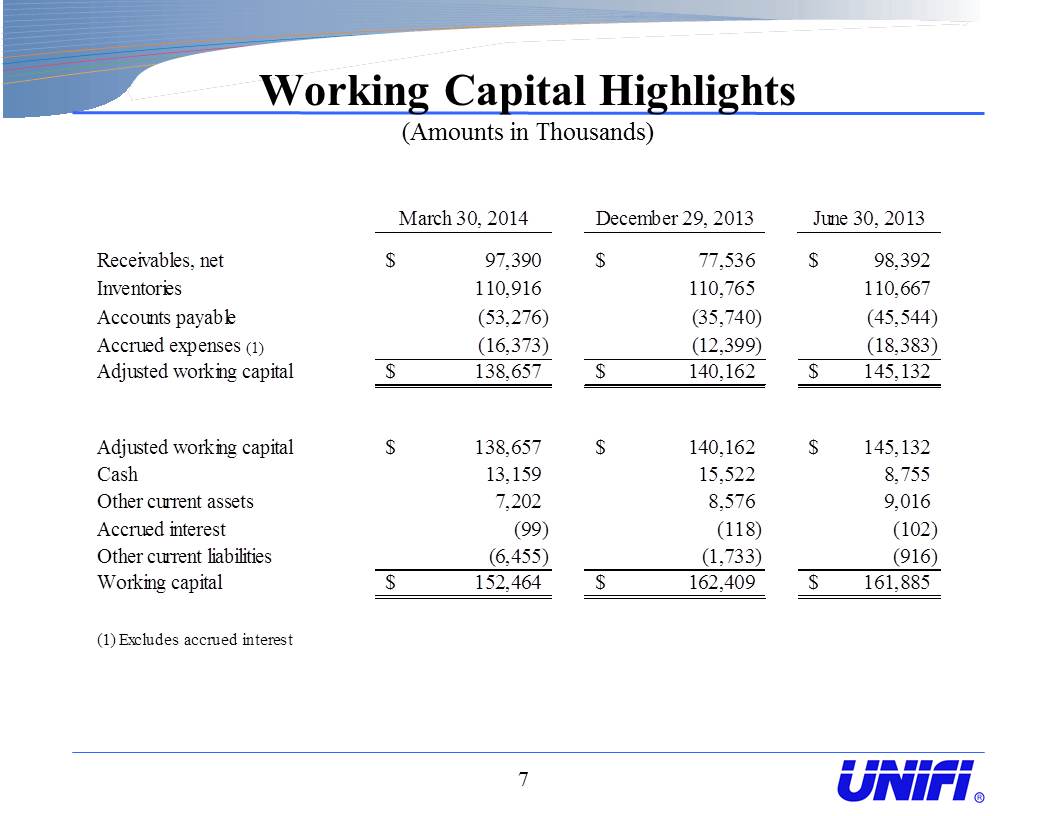
Working Capital Highlights (Amounts in Thousands) March 30, 2014 December 29, 2013 June 30, 2013 Receivables, net $97,390 $77,536 $98,392 Inventories 110,916 110,765 110,667 Accounts payable (53,276) (35,740) (45,544) Accrued expenses (1) (16,373) (12,399) (18,383) Adjusted working capital $138,657 $140,162 $145,132 Adjusted working capital $138,657 $140,162 $145,132 Cash 13,159 15,522 8,755 Other current assets 7,202 8,576 9,016 Accrued interest (99) (118) (102) Other current liabilities (6,455) (1,733) (916) Working capital $152,464 $162,409 $161,885 (1) Excludes accrued interest 7

Capital Structure (Amounts in Thousands) March 30, 2014 December 29, 2013 June 30, 2013 ABL Revolver $25,400 $50,400 $52,500 ABL Term Loan 68,000 50,000 42,800 Other 5,111 2,424 2,453 Total Debt $98,511 $102,824 $97,753 Cash 13,159 15,522 8,755 Net Debt $85,352 $87,302 $88,998 Cash $13,159 $15,522 $8,755 Revolver Availability, Net 62,740 28,083 36,105 Total Liquidity $75,899 $43,605 $44,860 8

Non-GAAP Financial Measures Certain non-GAAP financial measures included herein are designed to complement the financial information presented in accordance with generally accepted accounting principles in the United States of America ("GAAP") because management believes such measures are useful to investors. These non-GAAP financial measures are Earnings Before Interest, Taxes, Depreciation and Amortization (“EBITDA”), Adjusted EBITDA including equity affiliates, and Adjusted EBITDA. EBITDA represents net income or loss attributable to Unifi, Inc. before net interest expense, income tax expense, and depreciation and amortization expense. Adjusted EBITDA including equity affiliates represents EBITDA adjusted to exclude non-cash compensation expense, gains or losses on extinguishment of debt, loss on previously held equity interest, and certain other adjustments. Such other adjustments include operating expenses for Repreve Renewables, restructuring charges and start-up costs, gains or losses on sales or disposals of property, plant and equipment, currency and derivative gains or losses, certain employee healthcare expenses, and other operating or non-operating income or expense items necessary to understand and compare the underlying results of the Company. Adjusted EBITDA represents Adjusted EBITDA including equity affiliates adjusted to exclude equity in earnings and losses of unconsolidated affiliates. The Company may, from time to time, change the items included within Adjusted EBITDA. EBITDA, Adjusted EBITDA including equity affiliates and Adjusted EBITDA are alternative views of performance used by management, and we believe that investors’ understanding of our performance is enhanced by disclosing these performance measures. Management uses Adjusted EBITDA: (i) as a measurement of operating performance because it assists us in comparing our operating performance on a consistent basis, as it removes the impact of (a) items directly related to our asset base (primarily depreciation and amortization) and (b) items that we would not expect to occur as a part of our normal business on a regular basis; (ii) for planning purposes, including the preparation of our annual operating budget; (iii) as a valuation measure for evaluating our operating performance and our capacity to incur and service debt, fund capital expenditures and expand our business; and (iv) as one measure in determining the value of other acquisitions and dispositions. Adjusted EBITDA is also a key performance metric utilized in the determination of variable compensation. We believe that the use of EBITDA, Adjusted EBITDA including equity affiliates and Adjusted EBITDA as operating performance measures provides investors and analysts with a measure of operating results unaffected by differences in capital structures, capital investment cycles, and ages of related assets, among otherwise comparable companies. We also believe Adjusted EBITDA is an appropriate supplemental measure of debt service capacity, because cash expenditures on interest are, by definition, available to pay interest, and tax expense is inversely correlated to interest expense because tax expense decreases as deductible interest expense increases; and depreciation and amortization are non-cash charges. Equity in earnings and losses of unconsolidated affiliates is excluded because such earnings or losses do not reflect our operating performance. The other items excluded from Adjusted EBITDA are excluded in order to better reflect the performance of our continuing operations. 9

Non-GAAP Financial Measures - continued In evaluating EBITDA, Adjusted EBITDA including equity affiliates, and Adjusted EBITDA, you should be aware that in the future, we may incur expenses similar to the adjustments included herein. Our presentation of EBITDA, Adjusted EBITDA including equity affiliates and Adjusted EBITDA should not be construed as indicating that our future results will be unaffected by unusual or non-recurring items. EBITDA, Adjusted EBITDA including equity affiliates, and Adjusted EBITDA are not determined in accordance with GAAP and should not be considered as substitutes for net income, operating income or any other performance measures determined in accordance with GAAP or as an alternative to cash flow from operating activities as a measure of our liquidity. Each of our EBITDA, Adjusted EBITDA including equity affiliates, and Adjusted EBITDA measures has limitations as an analytical tool, and you should not consider it in isolation or as a substitute for analysis of our results as reported under GAAP. Some of these limitations are: it is not adjusted for all non-cash income or expense items that are reflected in our statements of cash flows; it does not reflect the impact of earnings or charges resulting from matters we consider not indicative of our ongoing operations; it does not reflect changes in, or cash requirements for, our working capital needs; it does not reflect the cash requirements necessary to make payments on our debt; it does not reflect our future requirements for capital expenditures or contractual commitments; it does not reflect limitations on or costs related to transferring earnings from our subsidiaries to us; and other companies in our industry may calculate this measure differently than we do, limiting its usefulness as a comparative measure. Because of these limitations, EBITDA, Adjusted EBITDA including equity affiliates, and Adjusted EBITDA should not be considered as a measure of discretionary cash available to us to invest in the growth of our business or as a measure of cash that will be available to us to meet our obligations, including those under our outstanding debt obligations. You should compensate for these limitations by relying primarily on our GAAP results and using these measures only as supplemental information. 10

7th Annual Investor Update Meeting September 16, 2013

2 Company and Market Overview

Unifi, Inc. is a diversified manufacturer of multi-filament polyester and nylon yarns The Company’s product offerings include specialty and premier value-added yarns with enhanced performance characteristics The Company sells to other yarn manufacturers, knitters and weavers that produce fabric for the apparel, hosiery, furnishings, industrial and other end-use markets. 3 Unifi Overview Company Overview ___________________________ Adjusted EBITDA excludes earnings from Parkdale America LLC and other unconsolidated equity affiliates. Regional Syn. Apparel supply is based on calendar year, and Unifi Adjusted EBITDA is based on Fiscal Year. 34% investment in Parkdale America LLC A $800 Million cotton spinning joint venture Strategic investment in Nylon spinning operations U.S. and Israeli joint ventures Valuable Equity Affiliate Partnerships Well-established downstream partners Regional Syn. Apparel Share and Adjusted EBITDA Trends

4 Our Manufacturing Process PET and rPET* Chip POY Manufacturing Yarn Texturing Value-Added Processes – Dyeing, Covering, Twisting, Beaming, Solution and Package Dyed

5 Manufacturing & Office Sales Office Joint Venture Consolidated Sales by Asset Location ($714 million FY 2013) Who We Are Our assets are well-positioned to leverage regional and global growth in synthetics

Growing Global Textile Fibers Market 6 ___________________________ Source: PCI Fibers Global consumption of textile fibers grows based on population and affluence Global Textile Markets Approximately 180 billion pounds of textile fibers sold annually 3% to 4% annual growth in global textile fibers projected from 2012 to 2020 4% to 5% annual growth in global polyester fibers projected from 2012 to 2020 Polyester fibers’ growth in market share: 22% in 1990 and 53% in 2011 Superior functionality compared to commodity fibers like cotton Man-made fibers allow more acreage for food supply in countries like China 9%
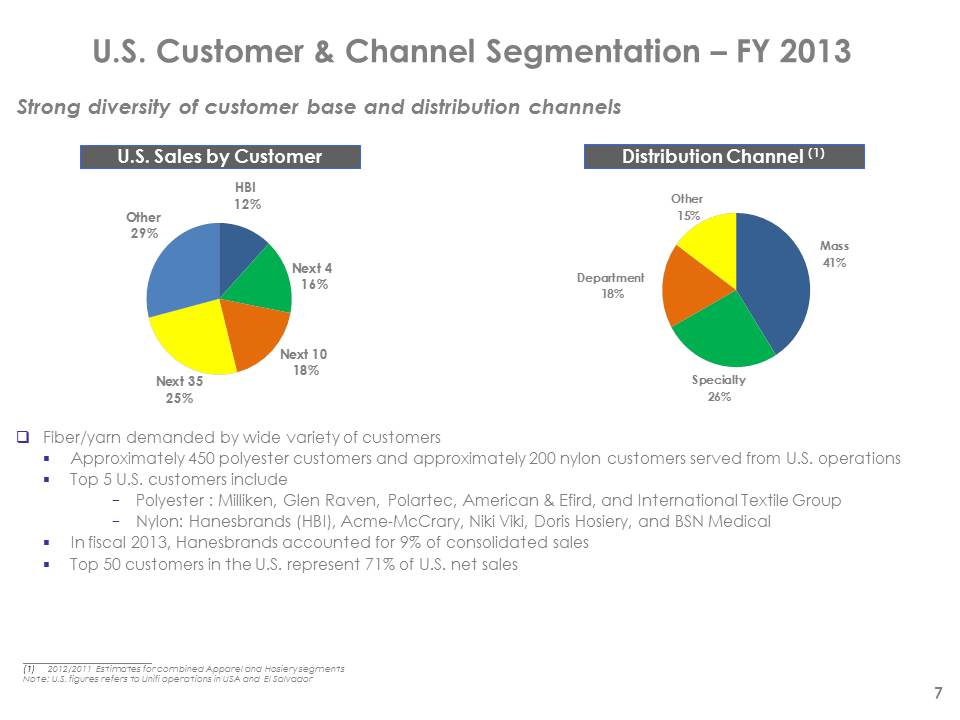
U.S. Customer & Channel Segmentation – FY 2013 ___________________________ 2012/2011 Estimates for combined Apparel and Hosiery segments Note: U.S. figures refers to Unifi operations in USA and El Salvador U.S. Sales by Customer 7 Strong diversity of customer base and distribution channels Distribution Channel (1) Fiber/yarn demanded by wide variety of customers Approximately 450 polyester customers and approximately 200 nylon customers served from U.S. operations Top 5 U.S. customers include Polyester : Milliken, Glen Raven, Polartec, American & Efird, and International Textile Group Nylon: Hanesbrands (HBI), Acme-McCrary, Niki Viki, Doris Hosiery, and BSN Medical In fiscal 2013, Hanesbrands accounted for 9% of consolidated sales Top 50 customers in the U.S. represent 71% of U.S. net sales
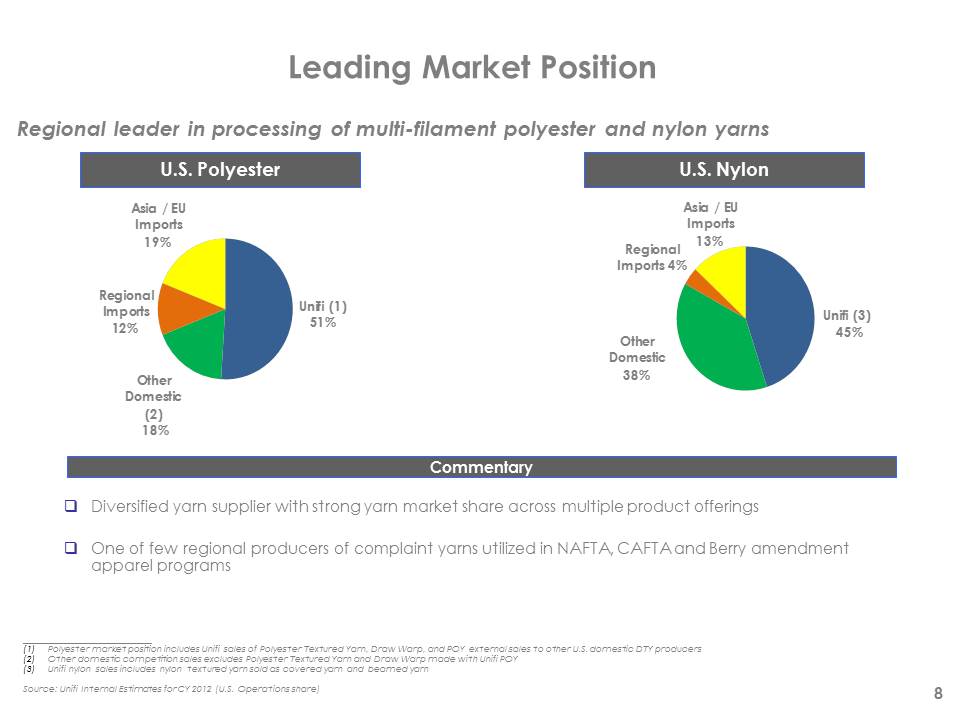
Leading Market Position ___________________________ Polyester market position includes Unifi sales of Polyester Textured Yarn, Draw Warp, and POY external sales to other U.S. domestic DTY producers Other domestic competition sales excludes Polyester Textured Yarn and Draw Warp made with Unifi POY Unifi nylon sales includes nylon textured yarn sold as covered yarn and beamed yarn Source: Unifi Internal Estimates for CY 2012 (U.S. Operations share) U.S. Polyester 8 Regional leader in processing of multi-filament polyester and nylon yarns U.S. Nylon Diversified yarn supplier with strong yarn market share across multiple product offerings One of few regional producers of complaint yarns utilized in NAFTA, CAFTA and Berry amendment apparel programs Commentary

U.S. Market Segmentation – FY 2013 Diverse product offering sells into the apparel, hosiery, industrial, furnishings, and automotive markets Compliant yarn sales account for approximately 64% of the Company’s U.S. sales Large majority of U.S. customers are domestic weavers and knitters Most free trade benefits come through domestic customers’ shipments of fabrics into region Regional yarn origin required in free trade agreements (NAFTA, CAFTA, Colombia/Peru FTAs) Berry and Kissel Amendments require U.S. origin fiber/yarn for Military and Homeland Security U.S. Sales by Origin Requirement ___________________________ (1) Compliant sales represent those sales to customers who utilize the terms of the NAFTA, CAFTA, CBI, Colombia/Peru FTA, and U.S. Military agreements to produce duty-free finished goods and U.S. origin fiber requirement. Estimates based on FY 2013 sales by category and division. U.S. Yarn Sales by Segment Commentary 9 Diverse end-use markets with high concentration of compliant yarns

U.S. Synthetic Apparel Sourcing Trends Regional: Units grew 7% and 5% in ‘11 and ‘12; expected to grow 5% to 7% in ‘13 ___________________________ Source: Internal Estimates, Federal Reserve, OTEXA, and Census Bureau Supply Share by Region 10

Business Strategy 11

Our Business Strategy 12 Drive financial improvement to our core business through a rigorous and disciplined improvement process Manufacturing excellence (Lean, SPC) Rigorous price analysis and management Enrich our product mix by aggressively growing our Premier Value Added products and increasing our market share of compliant yarns Enhance our existing business through investment in growth opportunities, including, Increasing our yarn sales in global growth markets, such as Central America, Brazil, and China Strategic growth opportunities related to our core business Derive value from sustainability based initiatives, including polyester and nylon recycling Repreve Renewables Use excess cash to enhance shareholder value through strategic growth opportunities and share repurchases

Repreve Renewables 13

14 Repreve Renewables Exclusive License of Proprietary Miscanthuss X Giganteus variety Developed by Mississippi State University as dedicated energy crop for the SE US Desirable Biomass Feedstock High Yields per Acre - up to 20+ tons/ a High Energy Content - 15.5 mm btu / ton Low Moisture Content at Harvest: 10-15% High Rates of Carbon Sequestration High Efficient Operations Perennial Grass: Long Stand Life Minimal nutrient supplement requirements Heat and drought resistance Sterile and Non-Invasive Requires vegetative propagation

Repreve Renewables Status Still a “Start-up” Commercial scale planting process developed 1-4 year yields meeting expectations Viable commercial sales models developed Short Term Plan (next year) Aggressively sell into markets available to us today Bio Bedding Chemtex Bio-fuels Confirm viable sales models Prove planting efficiency and yield at commercial scale Long Term Plan Define sustainable competitive advantages in all target markets Develop and execute business plans in appropriate markets 15

PVA - Premier Value Added Products 16

Global PVA Sales Revenue by Fiscal Year PVA portfolio represented approximately 20% of consolidated sales in fiscal 2013 Products utilized in apparel, contract, home furnishings, military, socks and hospitality Steady investment in R&D and commercialization of PVA products remains a strategic priority Premier Value-Added products are key for future growth Branded/PVA Product Success ___________________________ Source: Unifi internal estimates 17

Our PVA Brands 18 Touch & Texture Performance Sustainability

Made from recycled materials; including post-consumer plastic bottles & post-industrial fiber waste Product Transparency & Authenticity SCS Certified for recycled content claims; Oeko-Tex certified Program provides transparency throughout the supply chain with Unifi’s unique & proprietary Fiberprint™ Technology Consistent Quality; Drop-in replacement Reputation Available Globally One brand; many product options Filament Polyester & Nylon, Staple Polyester Filament Performance Products; REPREVE Solution Dye, FR, Package Dyed, Moisture Management, etc. PCR Chip 19
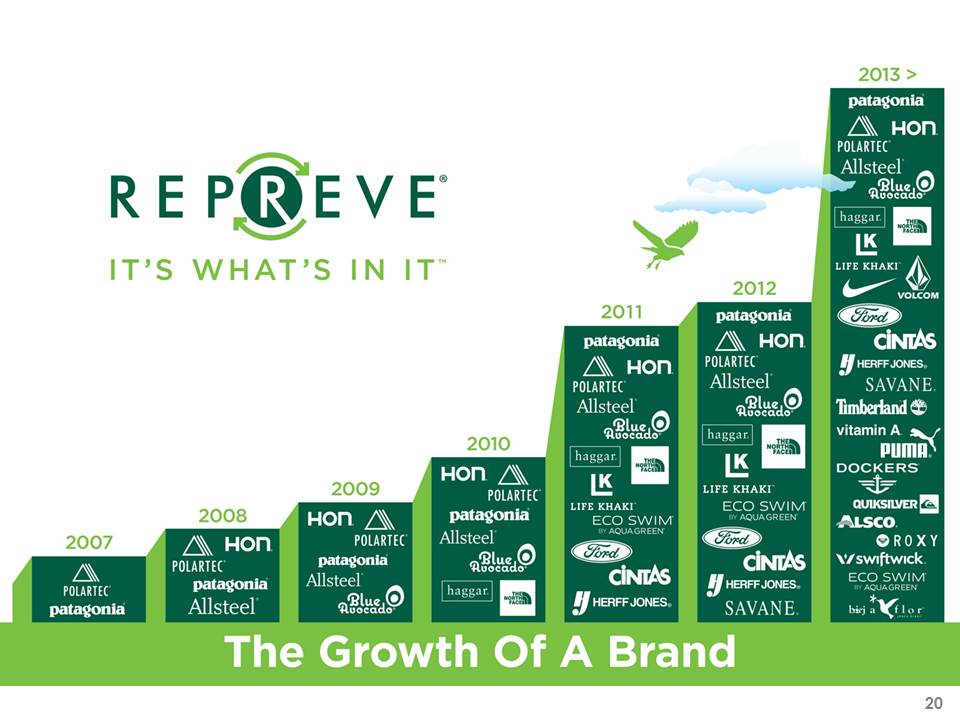
Repreve It's what's in it The Growth of A Brand 20

Financial Overview (as presented during the 7th Annual Investor Update Meeting on September 16, 2013) 21

Liquidity and Debt Highlights 22 U.S. $85mm interest rate swap; declines $5mm per qtr.; until reaches $50mm in May 2015 LIBOR is fixed at 1.06%; hedge terminates in May 2017 (Amounts in millions, except percentages) June 2010 June 2011 June 2012 June 2013 Cash $43 $27 $11 $9 Revolver Availability, net 74 52 38 36 Total Liquidity $117 $79 $49 $45 2014 Notes Payable (11.5%) $179 $134 $- $- Revolving Credit Facility - 35 - - ABL Revolver - - 51 53 ABL Term - - 50 43 Term B Loan - - 21 - Other 1 0 0 2 Total Debt $179 $169 $122 $98 Less: Cash (43) (27) (11) (9) Net Debt $137 $141 $111 $89 YTD weighted average interest rate 11.4% 10.8% 9.3% 3.9%

Cash Generation Trends 4 Year FY 2014 ($ in millions) FY 2010 FY 2011 FY 2012 FY 2013 Average Estimate Adjusted EBITDA $55 $60 $40 $53 $52 $55 Capital expenditures (13) (21) (6) (9) (13) (17) Cash interest payments (21) (19) (17) (4) (15) (3) Cash taxes (9) (7) (4) (8) (7) (18) EBITDA cash generation $13 $13 $13 $32 $17 $17 Distributions from Equity Affiliates 3 6 11 15 9 11 Total cash generation $16 $19 $23 $47 $26 $28 23 ___________________________ FY 2014 Estimate based on management’s estimates of: adjusted EBITDA based on range communicated during the Company’s July 25, 2013 Earnings Conference Call; future annual capital expenditures (as disclosed in Form 10-k for the fiscal year ended June 30th, 2013); cash interest payments based on a weighted average interest rate of 3.4% and outstanding debt obligations of $100 mm; cash taxes; and distributions from unconsolidated equity affiliates. Cash Generation Trends

Unifi, Inc. - Adjusted EBITDA Reconciliation 24 (Dollars in thousands) FY 2010 FY 2011 FY 2012 FY 2013 Net income attributable to Unifi $10,685 $25,089 $11,491 $16,635 Interest expense, net 18,764 16,679 14,152 3,791 Provision (benefit) for income taxes 7,686 7,333 (1,979) 13,344 Depreciation and amortization expense 26,312 25,562 26,225 23,860 EBITDA $63,447 $74,663 $49,889 $57,630 Loss (gain) on extinguishment of debt (54) 3,337 3,203 1,102 Loss on previously held equity affiliate - - 3,656 - Non-cash compensation costs, net 2,555 1,361 2,382 2,287 Other 1,001 5,451 410 3,075 Adjusted EBITDA including equity affiliates $66,949 $84,812 $59,540 $64,094 Equity in earnings of unconsolidated affiliates (11,693) (24,352) (19,740) (11,444) Adjusted EBITDA $55,256 $60,460 $39,800 $52,650

25