Attached files
| file | filename |
|---|---|
| 8-K - CURRENT REPORT OF MATERIAL EVENTS OR CORPORATE CHANGES - Howard Hughes Corp | a14-14541_18k.htm |
Exhibit 99.1
|
|
The Howard Hughes Corporation – REITWeek Presentation June 3, 2014 |
|
|
The Howard Hughes Corporation (“HHC”) cautions that statements in this presentation that are forward-looking and provide other than historical information involve risks and uncertainties that may impact actual results and any future performance suggested by the forward-looking statements. The forward-looking statements in this presentation include statements relating to our anticipated financial and operating performance, our expectations regarding the real estate industry and the economy generally and our plans for development of our assets. These forward-looking statements are based on current management expectations and involve a number of risks and uncertainties, including, among other things, changes in the economic environment, particularly in the regions in which we operate, our ability to continue financing our investments in our properties, changes in our assumptions, including assumed rents, capitalization and development costs, and other changes in demand for our properties. If one or more of these or other risks materialize, actual results may vary materially from those expressed. For a more complete discussion of these and other risk factors, please see HHC’s filings with the Securities and Exchange Commission, including its annual report on Form 10-K and subsequent quarterly reports on Form 10-Q. HHC cautions not to place undue reliance on these forward-looking statements, which speak only as of the date hereof, and undertakes no obligation to update or revise any forward-looking statements, except to the extent required by applicable law. In this presentation, we use non-GAAP financial measures, including Real Estate Property Earnings Before Taxes (“REP EBT”), Operating Assets Net Operating Income (“NOI”), net debt, and MPC net contribution. Please see pages 19-22 for non-GAAP reconciliations. Disclaimer and Safe Harbor Statement 1 |
|
|
The Howard Hughes Corporation Company overview HHC’s mission is to be the preeminent real estate developer and operator of master planned communities and mixed use properties across the United States. HHC owns a diversified and significantly undervalued portfolio of marquee assets spanning 16 states. Three core business segments: Master planned communities. Operating assets. Strategic developments. Potential to create significant incremental value from existing portfolio of assets. Legacy of under-managed assets from financial crisis. Alignment of incentives allows management to focus on long-term stewardship versus short term gains. CEO, President, CFO collectively invested $20 million in cash in the form of warrants and common equity. Management warrants are restricted until November 2016. World-class Board of Directors actively engaged in oversight of the business. Premier portfolio in geographically diverse markets 2 Master Planned Communities Operating Assets Strategic Developments Breakdown by segment (As of 3/31/2014) TTM revenue Total assets by segment The Woodlands The Shops at Summerlin Bridgeland South Street Seaport Ward Centers Summerlin Columbia |
|
|
A distinguished legacy of more than six decades of real estate operations 3 1973 The vast Hughes empire becomes the Summa Corporation 1994 The Summa Corporation becomes The Howard Hughes Corporation 1996 Merges with The Rouse Company 2009 GGP files for bankruptcy 1950s Howard Hughes acquires land encompassing Summerlin MPC 2004 General Growth Properties acquires Rouse 2010 HHC tax-free spin-off from GGP $250 million raised via sale of warrants and common equity Pre-1990 1990’s 2000’s The “new” HHC begins 2011 Purchased remaining 47.5% of The Woodlands from JV partner 2012 Retired ~ 6 million warrants eliminating overhang of legacy shareholders 2013/2014 and beyond Average price per superpad acre sold at Summerlin increased 120.3% YOY to $520,000 and average price per detached finished lot at The Woodlands increased 90.8% YOY to $208,000 Commenced redevelopment of Pier 17 at South Street Seaport and construction at The Shops at Summerlin Sold-out and began construction on 206 unit condo tower at Ala Moana Center Launched public pre-sales on first two luxury towers at Ward Village on 2/1/2014 with deposits representing $609 million of gross sales revenue as of 5/1/2014 assuming all buyers close on their units Opened the Outlet Collection at Riverwalk over 99% leased in May 2014 Leased and completed approximately 430,000 square feet of Class A office within The Woodlands which will contribute over $12 million of incremental annual NOI Continued development of commercial properties at The Woodlands: ExxonMobil build-to-suit, Kiewit build-to-suit, Two Hughes Landing, One Lake’s Edge, Whole Foods anchored retail, Woodlands Resort & Conference Center, Creekside Village, Westin Waterway Hotel. |
|
|
David R. Weinreb Chief Executive Officer Grant Herlitz President Andrew C. Richardson Chief Financial Officer Executive officers are equity owners having purchased $20 million of warrants and common equity Deep commercial real estate experience throughout HHC senior management and Board of Directors Incentivized to deliver long-term stability and profitability as Management and Board have a 31% economic interest in the Company(1) 29 17 19 Key management team members have an average of 22 years of industry experience and provide critical local expertise. Peter F. Riley General Counsel 31 Christopher Curry Sr. Exec. VP, Development 21 David Striph Sr. VP, Hawaii 29 Paul Layne Exec. VP, MPCs 31 Seasoned senior management team with aligned incentives 4 John Simon Exec. VP, Strategic Planning 36 (1) Calculated on a fully-diluted basis assuming exercise of all warrants and options. Reuben Davidsohn Chief Administrative Officer 9 Andrew S. Zeitman VP, Capital Markets 12 William Ackman Chairman Adam Flatto Director Jeffrey Furber Director Gary Krow Director R. Scot Sellers Director Mary Ann Tighe Director Burton Tansky Director Steven Shepsman Director Allen Model Director David R. Weinreb Director Founder and CEO of Pershing Square Capital Management. Former Director of GGP from June 2009 to March 2010 and led its restructuring. President of The Georgetown Company, a privately-held real estate investment and development company. CEO of AEW Capital Management and Chairman of AEW Europe, which manage over $42 billion of real estate assets. (Years experience) President of Comdata Corp. and EVP of Ceridian from 1999 to 2007. President, CEO, and Director of GiftCertificates.com from 2008 until its sale in 2010. Co-Founder and Treasurer and Managing Director of Overseas Strategic Consulting. Member of Pershing Square’s advisory board. Served as CEO of Archstone, one of the world’s largest apartment companies, from 1997 through its sale in 2013. Developed, acquired and operated $40 billion of apartments communities across U.S. Executive Managing Director and Founder of New World Realty Advisors. Chair of the Official Committee of Equity Holders in the Chapter 11 proceedings of GGP. Former Non-Executive Chairman of The Neiman Marcus Group Inc. CEO and President of The Neiman Marcus Group Inc. from May 2004 to October 2010. CEO of CBRE’s New York Tri-State Region since 2002. Responsible for 77 million square feet of commercial transactions in New York region. CEO of The Howard Hughes Corporation. Spent 17 years as Chairman and CEO of TPMC Realty Corporation. Senior HHC Management Industry Directors Background |
|
|
Steady cash flow base combined with meaningful value creation opportunities 5 Net Operating Income Shops at Summerlin ONE Ala Moana Millennium Woodlands Phase II Two Hughes Landing Common ownership maximizes the real estate value in each of our business segments Successful developments translate into rapid increases in NOI, MPC Net Contribution and residential sales. Projects financed with non-recourse project debt and equity in the form of contributed land and cash. Opportunity for substantial value enhancement Strategic Developments Estimated completion of major developments 2013 2014E 2015E 2016E 3 Waterway Square One Hughes Landing Ward Centers Phase I condo delivery South Street Seaport Phase I Westin Waterway Hotel ExxonMobil Build-to-Suit Kiewit Build-to-Suit Hughes Landing Retail & Multifamily Columbia Regional Building (2) (2) Note: 2011 includes Woodlands MPC assuming 100% ownership. Adjusted to include add back of $5.6 million loss at South Street Seaport. Adjusted to include add back of $15.2 million loss at South Street Seaport due to Super Storm Sandy, $1.3 million loss at Riverwalk due to redevelopment and $10.1 million of incremental NOI from recently completed projects. (3) 3 Waterway Square opened in June 2013, One Hughes Landing opened September 19, 2013. ($ in millions) Substantial cash generated from residential lot sales to homebuilders and commercial land sales to developers. Meaningful growth upside from housing and economic rebound with entitlements representing over 62,000 remaining residential lots. Stability of Houston market blends well with significant upside of Las Vegas market. Steady cash flow stream to support existing operations, repay debt and fund development opportunities. Anticipated growth from redevelopment of key trophy assets such as South Street Seaport and Ward Centers. Positioned to benefit from continued development of MPCs, which limit competition within their areas. Valuable asset base generates substantial cash flow Consistent stream of operating income MPC Net Contribution Master Planned Communities Operating Assets Shops at Summerlin ONE Ala Moana Millennium Woodlands Phase II Two Hughes Landing Woodlands Resort Riverwalk (1) (2) (2) (3) |
|
|
Key investment highlights Premier portfolio of master planned communities Diverse collection of trophy MPC assets strategically located in Houston, Las Vegas and Columbia, MD. Housing market and macroeconomic conditions stabilized and improving significantly in each market. High-quality, geographically diverse income-producing real estate assets Mix of retail, office, multifamily and resort assets. Cash flow contribution increases as development and redevelopment projects are completed. Robust development pipeline with meaningful near-term opportunities Major projects underway: South Street Seaport, ONE Ala Moana, Hughes Landing, Shops at Summerlin. Developments about to begin: Ward Village, The Woodlands Commercial. Conservative capital structure with low leverage and staggered debt maturities Net debt / net book capitalization ratio of 19%. Experienced leadership with significant personal stake in Company Management and Board of Directors have 31% economic interest in HHC. (1) Key management team members have an average of 22 years of industry experience and provide critical local expertise. Strong sponsorship from Pershing Square Capital Management. 6 1 2 3 4 5 (1) Calculated on a fully-diluted basis, assuming exercise of all warrants and options. |
|
|
Premier portfolio of trophy master planned communities 7 Master planned community real estate overview Summerlin Bridgeland Source: 12/31/13 10-K. (1) Recorded impairment charges of $346 million for Summerlin South and $59 million for the Maryland MPCs in 2010. (2) Reflects the number of net developable acres of raw land and subdivided land parcels available for new development, but which we currently indend to hold. The Woodlands Large scale, long-term communities in proximity to major employment centers with integrated amenities, residential neighborhoods, commercial office space, retail shops and entertainment venues. Blend of residential and commercial land sales to third parties and opportunistic commercial development. Ability to control cash flow by calibrating pricing, timing and residential development spend. Auction process for lots and builder price participation within residential developments provide upside to already stable cash flows as housing recovery strengthens. 1 Columbia Remaining saleable acres Community Location Residential Commercial Total The Woodlands Houston, TX 28,400 $198 623 563 1,186 290 2,064 2022 Bridgeland Houston, TX 11,400 404 3,452 1,149 4,601 – 17,665 2036 Summerlin Las Vegas, NV 22,500 880 4,804 873 5,677 – 42,000 2039 Columbia Maryland 16,450 59 – 108 108 99 – 2022 Total 78,750 $1,541 8,879 2,693 11,572 389 61,729 Total gross acres Gross book value ($ mm) (1) Remaining saleable residential lots Projected community sell-out date Other acres (2) |
|
|
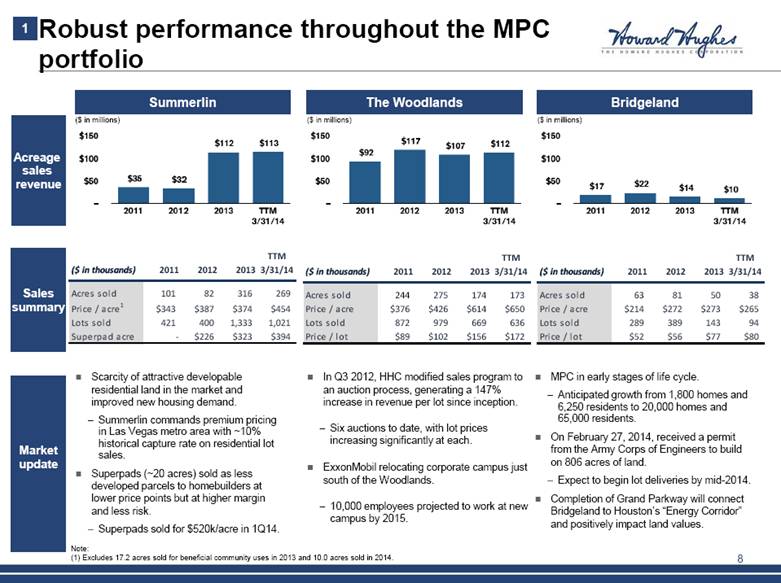
Robust performance throughout the MPC portfolio 8 Acreage sales revenue Market update Summerlin Scarcity of attractive developable residential land in the market and improved new housing demand. Summerlin commands premium pricing in Las Vegas metro area with ~10% historical capture rate on residential lot sales. Superpads (~20 acres) sold as less developed parcels to homebuilders at lower price points but at higher margin and less risk. Superpads sold for $520k/acre in 1Q14. ($ in millions) Sales summary 1 The Woodlands In Q3 2012, HHC modified sales program to an auction process, generating a 147% increase in revenue per lot since inception. Six auctions to date, with lot prices increasing significantly at each. ExxonMobil relocating corporate campus just south of the Woodlands. 10,000 employees projected to work at new campus by 2015. ($ in millions) Bridgeland MPC in early stages of life cycle. Anticipated growth from 1,800 homes and 6,250 residents to 20,000 homes and 65,000 residents. On February 27, 2014, received a permit from the Army Corps of Engineers to build on 806 acres of land. Expect to begin lot deliveries by mid-2014. Completion of Grand Parkway will connect Bridgeland to Houston’s “Energy Corridor” and positively impact land values. ($ in millions) Note: (1) Excludes 17.2 acres sold for beneficial community uses in 2013 and 10.0 acres sold in 2014. TTM ($ in thousands) 2011 2012 2013 3/31/14 Acres sold 244 275 174 173 Price / acre $376 $426 $614 $650 Lots sold 872 979 669 636 Price / lot $89 $102 $156 $172 TTM ($ in thousands) 2011 2012 2013 3/31/14 Acres sold 63 81 50 38 Price / acre $214 $272 $273 $265 Lots sold 289 389 143 94 Price / lot $52 $56 $77 $80 |
|
|
Improving fundamentals in our key MPC markets 9 Houston Las Vegas 1 First big metro to recover all jobs lost during the recession. Woodlands MPC – 1.5x the size of Manhattan. Bridgeland soon to be connected to Energy Corridor. Source: John Burns Real Estate Consulting. New homes sale activity projected to increase 23.5% per annum through 2016. Summerlin is the premier location in a land constrained market. Projected new home sales Projected new home sales Downtown Exxon Campus The Woodlands Bush Intercontinental Airport Hobby Airport 8 99 249 8 GRAND PARKWAY (FUTURE) SAM HOUSTON TOLLWAY HARDY TOLLWAY SAM HOUSTON TOLLWAY ENERGY CORRIDOR Bridgeland Memorial City Mall Galleria Greenspoint Greenway Plaza Texas Medical Center Reliant Stadium Minute Maid Park WELCOME CENTER 6 1960 Eldridge Pkwy West Rd. Huffmeister Barker-Cypress Rd. FM 529 Clay Rd. Fry Rd. Villages Currently Selling Villages Sold Out Future Villages Legend 19.3% CAGR 23.5% CAGR |
|
|
Operating assets: high-quality, geographically diverse cash flows 10 Segment overview Proven stable of high-quality, cash flow generating assets. HHC’s retail assets include 2.9 million total sq. ft. of leasable area. These diversified operating assets have the potential for future growth through redevelopment or repositioning. Synergies with MPC and Strategic Development segments. Control customer experience. 2 ($ in millions) Operating assets gross book value Operating assets NOI Note: Includes share of non-consolidated investment NOI and distributions from Summerlin Hospital. (1) NOI negatively impacted at South Street Seaport and Riverwalk Marketplace. NOI at South Street Seaport includes an approximate $(15.2) million negative impact from Superstorm Sandy. We expect substantially all the lost income from the storm will be covered by insurance. NOI also includes a $(1.3) million negative impact from vacating tenants for redevelopment from Riverwalk Marketplace. Construction began in Q2 2013 and was completed in Q2 2014 (2) Upon stabilization based on in-place rents. $16 million reflects incremental NOI to 2013 from 3 Waterway and One Hughes Landing. (1) Recently completed projects not fully reflected in NOI 3 Waterway Square 98% leased Estimated NOI(2): $6.5 million One Hughes Landing 98% leased Estimated NOI(2): $5.6 million |
|
|
Unlocking value at our strategic developments 11 3 Careful and active stewardship of our assets with rigorous evaluation of risk and economics ONE Ala Moana $240 million development with expected completion by end of 2014. 18-story tower above existing parking structure at Ala Moana Center in Honolulu. Sold out of all units at an average price ~$1,170 per sq. ft. Downtown Summerlin Phase I development with expected completion in 2014. 106-acre mixed use urban town center comprised of a fashion center, power center and class A office space. Ward Village 15-year master plan to transform 60 acres in Honolulu, HI into a world-class urban MPC. Fully entitled for 9.3mm total sq. ft. of mixed-use development. Approximately 4,000 condo units. Over 1 million sq. ft. of retail and commercial space. Launched public pre-sales in February 2014 on 482 condominium units. South Street Seaport Phase I redevelopment construction began in Q3 2013 and expected to be completed in 2016. The entire Seaport Phase I will comprise approximately 362K sq. ft. of GLA. Presented preliminary plans for a second project, which contemplates ~700K sq. ft. of additional space. The Woodlands Commercial Projects underway and recently completed include: 3 Waterway Square, 98% leased. One Hughes Landing, 98% leased. Two Hughes Landing, Hughes Landing Retail and Multifamily (One Lake’s Edge). ExxonMobil and Kiewit build-to-suits. Millennium Woodlands Phase II (314 units). The Woodlands Resort and Conference Center and Westin Waterway Hotel. Woodlands Resort & Conference Center Hughes Landing Waterway Square Hotel One Lake’s Edge |
|
|
The Woodlands commercial developments 12 Overview Strategy is to develop and hold commercial assets given the strong fundamentals with The Woodlands Town Center and Hughes Landing. Non-strategic commercial land located on fringes of The Woodlands will likely be sold over time. Existing Class A office space ~96% occupied. ExxonMobil relocation and strong Houston economy driven by the energy sector creating enormous demand for commercial space. Increasing land values provide “equity” to support continued commercial development. Historical NOI (1) Latest demand driver: ExxonMobil ($ in millions) Over 10,000 new direct jobs at ExxonMobil’s 385-acre campus just south of The Woodlands (1) NOI for 20/25 Waterway, Waterway Garage Retail, 3 & 4 Waterway, 1400 Woodloch Forest, 9303 New Trails, 2201 Lake Robbins Drive, Millennium Waterway Apartments, The Woodlands Resort & Conference Center, The Club at Carlton Woods and share of non-consolidated investment NOI related to The Woodlands. Current active project specifics Potential for over 6 million square feet of additional office space, 2,000 residential units, 3+ hotels and 2 condo towers. 3 Waterway and One Hughes Landing: ~98% leased 430K SF of Class A office completed in 2013. Hughes Landing developments under construction: ExxonMobil build-to-suit (650K SF), 2 Hughes Landing (200K SF office), Whole Foods anchored retail (122K SF) and One Lake’s Edge (390 multifamily units). Other developments under construction: Millennium Woodlands Phase II (314 multifamily units), Kiewit build-to-suit (95K SF), The Woodlands Resort and Conference Center ($75 million renovation and expansion) and Westin Waterway Hotel (301 keys). 3 Incremental stabilized NOI in completed projects 3 Waterway and One Hughes Landing |
|
|
Downtown Summerlin 13 Overview First phase of a 326-acre mixed use urban town center that will include retail, office, hotel and multi-family residential components incorporated with social, civic and cultural activities to create a vibrant downtown in Summerlin. ~$150 million infrastructure investment by HHC’s predecessor. The development, totaling approximately 1.6 million leasable square feet, will have three components. Fashion center – 1.1 million square feet with anchor stores to be built by Macy’s and Dillard’s. Power center – 283K square feet of power center space. Office – 202K square foot, eight-story class A office building. Pre-leasing with construction started in May 2013 and completion in Q4 2014. Select tenants The Shops at Summerlin Additional controlled land 3 |
|
|
Ward Centers / Ward Village 14 Overview Currently includes a 665,000 sq. ft. shopping district with seven specialty centers, ~140 unique shops, a variety of restaurants and an entertainment center, which generates $24 million of annual NOI. In October 2012, HHC announced plans to create a world-class urban MPC that will transform Ward Centers into Ward Village. 60 acres in Kaka’ako along Ala Moana Beach Park within one mile of Waikiki and downtown Honolulu. Ten minute walk from Ala Moana Center. 15-year master plan agreement with the Hawaii Community Development Authority fully entitled for 9.3mm sq. ft. of mixed-use development. Launched public pre-sales of our two Phase I market rate towers on February 1, 2014. As of May 1, 2014, we had received $55 million of buyer deposits, representing approximately $609 million of gross sales revenue assuming the buyers close on the units when completed. Repurposed 60,000 sq. ft. iconic IBM building into world class sales center for Ward Village master plan. Announced Whole Foods Market will open flagship store at Ward Village. 3 Why Honolulu? 4.1% unemployment rate. Median existing single-family home price of $738,000. Significant lack of housing supply – sold out of all 206 units at ONE Ala Moana at an average price ~$1,170 per sq. ft. Waikiki Ala Moana Kaka’ako Ward Village |
|
|
South Street Seaport 15 Overview Comprised of three mid-rise buildings and the Pier 17 pavilion shopping mall in historic waterfront district on Manhattan. Ranked 26th among the most visited sites around the world by Travel+Leisure with over 9 million people visiting annually. Received unanimous approval from NYC Council for Pier 17 redevelopment. Rooftop venue ideal for concerts, films and special events. Construction began in October 2013 and is expected to be completed in 2016. Current net book value of $41.0 million. (1) Excludes leasehold interest. (2) All available space (ground floor, lower level, upper level, mezzanine) of Major Retail Neighborhoods. (3) Available ground floor space of Selected Major Retail. Eastside Rent Madison Ave. $1,643 3rd Ave. $264 E. 86th (Lex–2nd) $384 Midtown Rent E 57th (5th Ave–Park) $1,000 5th Ave (42nd–49th) $1,029 5th Ave (49th–59th) $3,550 B’way & 7th Ave (42nd–47th) $2,407 Downtown Rent Meatpacking $339 Financial District $226 SoHo $890 West Village $524 Midtown South Rent 5th Ave (14th–23rd) $388 Broadway (14th–23rd) $392 34th St. (5th–7th Ave) $883 Source: Real Estate Board of New York, “Spring 2014 Retail Report”. Spring 2014 asking rents in prime retail locations(3) 3 Downtown retail leads Manhattan retail rent growth Source: Real Estate Board of New York, “Spring 2013 Retail Report”. |
|
|
Historical financial performance 16 Acreage sales revenue by MPC (1) Operating Assets NOI (2)(3) Development costs ($ in millions) ($ in millions) ($ in millions) (1) 2009-2011 include The Woodlands MPC assuming 100% ownership. (2) NOI negatively impacted at South Street Seaport and Riverwalk Marketplace. NOI at South Street Seaport includes an approximate $(15.2) million negative impact from Superstorm Sandy, of which $(5.6) is included in 2012. We expect substantially all the lost income from the storm will be covered by insurance. NOI also negatively impacted from vacating tenants for redevelopment from Riverwalk Marketplace. Construction began in Q2 2013. (3) Includes NOI of $17.9 million from recently completed projects. (4) Excludes provisions for impairment of $680 million in 2009 and $503 million in 2010. Operating income (4) ($ in millions) Real estate & property expenditures Land / residential development & acquisitions $422 $418 |
|
|
Key takeaways Premier portfolio of master planned communities High-quality, geographically diverse income-producing real estate assets Robust development pipeline with meaningful near-term opportunities Conservative capital structure with low leverage and staggered debt maturities Experienced leadership with significant personal stake in Company 17 1 2 3 4 5 |
|
|
Appendix 18 |
|
|
Financial reconciliations 19 Twelve months ended March 31, 2012 2013 2013 2014 2014 ($ in thousands) Reconciliation of segment revenue to REP EBT: MPC EBT 41,926 $ 8,786 $ 50,712 $ 91,937 $ 130,978 $ 23,271 $ 27,223 $ 134,930 $ Operating assets EBT 4,789 3,424 8,213 19,468 (2,551) 647 875 (2,323) Strategic development EBT 3,272 - 3,272 (1,700) 26,010 (941) 7,546 34,497 REP EBT 49,987 $ 12,210 $ 62,197 $ 109,705 $ 154,437 $ 22,977 $ 35,644 $ 167,104 $ Reconciliation of REP EBT to GAAP - Net Income: REP EBT 62,197 $ 109,705 $ 154,437 $ 22,977 $ 35,644 $ 167,104 $ Real estate affiliated REP EBT (12,210) (3,683) (14,428) - - (14,428) General and administrative (32,342) (36,548) (48,466) (11,171) (16,882) (54,177) Corporate interest income, net 8,595 10,153 (10,575) 2,710 (10,980) (24,265) Warrant liability gain (loss) 101,584 (185,017) (181,987) (33,027) (96,440) (245,400) Benefit (provision) for income taxes 18,325 (6,887) (9,570) (2,479) (4,773) (11,864) Reduction in tax indemnity receivable - (20,260) (1,206) (1,904) - 698 Equity in earnings from real estate affiliates 8,578 3,683 14,428 - - 14,428 Investment in real estate affiliate basis adjustment (6,053) - - - - - Other income - 2,125 25,869 - 8,075 33,944 Corporate depreciation (204) (814) (2,197) (276) (975) (2,896) Net income (loss) 148,470 $ (127,543) $ (73,695) $ (23,170) $ (86,331) $ (136,856) $ Reconciliation of MPC REP EBT to MPC net contribution: MPC REP EBT 50,712 $ 91,937 $ 130,978 $ 23,271 $ 27,223 $ 134,930 $ Plus: Cost of land-sales 82,672 89,298 124,040 25,699 23,078 121,419 Depreciation and amortization 26 72 32 7 100 125 Less: MPC land/residential development acquisitions expenditures 97,216 107,144 138,328 33,329 28,434 133,433 MPC net contribution 36,194 $ 74,163 $ 116,722 $ 15,648 $ 21,967 $ 123,041 $ Segment basis Consolidated properties Real estate affiliates Segment basis 2011 Year ended December 31, Three months ended March 31, Segment basis Segment basis Segment basis Segment basis |
|
|
Financial reconciliations (cont’d) 20 Twelve months ended March 31, ($ in thousands) 2011 2012 2013 2013 2014 2014 Reconciliation of total operating assets NOI to total operating assets REP EBT: Total operating assets NOI 55,121 $ 61,102 $ 51,233 $ 15,847 $ 14,771 $ 50,157 $ Equity method investment NOI (3,894) (2,783) (1,533) (263) (55) (1,325) Distribution from Summerlin Hospital (3,894) (2,376) (2,503) (2,503) (1,781) (1,781) Total operating assets NOI-consolidated 47,333 55,943 47,197 13,081 12,935 47,051 Straight-line lease and incentives amortization 918 (736) 1,759 (177) (436) 1,500 Early extinguishment of debt (11,305) - - - - - Demolition costs - - (2,078) - (2,494) (4,572) Depreciation and amortization (20,309) (23,318) (31,427) (6,118) (9,010) (34,319) Write-off of lease intangibles and other - - (2,884) (2,113) - (771) Equity in earnings from real estate affiliates 3,926 3,683 3,893 2,733 1,805 2,965 Interest expense, net (12,775) (16,104) (19,011) (6,759) (1,925) (14,177) Less: Partners' share of operating assets REP EBT 425 - - - - - Total operating assets Rep EBT 8,213 $ 19,468 $ (2,551) $ 647 $ 875 $ (2,323) $ Operating assets NOI-Equity and cost method investments: Millennium Waterway Apartments (Phase I & II) 2,571 $ 1,768 $ (74) $ - $ - $ (74) $ Summerlin Baseball Club - - (13) - (247) (260) Woodlands Sarofim #1 1,489 621 1,417 317 401 1,501 Stewart Title (title company) 1,069 1,876 2,515 399 198 2,314 Forest View/Timbermill Apartments 1,826 487 - - - - Total NOI-equity investees 6,955 $ 4,752 $ 3,845 $ 716 $ 352 $ 3,481 $ Adjustments to NOI (3,862) (1,476) (77) (33) (31) (75) Equity Method Investments REP EBT 3,093 $ 3,276 $ 3,767 $ 683 $ 321 $ 3,405 $ Less: Joint venture partner's share of REP EBT (3,061) (1,969) (2,377) (453) (297) (2,221) Equity in earnings (loss) from real estate affiliates 32 1,307 1,390 230 24 1,184 Distributions from Summerlin Hospital Investment 3,894 2,376 2,503 2,503 1,781 1,781 Segment equity in earnings (loss) from real estate affiliates 3,926 $ 3,683 $ 3,893 $ 2,733 $ 1,805 $ 2,965 $ Company's share of equity method investments NOI: Millennium Waterway Apartments (Phase I & II) 2,148 $ 1,477 $ - $ - $ - $ - $ Summerlin Baseball Club - - (7) - (124) (131) Woodlands Sarofim #1 298 124 283 63 80 300 Stewart Title (title company) 535 938 1,257 200 99 1,156 Forest View/Timbermill Apartments 913 244 - - - - Total NOI-equity investees 3,894 $ 2,783 $ 1,533 $ 263 $ 55 $ 1,325 $ Year ended December 31, Three months ended March 31, |
|
|
Financial reconciliations (cont’d) 21 March 31, ($ in thousands) 2011 2012 2013 2014 Reconciliation of Net debt to GAAP Total debt Mortgages, notes and loans payable 606,477 688,312 1,514,623 1,559,381 Total debt 606,477 688,312 1,514,623 1,559,381 Less: Cash and cash equivalents (227,566) (229,197) (894,948) (827,087) Net Debt 378,911 $ 459,115 $ 619,675 $ 732,294 $ Year ended December 31, |