Attached files
| file | filename |
|---|---|
| 8-K - 8-K - DIGITAL REALTY TRUST, INC. | d737283d8k.htm |
Exhibit 99.1
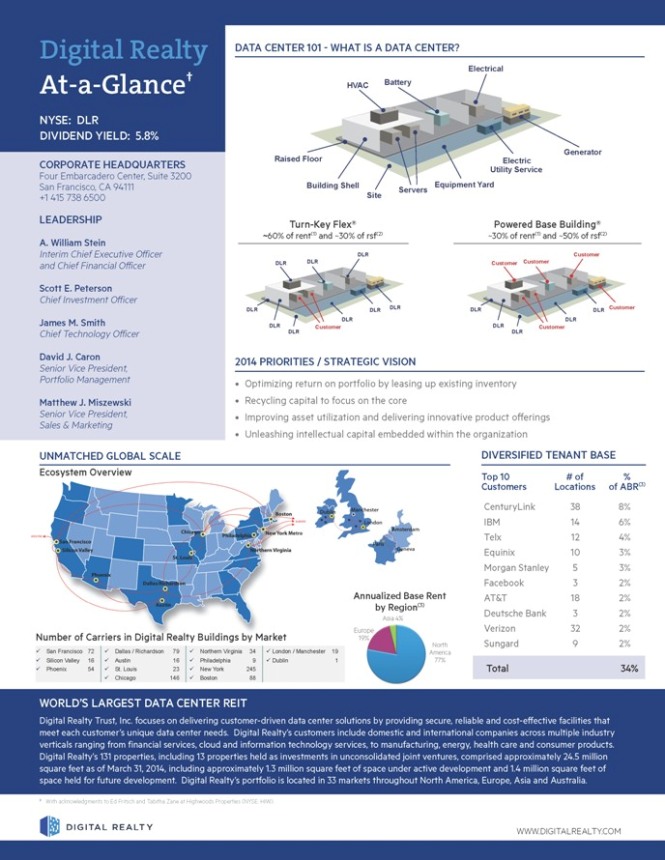
Digital Realty DATA CENTER 101 - WHAT IS A DATA CENTER? Electrical At-a-Glance† HVAC Battery NYSE: DLR DIVIDEND YIELD: 5.8% Generator Raised Floor Electric CORPORATE HEADQUARTERS Utility Service Four Embarcadero Center, Suite 3200 Equipment Yard San Francisco, CA 94111 Building Shell Servers +1 415 738 6500 Site LEADERSHIP Turn-Key Flex® Powered Base Building® ~60% of rent(1) and ~30% of rsf(2) ~30% of rent(1) and ~50% of rsf(2) A. William Stein Interim Chief Executive Officer DLR Customer and Chief Financial Officer DLR DLR Customer Customer Scott E. Peterson Chief Investment Officer DLR DLR DLR DLR DLR Customer James M. Smith DLR DLR DLR Customer DLR Customer Chief Technology Officer DLR DLR David J. Caron 2014 PRIORITIES / STRATEGIC VISION Senior Vice President, Portfolio Management Optimizing return on portfolio by leasing up existing inventory Matthew J. Miszewski Recycling capital to focus on the core Senior Vice President, Improving asset utilization and delivering innovative product offerings Sales & Marketing Unleashing intellectual capital embedded within the organization UNMATCHED GLOBAL SCALE DIVERSIFIED TENANT BASE Ecosystem Overview Top 10 # of % Customers Locations of ABR(3) CenturyLink 38 8% IBM 14 6% Telx 12 4% Equinix 10 3% Morgan Stanley 5 3% Facebook 3 2% Annualized Base Rent AT&T 18 2% by Region(3) Deutsche Bank 3 2% Asia 4% Europe Verizon 32 2% Number of Carriers in Digital Realty Buildings by Market 19% North Sungard 9 2% ü?? San Francisco 72 ü?? Dallas / Richardson 79 ü?? Northern Virginia 34 ü??London / Manchester 19 America ü?? Silicon Valley 16 ü?? Austin 16 ü?? Philadelphia 9 ü??Dublin 1 77% ü?? Phoenix 54 ü?? St. Louis 23 ü?? New York 245 Total 34% ü?? Chicago 146 ü?? Boston 88 WORLD’S LARGEST DATA CENTER REIT Digital Realty Trust, Inc. focuses on delivering customer-driven data center solutions by providing secure, reliable and cost-effective facilities that meet each customer’s unique data center needs. Digital Realty’s customers include domestic and international companies across multiple industry verticals ranging from financial services, cloud and information technology services, to manufacturing, energy, health care and consumer products. Digital Realty’s 131 properties, including 13 properties held as investments in unconsolidated joint ventures, comprised approximately 24.5 million square feet as of March 31, 2014, including approximately 1.3 million square feet of space under active development and 1.4 million square feet of space held for future development. Digital Realty’s portfolio is located in 33 markets throughout North America, Europe, Asia and Australia. † With acknowledgments to Ed Fritsch and Tabitha Zane at Highwoods Properties (NYSE: HIW). WWW.DIGITALREALTY.COM
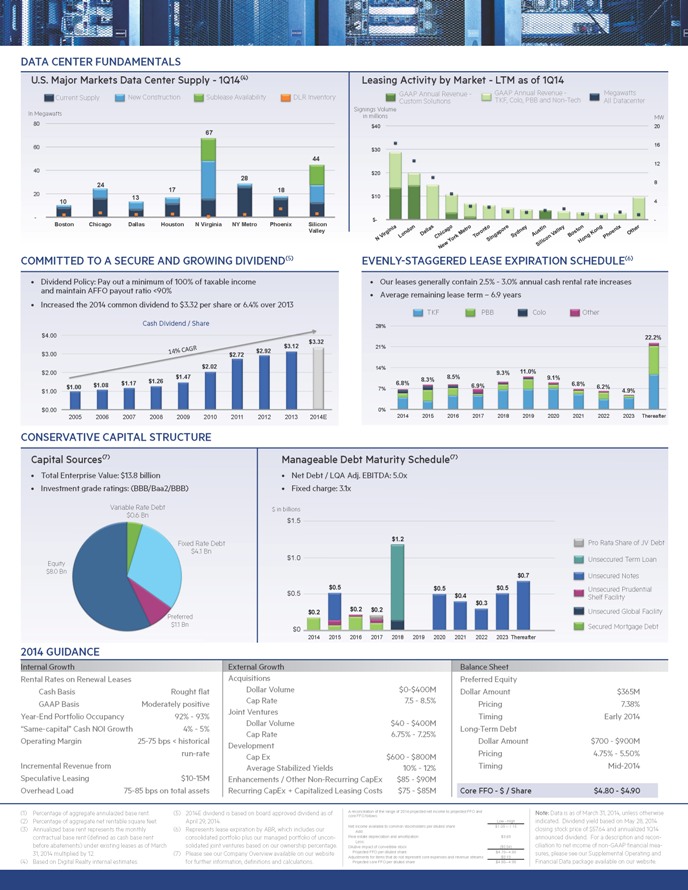
DATA CENTER FUNDAMENTALS U.S. Major Markets Data Center Supply - 1Q14(4) Leasing Activity by Market - LTM as of 1Q14 GAAP Annual Revenue - GAAP Annual Revenue - Megawatts Current Supply New Construction Sublease Availability DLR Inventory TKF, Colo, PBB and Non-Tech Custom Solutions All Datacenter Signings Volume In Megawatts in millions 80 MW 67 $40 20 60 $30 16 44 12 40 $20 28 24 8 17 18 20 $10 13 10 4 - $- - Boston Chicago Dallas Houston N Virginia NY Metro Phoenix Silicon Valley Metro alley Kong Other irginia Dallas oronto Sydney AustinV Boston V London Chicago T Phoenix N Y ork Singapore Hong New Silicon COMMITTED TO A SECURE AND GROWING DIVIDEND(5) EVENLY-STAGGERED LEASE EXPIRATION SCHEDULE(6) Dividend Policy: Pay out a minimum of 100% of taxable income Our leases generally contain 2.5% - 3.0% annual cash rental rate increases and maintain AFFO payout ratio <90% Average remaining lease term – 6.9 years Increased the 2014 common dividend to $3.32 per share or 6.4% over 2013 TKF PBB Colo Other Cash Dividend / Share 28% $4.00 22.2% CAGR 21% $3.00 14% 14% $2.00 8.5% 9.3% 11.0% 9.1% 8.3% $1.08 $1.17 6.8% 6.9% 6.8% $1.00 7% 6.2% $1.00 4.9% $0.00 0% 2005 2006 2007 2008 2009 2010 2011 2012 2013 2014E 2014 2015 2016 2017 2018 2019 2020 2021 2022 2023 Thereafter CONSERVATIVE CAPITAL STRUCTURE Capital Sources(7) Manageable Debt Maturity Schedule(7) Total Enterprise Value: $13.8 billion Net Debt / LQA Adj. EBITDA: 5.0x Investment grade ratings: (BBB/Baa2/BBB) Fixed charge: 3.1x Variable Rate Debt $ in billions $0.6 Bn $1.5 $1.2 Pro Rata Share of JV Debt Fixed Rate Debt $4.1 Bn $1.0 Unseccured Term Loan Equity $8.0 Bn $0.7 Unsecured Notes $0.5 $0.5 $0.5 Unsecured Prudential $0.5 $0.4 $0.3 Shelf Facility $0.2 $0.2 Unsecured Global Facility $0.2 Preferred $1.1 Bn Secured Mortgage Debt $0 2014 2015 2016 2017 2018 2019 2020 2021 2022 2023 Thereafter 2014 GUIDANCE Internal Growth External Growth Balance Sheet Rental Rates on Renewal Leases Acquisitions Preferred Equity Cash Basis Rought flat Dollar Volume $0-$400M Dollar Amount $365M GAAP Basis Moderately positive Cap Rate 7.5 - 8.5% Pricing 7.38% Joint Ventures Year-End Portfolio Occupancy 92% - 93% Timing Early 2014 Dollar Volume $40 - $400M “Same-capital” Cash NOI Growth 4% - 5% Long-Term Debt Cap Rate 6.75% - 7.25% Operating Margin 25-75 bps < historical Dollar Amount $700 - $900M run-rate Development Pricing 4.75% - 5.50% Cap Ex $600 - $800M Incremental Revenue from Average Stabilized Yields 10% - 12% Timing Mid-2014 Speculative Leasing $10-15M Enhancements / Other Non-Recurring CapEx $85 - $90M Overhead Load 75-85 bps on total assets Recurring CapEx + Capitalized Leasing Costs $75 - $85M Core FFO - $ / Share $4.80 - $4.90 (1) Percentage of aggregate annulaized base rent. (5) 2014E dividend is based on board approved dividend as of A core reconciliation FFO follows: of the range of 2014 projected net income to projected FFO and Note: Data is as of March 31, 2014, unless otherwise (2) Percentage of aggregate net rentable square feet. April 29, 2014. Low - High indicated. Dividend yield based on May 28, 2014 (3) Annualized base rent represents the monthly (6) Represents lease expiration by ABR, which includes our Net income available to common stockholders per diluted share $1.05 – 1.15 closing stock price of $57.64 and annualized 1Q14 Add: contractual base rent (defined as cash base rent consolidated portfolio plus our managed portfolio of uncon- Real estate depreciation and amortization $3.69 announced dividend. For a description and recon- Less: before abatements) under existing leases as of March solidated joint ventures based on our ownership percentage. Dilutive impact of convertible stock ($0.04) ciliation to net income of non-GAAP financial mea- 31, 2014 multiplied by 12. (7) Please see our Company Overview available on our website Projected FFO per diluted share $4.70– 4.80 sures, please see our Supplemental Operating and Adjustments for items that do not represent core expenses and revenue streams $0.10 (4) Based on Digital Realty internal estimates. for further information, definitions and calculations. Projected core FFO per diluted share $4.80– 4.90 Financial Data package available on our website.